Abstract
Nowadays, many kinds of colloidal photonic crystal (PC) sensors with inverse opal (IO) structures have been developed. However, there are few systematic studies on the factors influencing their recognition capability and responsiveness capability. In this paper, the relationships between recognition capability of IO structured PC sensors and all the parameters in Bragg–Snell’s law have been explored. In addition, research on the recognition ability of PC sensors typically focuses only on the refractive index difference between the identified substances. Herein, we define two concepts, namely the absolute refractive index difference and the relative refractive index difference, and prove that the recognition ability not only relies on the absolute refractive index between the identified substances, but also on the relative refractive index. Bragg–Snell’s law analysis confirms that the responsiveness capability is directly proportional to the void size of the IO structure, which is also confirmed by the finite difference time domain (FDTD) method. It is believed that these systematic studies have important guiding significance for creating advanced IO structured PC sensors.
1. Introduction
Photonic crystals (PCs) [1,2], a type of periodic structural materials, are formed by periodic arrangement of materials with different refractive indexes [3] and show great potential in controlling and manipulating the flow of light [4]. Therefore, PCs could be used as novel optical devices, such as reflective mode displays [5], optical filters [6], low-loss waveguides [7,8,9] and optical fibers [10,11,12]. To meet the strong demand for photonic materials with tunable optical properties, responsive PCs have been proposed [13]. These responsive PCs exhibit wide application prospects in the PC sensor field [14,15].
In the last few decades, PC sensors have shown significant development, especially colloidal PC sensors due to their unique advantages, such as a cost-effective bottom-up strategy [16,17,18] and easily manipulated structures [19,20,21]. Among all PC structures, inverse opal (IO) is one of the most popular research issues, as they benefit from their inherent characteristics of highly ordered pore structure. Once an external substance (e.g., solvents or vapors) infiltrates the inverse opal structure, it replaces the air in the pores, changing the refractive index and shifting the reflected wavelength in the system [22]. The wavelength shift is related to the refractive index of external substances, and it can be easily detected by a spectrometer. Moreover, if the reflected wavelength is located in the visible band and spans two or more color bands after the response, the PC sensor has the same functionanilty as a colorimetric sensor [23,24,25]. As a result, the sensitivity of PC sensors mainly depends on the wavelength response range. However, there are few systematic studies on the relationship between wavelength response range (Δλ) and IO structure, the refractive index contrast between PC materials and voids, or the refractive index contrast between PC materials and external substances.
In this paper, Bragg–Snell’s law was adopted to calculate the central reflection wavelength of five PC sensors composed of different materials before and after response, thus predicting the functional relationship between wavelength response range (Δλ) and refractive index contrast, including the refractive index contrast between PC materials and voids, and between PC materials and external substance. The functional relationship between wavelength response range and void size and void ratio of IO structures could be described by extracting the simulated reflectance spectra obtained via a finite difference time domain (FDTD) method. According to the functional relationship predicted by Bragg–Snell’s law, various types of IO structured PC sensors are suitable for identifying two external substances with a higher absolute difference of refractive index and smaller relative difference of refractive index. On the basis of the latter, as obtained by the FDTD method, PC sensors with higher sensitivity could be designed. It is believed that this work will provide great guidance for creating advanced PC sensor systems.
2. Result and Discussion
IO structured PC sensors are usually composed of matrix materials and voids with a close-packed face-centered cubic (FCC) structure. There are some general guidelines to fabricate IO structured sensors. The most widely used strategy is to fill the matrix material into the interstices of the colloidal PC template and then remove the colloidal PC arrays. Since the colloidal PC template is composed of tightly packed microspheres, the void ratio of IO structure is 74%, and the volume ratio of matrix materials is 26% in this system. Another method is to directly fabricate the composite PC film composed of colloidal PC arrays and matrix materials and then remove the PC arrays. Thus, the void ratio of the IO structure fabricated by this method can be precisely adjusted. Herein, we select IO structured sensors composed of different matrix materials and discuss the relationship between the performance of these sensors and the properties of the matrixes. Thus, the void ratio in these systems is 74%, and the volume ratio of matrix materials is 26%. The six chosen matrix materials are germanium (Ge) [26], TiO2 [27,28,29], SnO2 [30,31], carbon [32], WO3 [33] and poly(ethylene glycol) diacrylate (PEGDA). The parameters of the chosen matrixes and voids are listed in Table 1.

Table 1.
The parameters of the matrix materials.
According to Bragg–Snell’s law, the central reflected wavelength of the IO structured PC sensors can be estimated by Equation (1).
where m is diffraction order, λIO is the central reflected wavelength of IO structured PC sensors, ϕvoid is the void ratio, Dvoid means the void size and nvoids and nmatrix are the refractive indexes of voids and matrixes, respectively. The value of m is 1. The values of ϕvoid and nvoid are known to be 74% and 1.00, respectively. The refractive index is assumed to be constant in this discussion. The refractive index of Ge matrix is 4.39 (Table 1). Thus, the central reflected wavelength of the IO structure (λIO) based on Ge matrix can be plotted as a function of the void size (Dvoid), as shown in Figure 1.
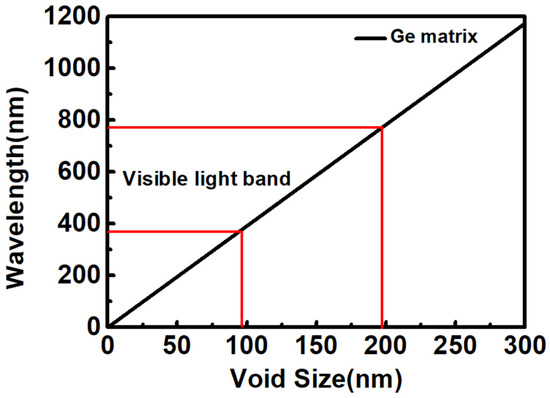
Figure 1.
Relationship between central reflection wavelength (λIO) of the IO structure (λIO) based on Ge matrix and void sizes (Dvoid) of the system.
Ge matrix-based PC sensors are used as colorimetric sensors; the range of central reflection wavelengths should be 380–780 nm [36,37] to ensure the PC sensors have distinct structural colors, indicating that the void size range of the Ge-based IO structure is between 97 and 200 nm (marked by red lines in Figure 1). The relationships between the central reflected wavelengths of the IO structures composed of other matrixes are exhibited in Figure S1 in Supplementary Materials. The void size ranges of IO structures are listed in Table S1 Supplementary Materials.
When external substances infiltrate the IO structured PC sensor, it is assumed that voids of the IO structure are filled and no swelling occurs in the system. The wavelength response range (Δλ) after response can be described by Equation (2).
where Δλ is the wavelength response range, ϕ is the volume fraction of the voids before response and the volume fraction of external substances after response, D means the average size of voids in the original IO structure and the average size of the external substances after response and ns, nmatrix and nvoids represent the refractive index of external substances, matrix and voids, respectively. The larger the value of Δλ, the stronger responsiveness and the higher sensitivity of the PC sensor.
The values of ϕ and nvoid are known to be 74% and 1.00, respectively. The values of nmatrix are listed in Table 1. As a result, the wavelength response range (ΔλGe) of the IO structure composed of Ge matrix can be described by Equation (3). The Equations that describe the wavelength response range of PC sensors constructed by other matrixes are given in Supporting Information Equations (S1)–(S5) in Supplementary Materials.
where ΔλGe is the wavelength response range of an IO structured PC sensor with Ge matrix, D means the void size in the original IO structure and the average size of the external substances after response, and ns represents the refractive index of external substances.
Equation (3) shows the relationship of wavelength response range (ΔλGe) between the refractive index of external substances (ns) and void size (D) in the original IO structure. Since PC sensors are used to identify different substances, it is important that the PC sensor shows different response capacities to different substances rather than having a wide response range for one substance. For an IO structured PC sensor with Ge matrix, the wavelength response range contrast (Δλcontrast) is described by Equation (4).
where Δλcontrast means the wavelength range contrast of the PC sensor response to external Substance 1 and Substance 2, D means the void size in the original IO structure and the average size of the external substances after response and ns1 and ns2 are the refractive indexes of external Substance 1 and Substance 2, respectively. The equations that express the wavelength range contrast (Δλcontrast) caused by two external substances in the IO structure composed of other matrixes have been given in Equations (S6)–(S10).
According to Figure 1, the void size range of the Ge-based system is between 97 nm to 200 nm. Therefore, the value of Dvoid can be temporarily set to 97 nm when discussing the relationship between the wavelength range contrast (Δλcontrast) and the refractive index difference between external Substance 1 and Substance 2. Here, the absolute difference in the refractive index of two substances is defined as Δns-a, which is equal to the absolute value of nS1 minus nS2. The relative difference between the refractive indices of Substance 1 and Substance 2 can be defined by Δnr in Equation (5).
Setting the absolute difference of refractive index (Δns-a) to 0.1, 0.05 and 0.03, respectively, the relationships between the wavelength range contrast (Δλcontrast) and relative difference of refractive indices (Δns-r) can be plotted in Figure 2.
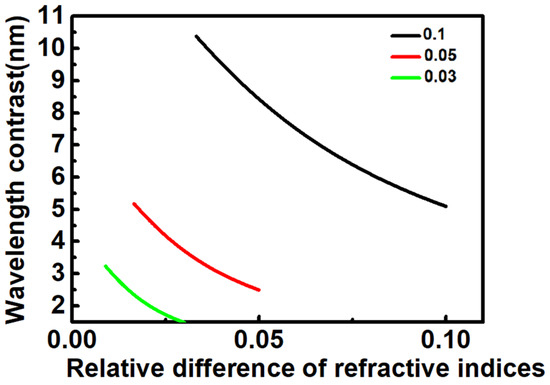
Figure 2.
The relationships between the wavelength range contrast (Δλcontrast) and relative difference of refractive indices (Δns-r).
Figure 2 shows that wavelength range contrast (Δλcontrast) decreases with the increase of the relative difference between the refractive indices (Δns-r) when the absolute difference of refractive indices is a constant (Δns-a). Moreover, when the absolute refractive index difference is constant, the larger the value of Δns-a, the greater the value of Δλcontrast. These results mean the ability of an IO structured PC sensor to distinguish two kinds of substances is not only related to their absolute difference of refractive index but also related to the relative difference of refractive index.
Setting the absolute difference of refractive index (Δns-a) to 0.1 and the void size (Dvoid) to 97 nm, the relationship between the wavelength range contrast (Δλcontrast) and the refractive index difference between external Substance 1 and Substance 2 (Δns-r) can be plotted as in Figure 3.
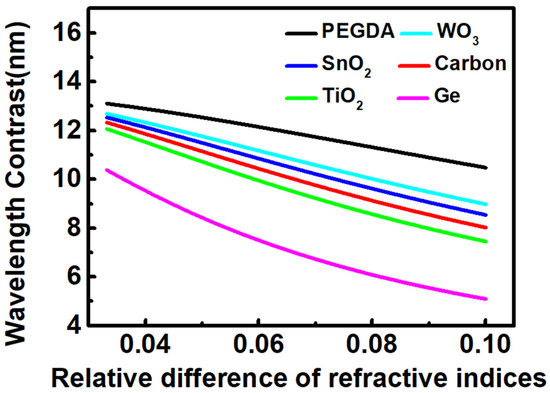
Figure 3.
The relationship between the wavelength range contrast (Δλcontrast) and the relative difference of refractive index between external Substance 1 and Substance 2 (Δns-r).
Figure 3 shows that the wavelength range contrast (Δλcontrast) increases with the reduction of the refractive index of the matrix when the absolute difference and the relative difference of the refractive index of two additional substances are both constant. In this case, the refractive indices of the two applied substances are also constant. If we define Δnpc-a as the absolute difference in the refractive index of the IO structured PC sensor system and Δnpc-r as the relative difference in the refractive index of this system, Δnpc-a and Δnpc-r can be described by Equations (6) and (7), respectively.
where Δnpc-a is the absolute difference in the refractive index of the IO structured PC sensor system and Δnpc-r is the relative difference in the refractive index of this system, nmatrix means the refractive index of the matrix and nvoid means the refractive index of the void. Figure 3 shows that wavelength range contrast (Δλcontrast) increases with the reduction of the refractive index of the matrix. In other words, wavelength range contrast (Δλcontrast) increases with the reduction of absolute difference in the refractive index of the PC system (Δnpc-a), while it decreases with the relative difference in the refractive index of the system. The change of wavelength range contrast (Δλcontrast) with the refractive index difference is opposite in the external system and PC internal system. The above results also prove that the IO structured PC sensor composed of two materials with similar refractive indexes will show greater discrimination of external substances. This may be a novel conclusion, which will have great guiding significance for material selection of PC sensors with IO structure.
The PEGDA-based PC sensor has greater discrimination to external substances (Figure 3). As a demonstration, the PEGDA-based PC sensor was used to explore the relationship between wavelength range contrast (Δλcontrast) and void ratio. In this discussion, two substances with refractive indices of 1.33 and 1.43 were selected. The obtained wavelength response range (ΔλPEGDA) of this PC sensor to a substance with a refractive index of 1.33 can be described by Equation (8).
where ΔλPEGDA means the wavelength response range (ΔλPEGDA) of this PC sensor to a substance with a refractive index of 1.33, ϕ means the void ratio of the PEGDA-based IO system and D is the void size in the system.
MATLAB was adopted to calculate ΔλPEGDA, and the obtained typical results are shown in Figure 4.
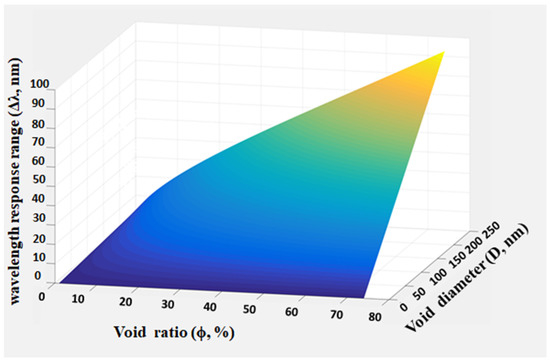
Figure 4.
Typical examples of wavelength response range (ΔλPEGDA) of the PC sensor as a function of void ratio (ϕ) and void diameter (D).
Figure 4 shows that the wavelength response range (ΔλPEGDA) increases with the void size (D) and void ratio (ϕ). When the void ratio reaches 74% and the void size is 250 nm, the wavelength response range (ΔλPEGDA) is close to 100 nm. This indicates that the PC sensor shows strong responsiveness to a substance with a refractive index of 1.33.
The wavelength range contrast (ΔλPEGDA-contrast) is caused by the PC sensor showing different response capabilities to a substance with a refractive index of 1.33 and one with a refractive index of 1.43. This is expressed by Equation (9).
The void size range is between 204 to 412 nm (Table S1, Supplementary Materials). Setting void size (D) to 250 nm, the relationship between ΔλPEGDA-contrast and void ratio (ϕ) can be plotted as in Figure 5.
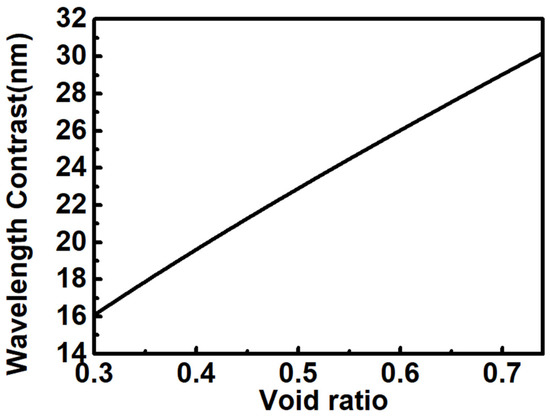
Figure 5.
The relationship between wavelength range contrast (ΔλPEGDA-contrast) and void ratio (D) of the system.
The approximately linear relationship between the wavelength range contrast (ΔλPEGDA-contrast) and void ratio (ϕ) can be found in Figure 5, which indicates that the IO structured PC sensor composed of the closely packed voids (74%) shows a greater recognition capacity to external substances. Equation (9) shows a positive, linear relationship between the wavelength range contrast (ΔλPEGDA-contrast) and void size (Dvoid) when the void ratio (ϕ) is constant. As a consequence, if the PC sensor system contains closely packed voids and the pore diameter is sufficiently large in a limited range (204 to 412 nm, Table S1, Supplementary Materials), the sensitivity of the IO structured PC sensor will be greatly improved.
In addition to using Bragg–Snell’s law, the finite-difference time-domain (FDTD) method is also used to determine the relationship between the response capacity of IO structure and void sizes. An IO structured PC sensor composed of PEGDA matrix and voids with different diameters is calculated using the FDTD method by an FDTD solution software, where the volume ratio in the system is 30%. The simulation model of the system in FDTD solution software is given in Figure S2 in Supplementary Materials. The simulation results of reflection spectra are shown in Figure 6, where the central reflected wavelength of the IO structure containing voids with a diameter of 130, 150, 180, 200 and 220 nm are 385, 443, 530, 589 and 647 nm, respectively. The reflected intensities are close to 100%.
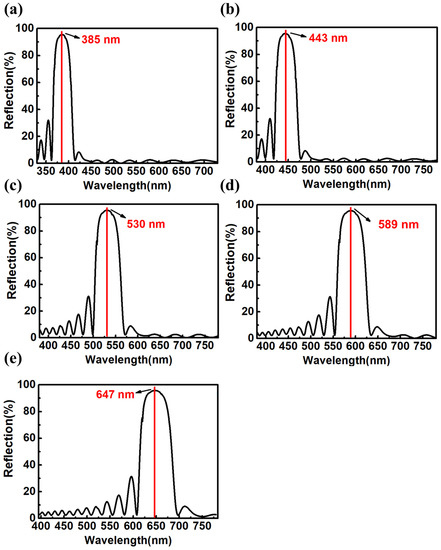
Figure 6.
Simulation results of reflection spectra of IO structure containing PEGDA matrix and voids with diameters of (a) 130 nm; (b) 150 nm; (c) 180 nm; (d) 200 nm; and (e) 220 nm.
When water with a refractive index of 1.33 enters the IO structured PC system, the air in the voids will be replaced by water. Therefore, the central reflection wavelength of the IO structure will shift. The simulated result of reflection spectra of IO structured PC systems after response to liquid water or water vapor are given in Figure 7. These results are also calculated by using FDTD solution software. Figure 7 shows that the central reflected wavelength of IO structure containing voids with a diameter of 130, 150, 180, 200 and 220 nm are 409, 470, 563, 625 and 687 nm, respectively. The reflected intensities drop to 30% after response, which can be ascribed to the fact that two constituent materials of the IO system possess a smaller refractive index difference after response.
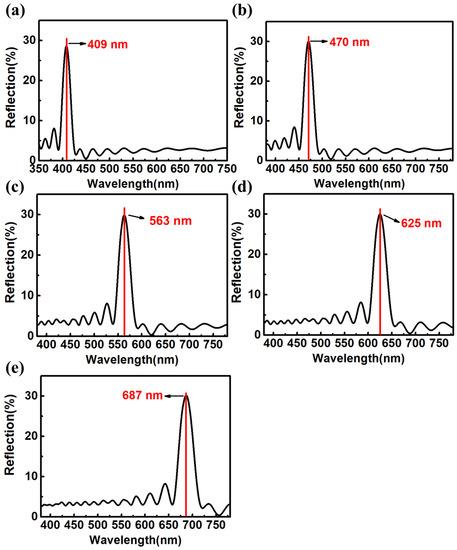
Figure 7.
Simulation results of reflection spectra of IO structure containing PEGDA matrix and voids after response to water, where the void sizes in the system are (a) 130 nm; (b) 150 nm; (c) 180 nm; (d) 200 nm; and (e) 220 nm.
After responding to water, the wavelengths of these PC sensors containing voids with a diameter of 130, 150, 180, 200 and 220 nm shift 24, 27, 33, 36 and 40 nm, respectively. These individual data points were plotted as five points in a diagram, as shown in Figure 8. The relationship between wavelength response range and void sizes predicted by Bragg–Snell’s law (Equation (8)) can be plotted as a straight line (red line in Figure 8). Figure 8 shows that the positions of the points are on the line, which indicates the relationship between wavelength response range and void sizes obtained by the FDTD method is consistent with Bragg–Snell’s law.
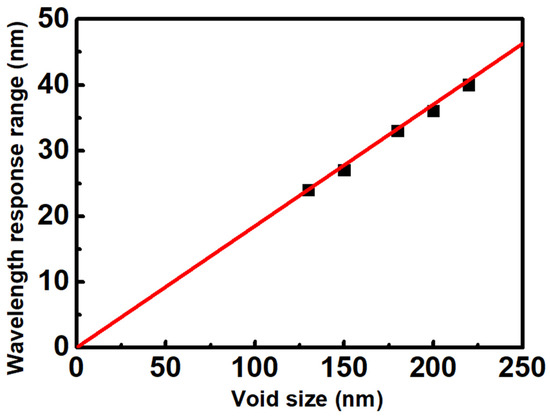
Figure 8.
The relationship between wavelength response range and void sizes predicted by Bragg–Snell’s law and calculated by FDTD method.
Figure 9 shows the calculated reflectance spectra of higher refractive index-contrast IO systems after response to water, where the absolute refractive index contrast of these IO systems composed of WO3, SnO2 and TiO2 matrixes are 1.02, 1.2 and 1.71, respectively. In these IO systems, the void diameters are 200 nm, and the void ratios of these systems are 30%. The simulation results of reflectance spectra were obtained via the FDTD method, and the simulation models were composed of 18 layers (6 periods) of voids. Comparing Figure 9 with Figure 7, it can be easily found that the IO systems with higher absolute refractive index contrast (1.02~1.71) show higher intensity of the reflection peak (95–100%) after responding to water, which is much higher than the peak intensity (30%) of IO structures consisting of PEGDA matrix after a response. This indicates that the IO systems with higher absolute refractive index contrasts show higher color brightness after response. However, it does not mean that the IO structure composed of PEGDA and air has lower color brightness after responding to water, since the intensity of the reflection peak is not only related to the absolute refractive index contrast but also related to the structure thickness.
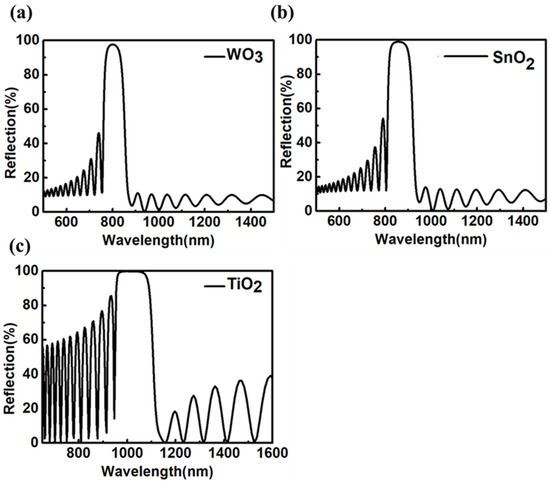
Figure 9.
Simulation results of reflection spectra of IO structure systems after response to water, where the matrix materials of the systems are (a) WO3, (b) SnO2 and (c) TiO2.
The reflection spectra of the IO structure composed of PEGDA matrix and voids with different thicknesses before and after response are given in Figure 10. After responding to water, the reflection peak intensity of IO structure composed of 6 layers (2 periods) and 12 layers (4 periods) of voids were close to 10% and 25%, both of which are less than the 30% formed by the IO structure composed of 18 layers of voids (6 periods). This indicates that reflection peak intensity after response will increase with the thickness of the IO structure. Since the actual thickness of the IO structure can easily reach from tens to 100 μm, thus these will also show high reflection intensity and high color brightness even after responding to water.
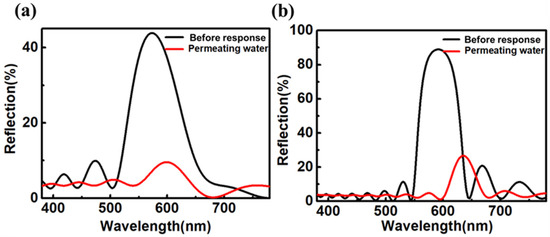
Figure 10.
Simulation results of reflection spectra of IO structure composed of PGEDA matrix and void arrays with (a) 6 layers and (b) 12 layers before and after response to water.
3. Conclusions
We identified and explored the connections between the related factors affecting the recognition capability of IO structured PC sensors. The analysis results using Bragg–Snell’s law showed that the recognition capability of an IO structured PC sensor is negatively correlated with the relative and absolute differences in the refractive index of the PC system. Therefore, among the six matrix materials, PEGDA material with a refractive index of 1.47 is the most suitable choice for PC sensors when they mainly depend on refractive index changes to achieve a response. The recognition capability is also related to the refractive index difference of external substances to be identified, which is positively correlated with the absolute difference of their refractive index and negatively correlated with relative differences. In addition, the recognition capability of two kinds of substances and the response-ability to certain substances is related to the void size and void ratio of the IO system. The response-ability shows a linear relationship with the void ratio. This result is consistent with the prediction by the FDTD method. These analyses provide an efficient strategy for fabricating advanced IO structured PC sensors.
Supplementary Materials
The following supporting information can be downloaded at: https://www.mdpi.com/article/10.3390/cryst12060859/s1, Figure S1: Relations between central reflection wavelength (λIO) and void sizes (D) of the IO structure systems, where the systems were composed of (a) TiO2 matrix, (b) SnO2 matrix, (c) Carbon matrix, (d) WO3 matrix, (e) PEGDA matrix; Table S1: The range of central reflection wavelengths and void sizes of the IO structures composited of different matrixes; Figure S2: Simulation model of PC sensors composited of PEGDA matrix and the voids with a closed-packed face-centered cubic structure. where the void ratio is 30%. (a) Top view; (b) Three-dimensional diagram; (c) Main view; (d) Left view.
Author Contributions
C.Y.: Conceptualization, Investigation, Formal analysis, Data curation, Writing—original draft. M.P.: Formal analysis, Data curation, Validation. X.Z.: Resources, Validation. All authors have read and agreed to the published version of the manuscript.
Funding
This work was supported by the Civil Aviation Development Fund Education Talents Project (0252101) and the Key Project of Civil Aviation Flight University of China (ZJ2020-06).
Conflicts of Interest
The authors declare no conflict of interest.
References
- John, S. Strong localization of photons in certain disordered dielectric superlattices. Phys. Rev. Lett. 1987, 58, 2486–2489. [Google Scholar] [CrossRef] [Green Version]
- Yablonovitch, E. Inhibited Spontaneous Emission in Solid-State Physics and Electronics. Phys. Rev. Lett. 1987, 58, 2059–2062. [Google Scholar] [CrossRef] [PubMed] [Green Version]
- Hou, J.; Yanlin, S.; Song, Y. Patterned colloidal photonic crystals. Angew. Chem. Int. Ed. 2017, 57, 2544–2553. [Google Scholar] [CrossRef]
- Soljačić, M.; Joannopoulos, J.D. Enhancement of nonlinear effects using photonic crystals. Nat. Mater. 2004, 3, 211–219. [Google Scholar] [CrossRef] [PubMed]
- Wu, P.; Wang, J.; Jiang, L. Bio-inspired photonic crystal patterns. Mater. Horizons 2019, 7, 338–365. [Google Scholar] [CrossRef]
- Fu, Q.; Chen, A.; Shi, L.; Ge, J. A polycrystalline SiO2 colloidal crystal film with ultra-narrow reflections. Chem. Commun. 2015, 51, 7382–7385. [Google Scholar] [CrossRef]
- Iwamoto, S.; Ota, Y.; Arakawa, Y. Recent progress in topological waveguides and nanocavities in a semiconductor photonic crystal platform. Opt. Mater. Express 2021, 11, 319–337. [Google Scholar] [CrossRef]
- Khan, Y.; Rehman, A.U.; Batool, B.A.; Noor, M.; Butt, M.A.; Kazanskiy, N.L.; Khonina, S.N. Fabrication and investigation of spectral properties of a dielectric slab waveguide photonic crystal based Fano-filter. Crystals 2022, 12, 226. [Google Scholar] [CrossRef]
- Vlasov, Y.A.; O’Boyle, M.; Hamann, H.F.; McNab, S.J. Active control of slow light on a chip with photonic crystal waveguides. Nature 2005, 438, 65–69. [Google Scholar] [CrossRef]
- Wadsworth, W.; Ortigosa-Blanch, A.; Knight, J.; Birks, T.; Man, T.-P.M.; Russell, P. Supercontinuum generation in photonic crystal fibers and optical fiber tapers: A novel light source. J. Opt. Soc. Am. B 2002, 19, 2148–2155. [Google Scholar] [CrossRef]
- Beugnot, J.-C.; Sylvestre, T.; Alasia, D.; Maillotte, H.; Laude, V.; Monteville, A.; Provino, L.; Traynor, N.; Mafang, S.F.; Thévenaz, L. Complete experimental characterization of stimulated Brillouin scattering in photonic crystal fiber. Opt. Express 2007, 15, 15517–15522. [Google Scholar] [CrossRef]
- Yakasai, I.K.; Rahman, A.; Abas, P.E.; Begum, F. Theoretical assessment of a porous core photonic crystal fiber for terahertz wave propagation. J. Opt. Commun. 2018, 43, 199–209. [Google Scholar] [CrossRef]
- Ge, J.; Yin, Y. Responsive photonic crystals. Angew. Chem. Int. Ed. 2011, 50, 1492–1522. [Google Scholar] [CrossRef]
- Fathi, F.; Rashidi, M.-R.; Pakchin, P.S.; Ahmadi-Kandjani, S.; Nikniazi, A. Photonic crystal based biosensors: Emerging inverse opals for biomarker detection. Talanta 2020, 221, 121615. [Google Scholar] [CrossRef]
- Cho, Y.; Lee, S.Y.; Ellerthorpe, L.; Feng, G.; Lin, G.; Wu, G.; Yin, J.; Yang, S. Elastoplastic inverse opals as power-free mechanochromic sensors for force recording. Adv. Funct. Mater. 2015, 25, 6041–6049. [Google Scholar] [CrossRef]
- Von Freymann, G.; Kitaev, V.; Lotsch, B.V.; Ozin, G.A. Bottom-up assembly of photonic crystals. Chem. Soc. Rev. 2012, 42, 2528–2554. [Google Scholar] [CrossRef] [Green Version]
- Wang, J.; Pinkse, P.W.H.; Segerink, L.I.; Eijkel, J.C.T. Bottom-up assembled photonic crystals for structure-enabled label-free sensing. ACS Nano 2021, 15, 9299–9327. [Google Scholar] [CrossRef]
- Ding, T.; Song, K.; Clays, K.; Tung, C.-H. Bottom-up photonic crystal approach with top-down defect and heterostructure fine-tuning. Langmuir 2009, 26, 4535–4539. [Google Scholar] [CrossRef]
- Li, J.; Bao, R.; Tao, J.; Peng, Y.; Pan, C. Recent progress in flexible pressure sensor arrays: From design to applications. J. Mater. Chem. C 2018, 6, 11878–11892. [Google Scholar] [CrossRef]
- Nair, R.V.; Vijaya, R. Photonic crystal sensors: An overview. Prog. Quantum Electron. 2010, 34, 89–134. [Google Scholar] [CrossRef]
- Yang, H.; Pan, L.; Han, Y.; Ma, L.; Li, Y.; Xu, H.; Zhao, J. A visual water vapor photonic crystal sensor with PVA/SiO2 opal structure. Appl. Surf. Sci. 2017, 423, 421–425. [Google Scholar] [CrossRef]
- Pan, M.; Wang, C.; Hu, Y.; Wang, X.; Pan, L.; Lin, Y.; Shang, L.; Xu, H.; Zhao, J.; Li, Y. Dual optical information-encrypted/decrypted invisible photonic patterns based on controlled wettability. Adv. Opt. Mater. 2021, 10, 2101268. [Google Scholar] [CrossRef]
- Wang, H.; Zhang, K.-Q. Photonic crystal structures with tunable structure color as colorimetric sensors. Sensors 2013, 13, 4192–4213. [Google Scholar] [CrossRef] [Green Version]
- Isapour, G.; Lattuada, M. Multiresponsive photonic microspheres formed by hierarchical assembly of colloidal nanogels for colorimetric sensors. ACS Appl. Nano Mater. 2021, 4, 3389–3396. [Google Scholar] [CrossRef]
- Hou, J.; Zhang, H.; Yang, Q.; Yanlin, S.; Jiang, L.; Song, Y. Hydrophilic-hydrophobic patterned molecularly imprinted photonic crystal sensors for high-sensitive colorimetric detection of tetracycline. Small 2015, 11, 2738–2742. [Google Scholar] [CrossRef]
- Meng, X.; Al-Salman, R.; Zhao, J.; Borissenko, N.; Li, Y.; Endres, F. Electrodeposition of 3D ordered macroporous germanium from ionic liquids: A feasible method to make photonic crystals with a high dielectric constant. Angew. Chem. Int. Ed. 2009, 48, 2703–2707. [Google Scholar] [CrossRef]
- King, J.S.; Graugnard, E.; Summers, C.J. TiO2 Inverse opals fabricated using low-temperature atomic layer deposition. Adv. Mater. 2005, 17, 1010–1013. [Google Scholar] [CrossRef]
- Li, J.; Zhao, X.; Wei, H.; Gu, Z.-Z.; Lu, Z. Macroporous ordered titanium dioxide (TiO2) inverse opal as a new label-free immunosensor. Anal. Chim. Acta 2008, 625, 63–69. [Google Scholar] [CrossRef]
- Yu, J.; Lei, J.; Wang, L.; Zhang, J.; Liu, Y. TiO2 inverse opal photonic crystals: Synthesis, modification, and applications—A review. J. Alloys Compd. 2018, 769, 740–757. [Google Scholar] [CrossRef]
- Gu, F.; Wang, H.; Han, D.; Wang, Z. Enhancing the sensing performance of SnO2 inverse opal thin films by In and Au doping. Sens. Actuators B Chem. 2017, 245, 1023–1031. [Google Scholar] [CrossRef]
- Wang, J.; Xu, Y.; Xu, W.; Zhang, M.; Chen, X. Simplified preparation of SnO2 inverse opal for Methanol gas sensing performance. Microporous Mesoporous Mater. 2015, 208, 93–97. [Google Scholar] [CrossRef]
- Li, H.; Chang, L.; Wang, J.; Yang, L.; Song, Y. A colorful oil-sensitive carbon inverse opal. J. Mater. Chem. 2008, 18, 5098–5103. [Google Scholar] [CrossRef]
- Xing, R.; Du, Y.; Zhao, X.; Zhang, X. Gas sensor based on 3-D WO3 inverse opal: Design and applications. Sensors 2017, 17, 710. [Google Scholar] [CrossRef] [Green Version]
- Borges, P.D.; Scolfaro, L.M.; Leite Alves, H.W.; da Silva, E.F. DFT study of the electronic, vibrational, and optical properties of SnO2. Theor. Chem. Acc. 2010, 126, 39–44. [Google Scholar] [CrossRef]
- Zhang, Z.F.; Ma, X.; Wang, H.; Ye, F. Influence of polymerization conditions on the refractive index of poly(ethylene glycol) diacrylate (PEGDA) hydrogels. Appl. Phys. A 2018, 124, 283. [Google Scholar] [CrossRef]
- Qian, X.; Wang, N.; Li, Y.; Zhang, J.; Xu, Z.; Long, Y. Bioinspired multifunctional vanadium dioxide: Improved thermochromism and hydrophobicity. Langmuir 2014, 30, 10766–10771. [Google Scholar] [CrossRef]
- Heydari, V.; Bahreini, Z. Synthesis of silica-supported ZnO pigments for thermal control coatings and analysis of their reflection model. J. Coat. Technol. Res. 2017, 15, 223–230. [Google Scholar] [CrossRef]
Publisher’s Note: MDPI stays neutral with regard to jurisdictional claims in published maps and institutional affiliations. |
© 2022 by the authors. Licensee MDPI, Basel, Switzerland. This article is an open access article distributed under the terms and conditions of the Creative Commons Attribution (CC BY) license (https://creativecommons.org/licenses/by/4.0/).