Article

A Comparison of Two Methods Modeling High-Temperature Fatigue Crack Initiation in Ferrite–Pearlite Steel

School of Energy and Power Engineering, Dalian University of Technology, Dalian 116023, China
*
Author to whom correspondence should be addressed.
Crystals 2022, 12(5), 718; https://doi.org/10.3390/cryst12050718
Submission received: 20 April 2022 / Revised: 13 May 2022 / Accepted: 16 May 2022 / Published: 18 May 2022
(This article belongs to the Section Materials for Energy Applications)

Abstract

:
High-temperature fatigue tests are carried out to investigate the fatigue crack initiation behavior of ferrite–pearlite steel. Two approaches to modeling fatigue crack initiation under high temperatures in ferrite–pearlite steel are developed and compared in this study. In the first approach, basal energy is introduced as the criterion for crack initiation. Various initial basal energy values are assigned to each potential location. The increments in basal energy after each cycle can be calculated. In the second approach, a crystal plasticity model is developed, combined with the cyclic hardening/softening effect and three fatigue indicator parameters (two of them are adopted from previous works and one is developed in this work). Results indicate that both approaches are capable of predicting the fatigue crack initiation location and the corresponding life. The first approach requires a lower computational cost but has many limitations, and the second approach is suitable for calculating mesoscale stress and strain distributions but with a higher computational cost.

1. Introduction

The fatigue cracking of ferrite–pearlite steel has been widely investigated by different approaches since it is one of the most common materials in industry. However, the high-temperature fatigue crack initiation of ferrite–pearlite steel is still not fully predictable due to its complexity and inhomogeneity in microstructure [1]. For ferrite–pearlite steel, a fatigue crack always tends to initiate and propagate in ferrite grains, and crack propagation rates decrease rapidly at ferrite–pearlite grain boundaries [2]. In the pearlite phase, no cracking has been observed in either room-temperature or high-temperature fatigue tests [3].
Several different approaches have been proposed for predicting fatigue crack initiation at the mesoscale level. For instance, Hoshide et al. [4,5] proposed a methodology to simulate the fatigue crack initiation and final failure of Ti alloy with different microstructures. Compared with the traditional finite element method, the simulation process is faster, with less computational complexity, and is suitable for whole fatigue life simulation, i.e., from crack initiation to final collapse. However, this method is not able to calculate the stress and strain distribution inside each grain.
In the past decade, the crystal plasticity finite element method (CPFEM) has been a powerful method to investigate material deformation at the mesoscale level. The early-stage investigation of the crystal plastic deformation mechanism was completed by Taylor et al. [6,7,8] and the mathematical description was proposed by Hill et al. [9,10]. Huang [11] assumed that plastic deformation is caused by crystallographic dislocation slip only, which means that other types of plastic deformation are not considered. Based on this, Li et al. [12] proposed a new constitutive model considering twinning and detwinning mechanisms to model the uniaxial ratcheting of polycrystalline extruded magnesium (Mg) alloys. Yue et al. [13] conducted cyclic loading simulation using crystal plasticity theory developed by Asaro et al. [14]. The result indicated that a fatigue crack may initiate at the deformation-localized position, which means that CPFEM has the potential to be implemented for fatigue crack investigation.
The past decade has witnessed the rapid development of CPFEM. Sweeney et al. [15] carried out fatigue simulation based on the crystal plasticity constitutive model developed by Dunne et al. [16]; statistically stored dislocations, temperature, and other parameters were involved in this constitutive model. Experimental and simulation results were in good agreement, indicating that CPFEM with appropriate constitutive equations is suitable for predicting fatigue crack initiation precisely. Zhang et al. [17] investigated the fatigue life of a superalloy under symmetrical cyclic loading at 650 °C using CPFEM, assuming that fatigue failure takes place when the standard deviation of the strains reaches a critical value, which can be determined by the cyclic experiments with only one strain amplitude.
Crystal structure is an important aspect in CPFEM because resolved stress and slip deformation depends on it strongly. A number of CPFEM constitutive models have been developed with different crystal structures. The material under investigation in this work mainly consists of ferrite with a body-centered cubic (BCC) structure. Theoretically, there is only one set of slip systems in face-centered cubic (FCC) structures, i.e., { 111 } 110 , but three sets of slip systems in BCC structures, i.e., { 110 } 111 , { 112 } 111 and { 123 } 111 , which makes it more complicated to calculate the slip deformation of BCC structures than FCC. Several simplified models have been proposed; for example, Ashton et al. [18] adopted { 110 } 111 slip systems and the other two sets were neglected, since it has been shown by Franciosi et al. [19] that { 110 } 111 were the principal slip systems in BCC iron. Sweeney et al. [15] adopted two types of slip systems, i.e., { 110 } 111 , { 112 } 111 . Most recently, Du et al. [20] performed uniaxial micro-tensile tests on single-crystal ferrite specimens with three different orientations; results indicated that only { 110 } 111 and { 112 } 111 slip systems were activated and the contributions made by these two systems for slip deformation were equal. The critical resolved shear stress (CRSS) values of the two active slip systems were close to each other, i.e., CRSS 110 111 = ( 1.0 ± 0.1 ) × CRSS 112 111 .
The most intuitive way to simulate fatigue crack initiation should be modeling cracks directly, which can be achieved by different methods, such as extended finite element methods (XFEM) and cohesive element methods, etc. Recently, Zhang et al. [21] conducted CPFEM simulations using XFEM and a self-defined damage criterion to predict crack propagation in a single-crystal nickel-based superalloy; the crack path suited the experiment results very well. However, modeling multiple cracks’ initiation and propagation using the finite element method often causes severe convergence difficulties because of the contact and stress field singularity caused by crack tips; thus, an indicator to show whether an element is cracked was proposed to avoid the difficulties, which is called the fatigue indicator parameter (FIP). It has been demonstrated that FIPs are related to grain scale fatigue crack formation and microstructurally small fatigue crack growth by Mcdowell et al. [22] and can be used as surrogate measures of the driving force for fatigue crack initiation [23], which means that FIPs are capable of predicting the fatigue crack initiation position and life. A wide variety of FIPs have been proposed and implemented in CPFEM simulation; for instance, Dunne et al. [24] adopted the accumulated plastic strain as the FIP, and predicted persistent slip bands accurately. Hallberg et al. [25] conducted a series of simulations to investigate the influence of surface roughness and microstructure heterogeneities on fatigue crack initiation, and employed two additional modified FIPs to show the crack initiation position. However, the FIP needs to be defined based on the constitutive model, and each constitutive model should correspond to one or more appropriate FIPs. Based on previous works, two FIPs are adopted in this work to calculate crack initiation life and crack density, and a modified FIP is developed.
As discussed previously, CPFEM has been implemented for cyclic deformation simulation, and the cyclic hardening/softening effect has been introduced into CPFEM by several works. For example, Lin et al. [26] investigated a nickel-based superalloy with a modified crystal plasticity constitutive model and the stress relaxation behavior was calculated. Sajjad et al. [27] adopted the Chaboche model to simulate the cyclic hardening effect in martensitic high-nitrogen stainless steel. The simulation was carried out for dozens of cycles, and the ratcheting effect was captured well by this model. However, most cyclic hardening/softening simulations using CPFEM were conducted for relatively low cycles (less than 1000 cycles), and a CPFEM model to predict the cyclic hardening/softening effect under relatively high cycle loading needs to be developed.
In this paper, high-temperature fatigue experiments are conducted to investigate the fatigue crack initiation (Section 2). After this, two approaches to fatigue simulation are conducted. In the first approach of this work (Section 3.1), simulation is carried out by assigning suitable crack initiation energy (basal energy) for each grain, which is determined by experimental observation and will increase after each cycle. In the second approach (Section 3.2), a crystal plasticity constitutive model including the cyclic hardening/softening effect, kinematic hardening effect, and fatigue indicator parameters (FIPs) is established, and the simulations are carried out using ABAQUS with UMAT code. The geometric model used in both approaches is generated based on the microstructure of the specimen, and a Python script is written to generate the model. Both 2D and 3D models are adopted in the second approach. Considering computational efficiency, representative volume element (RVE) models are used. Here, 3D models are used to calculate the averaged stress–strain response and the evolution of peak–valley stress to demonstrate the validity of the constitutive model because of the increase in computing time [22]. Two FIPs are adopted from previous works, and another FIP is developed. Finally, a comparison is made to show the pros and cons of the two approaches.

2. Materials and Methods

2.1. Material

The material investigated in this work is low-carbon structure steel treated with annealing. The chemical composition and mechanical properties are listed in Table 1 and Table 2. Specimens are cut with an annular notch to make the fatigue crack more concentrated, as shown in Figure 1, which will facilitate fatigue crack observation.

2.2. Methods

Fatigue tests are conducted using the MTS Landmark system under strain control with a strain ratio of R = −1 by an axial extensometer with 25 mm gauge, and the temperature is set to 500 °C. Since the cross-sectional area is not invariant in the gauge section, the strain value read from the extensometer is not the actual strain at the notch position, shown in Figure 2. In this work, the average strain amplitude is set to 0.12% (controlled by the extensometer), and the actual strain at the notch position is 0.263%, which is measured by a strain gauge. All experimental parameters are shown in Table 3.
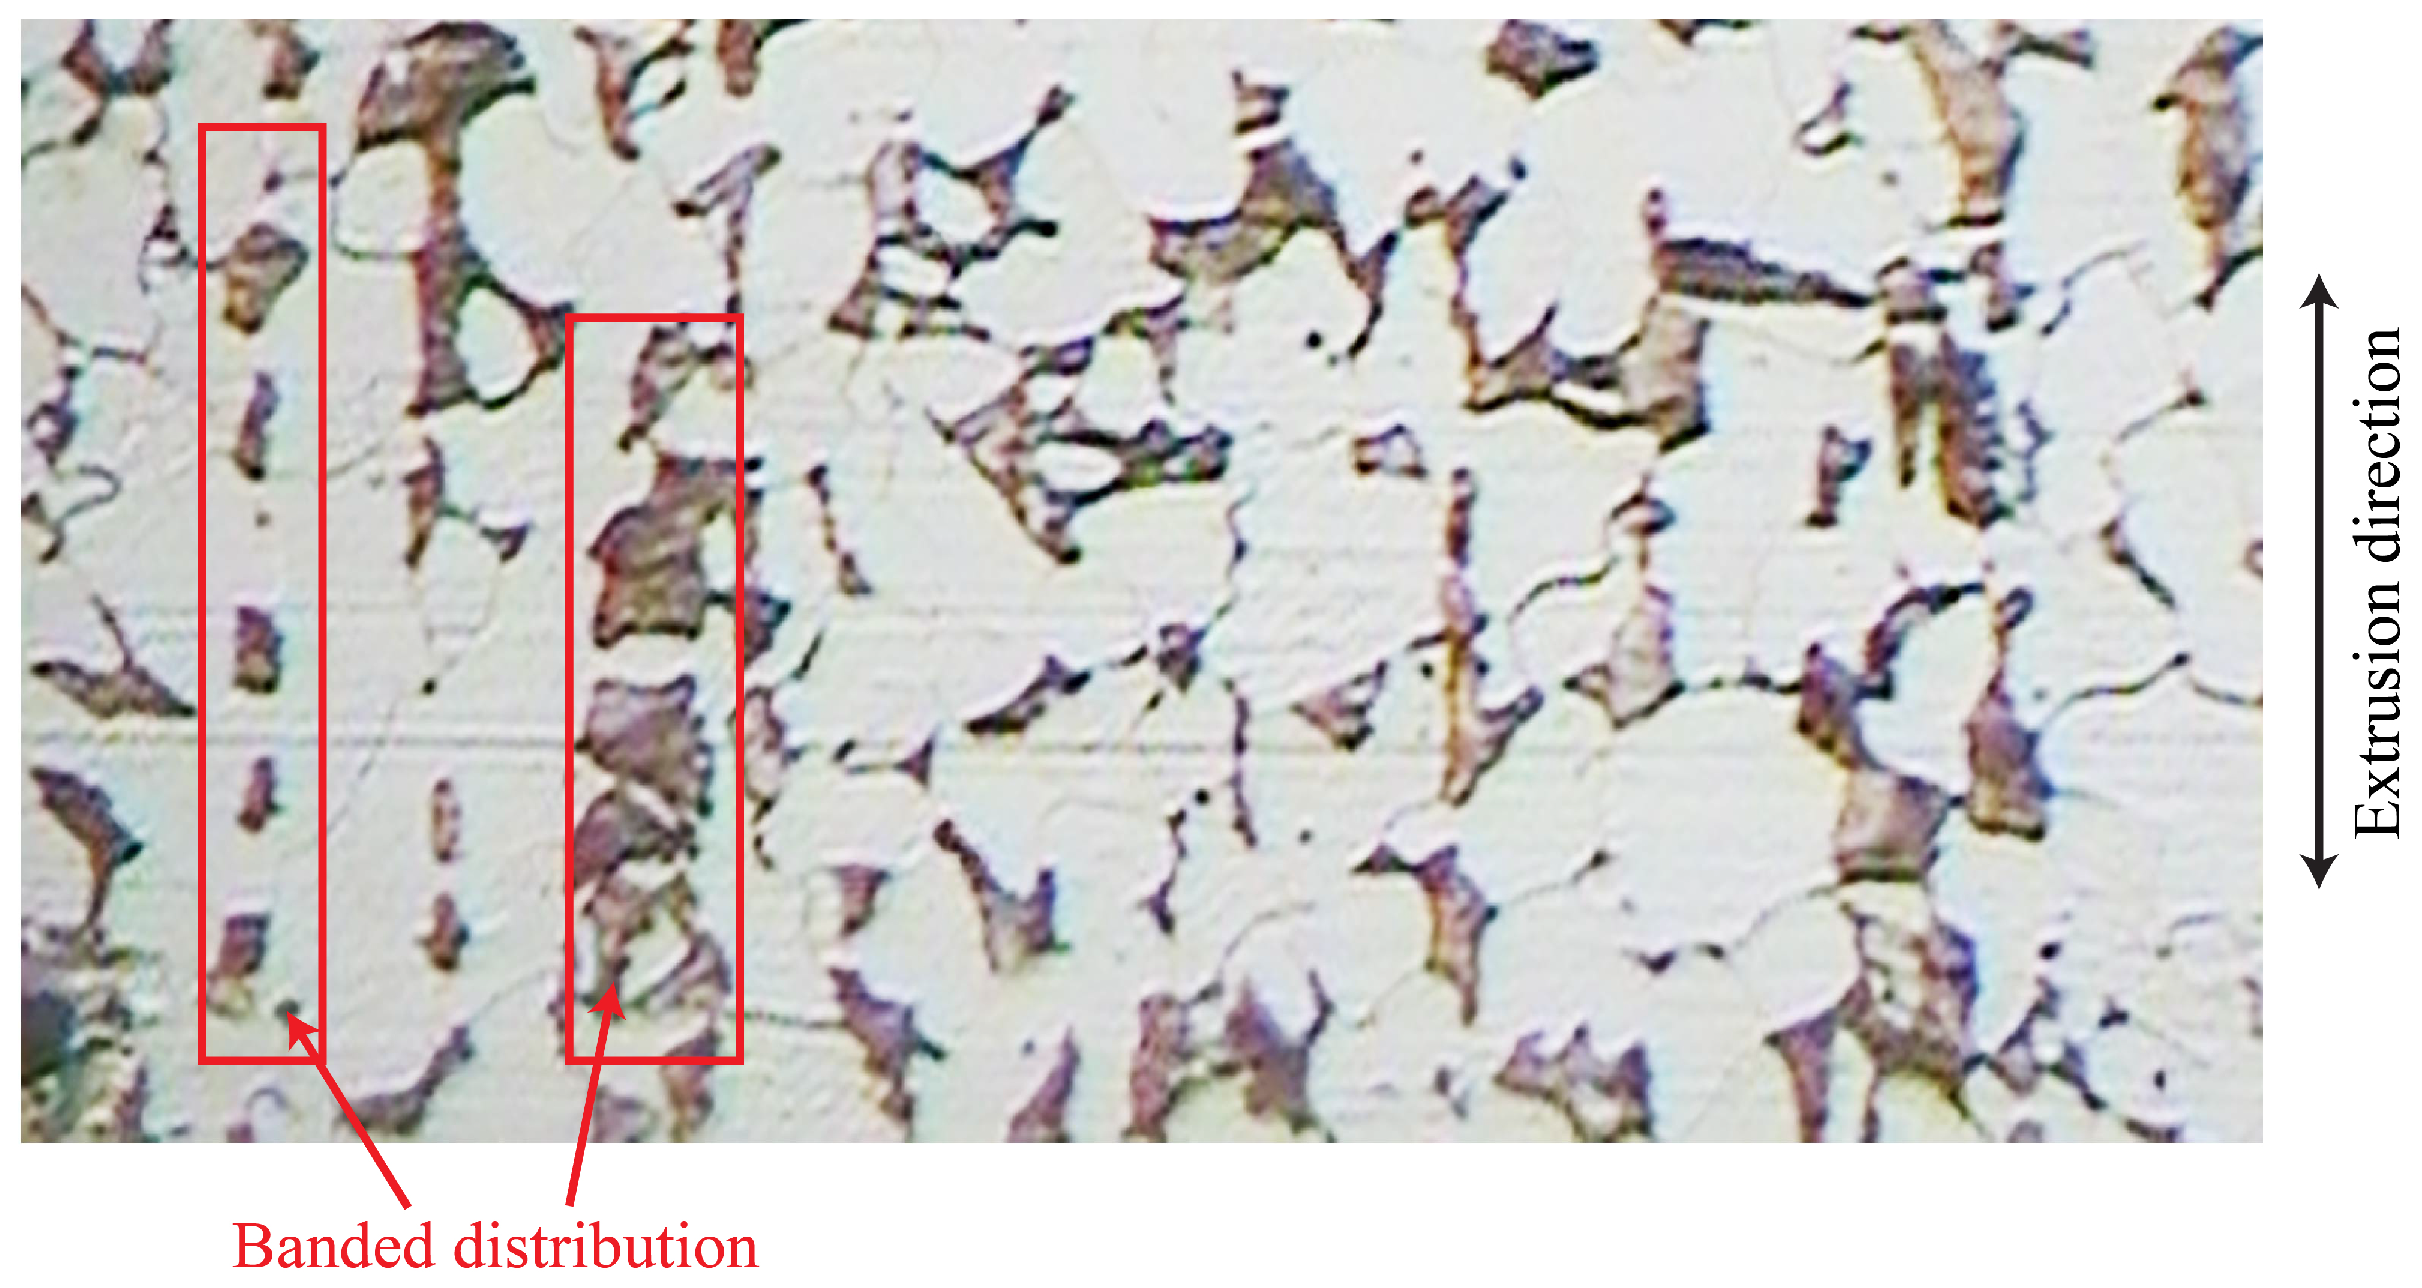
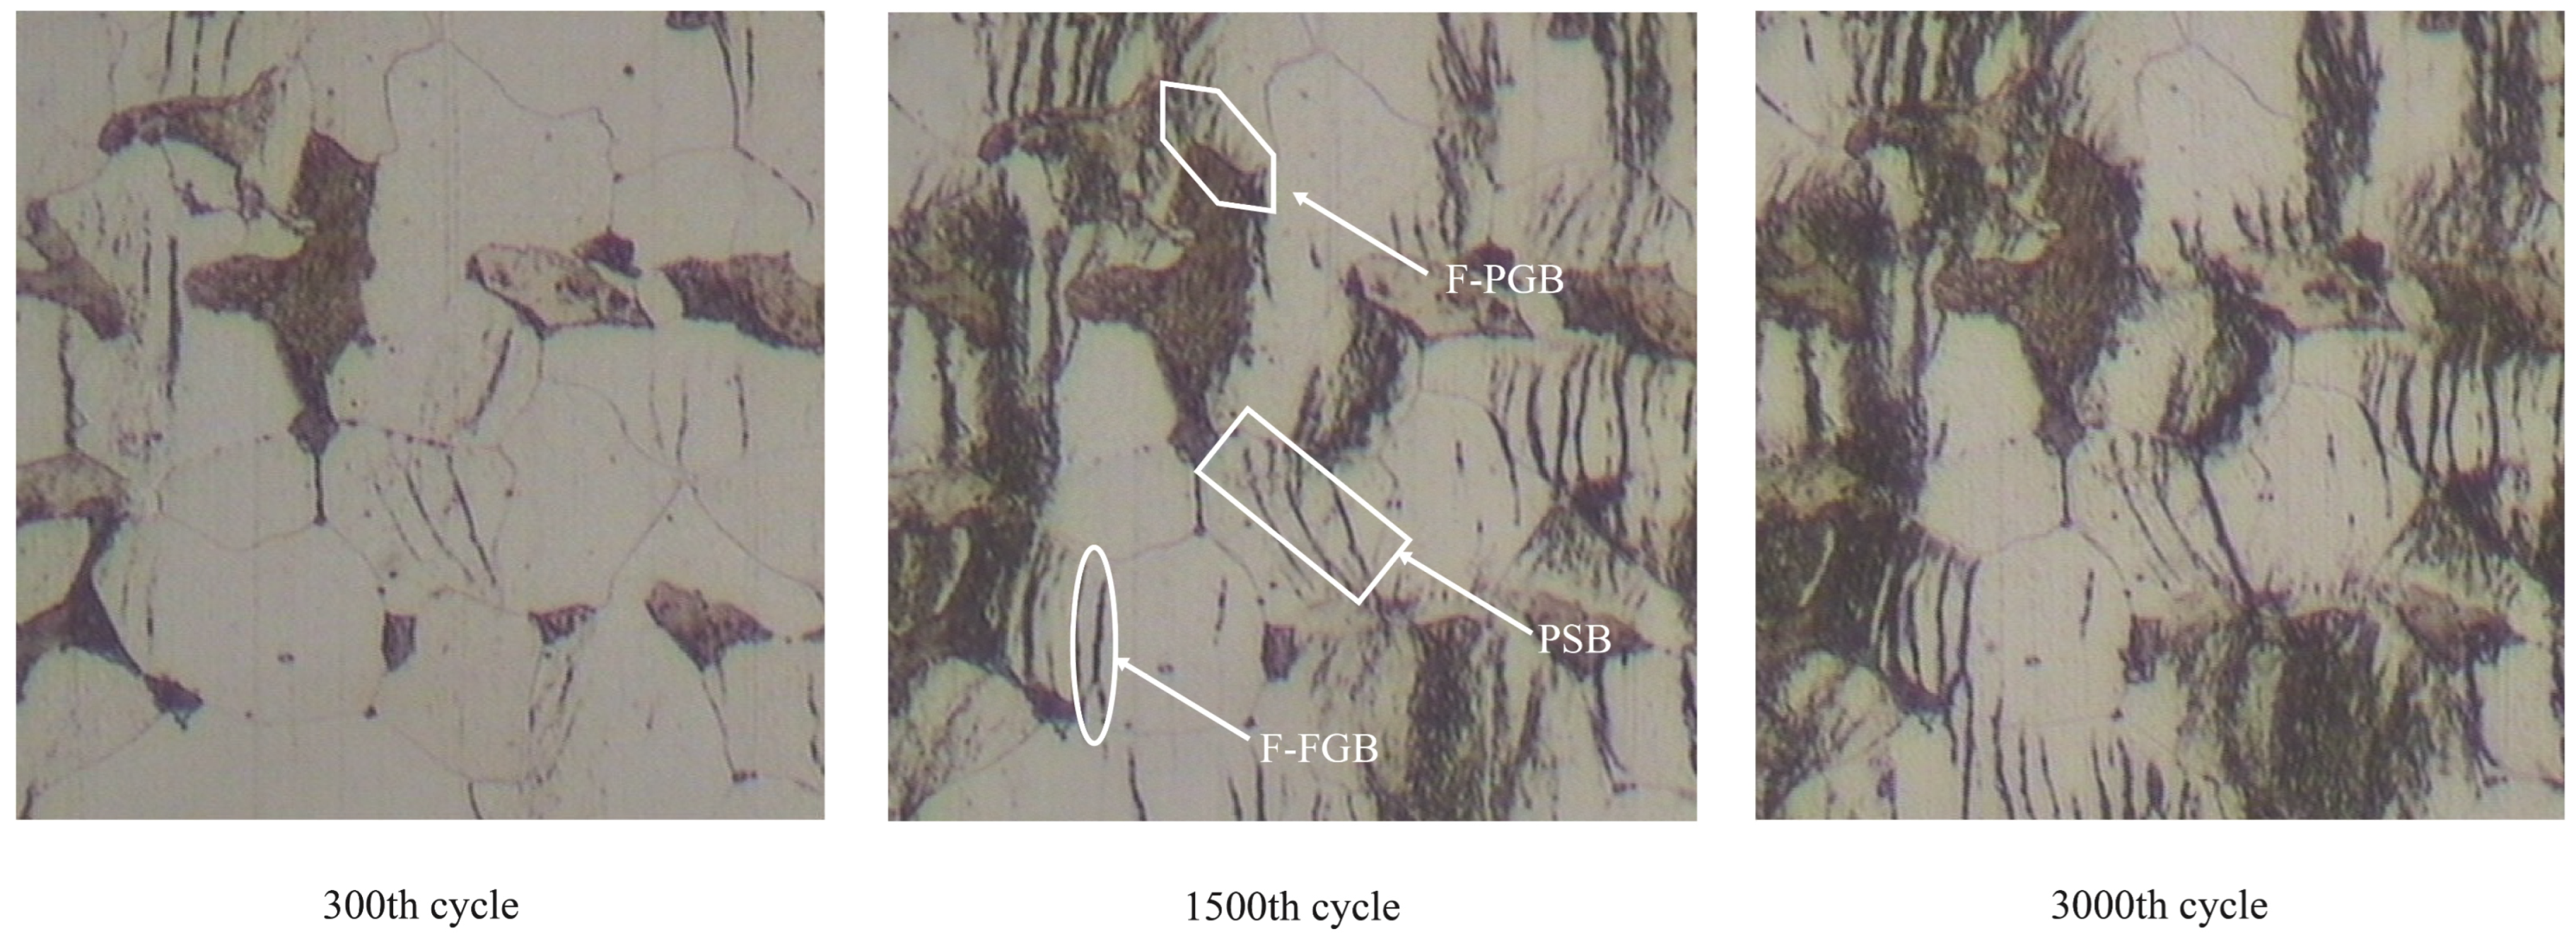
The microstructure of the surface is obtained by Nital etching, shown in Figure 3. It can be seen that the pearlite distribution is significantly influenced by the extrusion direction. The “banded” distribution of pearlite is observed along the extrusion direction. The fatigue tests are carried out three times, and dozens of areas are observed. Based on the experimental results shown in Figure 4, cracks initiate at the ferrite–pearlite grain boundary (F-PGB) and ferrite–ferrite grain boundary (F-FGB) and a persistent slip band (PSB) can be observed; these are marked by the polygon, ellipse, and rectangle, respectively. Meanwhile, no cracks initiate in pearlite. The total fatigue life is 20,097, and almost all fatigue cracks initiate in 3000 cycles, which is nearly 15% of the whole life. After this, cracks begin to propagate and only a few new cracks initiate. Since the main purpose of this work is to compare the following two approaches predicting fatigue crack initiation, only the first 3000 cycles are investigated.

3. Results

3.1. The First Approach for Crack Initiation Prediction

The fundamentals of these two approaches are different. In the first approach, the program is written based on experimental observation without involving any types of deformation; in other words, no continuum mechanics are involved.

3.1.1. Generation of Geometric Model

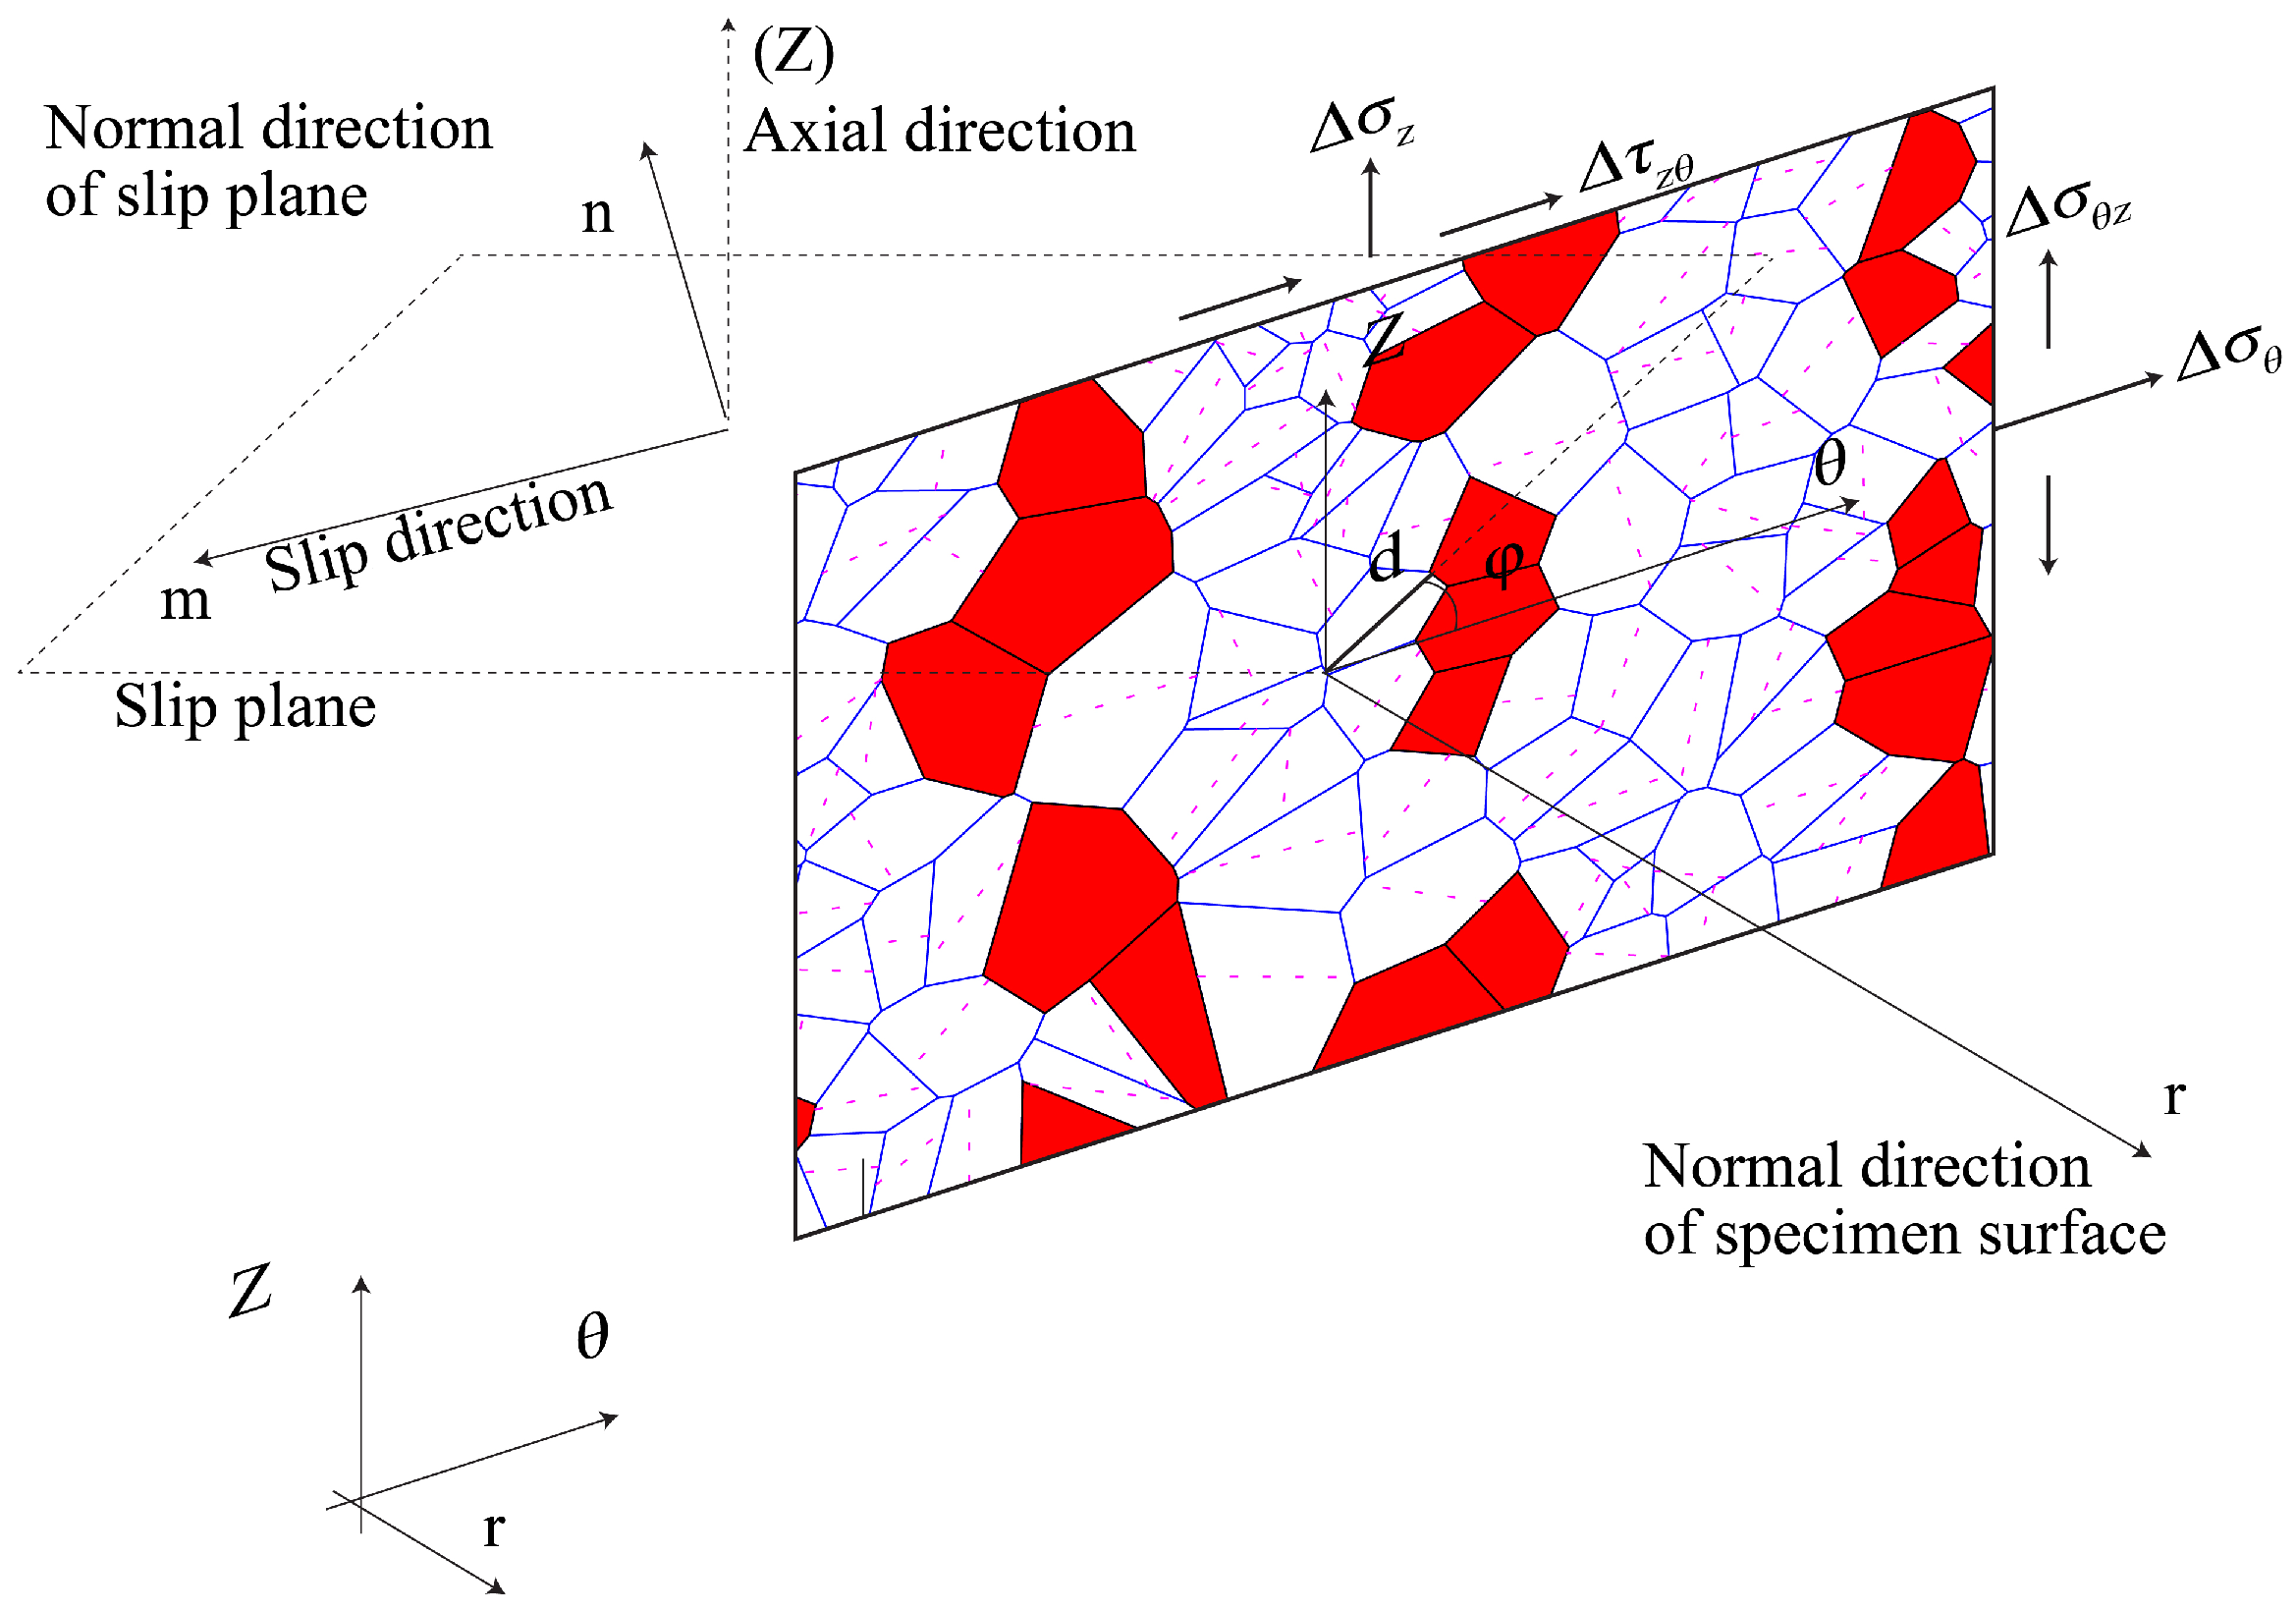
The geometric model was generated based on Voronoi tessellation [28]. As shown in Figure 5, red polygons represent pearlite and the rest are ferrite. Based on Figure 3, the “banded” distribution of pearlite is noticed, and some ranges are defined to determine whether a polygon is pearlite. For example, as shown in Figure 5, if the center point coordinate of a polygon in the horizontal direction is between (0.02 mm, 0.05 mm, or 0.09 mm, 0.11 mm, etc.), it is considered to be pearlite. The arbitrary crystal orientations are assigned to each ferrite grain. The geometric model is restricted to 0.32 × 0.96 mm 2 containing 1350 grains.

3.1.2. Crack Initiation Model

Based on the experimental observation shown in Figure 4, PSBsin ferrite grains, F-FGBs, and F-PGBs are considered to be crack initiation locations, while other locations, such as the pearlite phase, will not initiate cracks. Basal energy is assigned to each grain and grain boundary. Since no pearlite crack is observed in the experimental results, the basal energy of the pearlite phase is set to zero. The main equations introduced in this approach are adopted from previous work done by Wang et al. [1]. The increment in basal energy after each cycle is calculated by Equations (1) and (2).
Δ E P S B = π 1 μ d i τ m n τ c 2 λ 2 G W c if τ m n τ c 0 if τ m n < τ c
Δ E G B = D i j d j k 1 λ
Δ E P S B is the increment in basal energy for PSB and Δ E G B is for the grain boundary. Here, G is the shear modulus, μ is the Poisson’s ratio, W c is the fracture energy density, τ c is the critical resolved shear stress (CRSS), λ is the stress relaxation coefficient, which equals 1 in this paper (following previous work [1]), d i is the slip band length of the i t h grains, τ m n is the shear stress on the associated slip plane, as shown in Figure 6, D i j is the i t h edge length of the j t h grain boundary, and k 1 is a parameter that can be calculated by Equation (3).
k 1 = f σ , T = C 1 · 1 2 σ 1 σ 2 2 + σ 2 σ 3 2 + σ 3 σ 1 2 · T
where T is temperature (500 °C in this work), and C 1 is the coefficient to scale the equivalent stress. τ m n is defined by:
τ m n = γ m θ γ n θ σ θ + γ m z γ n z σ z + τ θ z γ n θ γ m z + γ m θ γ n z
where γ i j are the components of the transformation tensor, which maps a stress tensor from the global system ( z , θ , r ) to the crystal system.
When the basal energy increases to 1, a crack is initiated. The Cauchy stress tensor is assigned to each grain based on Equation (4) and only one slip direction is considered for each ferrite grain, although, theoretically, there are three sets of slip systems in ferrite grain. The slip direction and stress assignment are elaborated in Figure 6. The magenta dotted lines represent the slip direction, which is the projection of the slip direction vector on the geometric model. In this model, the lines are also the PSBs. The stress components in Equation (4) are according to the coordinate system in Figure 6, z direction is the loading direction, and r is the normal direction of the sample surface (point out of sample surface). The shear stress in each grain is calculated by Equation (4). Therefore, the shear stress τ m n can be calculated; details can be found in [1].

3.1.3. Computational Model Parameters’ Determination

The FEM is used only to calculate stress components prior to the fatigue simulation process in the first approach. Therefore, the stress field after fatigue tests is not able to be obtained by this method. There are several parameters that need to be determined and calibrated in this model. σ θ , σ Z , and τ θ Z are calculated based on the finite element method, and the slip band length d i is assumed to be the length of the magenta dotted lines in each grain; the shear modulus G and Poisson’s ratio μ are listed in Table 2. Since the shear modulus is 81 GPa, τ c is set to 81 MPa, which is 0.1 % of the shear modulus, and the fracture energy density W c is 2 KJ/m 2 , which is adopted from previous work done by Hoshide et al. [29]. Fracture energy density is calibrated during the simulation procedure. Based on Figure 4, cracks are more likely to initiate in PSBs, and the same phenomenon was observed in the previous work [1]. The crack initiation is influenced by a number of mechanisms (dislocation pile-up, second phase particles, etc.). The basal energy criterion is not able to reflect all the mechanics. Therefore, a range of initial values is defined, and the basal energies are random but within this range. The initial basal energy of PSBs in ferrite grains, F-FGBs, and F-PGBs is set to different values to fit the experimental results. All the parameters of the first approach are listed in Table 4.

3.1.4. Results of the First Approach

The simulation results of the first 3000 cycles are shown in Figure 7, and the fatigue life is 19,500 cycles, which is close to the experimental result (20,097 cycles). In order to observe fatigue crack initiation more clearly, the specimen without Nital etching is used and the results are shown in Figure 8. Based on previous work done by Wang et al. [1], before 15% cycles of the whole life, the number of cracks increases rapidly, and it is called stage I. After stage I, cracks almost stop initiating. Since the main purpose of this paper is to predict fatigue crack initiation and the total fatigue life of the specimen is 20,097 cycles, only the first 3000 cycles are investigated. In this work, crack density is calculated using the cracked area divided by the total area. Based on Figure 7 and Figure 8, the crack density (at 3000th cycle) of the experiment and the first approach is 6.09% and 5.92%, respectively, and the evolution is shown in Figure 9. The crack density of the experiment is obtained by calculating the grey level of Figure 8. The lighter pixels are eliminated, and the darker pixels are considered to be cracks. An in-house MATLAB code is written to perform the calculation; in the meantime, the averaged crack width is also calculated. After this, the crack density of the experimental results (as shown in Figure 7) is equal to the total area of cracks (the small black rectangles) divided by the whole observation area, where the width of the rectangles is defined based on previous calculation.

3.2. The Second Approach for Crack Initiation Prediction

The second approach is based on the crystal plasticity finite element method (CPFEM). Unlike the first approach, CPFEM is developed from the crystal plasticity constitutive model; the stress and strain fields can be calculated, and details are discussed in this section.

3.2.1. Generation of Microstructures

A geometric model is critical for CPFEM simulation because the stress and strain distribution rely on it significantly. There are both two-dimensional (2D) and three-dimensional (3D) models adopted in many papers; for example, Berisha et al. [3] adopted a 2D model to calculate the stress distribution in pearlite grains. McDowell et al. [22] constructed both 2D and 3D models to investigate the evolution of the fatigue indicator parameter. In their work, 2D models are used not only to calculate the averaged stress–strain response and cyclic hardening/softening effect, but also the precise positions of crack initiation, i.e., the high FIP positions. Meanwhile, 3D models are used to calculate the averaged stress–strain response to support the design of the CPFEM model, because the increase in computing time when moving from 2D to 3D microstructures is often several orders of magnitude, and such computations are highly intensive, even in 2D [22]. Recently, Stopka et al. [30] exploited a statistical technique to predict maximum FIPs in different materials with 3D models, and the effect of the finite element and the size of the statistical volume element (SVE) are investigated.
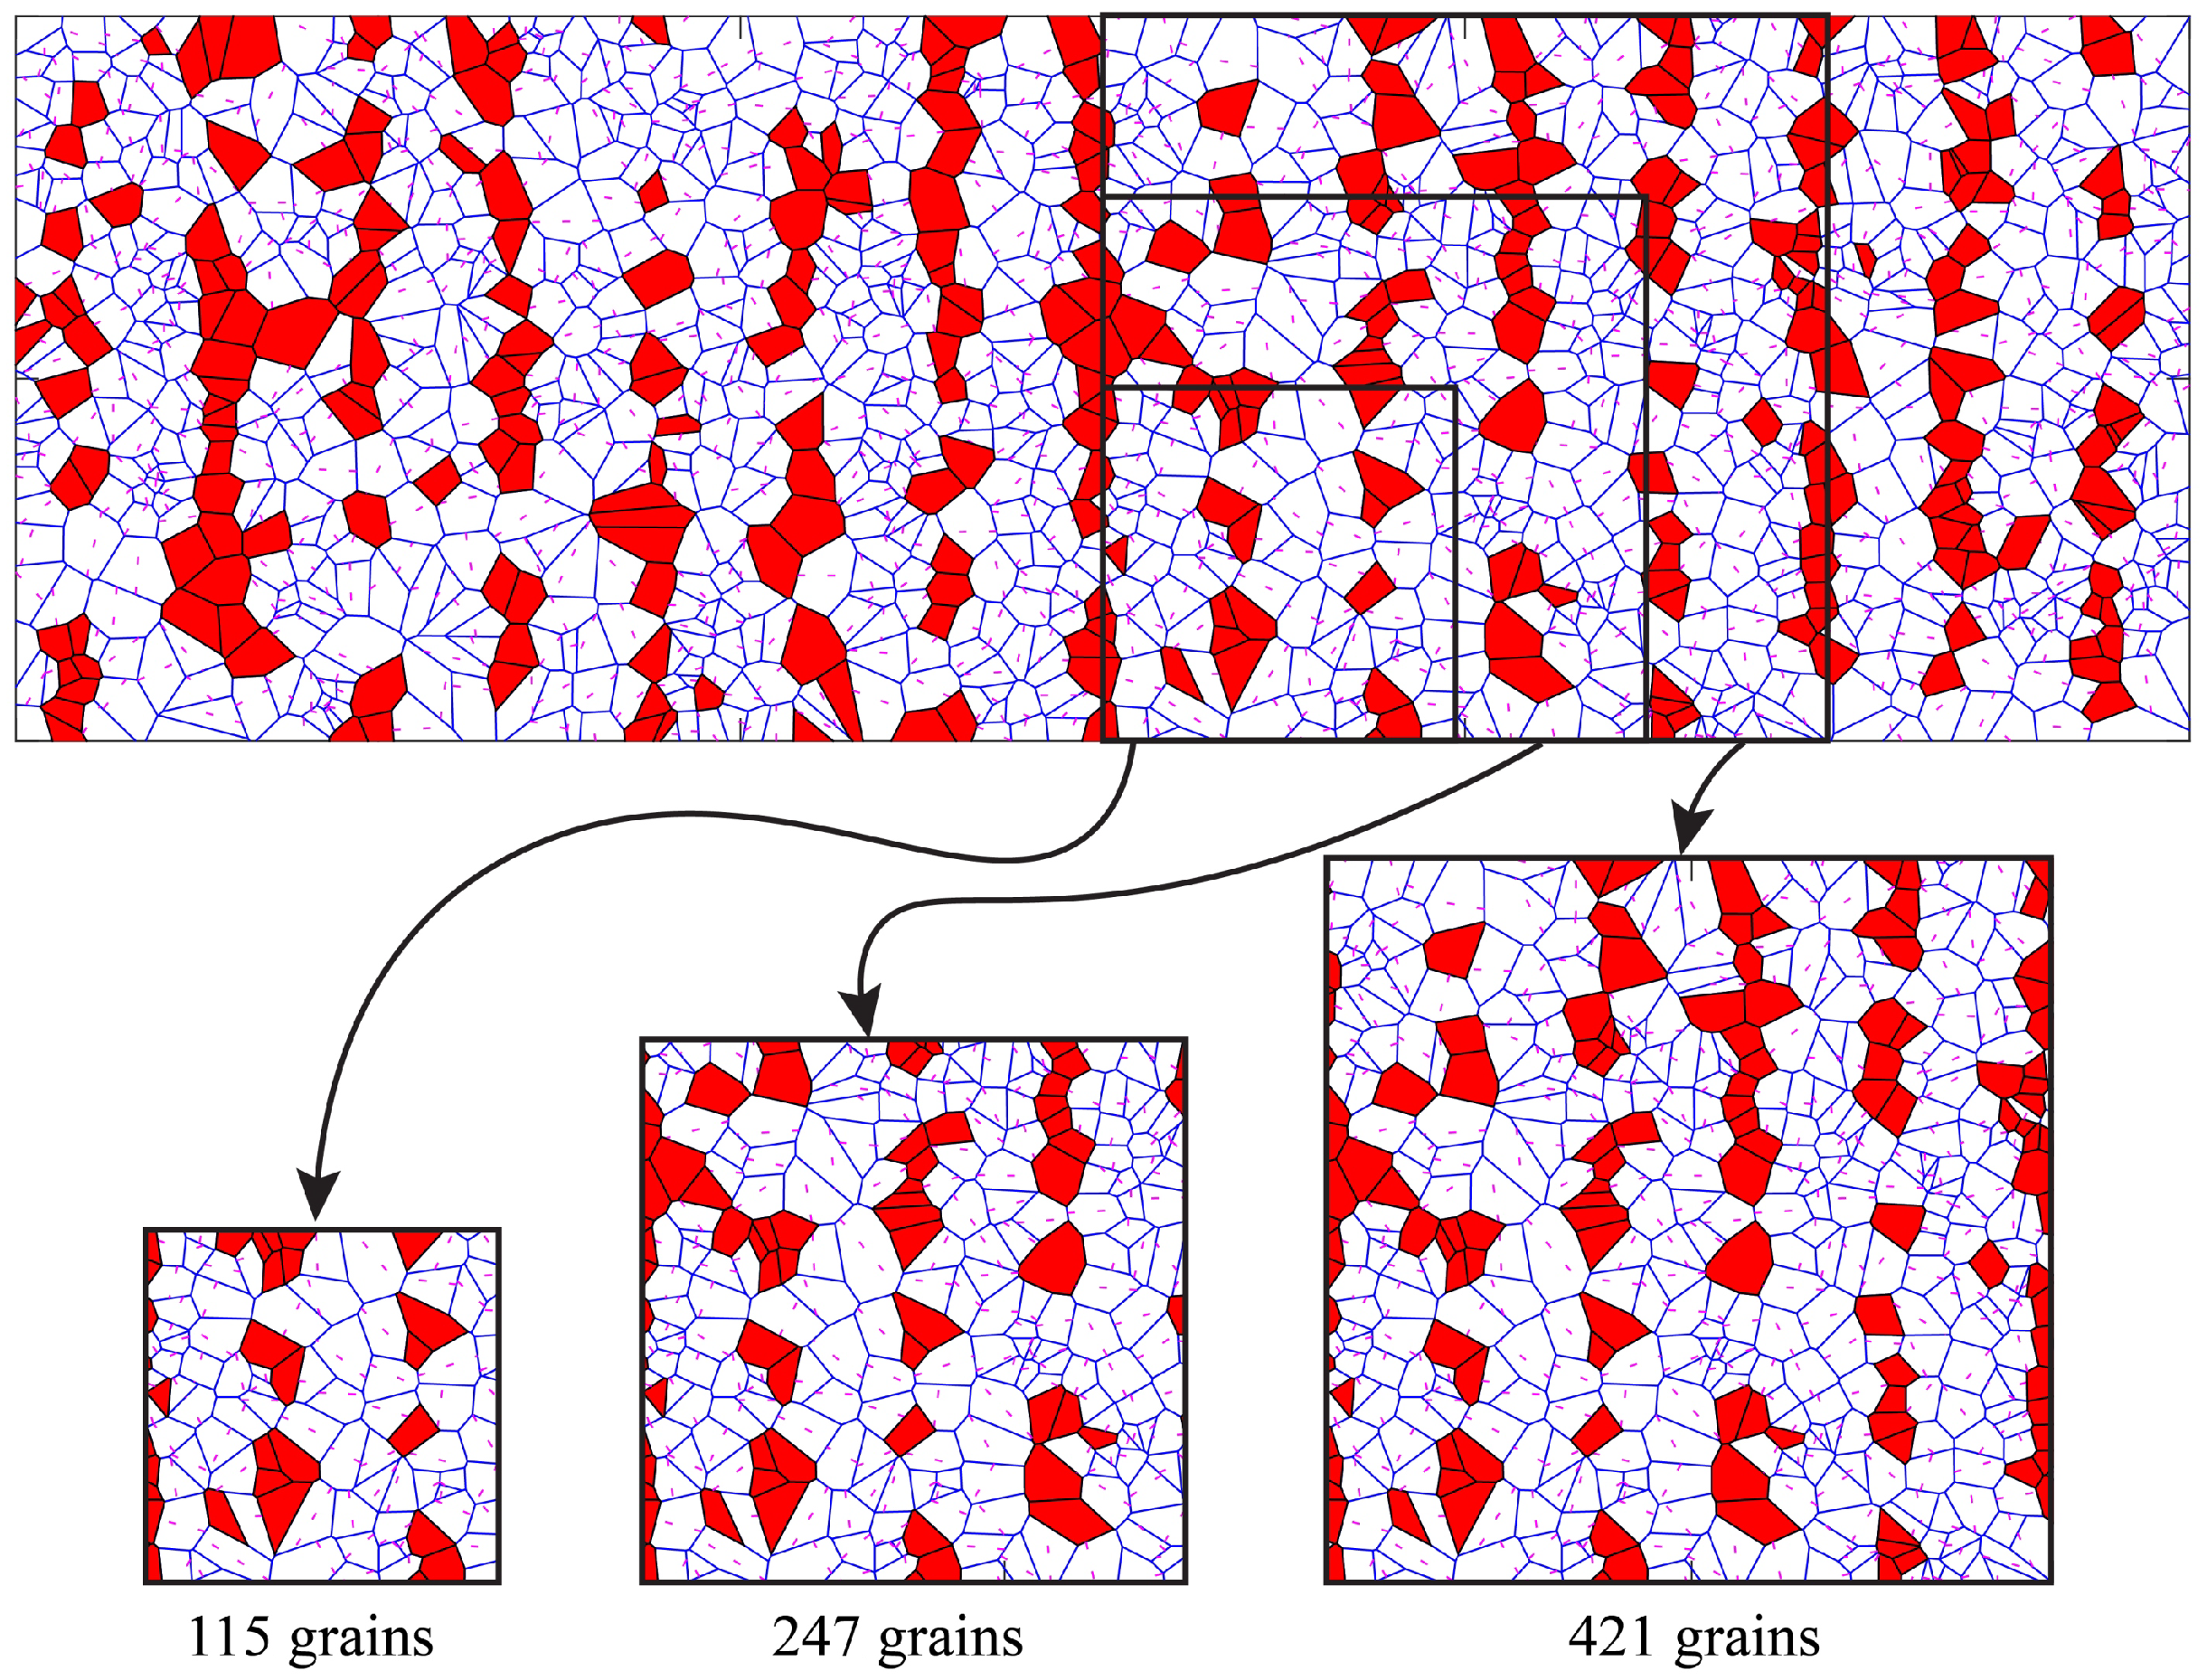
The 2D geometric model is generated in the same way as in the first approach, by a Python script, and it is meshed using the open-source software NEPER [31]. To consider the calculation efficiency, three different representative volume element (RVE) models are generated, containing 115 grains, 247 grains, and 421 grains, respectively, as shown in Figure 10. The calculation would be faster with fewer grains. After this, a Python script is written to set orientations and other material parameters for each grain in the model. At this moment, the orientations are also arbitrary.

3.2.2. Constitutive Equations

Based on Huang [11] and Kang et al. [32], a crystal plasticity constitutive model considering the cyclic hardening/softening effect is developed.
The overall deformation gradient tensor can be subdivided into elastic and plastic parts:
F = F e F p
Assuming that plastic deformation is attributed to slip only, we have
L p = α = 1 n γ α ˙ s α m α
where L p is the plastic part of the strain rate tensor, α stands for the slip system, and n is the total slip systems activated in the current model. s is the slip direction vector and m is the normal vector of the slip plane. The power-law relation proposed by Hutchinson [33] is used in this work, modified by adding a back stress term, a slip resistance term [32], and a cyclic hardening/softening term:
γ α ˙ = | τ α χ α | Q α + C α N N d s i g n ( τ α χ α )
where C α , τ α , χ α , and Q α are the cyclic hardening/softening term, resolved shear stress, back stress, and isotropic deformation resistance of slip system α , respectively, N and N d are material parameters. 〈〉 is the Macauley’s brackets:
X = X if X > 0 0 if X 0
The C α term is written as:
C α = S + K · e B · D · γ α 1 B
where S is the initial cyclic hardening/softening parameter, and D is the cyclic parameter, which will be explained in the next section. K and B are parameters controlling cyclic hardening/softening, and γ α is the cumulative slip strain of the α th slip system. The evolution of back stress χ and deformation resistance Q is characterized by
Q α ˙ = β = 1 n H α β | γ β ˙ |
χ α ˙ = A γ α ˙ A d χ α | γ α ˙ |
H α β = q H + ( 1 q ) H δ α β
where H α β is the hardening moduli, and q is a constant representing the ratio of latent over self-hardening moduli. A and A d are direct hardening and dynamic recovery coefficients, controlling the evolution of back stress. The hardening law proposed by Bassani and Wu [34] is adopted and simplified in this work:
H α α = h 0 h s s e c h 2 ( h o h s ) γ ( α ) τ s τ 0 + h s
H α β = q · H α α
where τ s , τ 0 , and h 0 are the stage I stress, yield stress, and the initial hardening modulus, respectively.
The microstructure of pearlite is more complicated than that of ferrite, which makes it difficult to predict plastic deformation using the finite element method. A direct modeling of pearlite was carried out by Berisha et al. [3] using a spectral solver developed by Roters et al. [35]. There are some different approaches based on homogenization techniques; for example, Ashton et al. [18] used the same constitutive model for both the pearlite and ferrite phase, with identical parameters except for the critical resolved shear stress; the simulation results showed good agreement with the experimental results. Based on the fatigue test results, no fatigue crack in the pearlite phase was observed, which made it possible to treat the pearlite phase as a homogeneous structure. Following Ashton et al. [18], the elastic constants of the ferrite phase are set to 70% of the pearlite phase, and other parameters are same as in the pearlite phase.
In this paper, two different FIPs are adopted based on previous works [25]. The first one is the accumulated equivalent plastic strain, which is defined as
F I P ϵ = 2 3 L P : L P 1 / 2 d t
The second FIP is defined as
F I P E = E = i = 1 n τ α γ α ˙ d t
where E stands for the overall stored energy in the current structure without considering mechanical dissipation, and τ α is the resolved shear stress for the α t h slip system, as mentioned before.

3.2.3. Parameter Calibration

There are over a dozen parameters that need to be calibrated in this approach. The fatigue tests conducted in this work are under 500 °C, the elastic modulus at this temperature is 0.899 times that at room temperature (listed in Table 2), the elastic constants at room temperature of ferrite ( C 11 , C 12 , C 44 ) can be obtained from [3], and the constants at 500 °C can be calculated. There are 12 parameters left to be determined; each parameter has an impact on the simulation results, which makes it difficult to calibrate all these parameters together.
Several works have been done for calibrating CPFEM parameters. For example, Bandyopadhyay et al. [36] developed an algorithm by combining MATLAB and ABAQUS to automatically calibrate parameters. Du et al. [20] determined some parameters by analyzing the model first, and then made some assumptions for the remaining parameters, and determined all parameters by varying them slightly to fit the experimental results. Since the CPFEM model developed in this work is applied to multiple cycles, parameter calibration needs to be done for all simulation cycles; thus, it is more convenient to make assumptions for some parameters at the beginning and then calibrate them based on the results. The material constants N and N d in Equation (7) control the slip rate predominantly; therefore, these two parameters should be settled first. Following previous work [37], an initial guess of N = 20 MPa and N d = 50 is made. The rest of the parameters are also set to initial values, as discussed in the following paragraph. Since N and N d only affect the flow rule of the material, after running several simulations, a stress–strain curve similar to the experimental result is obtained, and the N and N d are adjusted to 22.8 MPa and 18.8 , respectively. In the following calibration process, these two parameters will not change.
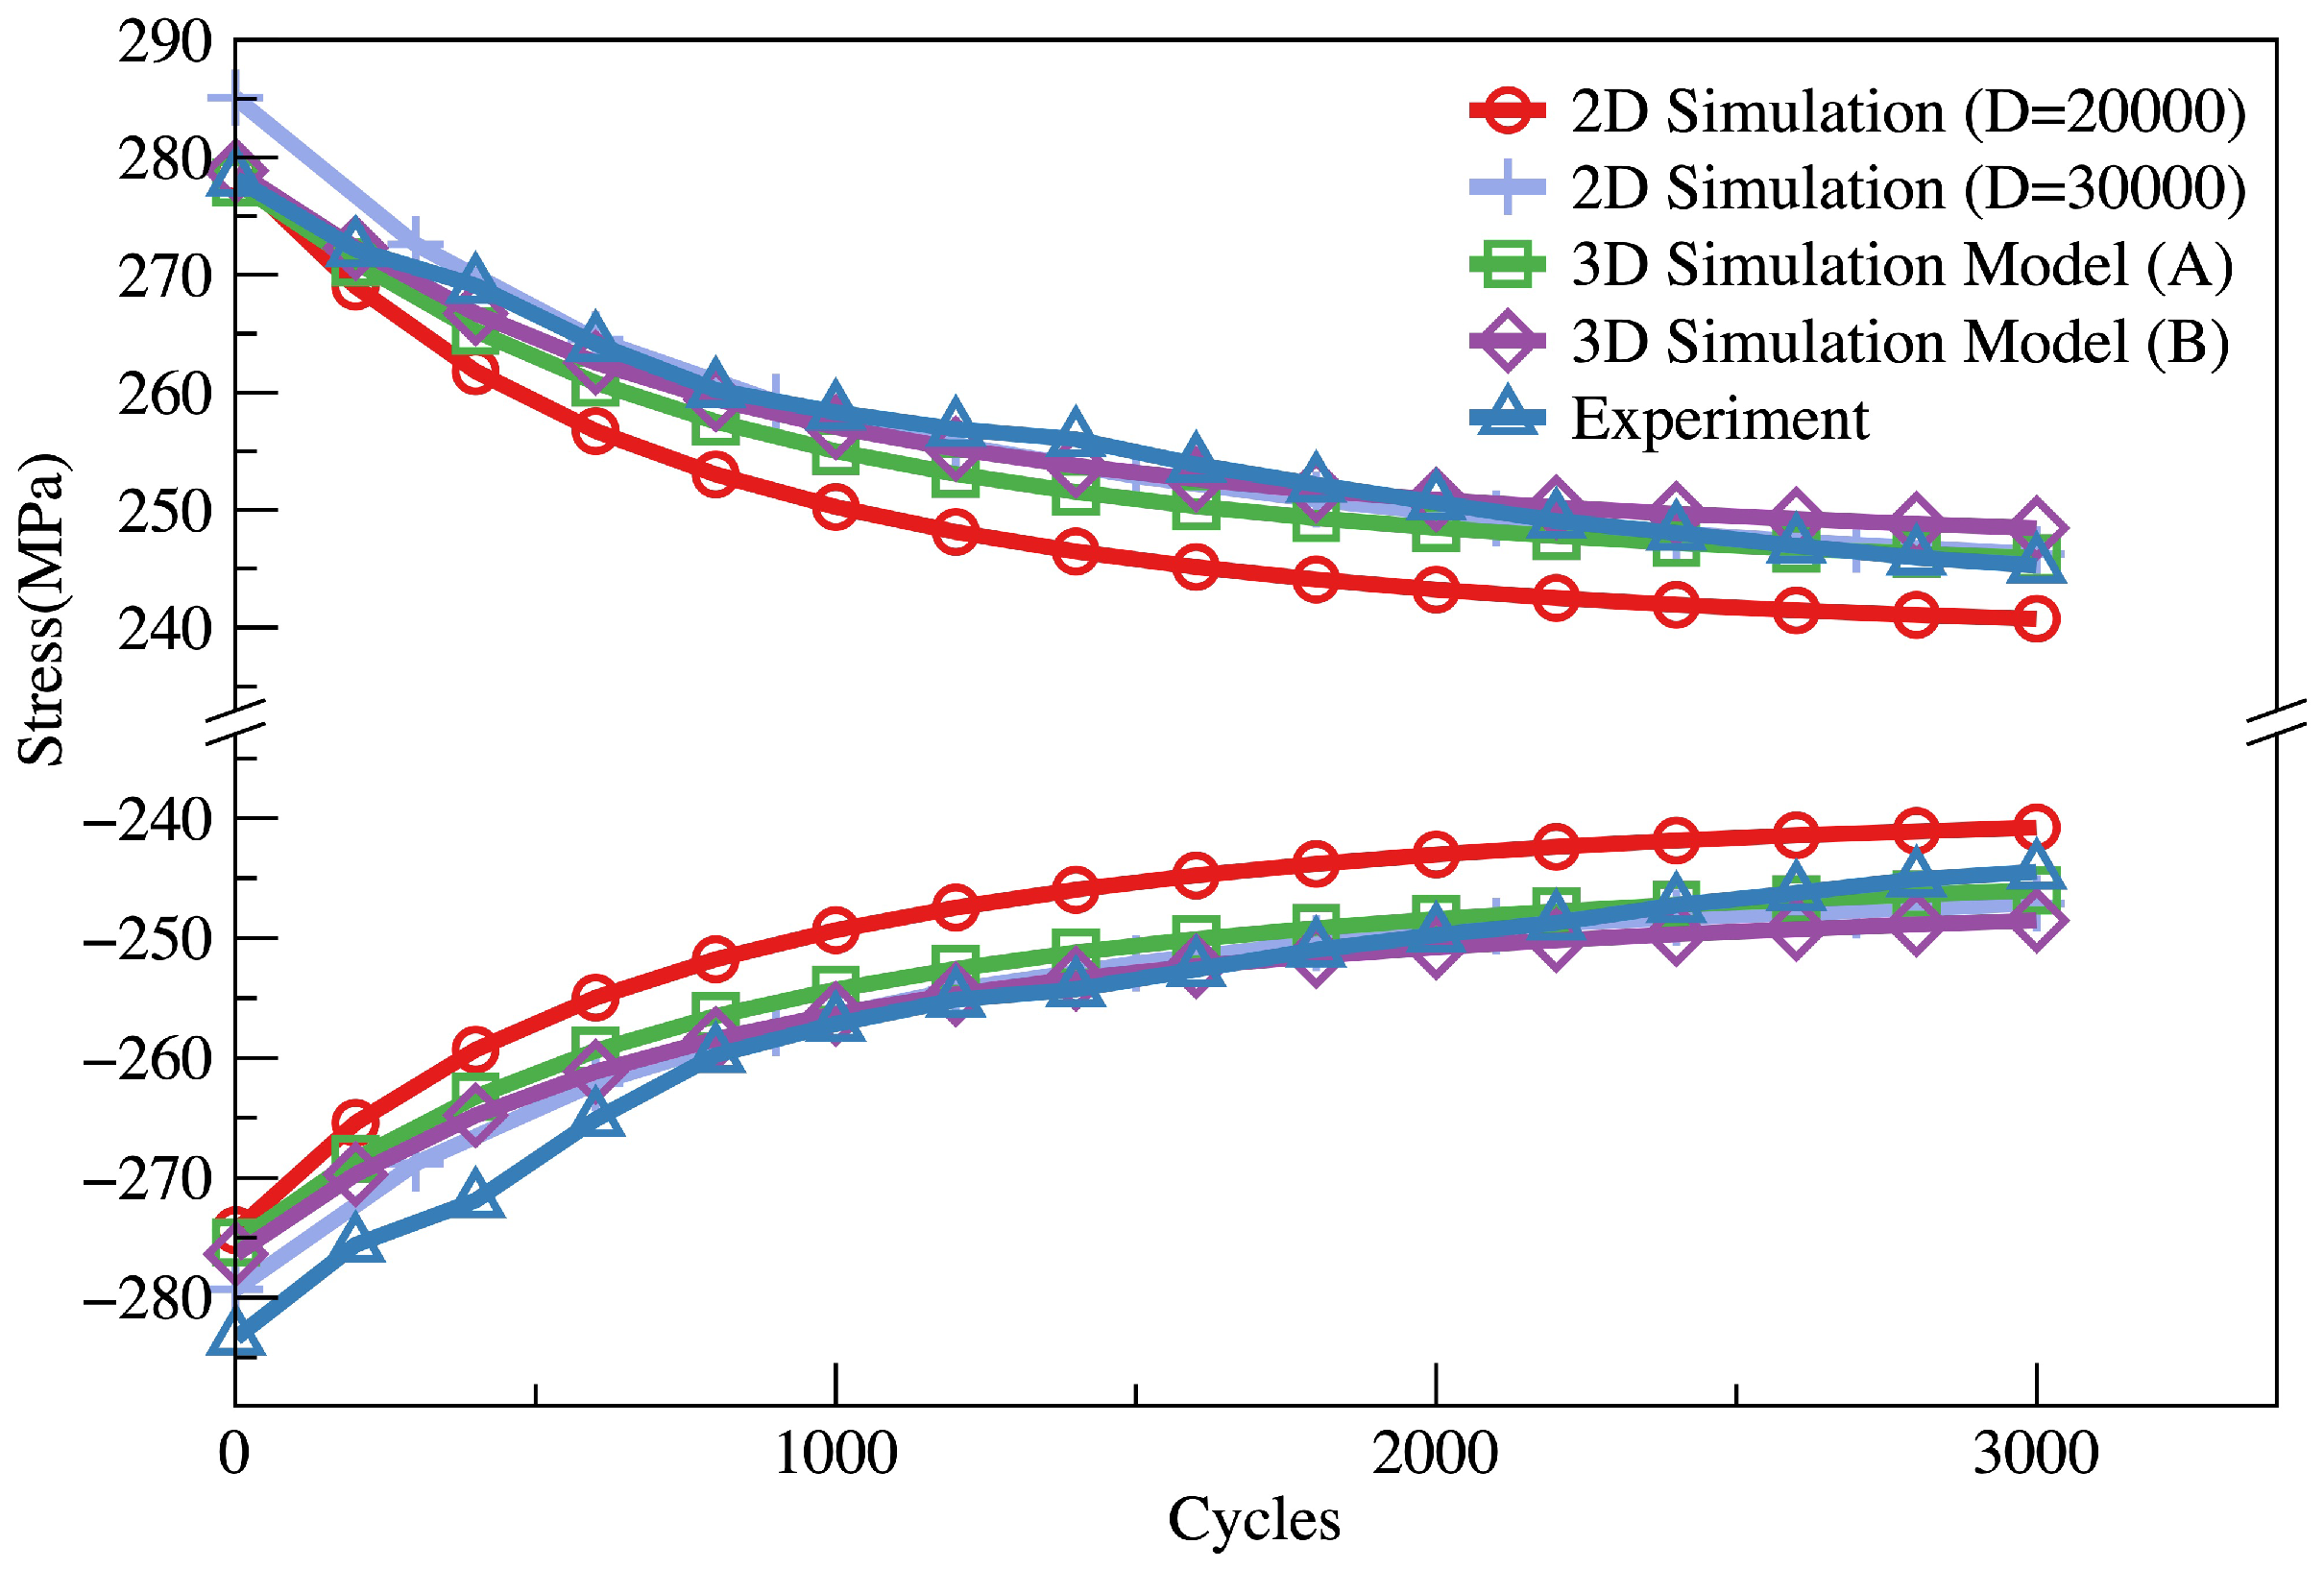
As mentioned in the Introduction, there are three sets of slip systems in ferrite, but a recent investigation showed that only { 110 } 111 and { 112 } 111 were activated during deformation, and the mechanical properties of these two systems were similar. Therefore, the activated slip systems are set to { 110 } 111 and { 112 } 111 with identical mechanical properties. In Equations (9) and (11), the back stress term and the cyclic term are affected by the slip rate and cumulative slip strain. To determine the parameters in both terms, a simulation without a cyclic term and back stress term (i.e., C α = 0 and χ α = 0 in Equation (7)) is conducted and the average cumulative strain of 24 slip systems is measured in each increment during the whole process. Results indicate that the average cumulative strain increases 1 × 10 4 after each cycle. In this work, only the first 3000 cycles of the experiment are investigated based on the analysis of the first approach. Considering computational efficiency, it is impractical to calculate 3000 real cycles using CPFEM; hence, the cyclic parameter D is introduced, which can scale the cumulative strain in each increment, making it possible that each cycle of CPFEM simulation represents 200 cycles of actual tests. The cyclic parameter D in Equation (9) should be set to 200 to scale the cumulative strain; however, the value of 200 times γ α after each cycle is still too small. For the convenience of the parameter calibration procedure, D is defined as the cyclic parameter times 100; in this case, D is set to 2 × 10 4 . The initial cyclic hardening/softening parameter S in Equation (9) is defined randomly but at a relatively small value to avoid a zero or negative value of C α ; K is the factor controlling the value of C α —in other words, C α increases as K increases. B controls the concavity and convexity of C α , which is determined to be a negative value based on the peak and valley stress evolution of the specimen shown in Figure 11. The precise values of K and B are calibrated by fitting the simulation results to the experimental results.
h 0 and h s in Equation (13) control the hardening effect; previous work [37] has shown that a simplified hardening law is effective to simulate the hardening effect. In this work, h 0 is set equal to h s ; therefore, only one parameter needs to be calibrated in Equation (13), which can be done by fitting the tensile stress–strain curve of the simulation results to the experimental results. An assumption is made that the interaction parameter q = 1.4 [3,20].
The parameters in the back stress term, i.e., A and A d in Equation (11), cannot be determined directly based on the slip rate. Since the back stress is not the main purpose of this work, the initial values of A and A d are set to 100 and 10, respectively. The parameter Q in Equation (7) represents the initial slip resistance, affecting the slip rate jointly with other parameters in Equation (7). At this time, all parameters except Q, A, and A d are already determined; a few simulations are carried out to calibrate the three parameters left. All calibrated parameters in this work are listed in Table 5.

3.2.4. Simulation and Results

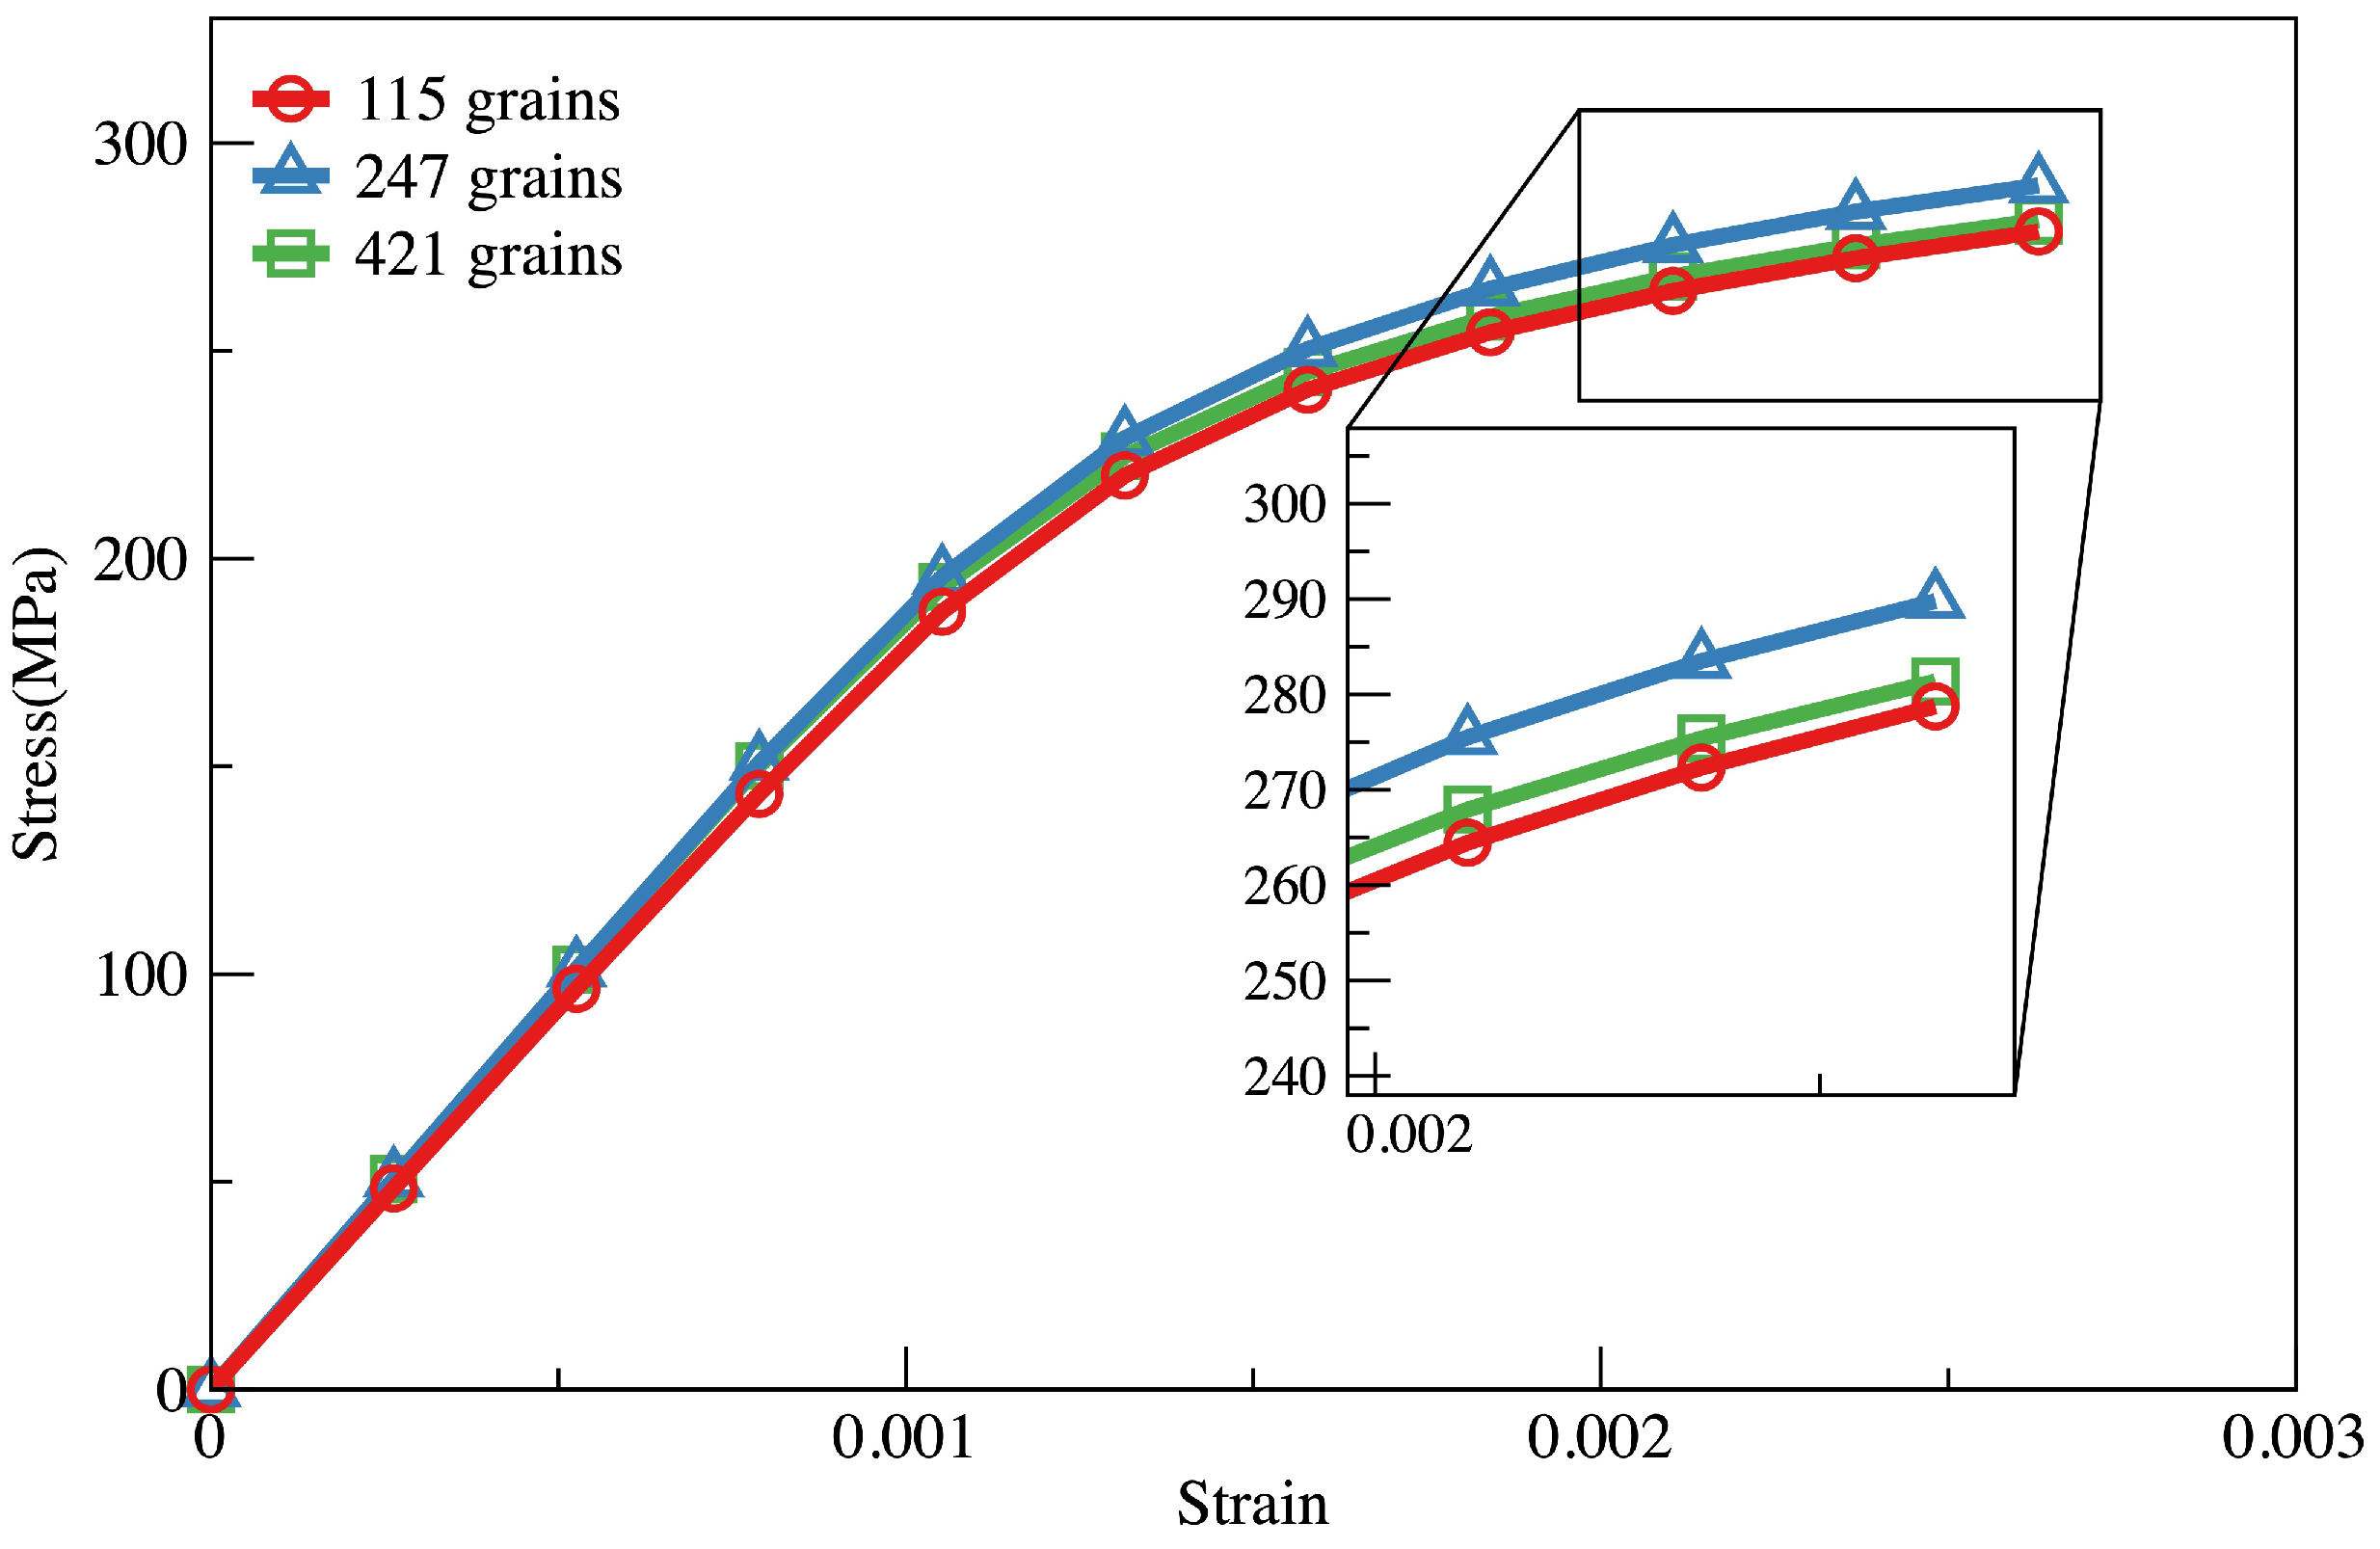
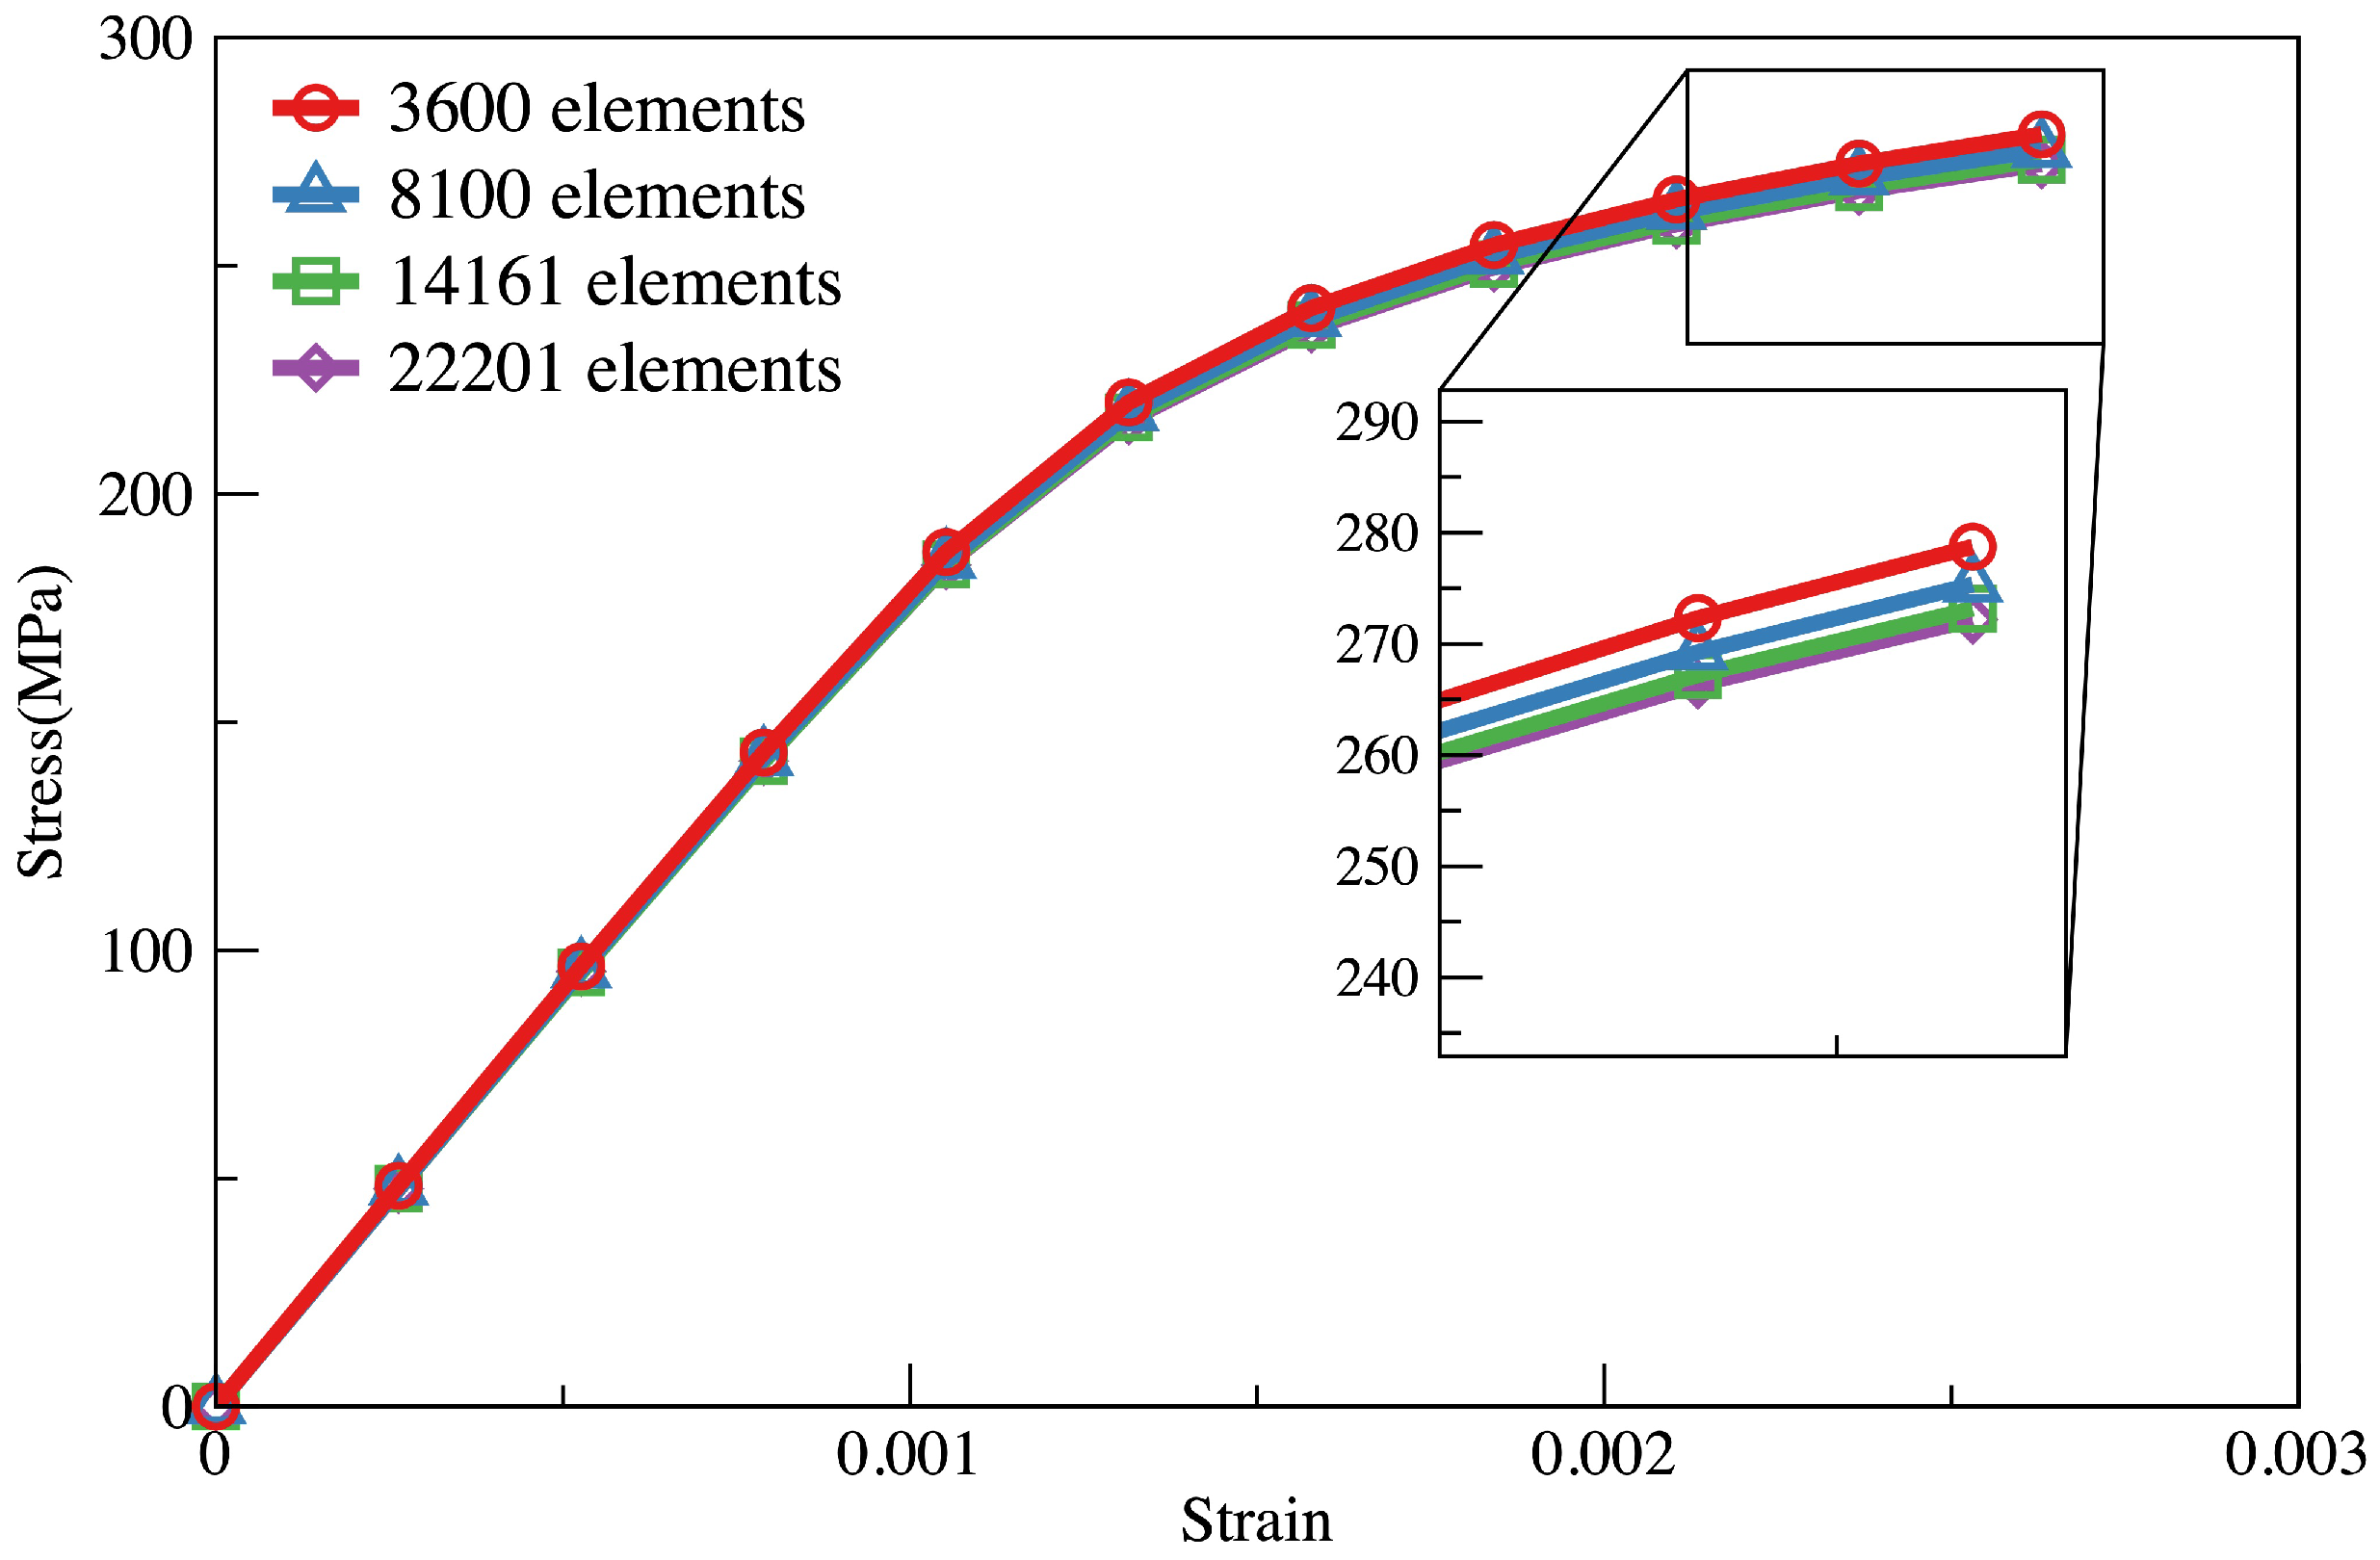
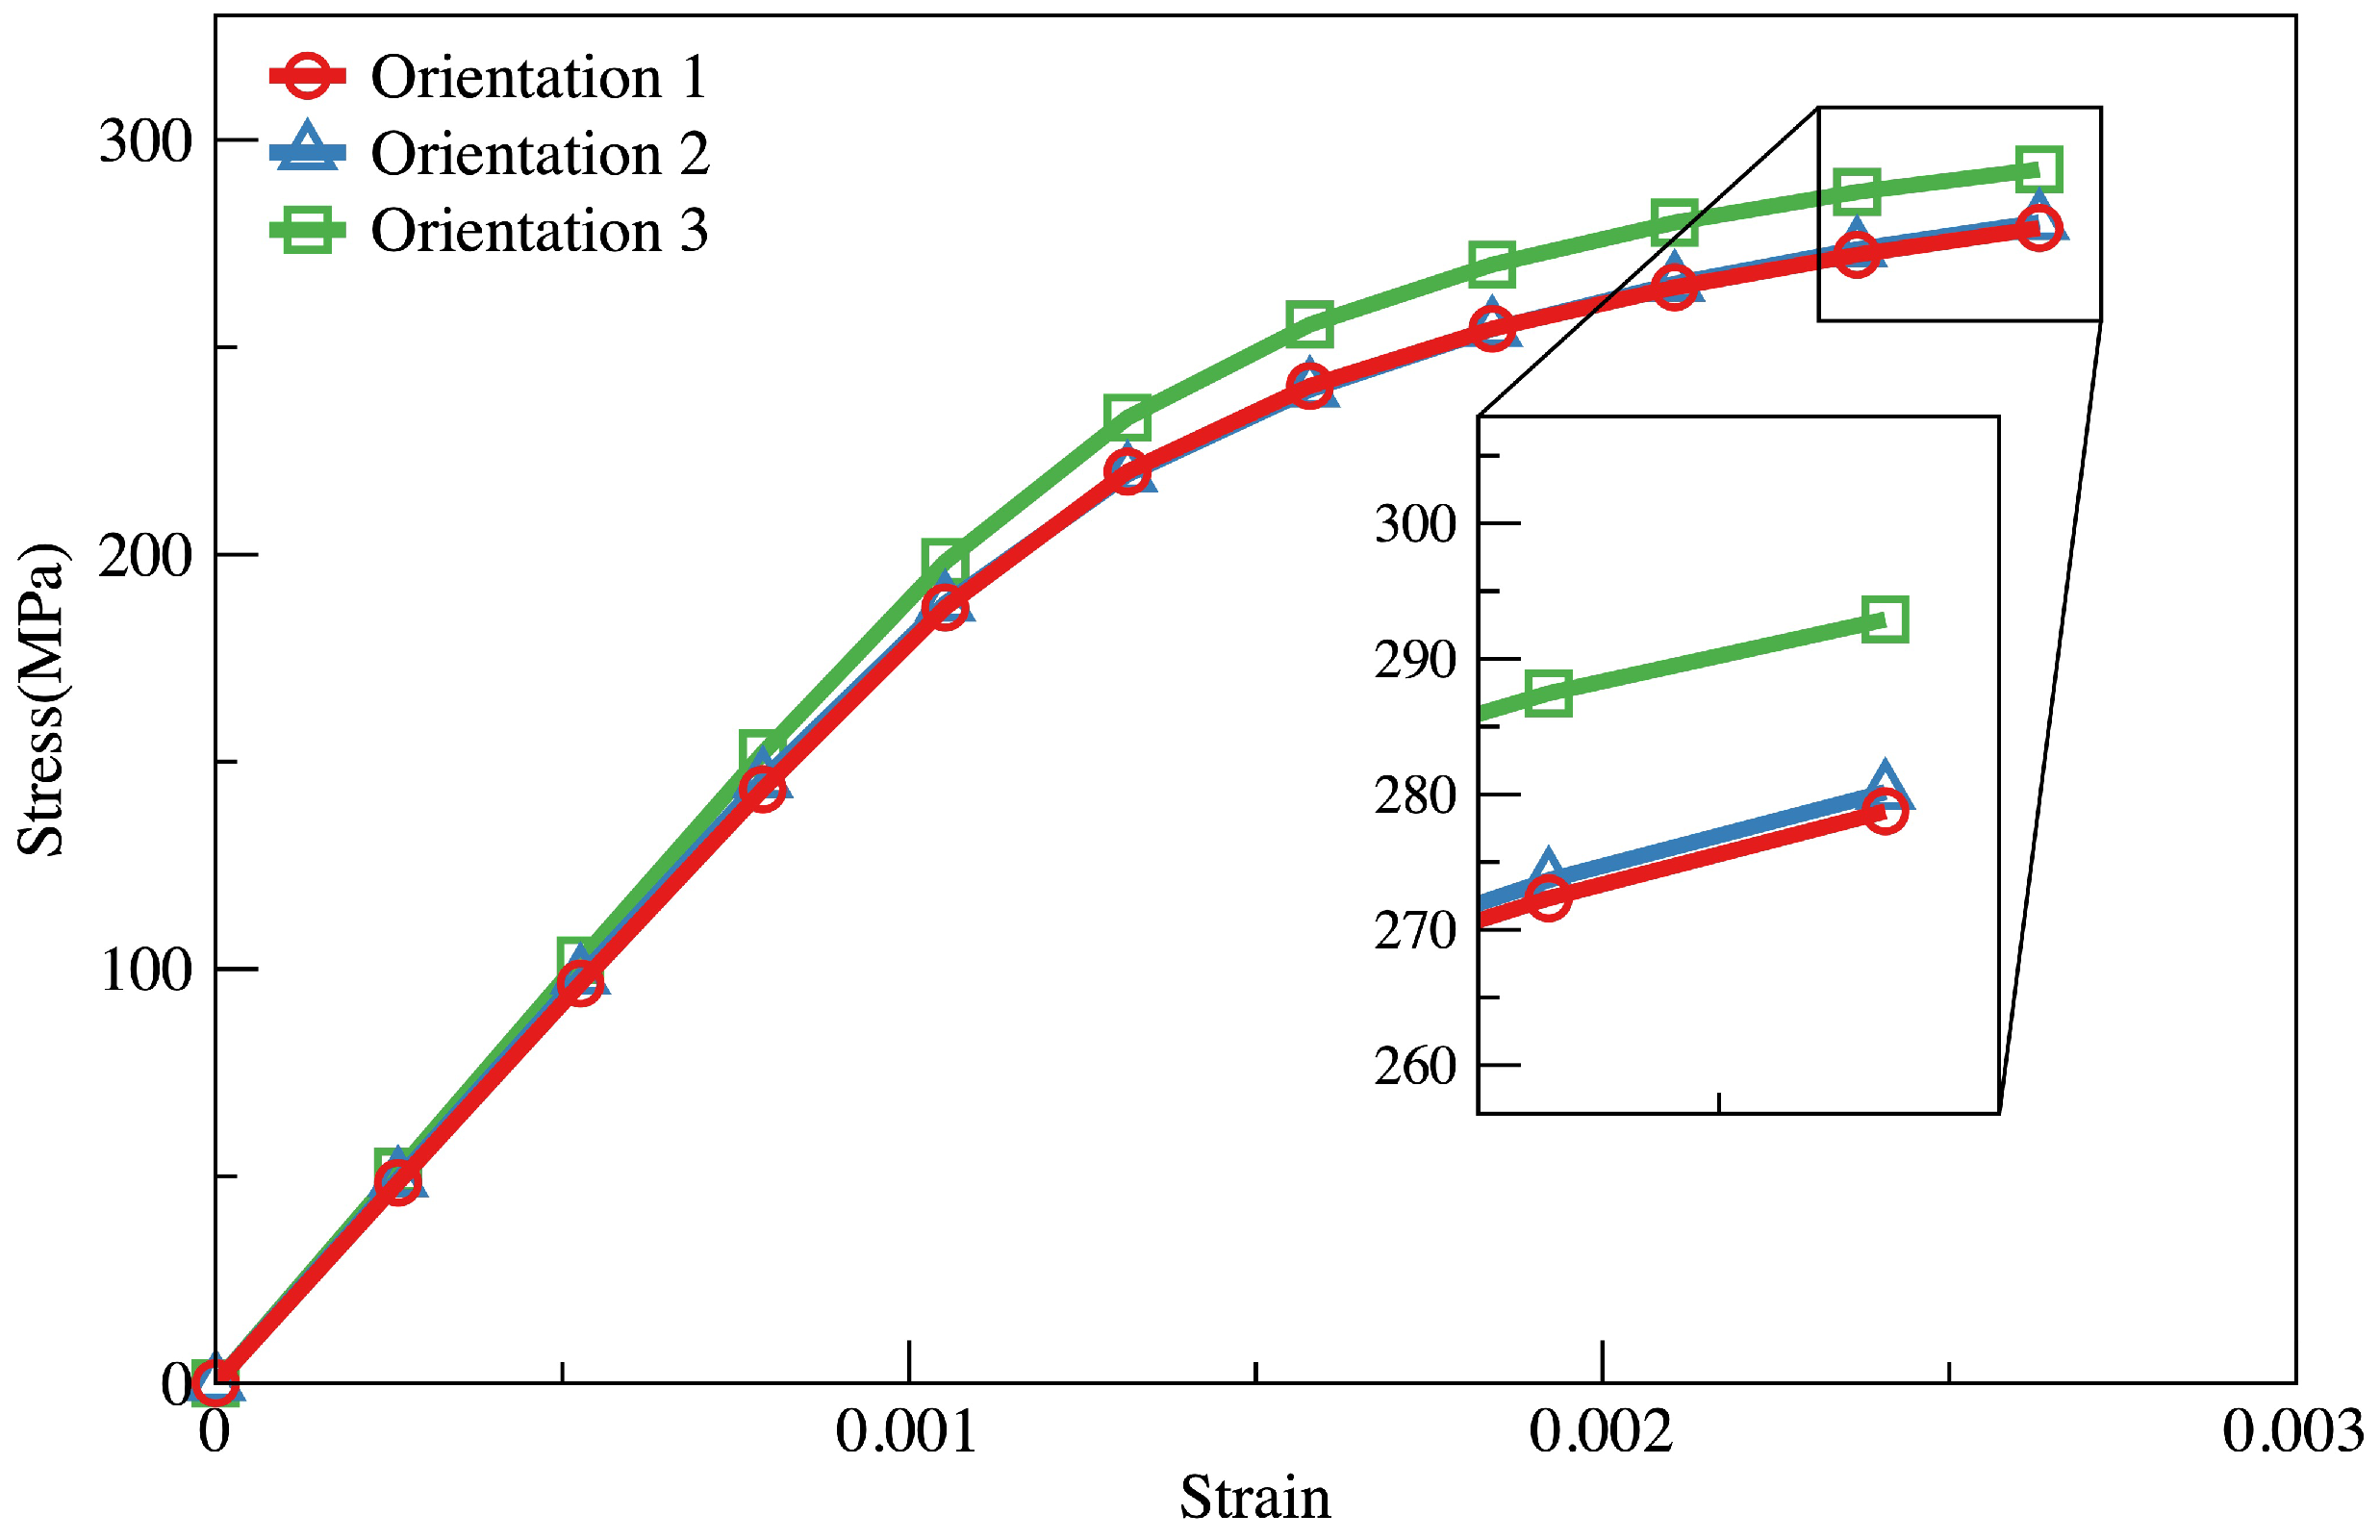
Firstly, a series of simulations are carried out to investigate the influence of RVE size, and three models are chosen, shown in Figure 10. Periodic boundary conditions are assigned to each side of the RVE models and cyclic strain with 0.263% amplitude is applied, corresponding to the experimental conditions; the results are shown in Figure 12. In this approach, stress–strain curves are calculated by multiplying the stress and strain at each integration point by the volume of the point and summing them, and then dividing this by the total volume. The integration volume is obtained from the ABAQUS field output file, and a Python script is written to perform the calculation. In a 2D model, “volume” means “area”. Based on the results, the overall stress–strain curves of the three RVE models are slightly different from each other. The stress–strain results of the models with 115 grains and 421 grains are very close, but a slight deviation is observed in the 247-grain model. As discussed in the previous section, the orientation of each grain is random. In order to investigate the influence of model size, the same random seed is assigned to the three models using NumPy [38]. Therefore, the orientation of the same parts in the three models is identical, but the rest of the parts are different. In other words, all three models contain part of (or whole) 115 grains, and the authors can only guarantee that the orientations of 115 grains in the three models are identical. As a result, the stress–strain responses of the three models are different, but the difference is acceptable. Under the consideration of computational efficiency, the RVE model containing 115 grains is adopted. After the size of the RVE model is determined, another series of simulations are carried out to investigate the influence of mesh size. The RVE model is meshed by four different Relative Characteristic Lengths (defined in [31]) containing 3600 elements, 8100 elements, 14,161 elements, and 22,201 elements, respectively. The simulation results are shown in Figure 13, and the model containing 3600 elements is satisfactory. Finally, the simulation is conducted three times to evaluate the influence of grain orientation; three random orientation distributions are assigned to the model. The different orientations are achieved by assigning different random seeds to the three models (numpy.random.seed [38]).The results are shown in Figure 14, which indicates that the influence of orientation for the stress–strain curve is not significant.
In this paper, CPFEM simulation is conducted for 16 cycles, each representing 200 cycles in the fatigue experiment. Table 6 lists the correspondence of cycles between experiment and simulation.
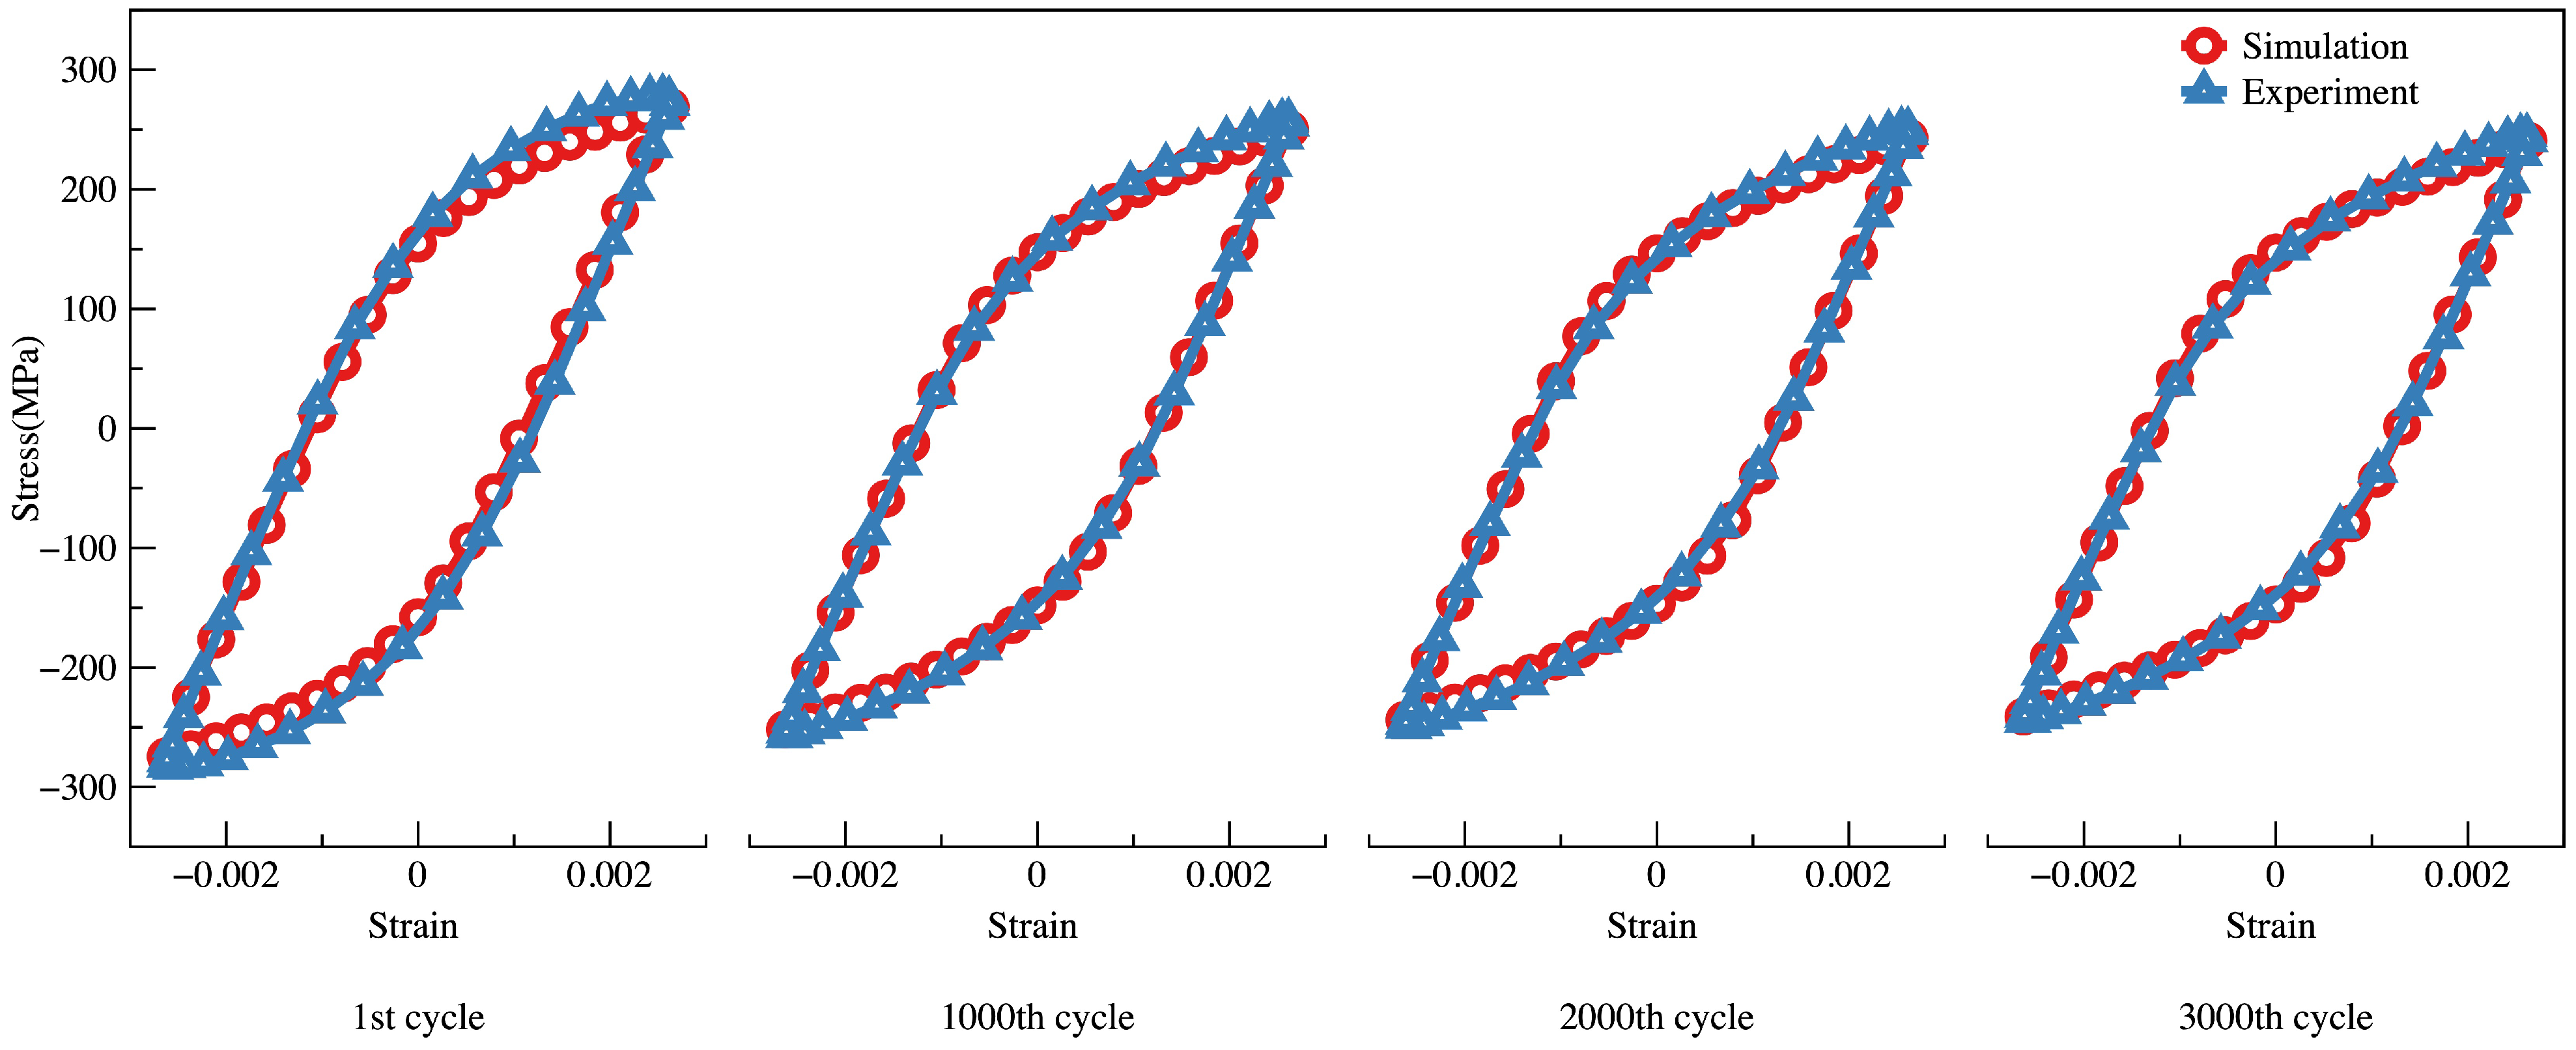
The hysteresis of the simulation and experiment is shown in Figure 15; the simulation results of the first, 6th, 11th, and 16th cycle and the corresponding experimental results are shown here, representing the first, 1000th, 2000th, and 3000th cycle. The evolution of peak and valley stress is shown in Figure 11. In Figure 15, the back stress and flow stress calculated by CPFEM fit the experimental results very well, indicating that the back stress term (Equation (11)) and the simplified hardening term (Equation (13)) are valid. The evolution of the peak and valley stress values is also in good agreement with the experiment, which means that the constitutive model developed here is suitable for predicting the cyclic hardening/softening effect. It is noteworthy that the cyclic hardening/softening effect is introduced by reducing the strength of the crystal, explained in Equations (7) and (9). To demonstrate the validity of the two equations, another simulation is carried out with D changed from 20,000 to 30,000, while other parameters remain unchanged. The results indicate that each cycle in CPFEM is able to represent 300 cycles in the experiment, as shown in Figure 11 and Figure 16.
Crack density and crack initiation life are determined by FIPs. The distributions of the two FIPs ( F I P ϵ and F I P E ) are similar, as shown in Figure 17 and Figure 18. Areas with relatively high FIP values are more likely to be the crack initiation area. Both FIPs in the pearlite phase are set to zero because no crack is observed in it. Different crack initiation positions are observed, which are F-PGBs (marked with polygons), F-FGBs (marked with circles), and PSBs (marked with rectangles). Attempts have been made to determine the crack initiation life by setting critical values for the two FIPs, i.e., once the FIP value of an integration point reaches the critical value, it is cracked. To demonstrate the validity of the FIPs, critical values are set to 0.26 for F I P E and 48.0 for F I P ϵ to ensure that the crack density is nearly 6% at 3000 cycles, as shown in Figure 9. The evolution of crack density calculated from both FIPs is not in accordance with the experimental result, which is an expected phenomenon, because both FIPs are calculated based on the slip rate (defined in Equations (6), (15) and (16)), which is obtained from Equation (7). In Equation (7), the slip rate is positive when the value in the brackets is greater than zero, N and N d are invariant, C α increases to the same value for all grains, and τ α is calculated based on the Schmid factor, which changes slightly during simulation. Therefore, as long as the slip rate is positive at an integration point, the values of F I P ϵ and F I P E will continue to increase, even if its stress is relatively low (less than critical resolved shear stress). This is incorrect because stress is also an important aspect of crack initiation, which means that it is difficult to determine the fatigue crack initiation life based on the previous two FIPs in this approach.
In order to predict the crack initiation life, another FIP is proposed by modifying F I P ϵ , explained as follows:
F I P e f f = 2 3 L e f f P : L e f f P 1 / 2 d t
L e f f P = α = 1 n γ α ˙ s α m α τ e f f α
τ e f f α = τ α τ c α i if τ α > τ c α 0 if τ α 0
where τ is the resolved shear stress and τ c is the critical resolved shear stress; i is a constant controlling the influence of the resolved shear stress on F I P e f f .
In this FIP, the accumulated equivalent plastic strain is modified. An assumption is made that the resolved shear stress and slip deformation affect fatigue crack initiation together. In this CPFEM model, according to Equation (7), slip deformation occurs under not only high resolved shear stresses (greater than critical resolved shear stress) but also relatively low stresses (less than critical resolved shear stress); therefore, the slip deformation under low stresses should not be considered in the FIP. To this end, the effective resolved shear stress τ e f f is invoked in Equation (19), and the effective plastic strain rate tensor is written as Equation (18), which indicates that the contribution of the slip rate to fatigue cracking is different due to the resolved shear stress.
In the first approach, the critical resolved shear stress is set to 0.1% of the shear modulus (in Equation (1) τ c = 81 MPa and G = 81 GPa), which is a conservative assumption, because only one slip system is adopted in each grain, and the critical resolved shear stress must be set to a relatively low value in case some activated slip system is neglected (according to Equation (1)). In this approach, the critical resolved shear stress is set to 121.5 MPa, which is 1.5 times that in the first approach. As shown in Equation (7), the slip rate is calculated by some parameters. Theoretically, crystals will not slip if the shear stress does not reach the critical value. However, Equation (7) cannot map this situation accurately, which means that some slip deformation under low shear stress exists, and a number of CPFEM models have the same drawback [11]. This phenomenon may not influence the stress–strain response (as shown in this work, the results are in good agreement with experiments), but it affects the FIP values because the FIP strongly depends on slip deformation. Therefore, in order to eliminate the contribution of the “invalid slip deformation”, a larger estimation of the critical resolved shear stress is made, which is 1.5 times that in the first approach, and it gives a good result for crack density prediction. The distribution and evolution of F I P e f f are shown in Figure 19 (pearlite phase is also neglected). As with the previous two FIPs, F I P e f f is also suitable for predicting crack initiation positions. To calculate the fatigue crack initiation life, the critical value of F I P e f f is set to 0.011 to ensure that the crack density equals 5.9% at the end of the simulation. In order to investigate the influence of orientation on crack density, another orientation distribution is assigned to the model; the critical value of F I P e f f is also determined following the same step. The crack density evolution is shown in Figure 9 and the critical values are 0.011 and 0.0115 for the two orientation distributions, respectively.
A phenomenon is observed in the magnification box of Figure 9 wherein parts of the FIP curves are flat; the explanation is as follows. According to Equation (19), if the stress is relatively low, the increment in the FIP is zero. As shown in Figure 20, the corresponding stress and strain of the flat parts are relatively low, which are near 200 MPa to 150 MPa of stress and 0.0015 to 0.001 of strain; therefore, the increment in the FIP at these parts should be zero. The threshold values of stress and strain are not symmetric, which may be caused by hardening and back stress effects.

3.2.5. 3D Geometric Models

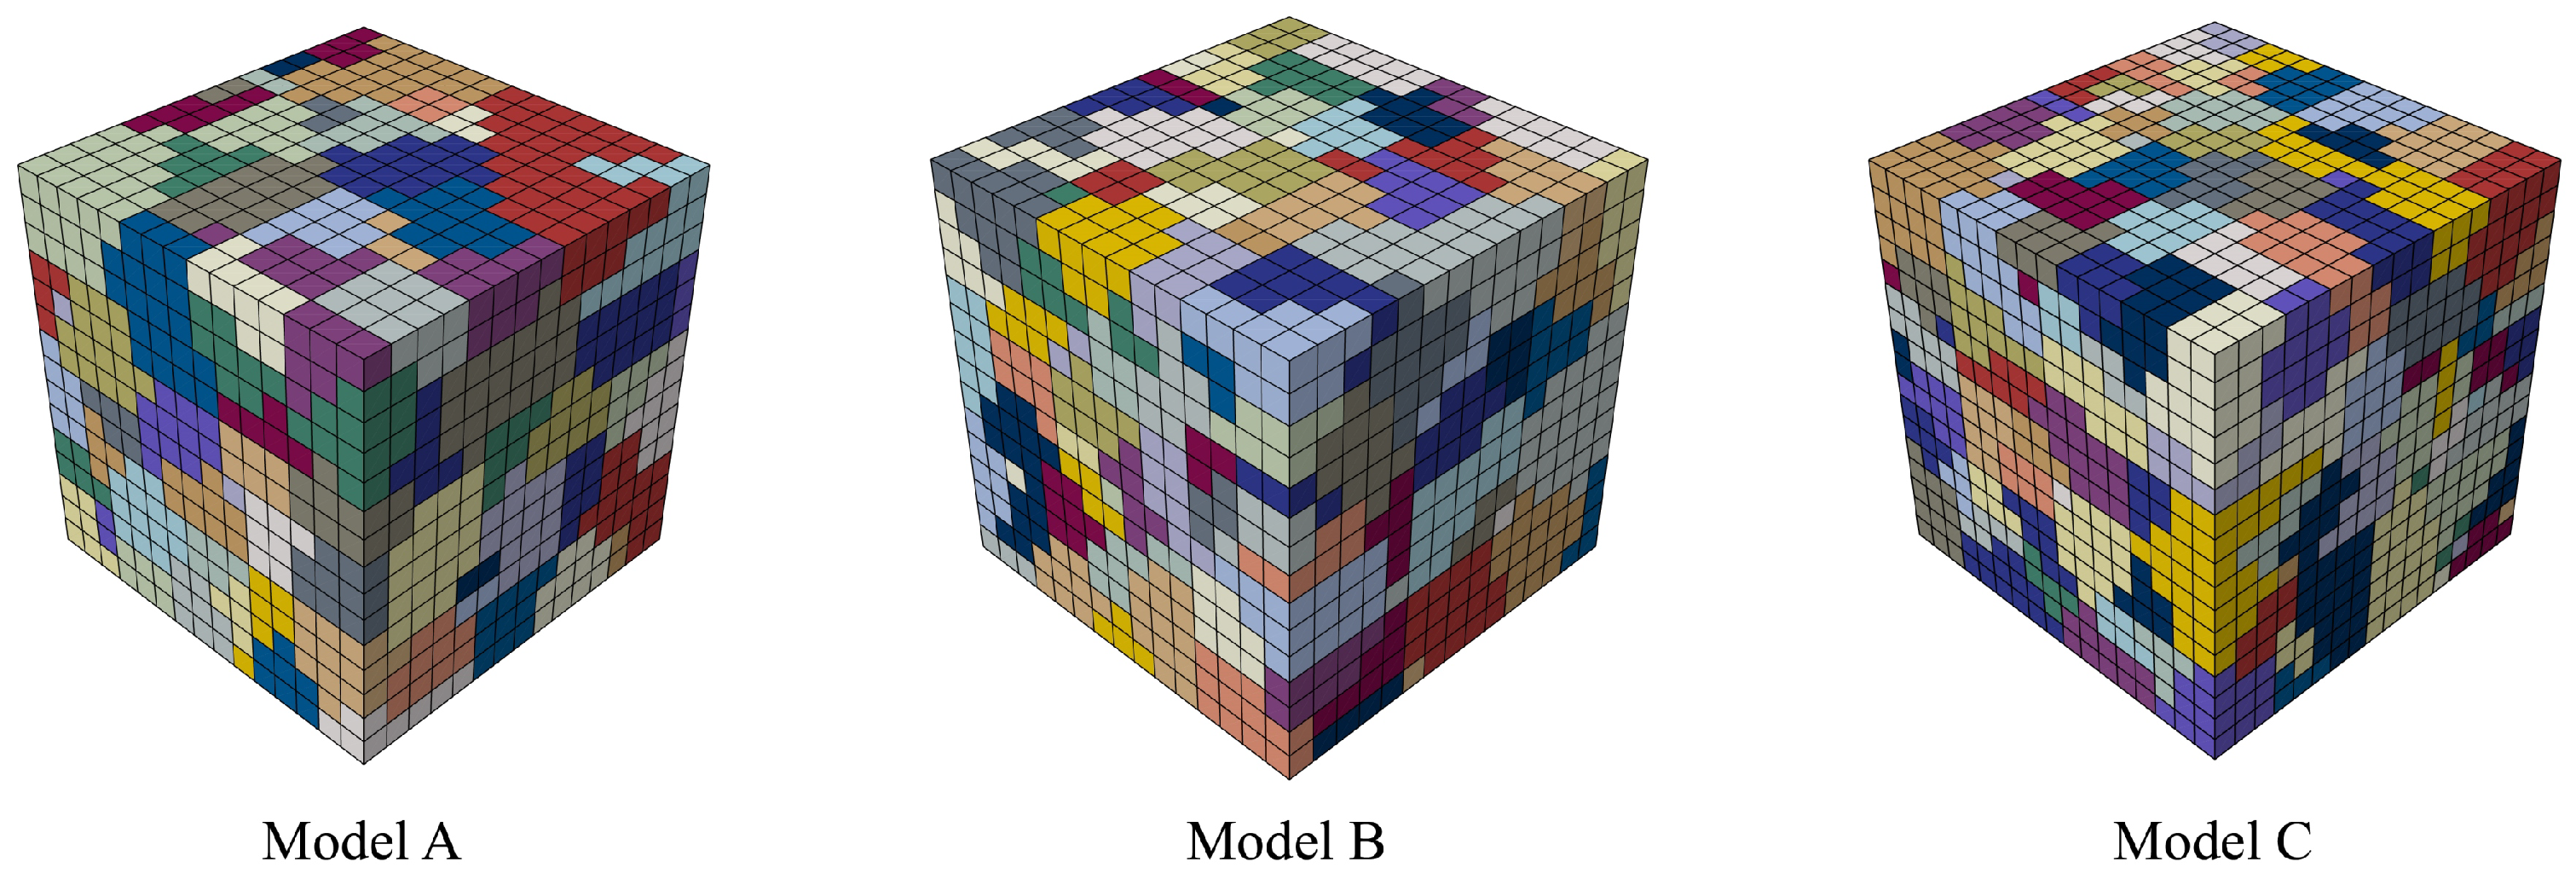
Here, 3D geometric models are also generated and meshed by open-source software NEPER [31]. Three models are generated with 200 grains and 300 grains (shown in Figure 21), containing 3375 elements and 4913 elements, respectively, and the element type is C3D8 (3D 8-node brick element). As discussed in previous work [22], the computations are rather intensive in 2D CPFEM simulations, and when moving to 3D models, the computing time is different by several orders of magnitude. For instance, the smallest 2D model in this work contains 115 grains and 3600 CPS4 elements; a simple calculation shows that if a cubic model represents the same area, it should contain approximately 1200 grains and 216000 C3D8 elements, and the computing time will increase hugely. Therefore, we use 2D models as a simplification procedure to calculate the distribution of FIPs and other details. Here, 3D models with relatively coarse meshes and fewer grains are adopted to calculate the averaged stress–strain response to demonstrate the validity of the CPFEM model. In this work, the computational time of Model (A) is 14 times that of the 115-grain 2D model.
In Equation (7), the shear stress affects the slip rate significantly. With the element type changing from CPS4 to C3D8, the stress will also change. Therefore, the parameters in Equation (7) need to be recalibrated. By fitting the simulation to the experimental result, N is changed from 22.8 to 110, and all other parameters remain unchanged. The increase in N is expected because the 2D models are simplified structures using plain stress elements to represent three-dimensional structures, and stress components σ x z , σ y z , and σ z z are ignored. Since the slip rate in Equation (7) is calculated by the shear stress (determined by Equation (20)), the slip rate calculated by the 2D models is smaller than that obtained by the 3D models. Thus, the associated parameters need to be recalibrated.
τ α = m α · σ · s α
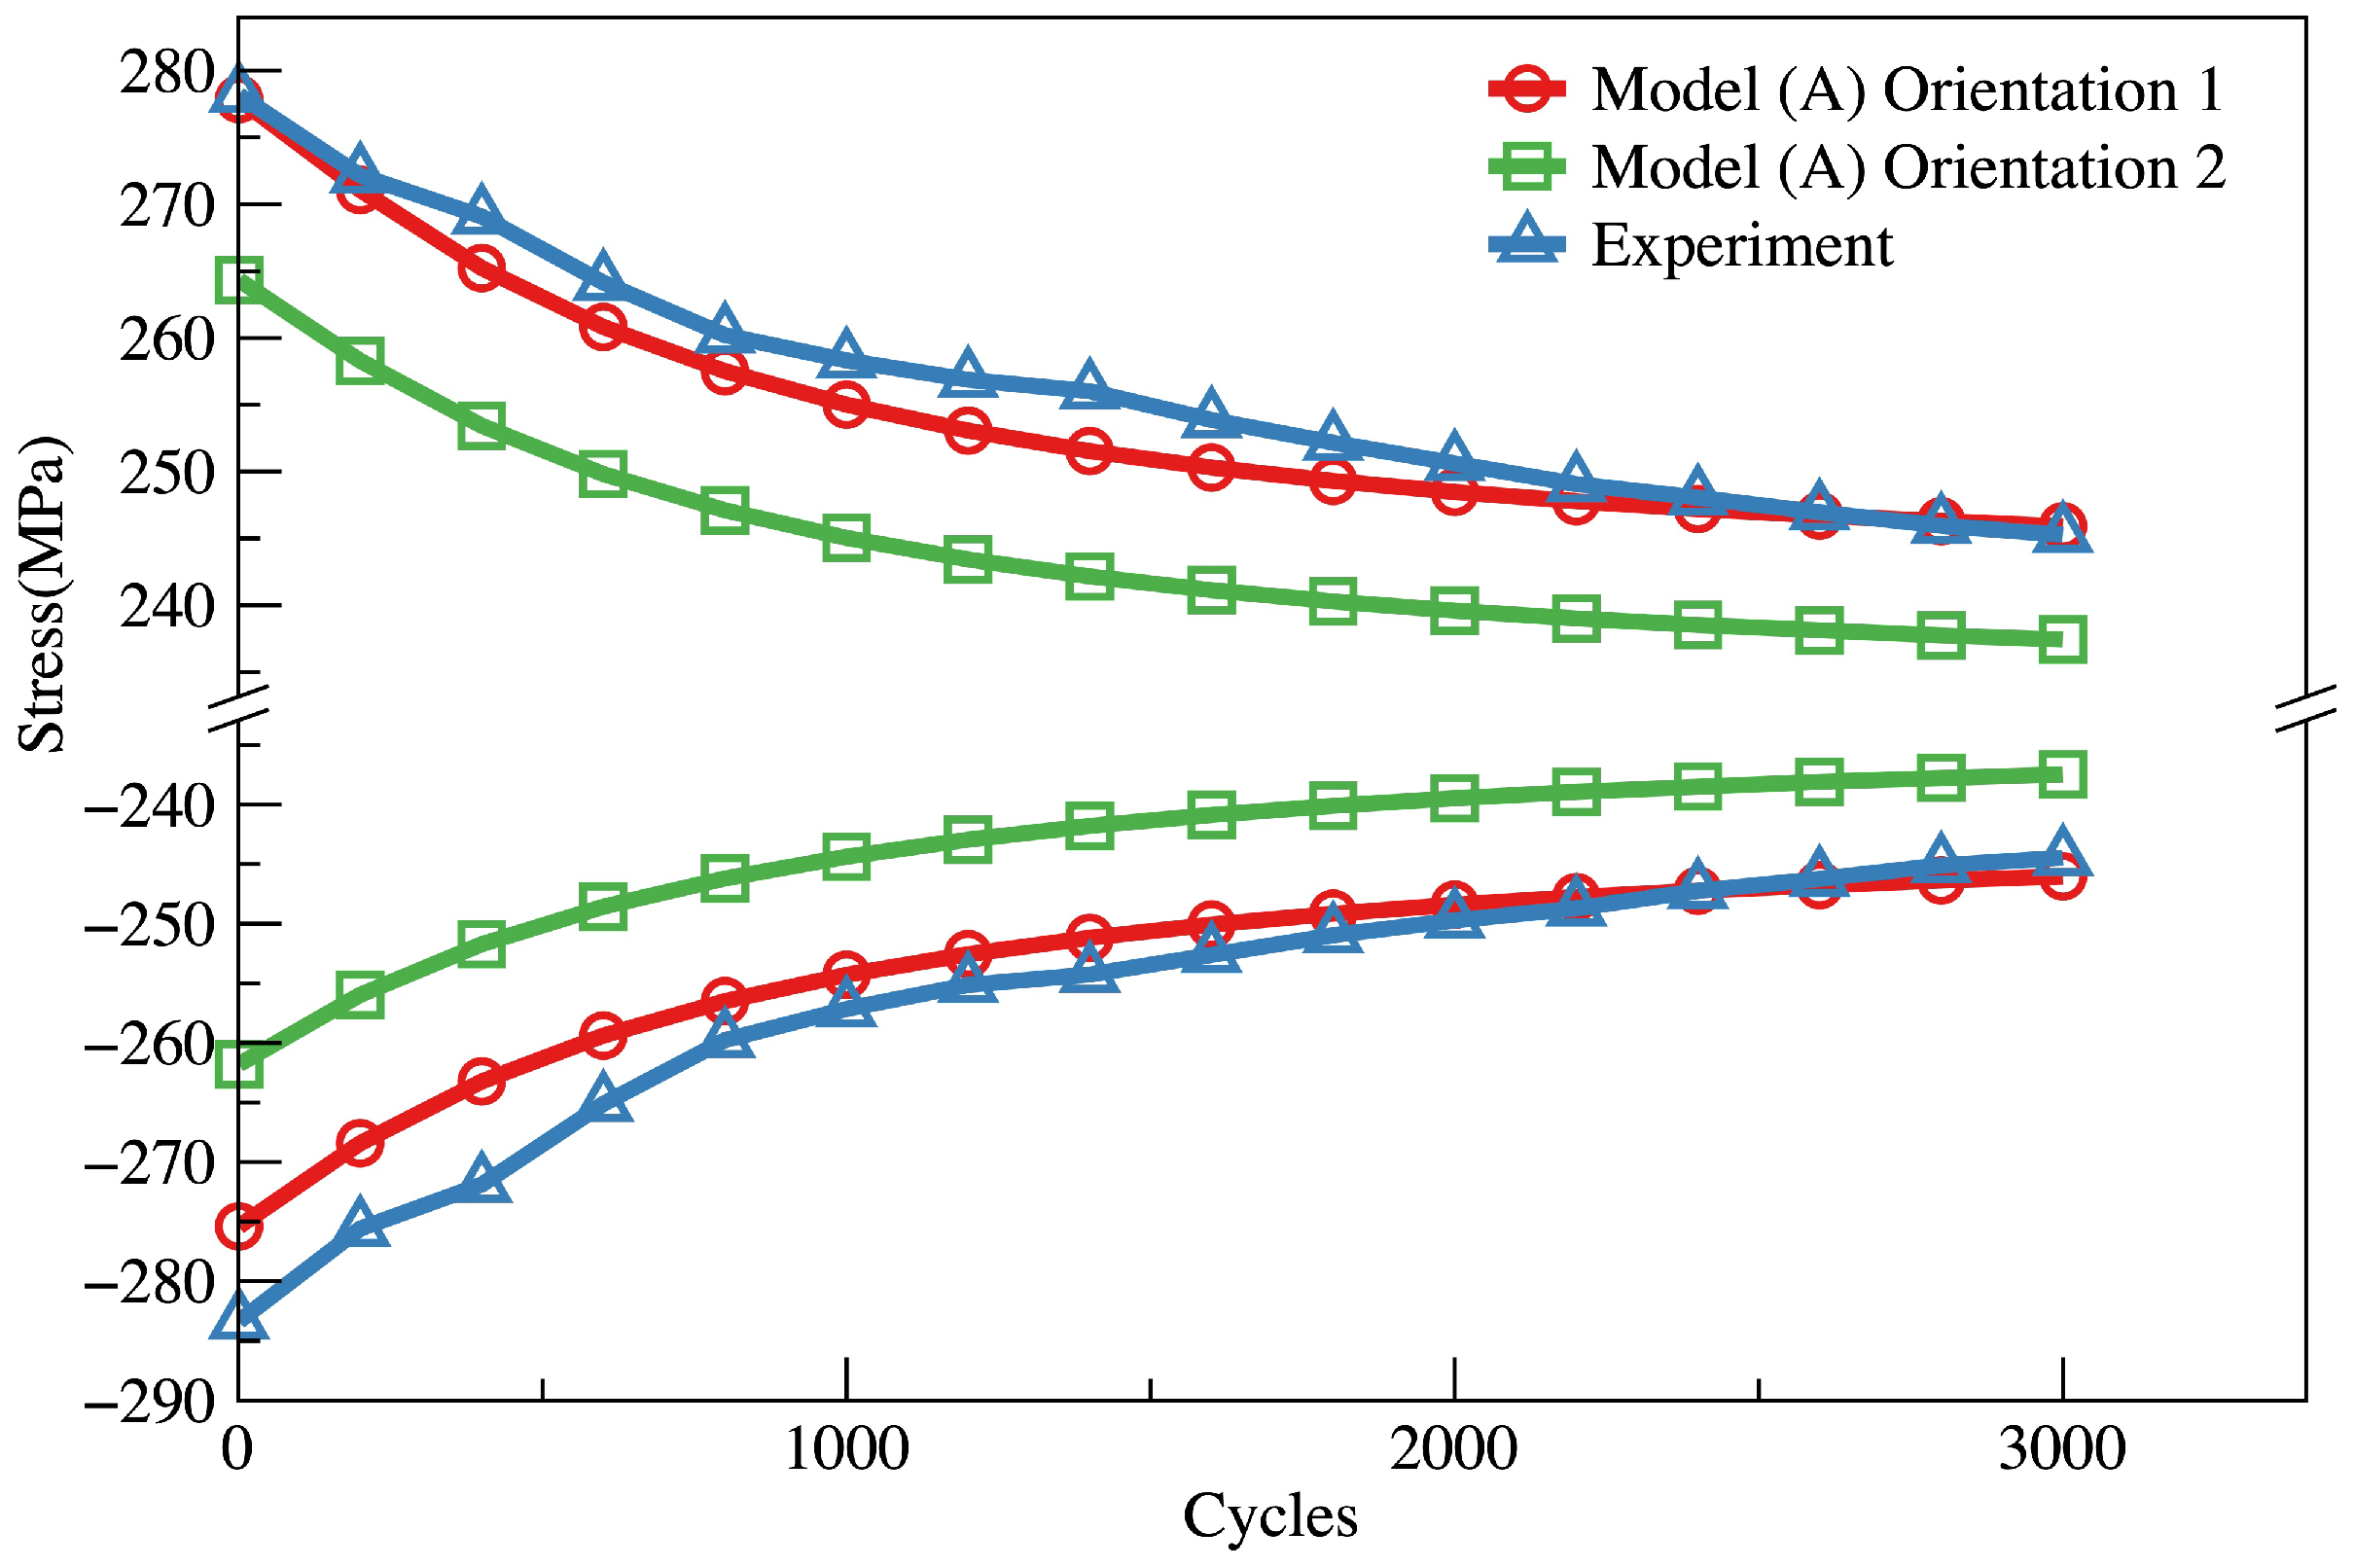
As with 2D models, periodic boundary conditions are assigned and cyclic strain with 0.263% amplitude is applied, corresponding to the experimental conditions. Two models with different grains (Model (A) and Model (C) in Figure 21) are calculated first to investigate the influence of RVE size, and the results are shown in Figure 11. Comparing the experiment and 2D models, the evolution of the stress peak and valley is in good agreement. After this, four models containing 200 grains but with various orientations are calculated to demonstrate the influence of orientations. The results are similar, and two of them are shown in Figure 22. The difference between the two orientations is acceptable, which means that the influence of orientation on the models with 200 grains is negligible. Finally, another model containing 200 grains but with different grain structures (Model (B) in Figure 21) is calculated, as shown in Figure 11. The structures of Model (A) and Model (B) are different, but both curves fit the experiment very well, indicating that the 3D RVE model with 200 grains is sufficient to represent the material.

4. Discussion

The main objective of this paper was to compare the two different approaches to fatigue crack initiation simulation on ferrite–pearlite steel. According to the experimental results, almost all cracks initiate before 3000 cycles, which is approximately 15% of the whole life and is called stage I; the rest of the fatigue life is not discussed in this work.
In the first approach, a 2D geometric model is established based on the microstructure of the specimen. The model is developed based on the works of Hoshide et al. [4] and Wang et al. [1], with the definition of F-FGBs, F-PGBs, and PSBs as potential positions for fatigue crack initiation. The basal energy is assigned to each position with different values, and it increases to a certain value after each cycle, which is calculated by Equations (1) and (2). When the basal energy increases to one, a crack is initiated. This approach assumes only one slip system in each ferrite grain, and stress and strain are not calculated. The crack initiation life and density calculated by this approach fit the experiment results very well. The simulation process is much faster than the finite element method because the equations solved in this model (Equations (1) and (2)) require a lower computational cost than equations in the finite element method. However, only fatigue crack behavior can be obtained from this approach; the stress and strain distributions are not available.
In the second approach, 2D geometric models similar to the first approach are firstly established, and a crystal plasticity constitutive model is developed to simulate the fatigue behavior of the first 3000 cycles. A new cyclic hardening/softening term is introduced in the model, which is able to shorten the simulation procedure. By adjusting parameter D, each cycle in CPFEM simulation is able to represent hundreds of cycles in the experiment. Crack density is calculated by three FIPs; the first two FIPs are adopted from previous works, and the third is developed in this paper. The results indicate that all three FIPs are capable of predicting the fatigue crack initiation positions, but the crack density calculated by F I P ϵ and F I P E is not in agreement with the experimental results; the reason is given in Section 3.2.4. The third FIP introduces the effective resolved shear stress (defined in Equation (19)) and neglects the slip rate under low resolved shear stress. Based on the results of crack density evolution, the third FIP is confirmed as valid in this work. Secondly, 3D models are generated containing 200 and 300 grains with coarse meshes to calculate the overall stress–strain response and cyclic hardening/softening effect using the constitutive model developed in this work. The results indicate that the constitutive model is suitable for both 2D and 3D geometric models.
As shown in Figure 9, the crack density evolution can be well predicted by the first approach and F I P e f f in the second approach, and the crack initiation locations are also well predicted. Considering orientation’s influence, the critical value difference between the two orientation distributions is less than 5%; therefore, the influence of orientation on crack density is not significant. Comparing all crack density curves in Figure 9, F I P E and F I P ϵ are not able to predict the evolution of crack density, and the reason is discussed in the previous section. However, some drawbacks still exist in the current work. For example, even though F I P e f f are able to reflect the crack density evolution, the critical value of F I P e f f is determined according to the experimental results. For other materials, the critical value needs to be recalibrated by experiments, and the parameters in the CPFEM models and F I P e f f also need to be recalibrated. However, once the parameters are determined for the material, this model is able to predict the crack density evolution.
Several conclusions are drawn:
  • Both approaches are capable of predicting the fatigue crack initiation positions and initiation life in ferrite–pearlite steel; the crack density evolution is in good agreement with experiment results.
  • The first approach determines whether a crack initiates by basal energy, which makes the simulation process much faster than the finite element method. However, stress and strain fields cannot be obtained from this approach.
  • The second approach is based on CPFEM and more variables can be calculated, such as the stress and strain field, slip rate, resolved shear stress, etc., but a higher computational cost is required.
  • Although the parameters are calibrated in 2D models, they can be applied to 3D models by recalibrating only one parameter.
  • Both approaches are promising. For example, multiple slip systems can be introduced into the first approach, and more slip controlling parameters can be included in the second approach, such as temperature.

Author Contributions

Z.F. and Z.W. wrote the main manuscript and completed the simulation procedure. Y.H. and L.W. carried out all the experiments required in the investigation process. All authors have read and agreed to the published version of the manuscript.

Funding

The authors wish to acknowledge the financial support of the Department of Science & Technology of Liaoning Province (Grant No. 20180550726).

Institutional Review Board Statement

Not applicable.

Informed Consent Statement

Not applicable.

Data Availability Statement

Upon request, data implemented in this study will be made available.

Conflicts of Interest

The authors declare no conflict of interest.

References

  1. Wang, L.; Wang, Z.; Zhao, J. Life prediction by ferrite–pearlite microstructural simulation of short fatigue cracks at high temperature. Int. J. Fatigue 2015, 80, 349–356. [Google Scholar] [CrossRef]
  2. Tokaji, K.; Ogawa, T.; Osako, S. The growth of microstructurally small fatigue cracks in a ferritic-pearlitic steel. In Fatigue & Fracture of Engineering Materials & Structures; Wiley Online Library: Hoboken, NJ, USA, 1988; Volume 11, pp. 331–342. [Google Scholar]
  3. Berisha, B.; Raemy, C.; Becker, C.; Gorji, M.; Hora, P. Multiscale modeling of failure initiation in a ferritic–pearlitic steel. Acta Mater. 2015, 100, 191–201. [Google Scholar] [CrossRef]
  4. Hoshide, T. Life prediction based on biaxial fatigue crack growth simulated in different microstructures modeled by using Voronoi-polygons. Procedia Eng. 2010, 2, 111–120. [Google Scholar] [CrossRef] [Green Version]
  5. Hoshide, T.; Takahashi, Y. Simulation of directional distribution of slip-band crack under biaxial low cycle fatigue. JSME Int. J. Ser. A Solid Mech. Mater. Eng. 2004, 47, 397–402. [Google Scholar] [CrossRef] [Green Version]
  6. Taylor, G.I.; Elam, C. The plastic extension and fracture of aluminium crystals. Proc. R. Soc. Lond. Ser. A Contain. 1925, 108, 28–51. [Google Scholar]
  7. Taylor, G.I. The mechanism of plastic deformation of crystals. Part I.—Theoretical. Proc. R. Soc. Lond. Ser. A Contain. 1934, 145, 362–387. [Google Scholar]
  8. Taylor, G.I.; Elam, C.F. Bakerian lecture: The distortion of an aluminium crystal during a tensile test. Proc. R. Soc. Lond. Ser. A Contain. 1923, 102, 643–667. [Google Scholar]
  9. Hill, R. Generalized constitutive relations for incremental deformation of metal crystals by multislip. J. Mech. Phys. Solids 1966, 14, 95–102. [Google Scholar] [CrossRef]
  10. Hill, R.; Rice, J. Constitutive analysis of elastic-plastic crystals at arbitrary strain. J. Mech. Phys. Solids 1972, 20, 401–413. [Google Scholar] [CrossRef]
  11. Huang, Y. A User-Material Subroutine Incroporating Single Crystal Plasticity in the ABAQUS Finite Element Program; Harvard Univ.: Cambridge, UK, 1991. [Google Scholar]
  12. Li, H.; Kang, G.; Yu, C. Modeling uniaxial ratchetting of magnesium alloys by a new crystal plasticity considering dislocation slipping, twinning and detwinning mechanisms. Int. J. Mech. Sci. 2020, 179, 105660. [Google Scholar] [CrossRef]
  13. Yue, Z. Surface roughness evolution under constant amplitude fatigue loading using crystal plasticity. Eng. Fract. Mech. 2005, 72, 749–757. [Google Scholar] [CrossRef]
  14. Asaro, R.J. Micromechanics of crystals and polycrystals. Adv. Appl. Mech. 1983, 23, 1–115. [Google Scholar]
  15. Sweeney, C.; Vorster, W.; Leen, S.; Sakurada, E.; McHugh, P.; Dunne, F. The role of elastic anisotropy, length scale and crystallographic slip in fatigue crack nucleation. J. Mech. Phys. Solids 2013, 61, 1224–1240. [Google Scholar] [CrossRef]
  16. Dunne, F.; Rugg, D.; Walker, A. Lengthscale-dependent, elastically anisotropic, physically-based hcp crystal plasticity: Application to cold-dwell fatigue in Ti alloys. Int. J. Plast. 2007, 23, 1061–1083. [Google Scholar] [CrossRef]
  17. Zhang, K.S.; Ju, J.W.; Li, Z.; Bai, Y.L.; Brocks, W. Micromechanics based fatigue life prediction of a polycrystalline metal applying crystal plasticity. Mech. Mater. 2015, 85, 16–37. [Google Scholar] [CrossRef] [Green Version]
  18. Ashton, P.; Harte, A.; Leen, S. A strain-gradient, crystal plasticity model for microstructure-sensitive fretting crack initiation in ferritic-pearlitic steel for flexible marine risers. Int. J. Fatigue 2018, 111, 81–92. [Google Scholar] [CrossRef] [Green Version]
  19. Franciosi, P.; Le, L.; Monnet, G.; Kahloun, C.; Chavanne, M.H. Investigation of slip system activity in iron at room temperature by SEM and AFM in-situ tensile and compression tests of iron single crystals. Int. J. Plast. 2015, 65, 226–249. [Google Scholar] [CrossRef]
  20. Du, C.; Maresca, F.; Geers, M.; Hoefnagels, J. Ferrite slip system activation investigated by uniaxial micro-tensile tests and simulations. Acta Mater. 2018, 146, 314–327. [Google Scholar] [CrossRef]
  21. Zhang, P.; Zhang, L.; Baxevanakis, K.; Zhao, L.; Bullough, C. Modelling short crack propagation in a single crystal nickel-based superalloy using crystal plasticity and XFEM. Int. J. Fatigue 2020, 136, 105594. [Google Scholar] [CrossRef]
  22. McDowell, D.; Dunne, F. Microstructure-sensitive computational modeling of fatigue crack formation. Int. J. Fatigue 2010, 32, 1521–1542. [Google Scholar] [CrossRef]
  23. Gu, T.; Stopka, K.S.; Xu, C.; McDowell, D.L. Prediction of maximum fatigue indicator parameters for duplex Ti–6Al–4V using extreme value theory. Acta Mater. 2020, 188, 504–516. [Google Scholar] [CrossRef]
  24. Dunne, F.; Wilkinson, A.; Allen, R. Experimental and computational studies of low cycle fatigue crack nucleation in a polycrystal. Int. J. Plast. 2007, 23, 273–295. [Google Scholar] [CrossRef]
  25. Hallberg, H.; Ås, S.K.; Skallerud, B. Crystal plasticity modeling of microstructure influence on fatigue crack initiation in extruded Al6082-T6 with surface irregularities. Int. J. Fatigue 2018, 111, 16–32. [Google Scholar] [CrossRef] [Green Version]
  26. Lin, B.; Zhao, L.; Tong, J.; Christ, H.J. Crystal plasticity modeling of cyclic deformation for a polycrystalline nickel-based superalloy at high temperature. Mater. Sci. Eng. A 2010, 527, 3581–3587. [Google Scholar] [CrossRef] [Green Version]
  27. Sajjad, H.M.; Hanke, S.; Güler, S.; Fischer, A.; Hartmaier, A. Modelling cyclic behaviour of martensitic steel with J2 plasticity and crystal plasticity. Materials 2019, 12, 1767. [Google Scholar] [CrossRef] [Green Version]
  28. Voronoi, G. Nouvelles applications des paramètres continus à la théorie des formes quadratiques. Deuxième mémoire. Recherches sur les parallélloèdres primitifs. J. Angew. Math. 1908, 1908, 198–287. [Google Scholar] [CrossRef]
  29. Hoshide, T.; Kusuura, K. Life prediction by simulation of crack growth in notched components with different microstructures and under multiaxial fatigue. In Fatigue & Fracture of Engineering Materials & Structures; Wiley Online Library: Hoboken, NJ, USA, 1998; Volume 21, pp. 201–213. [Google Scholar]
  30. Stopka, K.S.; Gu, T.; McDowell, D.L. Effects of algorithmic simulation parameters on the prediction of extreme value fatigue indicator parameters in duplex Ti-6Al-4V. Int. J. Fatigue 2020, 141, 105865. [Google Scholar] [CrossRef]
  31. Quey, R.; Renversade, L. Optimal polyhedral description of 3D polycrystals: Method and application to statistical and synchrotron X-ray diffraction data. Comput. Methods Appl. Mech. Eng. 2018, 330, 308–333. [Google Scholar] [CrossRef] [Green Version]
  32. Kang, G.; Bruhns, O.T. New cyclic crystal viscoplasticity model based on combined nonlinear kinematic hardening for single crystals. Mater. Res. Innov. 2011, 15, s11–s14. [Google Scholar] [CrossRef]
  33. Hutchinson, J. Creep and plasticity of hexagonal polycrystals as related to single crystal slip. Metall. Trans. A 1977, 8, 1465–1469. [Google Scholar] [CrossRef]
  34. Bassani, J.L.; Wu, T.Y. Latent hardening in single crystals. II. Analytical characterization and predictions. Proc. R. Soc. Lond. Ser. A Math. Phys. Sci. 1991, 435, 21–41. [Google Scholar]
  35. Roters, F.; Eisenlohr, P.; Hantcherli, L.; Tjahjanto, D.D.; Bieler, T.R.; Raabe, D. Overview of constitutive laws, kinematics, homogenization and multiscale methods in crystal plasticity finite-element modeling: Theory, experiments, applications. Acta Mater. 2010, 58, 1152–1211. [Google Scholar] [CrossRef]
  36. Bandyopadhyay, R.; Prithivirajan, V.; Sangid, M.D. Uncertainty Quantification in the Mechanical Response of Crystal Plasticity Simulations. JOM 2019, 71, 2612–2624. [Google Scholar] [CrossRef]
  37. Luo, J.; Kang, G.; Shi, M. Simulation to the cyclic deformation of polycrystalline aluminum alloy using crystal plasticity finite element method. Int. J. Comput. Mater. Sci. Eng. 2013, 2, 1350019. [Google Scholar] [CrossRef]
  38. Harris, C.R.; Millman, K.J.; van der Walt, S.J.; Gommers, R.; Virtanen, P.; Cournapeau, D.; Wieser, E.; Taylor, J.; Berg, S.; Smith, N.J.; et al. Array programming with NumPy. Nature 2020, 585, 357–362. [Google Scholar] [CrossRef] [PubMed]
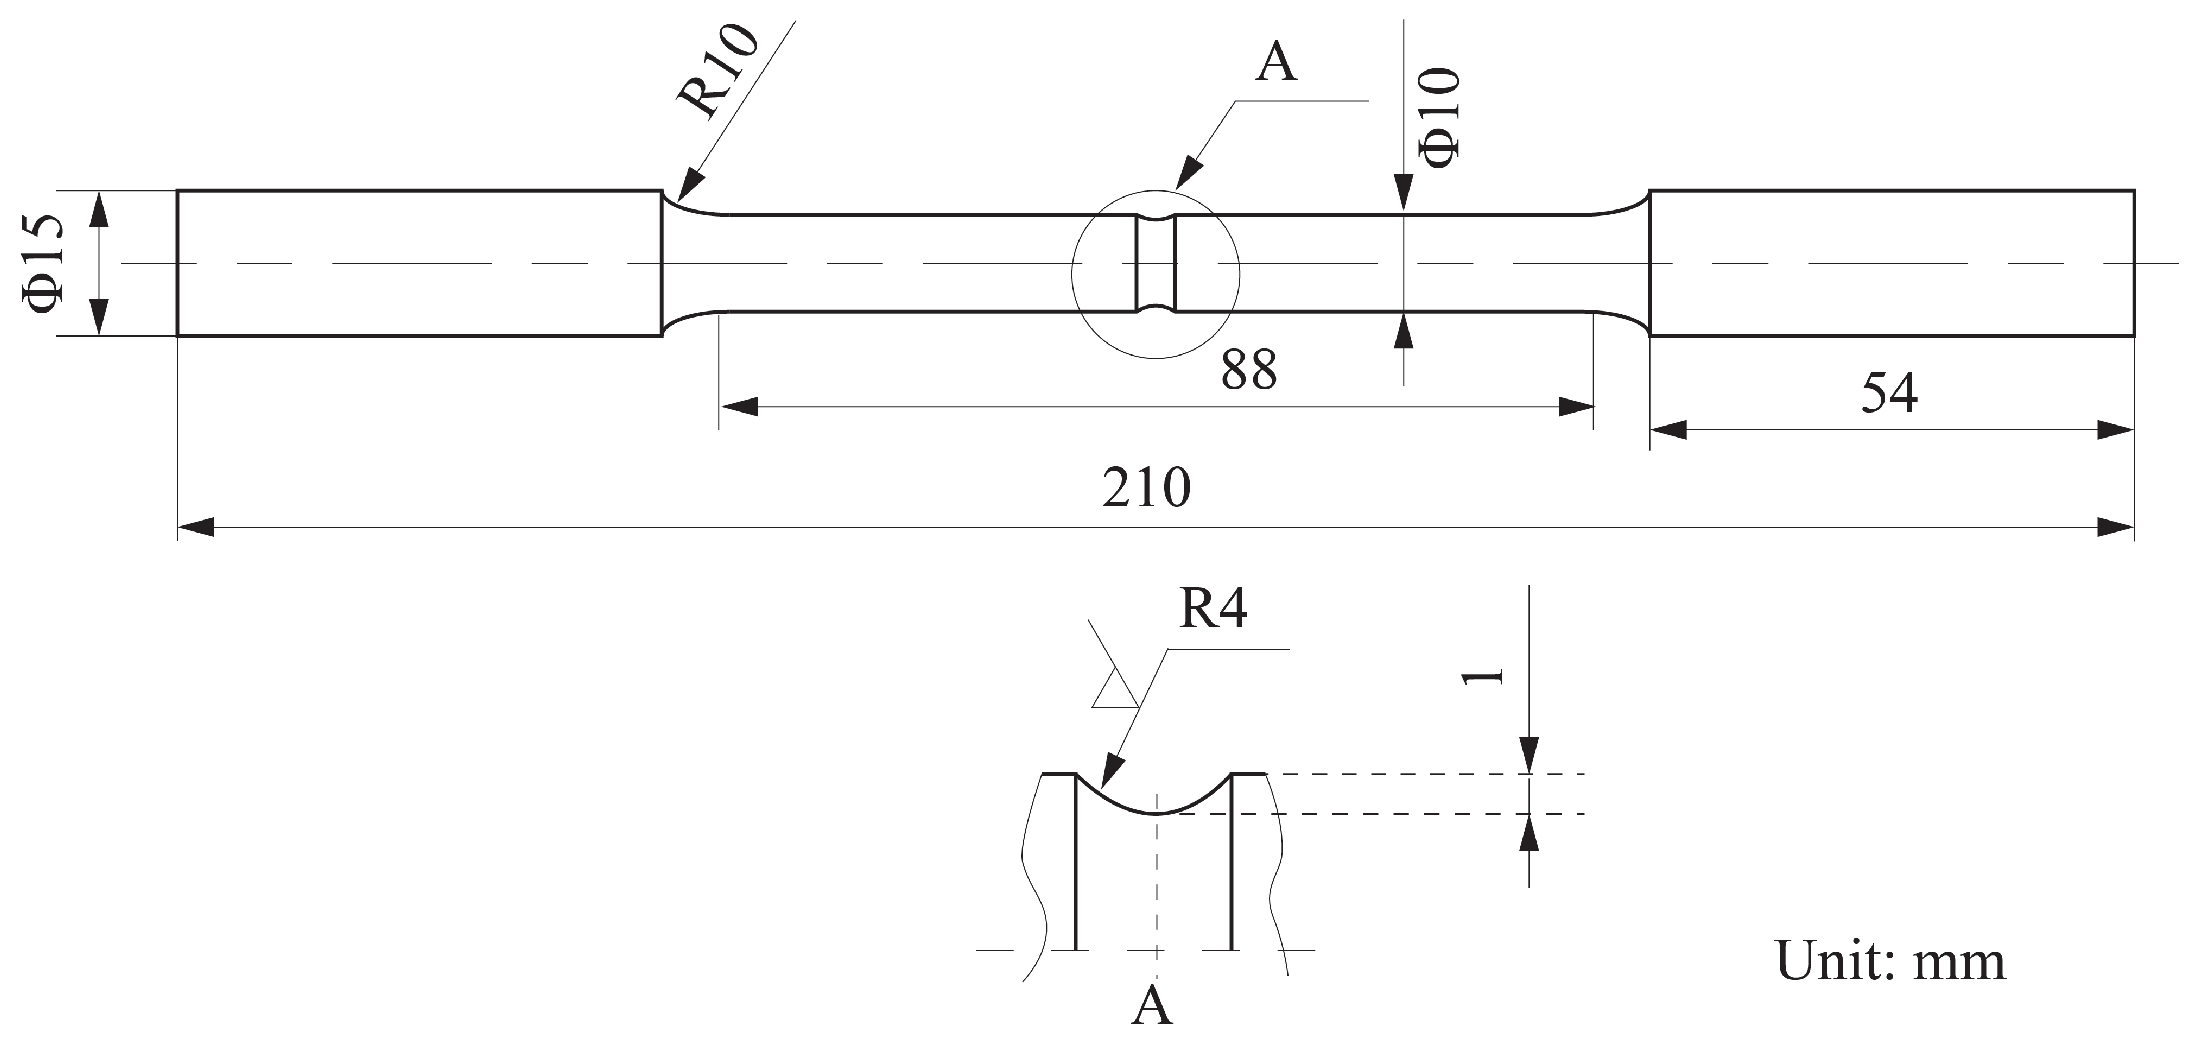
Figure 1. Size and shape of specimen.
Crystals 12 00718 g001
Figure 2. Average strain and localized strain.
Crystals 12 00718 g002
Figure 3. Microstructure of specimen.
Crystals 12 00718 g003
Figure 4. Fatigue crack initiation observation.
Crystals 12 00718 g004
Figure 5. Geometric model and pole figures.
Crystals 12 00718 g005
Figure 6. Slip direction and slip surface normal direction.
Crystals 12 00718 g006
Figure 7. Numerical simulation results.
Crystals 12 00718 g007
Figure 8. Experimental results.
Crystals 12 00718 g008
Figure 9. Crack density evolution of experimental results and simulation results.
Crystals 12 00718 g009
Figure 10. Different sizes of RVE models.
Crystals 12 00718 g010
Figure 11. The evolution of peak and valley stress.
Crystals 12 00718 g011
Figure 12. The influence of RVE model size.
Crystals 12 00718 g012
Figure 13. The influence of mesh size.
Crystals 12 00718 g013
Figure 14. The influence of orientation distribution.
Crystals 12 00718 g014
Figure 15. The first cycle, 6th cycle, 11th cycle, and 16th cycle of simulation, representing the first cycle, 1000th cycle, 2000th cycle, and 3000th cycle of experiment, with D = 20,000.
Crystals 12 00718 g015
Figure 16. The first cycle, 3th cycle, 7th cycle, and 11th cycle of simulation, representing the first cycle, 600th cycle, 1800th cycle, and 3000th cycle of experiment, with D = 30,000.
Crystals 12 00718 g016
Figure 17. Distribution of F I P ϵ ; the first cycle in this figure represents the first cycle in the experiment, and the 6th cycle represents the 1000th cycle in the experiment, etc.
Crystals 12 00718 g017
Figure 18. Distribution of F I P E ; the first cycle in this figure represents the first cycle in the experiment; the 6th cycle represents the 1000th cycle in the experiment, etc.
Crystals 12 00718 g018
Figure 19. Distribution of F I P e f f ; the first cycle in this figure represents the first cycle in the experiment; the 6th cycle represents the 1000th cycle in the experiment, etc.
Crystals 12 00718 g019
Figure 20. The crack density evolution calculated by F I P e f f of the 2nd cycle of simulation, and the stress and strain evolution in this cycle.
Crystals 12 00718 g020
Figure 21. The 3D geometric models. Model (A) and Model (B) consist of 200 grains but with different grain structures, while Model (C) consists of 300 grains.
Crystals 12 00718 g021
Figure 22. The evolution of peak and valley stress of Model (A) with different orientations, compared with experiment.
Crystals 12 00718 g022
Table 1. Chemical composition of ferrite–pearlite steel as percentage by weight (wt%).
CSiMnCrSP
0.2 0.23 0.51 0.013 0.011 0.024
Table 2. Mechanical properties of ferrite–pearlite steel at different temperatures.
Name of ParametersUnitsRoom TemperatureHigh Temperature
Temperature°C20500
Yield strengthMPa 335.5 316.1
Tensile strengthMPa 471.98 412.37
Elongation%3245
Elastic modulusMPa 2.28 × 10 5 2.05 × 10 5
Poisson’s ratio 0.303 0.301
Fracture energy densityKJ/m 2 22
Shear modulusGPa9481
Table 3. Experimental conditions.
ParametersUnitsValues
Temperature°C500
Strain rates 1 0.0024
Strain ratio 1
Strain amplitude 0.12 %
Table 4. Parameters in the first approach.
ParametersUnitsValues
GGPa81
μ 0.3
τ c MPa81
W c KJ/m 2 2
C 1 1.3 × 10 10
Initial basal energy of PSB 0.3∼0.5
Initial basal energy of F-FGB 0.4∼0.6
Initial basal energy of F-PGB 0.45∼0.65
Table 5. Calibrated parameters in the second approach; C 11 f , C 12 f , C 44 f are elastic constants of ferrite and C 11 p , C 12 p , C 44 p are elastic constants of pearlite.
ParametersValuesUnits
C 11 f , C 12 f , C 44 f 210.36 , 122.07 , 106.31 GPa
C 11 p , C 12 p , C 44 p 300.51 , 174.39 , 151.87 GPa
A 102.8 MPa
A d 7.8
q 1.4
Q 108.55 MPa
S 0.35 MPa
K 0.032 MPa
B 0.001
D20,000
h 0 4.0 MPa
h s 4.0 MPa
N 22.8 (2D) 110(3D)MPa
N d 18.8
Table 6. Correspondence of cycles between experiment and simulation.
Experiment120040060080010001200140016001800200022002400260028003000
Simulation12345678910111213141516
Publisher’s Note: MDPI stays neutral with regard to jurisdictional claims in published maps and institutional affiliations.