Abstract
In order to study the dynamic response associated with the impact of a kinetic projectile on the internal structure of an artificial satellite, we propose a kinetic projectile configuration with non-metallic material wrapping and multiple damage elements. The artificial satellite is simplified as a honeycomb sandwich panel and multi-layer plates. We carried out a ground damage test and finite element dynamic simulation, and we determined the lateral effect and penetration performance of the projectile. Then, we studied the dynamic behavior of the projectile penetrating the honeycomb sandwich panel using a theoretical model. We found that its ballistic limit velocity was 150 m/s, and the deformation of the opening had little relationship with the projectile velocity. Finally, we studied the dynamic response of the kinetic projectile impacting the multi-layer plates under various launch parameters. We found that the launch velocity required to meet the damage requirements was within 325 ± 25 m/s. Projectiles with a higher initial velocity had a stronger ability to penetrate the plates, but initial velocities higher than 325 m/s led to a reduced damage area. The kinetic projectile could adapt to incident angles less than 5° when damaging the plates. With the increasing incident angle, the penetration ability was reduced, and the damage area increased.
1. Introduction
With the continuous advancement of the human exploration of space, more than 10,000 spacecrafts have been launched into orbit in the past 60 years. Most of these have become space junk due to a loss of function [1]. There have been more than 260 explosions and impact events involving orbiting spacecrafts, resulting in a large amount of space debris, which substantially reduces the safety of human space activities [2]. According to the detection and research of the recovered spacecraft, impacts of space debris with spacecraft are quite common and damage both the surface and internal structure of spacecrafts [3].
In order to enhance the passive protection capability of spacecraft against space debris, the American astrophysicist Fred Whipple proposed the Whipple shield in 1947. By placing a shield at a certain distance outside the spacecraft, a debris cloud would be formed when the shield was impacted by a projectile, dispersing the kinetic energy of the projectile and further reducing the damage to the spacecraft [4]. Subsequently, researchers conducted a great deal of research on the high-speed impact of projectiles on Whipple shields [5,6], which made great contributions to space debris protection technology. Poniaev et al. conducted an experimental study on the hypervelocity impact of plastic projectiles on thin aluminum plates and gave a numerical simulation of the process by the SPH (smoothed particle hydrodynamics) method [7]. Hofmann et al. tested the protective effect of a metallic glass-stuffed Whipple shield using hypervelocity impacts and explored its potential for spacecraft debris shields [8]. Duan, Han and Zhang studied the dynamic behavior of multiple projectiles, multi-particle fragments and packaged structure projectile impacting the spacecraft protective structure [9,10,11]. Many studies have focused on the high-speed impact of single projectiles on Whipple shields.
A honeycomb sandwich panel can be regarded as an aluminum honeycomb core bounded by a Whipple shield. Aluminum honeycomb sandwich panels are widely used in aerospace due to their advantages of light weight, high specific strength, sound insulation, heat insulation, and vibration resistance. Therefore, they are often used as load-bearing structures and outer walls of some spacecrafts [12]. Fatt established a theoretical model of a projectile impacting a honeycomb sandwich panel in three stages and obtained an analytical solution of its ballistic limit velocity [13]. Yahaya carried out an experimental study on the impact of metal foam projectiles on aluminum honeycomb sandwich panels and analyzed the dynamic response of different types of aluminum honeycomb cores under the impact load [14]. Ebrahimi et al. used a finite element simulation to study the dynamic response and failure mode of honeycomb sandwich panels under a combined impact load from an explosion and projectile; they discussed the effect of the incident angle on skin deformation and honeycomb core crushing [15].
The above studies mainly focused on the dynamics of the impact of projectiles with spacecraft protective materials or structures. However, the damage to the inner structure of a spacecraft caused by kinetic projectiles after they pass through the protective structure has not been thoroughly analyzed in simulation and experimental studies. In addition, there have been few studies about the dynamic characteristics of the penetration of honeycomb sandwich panels by projectiles with internal damage elements. Therefore, there is a need for analytical works that can provide a reference for spacecraft damage assessments and protective structure designs.
The main structure of this paper is as follows: Section 2 describes the ground damage test. Section 3 shows the finite element simulation of the damage process based on the ABAQUS program. Section 4 establishes the theoretical model of the penetration of the honeycomb sandwich material by the projectile. Section 5 analyzes the dynamic responses with different velocities and incident angles, and Section 6 concludes the paper. The purpose of this study was to analyze the characteristics of the damage caused by a kinetic projectile to a satellite’s internal structure through both simulation and experimentation. This paper could provide guidance for a design in consideration of the protection and damage mitigation of satellite structures.
2. Ground Damage Test
2.1. Configuration of the Ground Damage Test
In order to study the characteristics of the damage caused by kinetic projectiles impacting upon a spacecraft, the structure of the spacecraft needs to be simplified. Taking artificial satellites as an example, many honeycomb sandwich panels are currently used in satellite structures. Even the main bearing structures of some satellites are composed of honeycomb sandwich panels, such as the A2100 satellite platform in the United States, as well as small Chinese satellite platforms [16]. Due to the harsh electromagnetic environment in space, the shell of electronic equipment in spacecrafts is generally shielded with an aluminum alloy shell [17,18], which can effectively prevent the intrusion of external interference.
In this study, the outer wall of the spacecraft was simplified as an aluminum honeycomb sandwich panel (A). The outer wall of the electronic device was simplified as an aluminum alloy plate (B), and the inner wall was plate F. Three circuit boards (C–E) were arranged between plates B and F to simulate the electronic device. The thickness of honeycomb panel A was 20 mm and was composed of 2A12 aluminum alloy. Plates B and F each had a thickness of 2 mm and were composed of 2A12 aluminum alloy. Plates C–E were three printed circuit boards with thicknesses of 1.6 mm. Three lights were connected to the printed circuit boards to simulate electronic components.
To analyze the damage mechanism, we carried out a ground damage effect evaluation test. The layout of the test device is shown in Figure 1. The shell of the projectile included a nylon cartridge case and an aluminum bottom. Forty-eight steel balls with 4 mm diameters and 0.263 g weight filled the projectile. The projectile mass was 21 g, and the diameter was 16.6 mm. The launching speed was 325 m/s. A high-speed camera was used for recording the experiment.
Figure 1.
Schematic diagram of the layout of the ground test.
2.2. Experimental Observations
As is shown in Figure 2, the projectile hit the target plates with an initial velocity of 325 m/s. After penetrating targets A and B, the nylon cartridge case was destroyed, and the damage elements spread out, causing regional damage to the three circuit boards. Three lights were connected to the circuit boards to simulate electronic components. The extinguishment of lights indicated that the electronic components were damaged and lost their function. The fragments formed by the damage elements and the target were completely blocked by the last plate, F. The test showed that the kinetic projectile could cause regional damage to the internal structure after penetrating the outer wall of the spacecraft without generating additional space debris, demonstrating the good feasibility of the damage effect. However, the test could only validate the damage effect. It was necessary to carry out a finite element simulation to further analyze the damage performance of the kinetic projectile.
Figure 2.
Test configuration. (a) Before the damage, the lights were on. (b) During the penetration, the damage elements and the plate formed fragments. (c) After the damage, the lights were off.
2.3. Damage Mechanism
The damage mechanism of the kinetic projectile is shown in Figure 1. The kinetic projectile needed to meet the damage requirements, which meant that the kinetic projectile must penetrate the surface of the satellite (target A) and the aluminum shell (target B); then, the projectile spread the damaged elements and generated regional damage to the internal electronic components (targets C–E); however, the projectile and the damage elements could not penetrate the surface of the satellite on the other side (target F), meaning that the generation of space debris was avoided.
The projectile consisted of a nylon shell and internal metal elements and was launched by a pyrotechnic launcher. The projectile hit and penetrated the honeycomb sandwich panel on the surface of the satellite at a speed of 325 m/s, as indicated by ① in Figure 3. When the projectile hit the higher-strength aluminum alloy shell of the electronic device, the nylon shell shattered, and the internal damage elements spread out, as shown in ② of Figure 3. In addition, the projectile was axially compressed upon impact, which was further converted to radial expansion potential energy. The damage elements spread horizontally and axially, causing regional damage to various electronic components inside the device.
Figure 3.
Mechanism of kinetic projectile damage to orbiting spacecrafts.
The kinetic projectile generated two kinds of damage effects: a lateral effect and a minor penetration effect [11]. When the projectile hit target B, it was axially compressed by the internal damage elements, causing damage and expansion of the top cover. Then, the internal damage elements spread laterally, resulting in the so-called lateral effect. Moreover, with the dispersion of the damage elements, the kinetic energy of the projectile was dispersed. The reduced kinetic energy led to a reduced penetration ability, thus the minor penetration effect.
3. Finite Element Simulation
3.1. Finite Element Simulation Model
A simulation model of the projectile damaging the multi-layer plates was established in ABAQUS; the visualization of the model is shown in Figure 4. The case and bottom of the projectile were solid parts, with element type C3D8R. According to our observations, the damage elements did not experience visible deformation during the experiment, so, in the numerical model, they were modeled as rigid bodies, and their element type was set as R3D4. The layout of the target plates was the same as in the test conditions, and the area of each target plate was 150 mm × 150 mm. In order to capture the physics of damage elements penetrating the plate, it was necessary to refine the mesh in the central area of the target plate. The honeycomb sandwich panel was composed of two skins and a honeycomb core. The thicknesses of the skin and core were 0.5 mm and 19 mm, respectively, and the wall thickness of the honeycomb cell was 0.08 mm. Based on [19], the honeycomb core was modeled using shell elements with element type S4R due to the extremely low thickness. The honeycomb skins were modeled as solid elements with element type C3D8R. The thicknesses of targets B and F were 2 mm, and the thicknesses of targets C, D and E were all 1.6 mm. These target plates were solid elements of type C3D8R. The initial velocity of the projectile was set as 325 m/s, and the boundaries of the target plates were fixed. General contact was employed for interactions between different parts.
Figure 4.
Visualization of the finite element simulation model.
3.2. Material Modeling
The simulation model included three materials: 2A12 aluminum alloy, nylon and printed circuit boards. In this paper, the material model of 2A12 aluminum alloy used the Johnson–Cook constitutive model. The material parameters are summarized in Table 1 based on [20]. In the table, is the density, is Young’s modulus and is Poisson’s ratio, which are the basic mechanical parameters of the material. Additionally, is the dynamic yield strength, is the strain rate hardening coefficient, is the strain rate hardening index, is the strain rate hardening coefficient and is the temperature rise softening index, which are the parameters of the Johnson–Cook constitutive model. are the Johnson–Cook failure criterion parameters.

Table 1.
Material parameters of 2A12 aluminum alloy [20].
The printed circuit boards were mainly composed of glass–fiber-reinforced material, which is a kind of anisotropic composite material. The orthotropic material model and the Hashin damage model were used to describe the composite material [21]. Since ABAQUS does not provide the Hashin criterion for 3D solid elements, it was necessary to write a VUMAT subroutine through Fortran language and implement it in the numerical solver [22]. The thickness of each layer was 0.2 mm, and the layer angles were arranged as [45/0/–45/90]. The parameters of the orthotropic material model for the circuit boards are shown in Table 2 [23]. In the table, is the density, are Young’s moduli in the three directions, are Poisson’s ratios in the three directions, and are the shear moduli in the three directions. The Hashin damage parameters are shown in Table 3. In the table, and are the tensile strength and compressive strength of the single-layer board in the fiber direction, respectively; and are the tensile strength and compressive strength, respectively, perpendicular to the fiber direction and are the shear strengths in the three directions.
Table 2.
Parameters of the orthotropic material model for the circuit boards [23].
Table 3.
Hashin damage parameters of the circuit boards [23].
Based on [24], the stress–strain data were used in the plastic deformation stage of the nylon material. The parameters of nylon are shown in Table 4. A combination of flexible damage and shear damage was used in the failure model. The element was automatically deleted when the principal strain of the nylon element was greater than 0.65.
Table 4.
Material parameters of nylon [24].
3.3. Simulation Results
The curve of the total kinetic energy of the model over time is shown in Figure 5. The stress nephograms at four moments were selected to show the damage process of the projectile hitting the targets. When the projectile passed through the honeycomb sandwich plate (target A), it was compressed and deformed slightly, but the cartridge case was not broken. However, when the projectile hit target B, the cartridge case broke, and the internal damage elements were scattered both laterally and axially. At this time, the sudden dissipation of the total kinetic energy was observed. Afterwards, the damage elements hit the circuit boards regionally before falling to the bottom of projectile. All damage elements penetrated target C, while four and nine damage elements were unable to penetrate targets D and E, respectively. After penetrating the three circuit boards, the damage elements and the target fragments formed a large area fragment group. Then, the fragment group hit target F but did not penetrate. During the entire process, the fragment group remained between target A and target F, so target F was not penetrated.
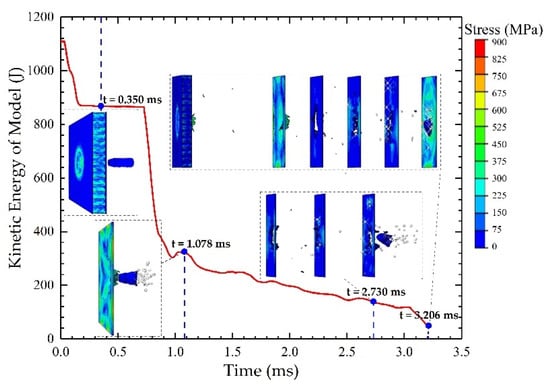
Figure 5.
Simulation results of the projectile damage.
A comparison of the damaged targets between the simulation and test is shown in Figure 6. The target numbers are A–F from left to right. The damage characteristics of the targets recovered from the experiment and from the simulation showed numerical consistency. When the projectile penetrated target A, the shape of the opening was affected by the honeycomb structure, and it consisted of the sides of the honeycomb cells. When the projectile hit target B, the damage elements played a key role in the penetration, so the opening was irregularly circular. Due to the lateral effect, the damage range of target B was slightly larger than that of target A. At the same time, there was no impact trace of damage elements around the opening on target B, meaning that the cartridge case had not been broken before. There was a strong randomness in the damage processes of targets C, D and E. The lateral damage ranges increased from 49.55 mm to 73.65 mm, and the local point perforations due to the penetration of individual debris also increased. Their lateral damage range increased from 49.55 mm to 73.65 mm, and the single-point damage around the damage center increased in turn. Finally, when the projectile hit target F, damage marks were produced by the impact of the fragment group; the bottom of the projectile made the most apparent damage marks but did not penetrate the target.
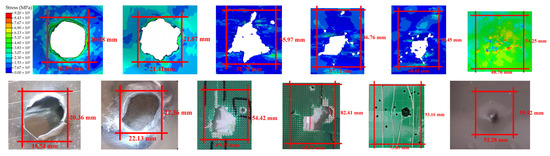
Figure 6.
The comparison of damaged targets between the simulation and test.
To compare the consistency between the simulation model and the test more intuitively, we carried out a quantitative analysis on the lateral, longitudinal and oblique damage ranges, as shown in Table 5.
Table 5.
Comparison of the lateral, longitudinal and oblique ranges.
The qualitative analysis of the damage process showed that the damage characteristics of the test and simulation were similar; the quantitative analysis of the damage ranges of the targets showed that the deviations were within 10%. Therefore, the simulation results were consistent with the experimental results, and the simulation model can be used for further research.
4. Theoretical Model of Projectile Impact on Honeycomb Sandwich Panel
4.1. Derivation of Theoretical Model
The kinetic projectile must penetrate the outer wall of the satellite—that is, the honeycomb sandwich panel. The most commonly used parameter for describing a target’s ability to withstand a projectile impact is the ballistic limit. It is defined as the maximum projectile velocity a target can withstand without being penetrated. By establishing the theoretical model of the kinetic projectile impacting the honeycomb sandwich panel, the projectile’s ballistic limit velocity and residual velocity could be obtained, and the damage characteristics can be further explained.
4.1.1. Structural Model
The schematic diagram of the projectile hitting the honeycomb sandwich panel is shown in Figure 7a. The honeycomb sandwich panel was composed of a front skin, a back skin and a honeycomb core, where is the thickness of the skins, is the thickness of the honeycomb core, is the wall thickness of the honeycomb cell and is the side length of the honeycomb cell. The projectile has a blunt tip, is the projectile radius, is the projectile diameter, is the projectile mass and is the initial velocity of the projectile. According to the study of Fatt [13], the penetration of the honeycomb sandwich panel could be decomposed into three stages: the perforation of the front skin, the honeycomb core and the back skin.
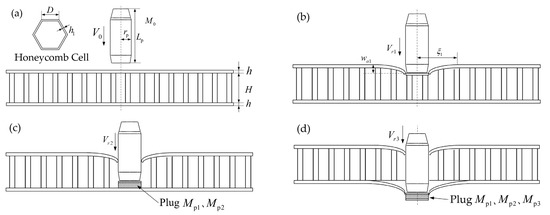
Figure 7.
Theoretical model of the kinetic projectile hitting honeycomb sandwich panel: (a) schematic diagram; (b) first stage; (c) second stage; (d) third stage.
The theoretical model is based on the following assumptions:
- The honeycomb thickness is much greater than the skin thickness, . However, this assumption has some consequences (i.e., that the front skin will deflect and perforate, while the honeycomb core steadily crushes without compaction). The back skin is undeformed during the opening of the front skin.
- The diameter of the projectile is larger than the length of the side of the honeycomb cell, . Therefore, honeycomb crushing and shearing will occur under the projectile. If the projectile diameter is less than the cell side length and the projectile falls within one cell, the projectile can penetrate the cell without crushing it.
The first stage is shown in Figure 7b; the projectile penetrates the front skin, the honeycomb core and the back skin support the front skin, the honeycomb core is stably crushed and the back skin is not deformed. is the radial extent of the front skin deformation, is the transverse deflection of the front skin deformation and is the residual velocity after the projectile penetrates the front skin.
The second stage is shown in Figure 7c. This stage starts when the projectile completely penetrates the front skin. The projectile acts on the honeycomb core together with a plug from the front skin. According to Goldsmith’s experimental research [25], Fatt obtained the ballistic limit equation of bare honeycomb [13]. In the paper, the failure mechanism of honeycomb was replaced by this ballistic limit [13]. Considering that part of the honeycomb core was crushed in the first stage, the reduced ballistic limit of bare honeycomb was used [13].
The third stage is shown in Figure 7d. It is assumed that the honeycomb core has been compacted into a plug before this stage; the plug hits the back skin together with the projectile. The energy lost upon impact with the back skin is predicted using the perforation equation developed for thin plates by Woodward [26].
4.1.2. First Stage: Perforation of Front Skin
The energy conservation equation when the projectile penetrates the front skin is [13]:
In the formula, is the plastic work dissipated during membrane stretching and honeycomb deformation under the deformed skin, is the fracture work and is the mass of the plug cut out from the front skin; it is assumed that the plug diameter is equal to the projectile diameter. is the residual velocity of the projectile after penetrating the front skin.
The plastic work is dissipated in the stretching of the front skin and the crushing of the honeycomb; it is found by considering the equivalent plastic work dissipated in the static indentation of a membrane bonded to a rigid plastic foundation [13]. According to the relevant derivation of Fatt [13], the expression of the plastic work consumed by plastic deformation in the first stage is:
In the formula, is the dynamic crush strength of the aluminum honeycomb core, is the dynamic shear strength of the honeycomb core, is the flow stress of the skin material, is the projectile radius, is the skin thickness and is the radial extent of the front skin deformation at the end of the first stage.
According to [13], when the radial strain reaches a critical value, the front skin experiences tensile necking. The radial extent of the front skin deformation is:
In the formula, is the critical fracture strain; Wang obtained from a uniaxial tensile test [27].
The transverse deflection of the front skin deformation at the end of the first stage (see Figure 7b) is:
is expressed as:
According to the impact test of Goldsmith [25], the dynamic crush strength of the honeycomb core is about 30% higher than the static crush strength. Therefore, the dynamic crush strength and dynamic shear strength of the honeycomb core are 1.3 times larger than the static crush strength and static shear strength .
is the static crush strength of the honeycomb core. Wierzbicki [28] established the relationship between the honeycomb parameters and and applied it in a projectile impact test. The results showed that the error was within 5% during low-velocity impact and within 16% during high-velocity impact [28]. The expression for is:
In the formula, is the flow stress of the honeycomb core, and is the wall thickness of the honeycomb cell, as shown in Figure 7a.
When the projectile hits the honeycomb sandwich panel, the honeycomb core under the front skin is not only crushed but also experiences shear deformation, which means that the honeycomb core provides shear resistance in the deformation area from to . is the static shear strength of the honeycomb core obtained by McFarland [29]; its expression is:
4.1.3. Second Stage: Perforation of Honeycomb Core
The energy conservation equation when the projectile penetrates the honeycomb core is [13]:
In the formula, is the work involved in perforating the honeycomb, is the residual velocity of the projectile after penetrating the honeycomb core, is the mass of the plug cut out from the honeycomb core and . is the radius of the honeycomb plug; the experiments showed that is 1~2 times the radius of the projectile [25], so is used at the end of the second stage.
When the projectile penetrates the honeycomb core, the energy loss is mainly due to the collapse and shear of the honeycomb core. Although the damage model for honeycomb penetration is very complex, the honeycomb failure mechanism can be replaced by the ballistic limit of bare honeycomb [13]. Due to the deformation of the front skin in the first stage, the honeycomb core is already crushed, and the reduced ballistic limit of the bare honeycomb is used [13]. The expression of the plastic work is:
In the formula, is the reduced ballistic limit.
In the second stage, the honeycomb core is crushed from its original thickness to :
In the formula, is the transverse deflection of the front skin (see Figure 7b).
The reduced ballistic limit can also be estimated from the original ballistic limit :
When the projectile penetrates the bare honeycomb,
In the formula, is the average crushing force of the honeycomb core, is the average shearing force of the honeycomb core and the experiments in [25] show that and are constant.
According to [30], and can be obtained from and :
Combining the above equations, we get:
4.1.4. Third Stage: Perforation of Back Skin
The energy conservation equation when the projectile penetrates the back skin is:
In the formula, the plastic work due to membrane stretching, is the fracture work, is the mass of the plug cut out from the back skin and . The plug radius . is the residual velocity after the projectile penetrates the sandwich panel.
Woodward [26] presented the expression for the work consumed due to the plastic deformation of the back skin:
In the formula, is the flow stress of the skin material.
The expression for the fracture work consumed is [13]:
4.2. Theoretical Calculation
4.2.1. Calculation Parameters
The modeled honeycomb sandwich panel consisted of the skins and honeycomb core. The skin material was 2A12 aluminum, and the honeycomb core material was 3003H18 aluminum. The material properties are shown in Table 6 [31], where is the yield strength, is the ultimate strength and is the flow stress.
Table 6.
Material properties of the honeycomb sandwich panels [31].
The geometric parameters of the projectile and the honeycomb sandwich panel are shown in Table 7; these were used as the input parameters.
Table 7.
Geometry parameters of the projectiles and honeycomb sandwich panel.
4.2.2. Results
Theoretical calculations were carried out for different initial projectile velocities. The residual velocities after each stage are summarized in Table 8.
Table 8.
Residual velocity after each perforation stage.
4.2.3. Comparison between Simulation and Theory
Comparing the dynamic simulation with the theoretical analysis, the calculation results are listed in Table 9. The differences between the residual velocity and residual kinetic energy between simulation and theory were within 5%.
Table 9.
Comparison of the results between the theoretical calculations and numerical simulation.
In order to see the consistency more clearly between the theoretical model and the simulation model, Figure 8 shows the relationship between the initial velocity and the residual velocity. It can be seen that the simulation datapoints basically coincide on the theoretical curve, indicating that the simulation results support the theoretical model.
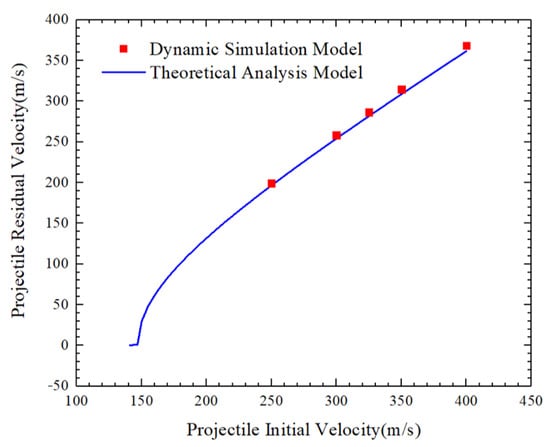
Figure 8.
Comparison of the initial and residual velocity between the theory and simulation.
4.2.4. Ballistic Limit Prediction
is the ballistic limit velocity of the honeycomb sandwich panel impacted by the kinetic projectile. is obtained by gaining using the above theoretical model. The theoretical model could obtain the residual velocity by inputting the initial velocity . Different values of were attempted through iterations until was satisfied, and the ultimate obtained was . The theoretical calculations found the value of [13], and the simulation results indicated that the projectile penetrated target A when the initial velocity was 150 m/s. Therefore, we considered that the ballistic limit velocity was about 150 m/s. Note that the theoretical model can not only be used to calculate the ballistic limit with the same projectile and targets but can also be used to predict the ballistic limit under different conditions, which is convenient for application in both missions and experiments.
4.2.5. Deformation Prediction
According to Equations (3) and (4), it can be calculated that and . Since the velocity variable does not appear in the expressions of and , Fatt holds that and are not related to the projectile velocity; this could be observed in the simulation. Figure 9 shows the simulated deformation of the honeycomb sandwich panel after being impacted with the projectile at different velocities. The deformation results are very similar, and the differences between the values of and at different velocities are not large. This supports the assertion that “the deformation of the front skin has little relationship with the projectile velocity”, as mentioned the analytical model given in [13]. The simulation results of and are similar to the calculated results, which further illustrates the correctness of the analysis.
Figure 9.
Deformation of the honeycomb sandwich panels after penetration, (a) , (b) , (c) .
5. Influence of Launch Parameters on Damage Characteristics
5.1. Influence of Initial Velocity
Figure 10 shows the damage effects of the kinetic projectile impact under different initial velocities. When the initial velocity was 250 m/s, the projectile did not penetrate target B in the simulation. When the initial velocity was 300 m/s, the damage elements penetrated target B and spread inward, but the projectile bottom did not penetrate. When the initial velocity was in the range of 325–350 m/s, the projectile bottom penetrated target B. When the initial velocity was greater than or equal to 400 m/s, some fragments began to penetrate target F. The damage requirements for the simulation were that the entire projectile must penetrate the honeycomb sandwich panel, and the damage elements must penetrate target panel B and disperse to the inside, and none of the fragments can penetrate target F. Our results indicate that the initial velocity range that should be applied to meet these requirements is 325–350 m/s.
Figure 10.
Damage effect of the kinetic projectile impact under different initial velocities, (a) , (b) , (c) , (d) , (e) , (f) .
The ability of the kinetic projectile to damage the internal structure mainly came from the lateral effect when the projectile impacted target B. Projectiles with a higher initial velocity had a more successful lateral effect, but compared to the increase in the lateral velocity, a higher initial velocity had a greater effect on the increase in the longitudinal velocity. It can be seen that projectiles with a higher initial velocity had a stronger ability to penetrate plates, but the damage area was reduced. Therefore, our results suggest that the most appropriate initial velocity is 325 m/s. At this speed, the most effective damage to the circuit boards could be achieved without the penetration of target F.
5.2. Influence of Incident Angle
Figure 11 shows the damage effect of the kinetic projectile impact under different incident angles. Due to the launch conditions, there was generally an incident angle when the projectile impacted the target—that is, the angle between the projectile axis and the normal target direction. In order to investigate the influence of the incident angle on the damage characteristics, simulations were carried out under different incident angles. Two moments were selected to analyze the damage process, as shown in Figure 11. The first (images on the left) was the partial display when the damage elements were scattered, and the second (right side) was the whole picture when the damage process was complete.
Figure 11.
Damage effect of the kinetic projectile impact under different incident angles.
When the incident angles were 1.5°, 3° and 5°, the kinetic projectile could complete the effective damage to the circuit boards, indicating that the projectile could adapt to an incident angle less than 5° when the projectile velocity was 325 m/s. With the increase of the incident angle, the deflection of the projectile bottom was more significant, and more damage elements remained in front of each target plate, indicating that the penetration ability decreased with the increasing incident angle. It is worth noting that, due to the lateral effect, the front damage elements moved forward in the horizontal direction after impact, while the rear damage elements deflected with the projectile bottom. This means that higher incident angles reduced the penetration ability but increased the damage area.
6. Conclusions
In this paper, an artificial satellite was simplified as multi-layer target plates based on its structural characteristics. The damage process of a kinetic projectile hitting the multi-layer target plates was analyzed by integrating the experiments and finite element method. Then, the impact characteristics of the kinetic projectile on the honeycomb sandwich plate were analyzed. Finally, the influence of the initial velocities and incident angles on the damage characteristics were studied based on the simulation model.
The damage characteristics between the simulation and the test were consistent in terms of the damage range of the targets, validating the simulation model. The analytical results of the kinetic projectile impact on the honeycomb sandwich panel correlated well with the simulation; the ballistic limit velocity was determined as 150 m/s. We also found that the opening deformation had little relationship with the projectile velocity.
The projectile velocity necessary to achieve effective damage to the circuit boards without penetration of target F was between 300 m/s and 350 m/s, and we identified the most appropriate initial velocity as 325 m/s. Projectiles with a higher initial velocity had a stronger ability to penetrate the plates, but the damage area was reduced. The kinetic projectile could adapt to an incident angle less than 5°. Due to the lateral effect, the front damage elements still moved in the vertical direction, increasing the damage area but reducing the penetration ability.
Author Contributions
Conceptualization, S.Y., H.Z. and Z.D.; methodology, S.Y. and Y.B.; validation, S.Y., Y.B. and W.S.; formal analysis, S.Y. and Y.B.; investigation, S.Y.; resources, Z.D. and H.Z.; data curation, Y.B.; writing—original draft preparation, Y.B.; writing—review and editing, S.Y. and G.Z.; visualization, S.Y. and Y.B.; supervision, Z.D.; project administration, Z.D. and funding acquisition, H.Z. All authors have read and agreed to the published version of the manuscript.
Funding
This work was supported by the National Natural Science Foundation of China (52102436), the Fundamental Research Funds for the Central Universities (30920021109), the Natural Science Foundation of Jiangsu Province (BK20200496), the China Postdoctoral Science Foundation (2020M681615), the project of Key Laboratory of Impact and Safety Engineering (Ningbo University), the Ministry of Education (CJ202107) and the State Key Laboratory of Mechanics and Control of Mechanical Structures (Nanjing University of Aeronautics and astronautics) (Grant No. MCMS-E-0221Y01).
Institutional Review Board Statement
Not applicable.
Informed Consent Statement
Not applicable.
Data Availability Statement
The data are contained within the article. The data presented in this study can be seen in the contents above.
Acknowledgments
We wish to express our gratitude to the members of our research team, Guang-fa Gao, Zhaojun Pang, Qing Lin, Weiliang Zhu, Mengsheng Li and Chunbo Wu.
Conflicts of Interest
The authors declare no conflict of interest.
References
- Maclay, T.; Mcknight, D. Space environment management: Framing the objective and setting priorities for controlling orbital debris risk. J. Space Saf. Eng. 2021, 8, 93–97. [Google Scholar] [CrossRef]
- Li, M.; Gong, Z.Z.; Liu, G.Q. Frontier technology and system development of space debris surveillance and active removal. Chin. Sci. Bull. 2018, 63, 2570–2591. [Google Scholar] [CrossRef][Green Version]
- Muelhaupt, T.J.; Sorge, M.E.; Morin, J.; Wilson, S.R. Space traffic management in the new space era. J. Space Saf. Eng. 2019, 6, 80–87. [Google Scholar] [CrossRef]
- Whipple, F.L. Meteorites and space travel. Astron. J. 1947, 52, 131. [Google Scholar] [CrossRef]
- Schonberg, W.P. Concise history of ballistic limit equations for multi-wall spacecraft shielding. REACH 2016, 1, 46–54. [Google Scholar] [CrossRef]
- Wen, K.; Chen, X.W.; Lu, Y.G. Research and development on hypervelocity impact protection using Whipple shield: An overview. Def. Technol. 2021, 17, 1864–1886. [Google Scholar] [CrossRef]
- Poniaev, S.A.; Kurakin, R.O.; Sedov, A.I.; Bobashev, S.V.; Zhukov, B.G.; Nechunaev, A.F. Hypervelocity impact of mm-size plastic projectile on thin aluminum plate. Acta Astronaut. 2017, 135, 26–33. [Google Scholar] [CrossRef]
- Hofmann, D.C.; Hamill, L.; Christiansen, E.; Nutt, S. Hypervelocity Impact Testing of a Metallic Glass-Stuffed Whipple Shield. Adv. Eng. Mater. 2015, 17, 1313–1322. [Google Scholar] [CrossRef]
- Duan, M. Research on Damage Characteristics of the Space Debris Shield Impacted by Hypervelocity Multiple Projectiles. Master’s Thesis, Harbin Institute of Technology, Harbin, China, 2018. [Google Scholar]
- Han, X.F. Study on Damage Characteristics of High-Speed Impact on Shield Structure of Wrap Multi-Particle Fragments in Space Temperature Environment. Master’s Thesis, Harbin Institute of Technology, Harbin, China, 2019. [Google Scholar]
- Zhang, D. Research on Fragmentation Characteristics of Packaged Structure Projectile in High-Velocity Impact. Master’s Thesis, Harbin Institute of Technology, Harbin, China, 2020. [Google Scholar]
- Aborehab, A.; Kamel, M.; Nemnem, A.F.; Kassem, M. Finite Element Model Updating of a Satellite Honeycomb Sandwich Plate in Structural Dynamics. Int. J. Space Struct. 2021, 36, 105–116. [Google Scholar] [CrossRef]
- Fatt, M.S.H.; Park, K.S. Perforation of honeycomb sandwich plates by projectiles. Compos. Part A Appl. Sci. Manuf. 2000, 31, 889–899. [Google Scholar] [CrossRef]
- Yahaya, M.A.; Ruan, D.; Lu, G.; Dargusch, M.S. Response of aluminium honeycomb sandwich panels subjected to foam projectile impact–An experimental study. Int. J. Impact Eng. 2015, 75, 100–109. [Google Scholar] [CrossRef]
- Ebrahimi, H.; Ghosh, R.; Mahdi, E.; Nayeb-Hashemi, H.; Vaziri, A. Honeycomb sandwich panels subjected to combined shock and projectile impact. Int. J. Impact Eng. 2016, 95, 1–11. [Google Scholar] [CrossRef]
- Guo, J.S.; Yue, C.F.; Wang, F. Lightweight structure design method for satellites with high payload ratios. J. Harbin Eng. Univ. 2021, 42, 1535–1542. [Google Scholar]
- Man, X. The Design and Dynamics Simulation of Satellite Structure and Mechanism with Complex Constraints. Ph.D. Thesis, Center for Space Science and Applied Research Chinese Academy of Sciences, Beijing, China, 2015. [Google Scholar]
- Liu, S.; Lan, S.W.; Ma, Z.X.; Li, Y.; Huang, J. Experimental study on characteristics of satellite breakup debris. J. Astronaut. 2012, 33, 1347–1353. [Google Scholar]
- Zhang, Y.; Yan, L.; Zhang, C.; Guo, S. Low-velocity impact response of tube-reinforced honeycomb sandwich structure. Thin-Walled Struct. 2021, 158, 107188. [Google Scholar] [CrossRef]
- Zhang, W.; Wei, G.; Xiao, X.K. Constitutive relation and fracture criterion of 2A12 aluminum alloy. Acta Armamentarii 2013, 34, 276–282. [Google Scholar]
- Zhang, Y.; Chen, P. An improved methodology of constructing inter-fiber failure criteria for unidirectional fiber-reinforced composites. Compos. Part A Appl. Sci. Manuf. 2021, 145, 106369. [Google Scholar] [CrossRef]
- Feito, N.; Díaz-Álvarez, J.; López-Puente, J.; Miguelez, M.H. Experimental and numerical analysis of step drill bit performance when drilling woven CFRPs. Compos. Struct. 2018, 184, 1147–1155. [Google Scholar] [CrossRef]
- Yan, Q.X. Experimental and Simulation Research on High Speed Drilling of Printed Circuit Board. Master’s Thesis, Shenzhen University, Shenzhen, China, 2017. [Google Scholar]
- Cheng, B.; Wang, H.Y. Finite element analysis of nylon rotating bands design for gas gun. J. Ordnance Equip. Eng. 2019, 40, 43–46, 51. [Google Scholar]
- Goldsmith, W.; Sackman, J.L. An experimental study of energy absorption in impact on sandwich plates. Int. J. Impact Eng. 1992, 12, 241–262. [Google Scholar] [CrossRef]
- Woodward, R.L.; Cimpoeru, S.J. A study of the perforation of aluminium laminate targets. Int. J. Impact Eng. 1998, 21, 117–131. [Google Scholar] [CrossRef]
- Wang, L.; Li, Y.L.; Suo, T.; Guo, Y.Z. Mechanical behavior of commonly used aeronautical aluminum alloys under dynamic tension. J. Aeronaut. Mater. 2013, 33, 71–77. [Google Scholar]
- Wierzbicki, T. Crushing analysis of metal honeycombs. Int. J. Impact Eng. 1983, 1, 157–174. [Google Scholar] [CrossRef]
- McFarland, R.K. Hexagonal cell structures under post-buckling axial load. AIAA J. 1963, 1, 1380–1385. [Google Scholar] [CrossRef]
- Zhang, Q.N. Study on the Ballistic Impact Effect of Sandwich Panels with Aluminum Honeycomb Cores. Master’s Thesis, Beijing Institute of Technology, Beijing, China, 2014. [Google Scholar]
- Liu, M.F.; Liu, S.X. Mechanical properties of aluminum and aluminum alloys. In Handbook of Mechanical Properties of Metallic Materials, 1st ed.; China Machine Press: Beijing, China, 2011; Volume 1, pp. 527–530. [Google Scholar]
Publisher’s Note: MDPI stays neutral with regard to jurisdictional claims in published maps and institutional affiliations. |
© 2022 by the authors. Licensee MDPI, Basel, Switzerland. This article is an open access article distributed under the terms and conditions of the Creative Commons Attribution (CC BY) license (https://creativecommons.org/licenses/by/4.0/).