Article

Resonance Analysis of Piezoelectric Bulk Acoustic Wave Devices Based on YCOB Crystals with Monoclinic Symmetry Excited by Lateral Electric Fields

1
Piezoelectric Device Laboratory, School of Mechanical Engineering and Mechanics, Ningbo University, Ningbo 315211, China
2
Research and Design Centre, Ningbo Civil Architectural Design Research Co., Ltd., Ningbo 315000, China
3
Department of Architectural Engineering, Ningbo Polytechnic, Ningbo 315800, China
4
The State Key Laboratory of Mechanics and Control of Mechanical Structures, College of Aerospace Engineering, Nanjing University of Aeronautics and Astronautics, Nanjing 210016, China
*
Author to whom correspondence should be addressed.
Crystals 2022, 12(4), 542; https://doi.org/10.3390/cryst12040542
Submission received: 17 March 2022 / Revised: 3 April 2022 / Accepted: 7 April 2022 / Published: 12 April 2022
(This article belongs to the Special Issue Ferroelectrics)

Abstract

:
The monoclinic YCOB crystal still maintains good piezoelectric properties at 800 °C; thus, it has a good application prospect in high-temperature piezoelectric acoustic wave sensors. However, due to the lower symmetry compared crystals in trigonal and tetragonal systems, the exciting characteristics of piezoelectric plates based on monoclinic YCOB crystals are more complicated. The vibration analysis model of lateral-field-excitation (LFE) devices based on monoclinic crystals is scarce; thus, the coupling relationships between different vibration modes and energy-trapping characteristics of the devices are unclear, which hinders the optimal design of devices. In this paper, by using Mindlin plate theory, the high-frequency vibrations of piezoelectric resonators based on monoclinic YCOB crystal plates excited by a lateral electric field are modeled and analyzed. The coupling relationships between the vibration modes of the device are clarified. The influences of the electrode width, electrode/plate mass ratio and electrode gap value on resonances and energy-trapping characteristics of the device are achieved. In addition, the effects of the structure parameters on the mass sensitivity of the monoclinic YCOB LFE devices are investigated, which are further verified by FEM simulations. The results are crucial to obtaining good resonance and sensing characteristics for LFE high-temperature piezoelectric sensors based on crystals with monoclinic symmetry.

1. Introduction

Piezoelectric bulk acoustic wave devices have been extensively utilized in gas and liquid-phase sensing applications in recent years. Conventional piezoelectric bulk acoustic wave sensors usually employ quartz crystal plate stimulated by thickness electric field (containing electrodes on the upper and lower surfaces) [1,2,3,4,5,6,7,8]. Compared with the thickness-field-excitation (TFE), the lateral-field-excitation (LFE) (with electrodes on the same surface) has the advantages of higher quality factors and frequency stabilities, and lower crystal aging rates [9,10,11,12,13]. Sensors applied in high-temperature occasions are in increasing demand, such as gas detection, solid state particle detection and film thickness monitoring in coating systems, etc. [14,15]. Quartz crystals have been used in previous LFE piezoelectric sensors. However, when the temperature exceeds 300 °C, the devices fail to work due to the phase transition of quartz crystals. Besides, due to the low piezoelectric coupling coefficient, the frequency stability and sensitivity of LFE sensors based on quartz crystals are not enough [16]. Monoclinic YCa4O(BO3)3 (YCOB) crystals do not have any phase transition below 1000 °C. Moreover, below 800 °C, it has a high resistivity of 2 × 10⁸ Ohm cm [17]. In the temperature range of 20–800 °C, the variations of the piezoelectric constants and dielectric loss of YCOB crystals are both less than 0.3%, in other words, the dielectric and piezoelectric characteristics of YCOB crystals are almost independent of the temperature [18,19,20]. Thus, LFE piezoelectric bulk acoustic wave devices using YCOB crystals have good application perspectives in the field of high-temperature sensing.
For vibration analysis of AT-cut quartz crystals excited by lateral electric fields, J. S. Yang obtained some useful conclusions [21,22] regarding the lateral electric fields which were generated through a couple of side electrodes at the plate edges. However, due to the limitation of processing techniques, it is difficult to fabricate this kind of ideal electrode due to the thinness of the crystal plates. It is feasible to adopt a couple of electrodes at the plate’s top surface to produce lateral electric fields [23]. YCOB crystals belong to the monoclinic system with space group Cm; due to the lower symmetry compared crystals in trigonal and tetragonal systems, the exciting characteristics of piezoelectric plates based on monoclinic YCOB crystals are more complicated. Until now, the LFE devices’ vibration analysis model using monoclinic crystals has been scarce [24]; thus, the coupling relationships between different vibration modes are unclear, and energy-trapping characteristics of the devices are unknown, which hinders the optimal design of devices.
The current work models and analyzes the high-frequency resonances of bulk acoustic devices based on monoclinic YCOB crystals stimulated through lateral electric fields generated by surface electrodes. The coupling relationships between different vibration modes and energy-trapping characteristics of the LFE device are clarified. Based on those, the influences of structure parameters on mass sensitivities are revealed, which are further verified through finite element-based numerical simulations.

2. Governing Equations

Figure 1 presents a rectangular (zxw) −90° YCOB crystal plate; 2h, 2c, and ρ represent the crystal plate’s thickness, length, and mass density, respectively. Coordinate axes x 1 and x 2 are shown in Figure 1, and x 3 axis is determined from x 1 and x 2 axes by the right-hand rule. The crystal plate is symmetric about x 1 = 0, and unbounded in the x 3 orientation. In the areas of a < | x 1 | < b , the plate is electroded at the top surface, while the electrode’s thickness and mass density are denoted by 2 h and ρ , respectively. A time-harmonic voltage ± V exp ( i ω t ) is exerted across the electrodes, generating an electric field with a dominating part E 1 ( x 1 , t ) in the unelectroded central area.
The distributions of dielectric ( ε ) , piezoelectric ( e ) , and elastic ( c ) constants of z-cut monoclinic crystals with Cm space group are as below, respectively:
ε = [ ε 11 0 ε 13 0 ε 22 0 ε 31 = ε 13 0 ε 33 ] , e = [ e 11 e 12 e 13 0 e 15 0 0 0 0 e 24 0 e 26 e 31 e 32 e 33 0 e 35 0 ] , c = [ c 11 c 12 c 13 0 c 15 0 c 21 = c 12 c 22 c 23 0 c 25 0 c 31 = c 13 c 32 = c 23 c 33 0 c 35 0 0 0 0 c 44 0 c 46 c 51 = c 15 c 52 = c 25 c 53 = c 35 0 c 55 0 0 0 0 c 64 = c 46 0 c 66 ] .
The Mindlin plate equations for monoclinic crystals are different for the unelectroded and electroded plates, given separately in the following. In the unelectroded area, for coupled thickness-shear, thickness-twist, and flexure motions, the displacement and electric potential fields can be calculated approximately by using Mindlin’s plate theory [23,25]:
u 1 x 2 u 1 ( 1 ) ( x 1 , t ) ,   u 2 u 2 ( 0 ) ( x 1 , t ) ,   u 3 x 2 u 3 ( 1 ) ( x 1 , t ) , ϕ ϕ ( 1 ) ( x 1 , t ) ,  
where u 1 ( 1 ) ( x 1 , t ) represents the thickness-shear (TSh1) displacement, coupled to the flexural (F1) displacement u 2 ( 0 ) ( x 1 , t ) and the thickness-twist (TT1) displacement u 3 ( 1 ) ( x 1 , t ) . ϕ ( 1 ) is the electric potential. The governing equations for u 1 ( 1 ) , u 2 ( 0 ) , u 3 ( 1 ) , ϕ ( 1 ) are as follows:
T 1 , 1 ( 1 ) T 6 ( 0 ) = 2 h 3 3 ρ u ¨ 1 ( 1 ) , T 6 , 1 ( 0 ) = 2 h ρ u ¨ 2 ( 0 ) , T 5 , 1 ( 1 ) T 4 ( 0 ) = 2 h 3 3 ρ u ¨ 3 ( 1 ) , D 1 , 1 ( 1 ) D 2 ( 0 ) = 0 .
The following constitutive equations express T 6 ( 0 ) , T 5 ( 1 ) , T 4 ( 0 ) , T 1 ( 1 ) , D 1 ( 1 ) , D 2 ( 0 ) , ( T i ( j ) ) is stress, D i ( j ) is electric displacement)with respect to the plate displacements u 1 ( 1 ) , u 2 ( 0 ) , u 3 ( 1 ) , and the plate’s electric potential ϕ ( 1 ) :
T 6 ( 0 ) = 2 h [ k 1 k 3 c 64 u 3 ( 1 ) + k 1 2 c 66 ( u 2 , 1 ( 1 ) + u 1 ( 1 )   ) + k 1 e 26 ϕ ( 1 ) ] , T 5 ( 1 ) = 2 h 3 3 [ c 51 u 1 , 1 ( 1 ) + c 55 u 3 , 1 ( 1 ) + e 15 ϕ , 1 ( 1 ) ] , T 4 ( 0 ) = 2 h [ k 3 2 c 44 u 3 ( 1 ) + k 1 k 3 c 46 ( u 2 , 1 ( 1 ) + u 1 ( 1 ) ) + k 3 e 24 ϕ ( 1 ) ] , T 1 ( 1 ) = 2 h 3 3 [ c 11 u 1 , 1 ( 1 ) + c 15 u 3 , 1 ( 1 ) + e 11 ϕ , 1 ( 1 ) ] , D 1 ( 1 ) = 2 h 3 3 [ e 11 u 1 , 1 ( 1 ) ε 11 ϕ , 1 ( 1 ) + e 15 u 3 , 1 ( 1 ) ] , D 2 ( 0 ) = 2 h [ ε 22 ϕ ( 1 ) + k 3 e 24 u 3 ( 1 ) + k 1 e 26 ( u 2 , 1 ( 1 )   + u 1 ( 1 ) ) ] ,
where
k 1 = π 2 12 , k 3 = π 2 c 3 12 c 44 , c 3 = ( c 22 + c 44 ( c 22 c 44 ) 2 + 4 c 24 2 ) / 2 .
Substitution (3) into (2), the motion control equations can be obtained as follows:
c 11 u 1 , 11 ( 1 ) + c 15 u 3 , 11 ( 1 ) + e 11 , ϕ 11 ( 1 ) 3 h 2 [ k 1 k 3 c 64 u 3 ( 1 ) + k 1 2 c 66 ( u 2 , 1 ( 0 ) + u 1 ( 1 ) ) + k 1 e 26 ϕ ( 1 ) ] = ρ u ¨ 1 ( 1 ) , k 1 k 3 c 64 u 3 , 1 ( 1 ) + k 1 2 c 66 ( u 2 , 11 ( 0 ) + u 1 , 1 ( 1 ) ) + k 1 e 26 ϕ , 1 ( 1 ) = ρ u ¨ 2 ( 0 ) , c 51 u 1 , 11 ( 1 ) + c 55 u 3 , 11 ( 1 ) + e 15 ϕ , 11 ( 1 ) 3 h 2 [ k 3 2 c 44 u 3 ( 1 ) + k 1 k 3 c 46 ( u 2 , 1 ( 0 ) + u 1 ( 1 ) ) + k 3 e 24 ϕ ( 1 ) ] = ρ u ¨ 3 ( 1 ) , e 11 u 1 , 11 ( 1 ) + ε 11 ϕ , 11 ( 1 ) + e 15 u 3 , 11 ( 1 ) 3 h 2 [ ε 22 ϕ ( 1 ) + k 3 e 24 u 3 ( 1 ) + k 1 e 26 ( u 2 , 1 ( 0 ) + u 1 ( 1 ) ) ] = 0 .
For the electroded area, spatially, the electric potential ϕ ( 1 ) is a constant (which can still be time-varying). Considering the mass impact of the electrodes, the governing equations take the following form:
T 1 , 1 ( 1 ) T 6 ( 0 ) = 2 h 3 3 ( 1 + 3 R ) ρ u ¨ 1 ( 1 ) , T 6 , 1 ( 0 ) = 2 h ( 1 + R ) ρ u ¨ 2 ( 0 ) , T 5 , 1 ( 1 ) T 4 ( 0 ) = 2 h 3 3 ( 1 + 3 R ) ρ u ¨ 3 ( 1 ) , D 1 , 1 ( 1 ) D 2 ( 0 ) = 0 ,
where R = ρ h / ( ρ h ) < < 1 represents the electrode/plate mass ratio, and the relevant constitutive equations are:
T 6 ( 0 ) = 2 h [ k 1 ¯ k 3 ¯ c 64 u 3 ( 1 ) + k 1 ¯ c 66 ( u 2 , 1 ( 0 ) + u 1 ( 1 ) ) + k 1 ¯ e 26 ϕ ( 1 ) ] , T 5 ( 1 ) = 2 h 3 3 [ c 51 u 1 , 1 ( 1 ) + c 55 u 3 , 1 ( 1 ) + e 15 ϕ , 1 ( 1 ) ] , T 4 ( 0 ) = 2 h 3 [ k 3 ¯ 2 c 44 ¯ u 3 ( 1 ) + k 1 ¯ k 3 ¯ c 46 ( u 2 , 1 ( 0 ) + u 1 ( 1 ) ) + k 3 e 24 ϕ ( 1 ) ] , T 1 ( 1 ) = 2 h 3 3 [ c 11 u 1 , 1 ( 1 ) + c 15 u 3 , 1 ( 1 ) + e 11 ϕ , 1 ( 1 ) ] , D 1 ( 1 ) = 2 h 3 3 [ e 11 u 1 , 1 ( 1 ) ε 11 ϕ , 1 ( 1 ) + e 15 u 3 , 1 ( 1 ) ] , D 2 ( 0 ) = 2 h [ ε 22 ϕ ( 1 ) + k 3 ¯ e 24 u 3 ( 1 ) + k 1 ¯ e 26 ( u 2 , 1 ( 0 )   + u 1 ( 1 ) ) ] ,
where k ¯ 1 2 = k 1 2 ( 1 + R ) , k ¯ 3 2 = k 3 2 ( 1 + R ) . Substitution Equation (6) into Equation (5) results in the motion equations of the electroded region:
c 11 u 1 , 11 ( 1 ) + c 15 u 3 , 11 ( 1 ) + e 11 ϕ , 11 ( 1 ) 3 h 2 [ k 1 ¯ k 3 ¯ c 64 u 3 ( 1 ) + k 1 ¯ 2 c 66 ( u 2 , 1 ( 0 ) + u 1 ( 1 ) ) + k 3 ¯ e 26 ϕ ( 1 ) ] = ρ ( 1 + 3 R ) u ¨ 1 ( 1 ) , k 1 ¯ k 3 ¯ c 64 u 3 , 1 ( 1 ) + k 1 ¯ 2 c 66 ( u 2 , 11 ( 0 ) + u 1 , 1 ( 1 ) ) + k ¯ 1 e 26 ϕ , 1 ( 1 ) = ρ ( 1 + R ) u ¨ 2 ( 0 ) , c 51 u 1 , 11 ( 1 ) + c 55 u 3 , 11 ( 1 ) + e 15 ϕ , 11 ( 1 ) 3 h 2 [ k 3 ¯ 2 c 44 ¯ u 3 ( 1 ) + k 1 ¯ k 3 ¯ c 46 ( u 2 , 1 ( 0 ) + u 1 ( 1 ) ) + k 3 ¯ e 24 ϕ ( 1 ) ] = ρ ( 1 + 3 R ) u ¨ 3 ( 1 ) , e 11 u 1 , 11 ( 1 ) ε 11 ϕ , 11 ( 1 ) + e 15 u 3 , 11 ( 1 ) 3 h 2 [ ε 22 ϕ ( 1 ) + k 3 ¯ e 24 u 3 ( 1 ) + k 1 ¯ e 26 ( u 2 , 1 ( 0 ) + u 1 ( 1 ) ) ] = 0 .

3. Dispersion Property and Frequency Spectra

To understand the resonance behaviors of the YCOB piezoelectric plate, it is necessary to evaluate the dispersion equations of waves in unbounded plates. The wave frequency and the wave number along x 1 are denoted by ω and ξ , respectively. According to the straight wave hypothesis, assuming that the potential and displacements are functions related to coordinates x 1 and time t, then in both the unelectroded and electroded regions:
u 2 ( 0 ) = A 1 sin ( ξ x 1 ω t ) , u 3 ( 1 ) = A 2 cos ( ξ x 1 ω t ) , u 1 ( 1 ) = A 3 cos ( ξ x 1 ω t ) , ϕ ( 1 ) = A 4 cos ( ξ x 1 ω t ) ,
where A 1 A 4 represent unknown parameters, ω describes the vibration frequency, ξ is the wave number. Substituting (8) into (4) results in four linear homogeneous relations for A 1 A 4 . The determinant of the coefficient matrix should be zero for nontrivial solutions, resulting in a relation between ω and ξ . Now, the dimensionless frequency Ω and wave number X are defined:
Ω = ω ω 0 , X = ξ / π 2 h , ω 0 = ( π / 2 h ) c 66 / ρ ,
where ω 0 represents the main frequency of TT1 mode of an unelectroded plate and is utilized as a normalizing frequency. h ,   ρ and c 66 are half the thickness, mass density and elastic constant of the YCOB crystal plate, respectively.
In the dispersion diagram shown in Figure 2, the horizontal and vertical axes describe the normalized wave number (Z) and frequency (Ω), respectively. Due to the electrodes’ mass influence, the frequency of the electroded area is always a little smaller than that of the unelectroded region. The branches for the TT1 and TSh1 waves have a limited cutoff with the middle vertical axis, which is the cutoff frequency below which the wave cannot transmit. For TT1 and TSh1 vibrations in the electroded region, when the vibration frequency is between the blue and black lines’ cutoff frequencies, the wave number is real; namely, the wave can propagate normally, while the wave number for the unelectroded region is purely imaginary, namely the wave decays exponentially. This phenomenon is the energy-trapping.
For the finite plate’s free vibrations within c < x 1 < c , the boundary conditions are:
T 6 ( 0 ) = 0 , T 5 ( 1 ) = 0 , T 1 ( 1 ) = 0 , D 1 ( 1 ) = 0 , x 1 = c
The substitution of (8) into (10) results in four linear homogeneous equations for A 1 A 4 . For nontrivial solutions, the determinant of the coefficient matrix of the equations should be zero. The frequency equations determine relations between the resonant frequency Ω and the length/thickness ratio c / h of the plate; namely, the frequency spectra curve can be obtained. The waves’ frequency spectra (TT1, TSh1, F1) are shown in Figure 3. The horizontal straight lines in the figure represent TT1 modes, the slanted curved lines in the upper part represent F1 modes, and the slanted straight lines in the lower part represent TSh1 modes. The intersection of the two lines is with the strongest coupling. The weakest coupling occurs at the midpoint between two intersections, such as the red point in Figure 3.

4. Electrically Forced Vibrations of Finite Crystal Plates

Due to the crystal plate’s symmetry and the applied voltage’s asymmetry, the corresponding piezoelectric coupling fields can be symmetric or asymmetric. The current work only considers the right side of the crystal plate. The corresponding solutions for the electroded and unelectroded regions can be obtained by applying boundary conditions at the edge and continuity conditions at the junctions between various regions.

4.1. Central Unelectroded Area with 0 < x 1 < a

Based on the standing wave hypothesis of the finite plate, the displacements and potential are assumed to be
u 2 ( 0 ) = A 1 sin ( ξ x 1 ω t ) , u 3 ( 1 ) = A 2 cos ( ξ x 1 ω t ) , u 1 ( 1 ) = A 3 cos ( ξ x 1 ω t ) , ϕ ( 1 ) = A 4 cos ( ξ x 1 ω t ) .
Substituting (11) into (4) gives four linear relations for A 1 A 4 . The determinant of the coefficient matrix must be zero for nontrivial solutions, which yields a polynomial equation of degree four of ξ 2 . Four roots can be obtained by solving the equation, which can be expressed as ( ξ ( m ) ) 2 , m = 1–4. The nontrivial solution of the linear relations corresponding to a typical ξ ( m ) is denoted by β p ( m ) with p = 1–4. β p ( m ) represents the ratios between A 1 A 4 . Now, the following symmetric solution can be built:
{ u 2 ( 0 ) u 3 ( 1 ) u 1 ( 1 ) ϕ ( 1 ) } = m = 1 4 C ( m ) { β 1 ( m ) sin ( ξ ( m ) x 1 ω t ) β 2 ( m ) cos ( ξ ( m ) x 1 ω t ) β 3 ( m ) cos ( ξ ( m ) x 1 ω t ) β 4 ( m ) cos ( ξ ( m ) x 1 ω t ) } ,
where C ( 1 ) C ( 4 ) are undetermined constants.

4.2. Electroded Area with a < x 1 < b

Equation (7)(1,3) is inhomogeneous; the solutions of u 1 ( 1 ) , u 3 ( 1 ) can be written as the sum of the general solution of the corresponding homogeneous equation and a particular solution. Equation (7)(2) is homogeneous; thus, the solution of u 2 ( 0 ) can be written as the general solution of the corresponding homogeneous equation [26].
u 2 ( 0 ) = A 1 e i ξ ¯ x 1 e i w t , u 3 ( 1 ) = A 2 e i ξ ¯ x 1 e i w t + u 3 ( 1 ) ˜ , u 1 ( 1 ) = A 3 e i ξ ¯ x 1 e i w t + u 1 ( 1 ) ˜ , ϕ ( 1 ) = A 4 e i ξ ¯ x 1 e i w t + ϕ ( 1 ) ˜ .
Substitution (13) into (7) gives four linear equations for A 1 A 4 . The determinant of the coefficient matrix must be zero for nontrivial solutions, which yields a polynomial equation of degree four of ξ ¯ 2 . Eight roots can be obtained by solving the equation, which can be expressed as ξ ¯ ( m ) , m = 1–8. The specific solution of electric potential here is given by ϕ ( 1 ) ˜ = V/2c. When Equation (13) is substituted into the governing equations of the displacements u 3 ( 1 ) and u 1 ( 1 ) , the specific solutions of displacements TT1 and TSh1 can be obtained, denoted by u 3 ( 1 ) ˜ and u 1 ( 1 ) ˜ , respectively. The nontrivial solution of the linear equations is denoted by β ¯ p ( m ) with p = 1–4 for a typical ξ ¯ ( m ) . β ˜ p ( m ) indicates the ratios between A 1 A 4 . Now, the following general symmetric solutions can be built:
{ u 2 ( 0 ) u 3 ( 1 ) u 1 ( 1 ) ϕ ( 1 ) } = m = 1 8 C ¯ ( m ) { β ¯ 1 ( m ) e i ξ ¯ ( m ) x 1 e i w t β ¯ 2 ( m ) e i ξ ¯ ( m ) x 1 e i w t β ¯ 3 ( m ) e i ξ ¯ ( m ) x 1 e i w t β ¯ 4 ( m ) e i ξ ¯ ( m ) x 1 e i w t } + { 0 u 3 ( 1 ) ˜ u 1 ( 1 ) ˜ ϕ ( 1 ) ˜ } ,
where C ¯ ( 1 ) C ¯ ( 8 ) describe unknown parameters, u 3 ( 1 ) ˜ , u 1 ( 1 ) ˜ and ϕ ( 1 ) ˜ satisfy the following equations:
u 3 ( 1 ) ˜ = 12 k ¯ 3 e 24 V π 2 L + e 26 V [ 12 ( k ¯ 3 ) 2 c 44 c 66 Ω 2 ( 1 + 3 R ) ] ( k ¯ 3 ) L c 64 [ 12 ( k ¯ 3 ) 2 c 44 π 2 + c 66 Ω 2 ( 1 + 3 R ) ] 12 ( k ¯ 1 ) 2 c 66 + π 2 c 66 Ω 2 ( 1 + 3 R ) 12 ( k ¯ 1 ) 2 ( k ¯ 3 ) 2 c 64 , u 1 ( 1 ) ˜ = 12 k ¯ 3 e 24 V π L + e 26 V [ 12 ( k ¯ 3 ) 2 c 44 c 66 Ω 2 ( 1 + 3 R ) ] ( k ¯ 3 ) 2 L c 64 [ 12 ( k ¯ 3 ) 2 c 44 π 2 + c 66 Ω 2 ( 1 + 3 R ) ] 12 ( k ¯ 1 ) 2 c 66 + π 2 c 66 Ω 2 ( 1 + 3 R ) 12 ( k ¯ 1 ) 2 ( k ¯ 3 ) 2 C 64 [ c 66 k ¯ 3 c 64 + π 2 c 66 Ω 2 ( 1 + 3 R ) 12 k ¯ 1 k ¯ 3 c 64 ] e 26 V k ¯ 3 L c 64 , ϕ ( 1 ) ˜ = V / ( 2 c ) .

4.3. Outer Unelectroded Area with b < x 1 < c

Based on the standing wave hypothesis, the displacement and potential forms are given:
u 2 ( 0 ) = A 1 e i ξ ¯ x 1 e i w t , u 3 ( 1 ) = A 2 e i ξ ¯ x 1 e i w t , u 1 ( 1 ) = A 3 e i ξ ¯ x 1 e i w t , ϕ ( 1 ) = A 4 e i ξ ¯ x 1 e i w t .
Substituting (16) into (4) gives rise to four linear equations for ξ ˜ 2 . The determinant of the coefficient matrix should be zero for nontrivial solutions, which yields a polynomial equation of degree four of ξ ˜ 2 . Eight roots can be obtained by solving the equation, which can be expressed as ξ ˜ ( m ) , m = 1–8. Assume that the linear equations’ nontrivial solution is indicated by β ˜ p ( m ) with p = 1–4 for a typical ξ ˜ ( m ) . β ˜ p ( m ) indicates the ratios between A 1 A 4 . Now, the equation’s general symmetric solution is derived as
{ u 2 ( 0 ) u 3 ( 1 ) u 1 ( 1 ) ϕ ( 1 ) } = m = 1 8 C ˜ ( m ) { β ˜ 1 ( m ) e i ξ ¯ x 1 e i w t β ˜ 2 ( m ) e i ξ ¯ x 1 e i w t β ˜ 3 ( m ) e i ξ ¯ x 1 e i w t β ˜ 4 ( m ) e i ξ ¯ x 1 e i w t } ,
where C ˜ ( 1 ) C ˜ ( 8 ) represent unknown parameters.

4.4. Boundary and Continuity Conditions

For the right half of the plate shown in Figure 1, the boundary and continuous conditions are shown below:
At x 1 = a , the continuity conditions are:
u 2 ( 0 ) ( x 1 = a ) = u 2 ( 0 ) ( x 1 = a + ) u 3 ( 1 ) ( x 1 = a ) = u 3 ( 1 ) ( x 1 = a + ) u 1 ( 1 ) ( x 1 = a ) = u 1 ( 1 ) ( x 1 = a + ) T 6 ( 0 ) ( x 1 = a ) = T 6 ( 0 ) ( x 1 = a + ) T 5 ( 1 ) ( x 1 = a ) = T 5 ( 1 ) ( x 1 = a + ) T 1 ( 1 ) ( x 1 = a ) = T 1 ( 1 ) ( x 1 = a + ) D 1 ( 1 ) ( x 1 = a ) = D 1 ( 1 ) ( x 1 = a + ) ϕ ( 1 ) ( x 1 = a ) = ϕ ( 1 ) ( x 1 = a + )
The continuity conditions at x 1 = b can be written as:
u 2 ( 0 ) ( x 1 = b ) = u 2 ( 0 ) ( x 1 = b + ) u 3 ( 1 ) ( x 1 = b ) = u 3 ( 1 ) ( x 1 = b + ) u 1 ( 1 ) ( x 1 = b ) = u 1 ( 1 ) ( x 1 = b + ) T 6 ( 0 ) ( x 1 = b ) = T 6 ( 0 ) ( x 1 = b + ) T 5 ( 1 ) ( x 1 = b ) = T 5 ( 1 ) ( x 1 = b + ) T 1 ( 1 ) ( x 1 = b ) = T 1 ( 1 ) ( x 1 = b + ) D 1 ( 1 ) ( x 1 = b ) = D 1 ( 1 ) ( x 1 = b + ) ϕ ( 1 ) ( x 1 = b ) = ϕ ( 1 ) ( x 1 = b + )
At x 1 = c , the boundary conditions are:
T 6 ( 0 ) ( x 1 = c ) = 0 T 5 ( 1 ) ( x 1 = c ) = 0 T 1 ( 1 ) ( x 1 = c ) = 0 D 1 ( 1 ) ( x 1 = c ) = 0
Substituting (12), (14), and (17) into (18)–(20), results in twenty linear, non-homogeneous expressions for twenty unknown parameters of C ( 1 ) C ( 4 ) , C ¯ ( 1 ) C ¯ ( 8 ) , and C ˜ ( 1 ) C ˜ ( 8 ) . After determining the mentioned parameters, the resonators’ displacements and electric potentials can be obtained for a crystal plate with a width of 2p in the x 3 orientation. Now, the free charge Q e , motional capacitance C , and static capacitance C 0 are given by:
Q e = D 1 ( 1 ) ( x = a ) 2 p , C = Q e 2 V , C 0 = 4 ε 11 h p 2 c .

5. Results and Discussion

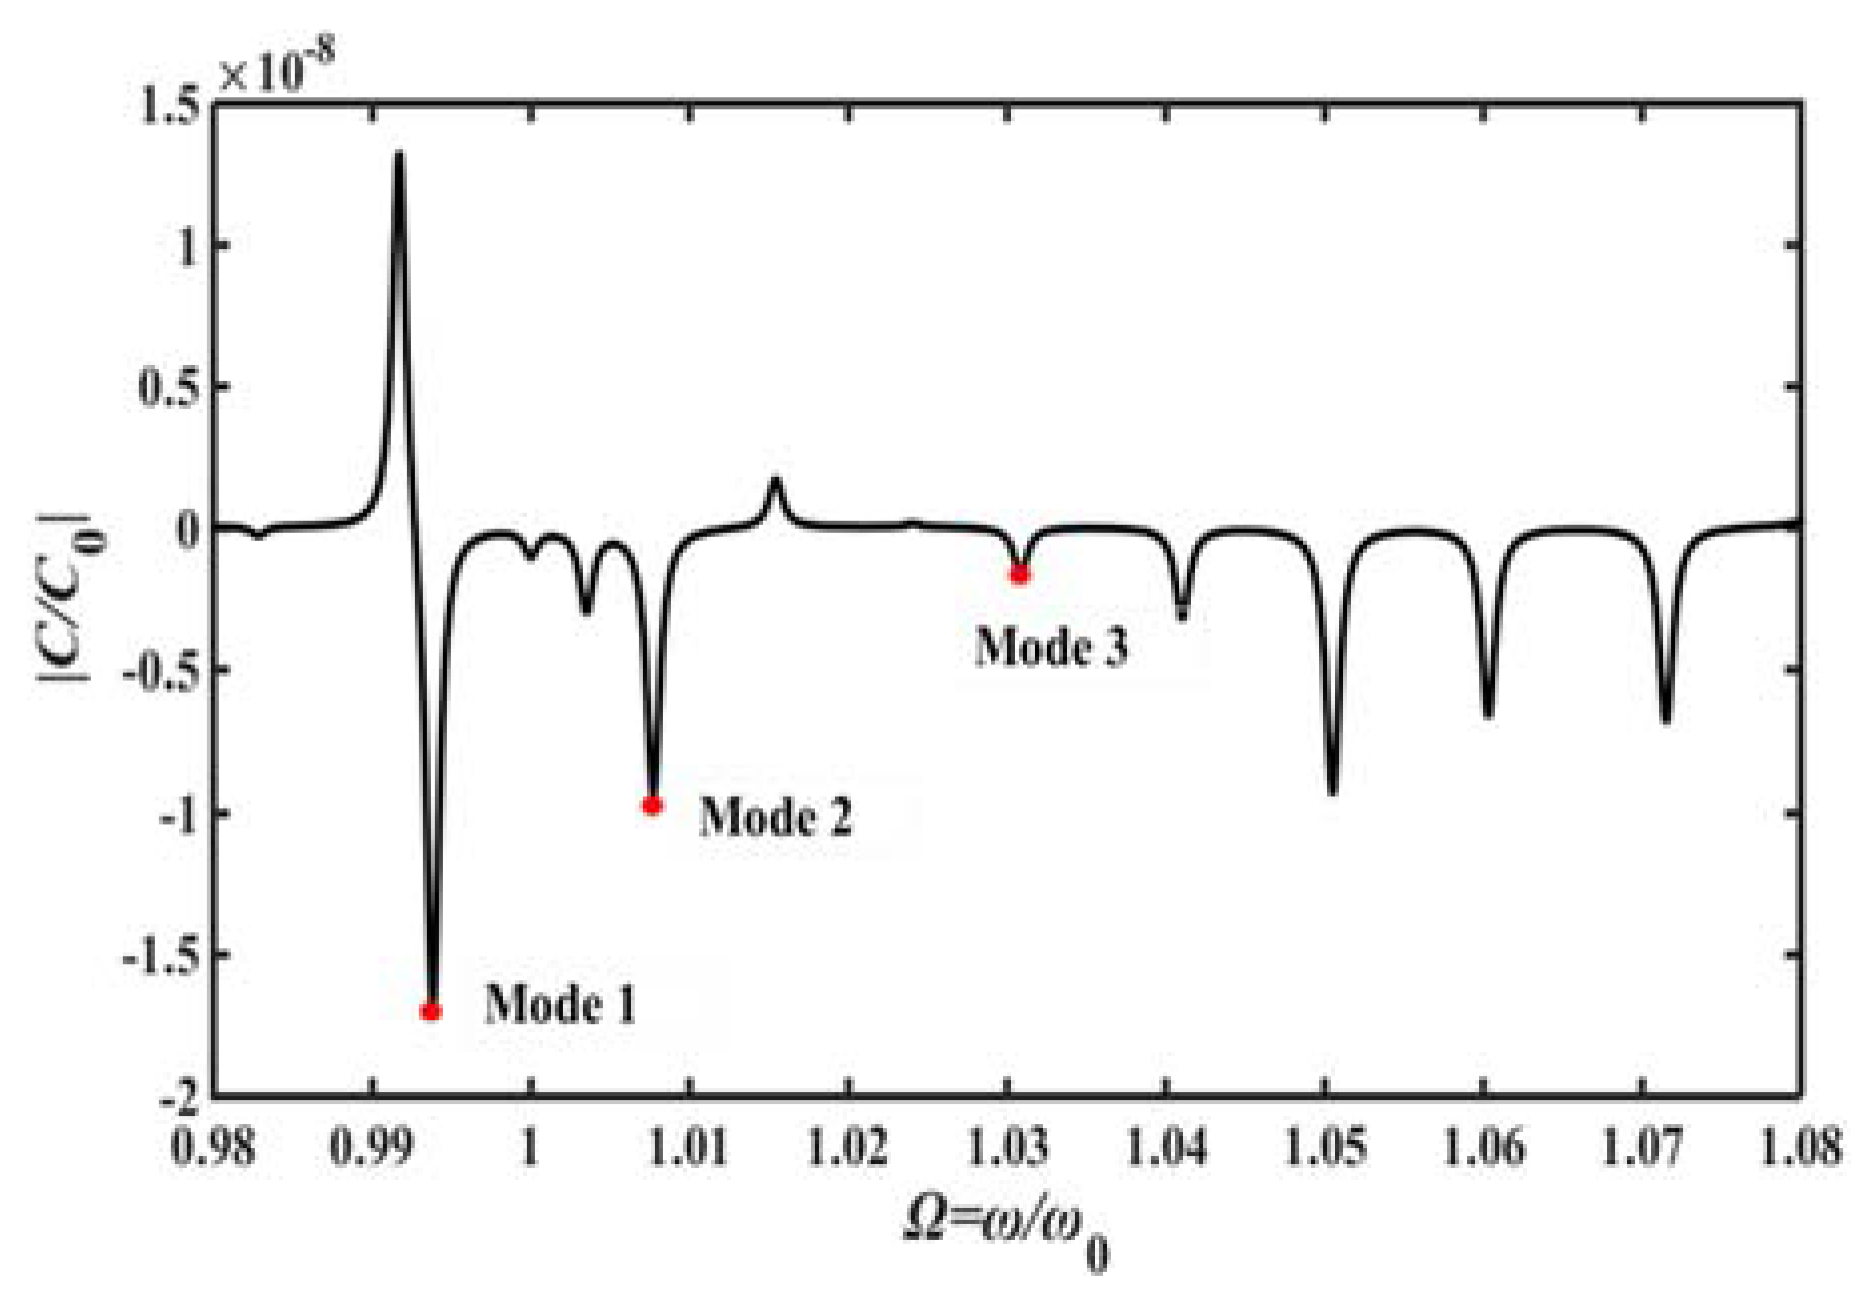
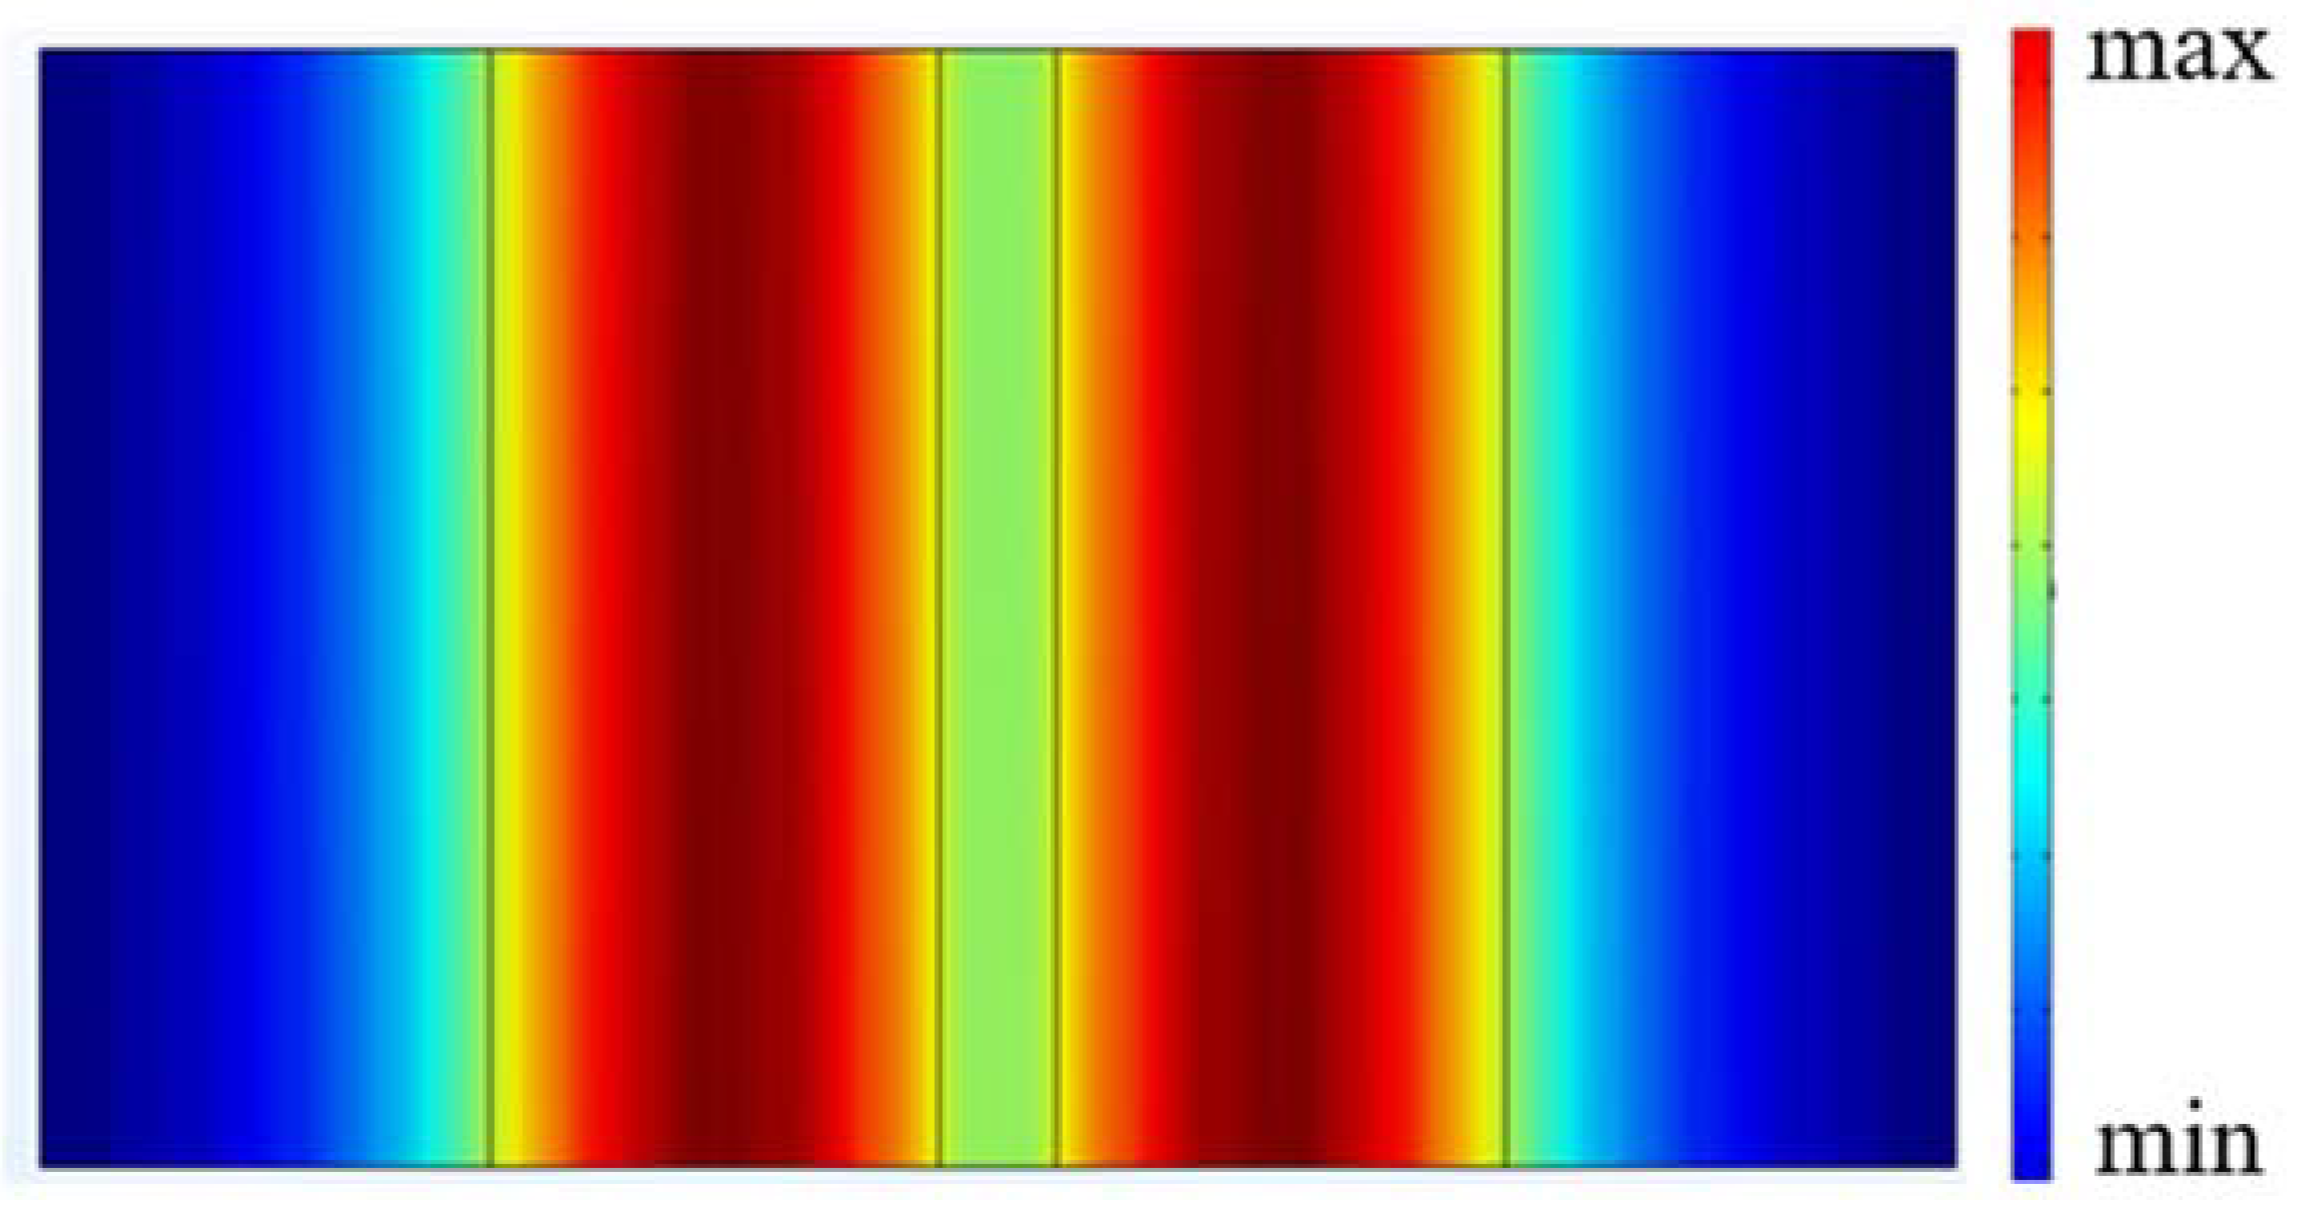
5.1. Mode-Coupling Analysis

As an example, consider a plate with a typical thickness of 2h = 0.0592 mm, a = 0.148 mm, b = 1.2728 mm, c = 2.40056 mm, p = 2.368 mm, R = 0.008. ( z x w ) 90 YCOB is used as the crystal plate material. The electrode material is gold. Material parameters for YCOB crystals can be found in [17]. The fundamental frequency of the device is 25 MHz. In the performed computations, the material parameters are multiplied by a complex term ( 1 + i Q 1 ) , where “ i ” describes an imaginary number and “Q” describes a real number. The viscous damping in the material can be represented with a complex elastic parameter. For YCOB crystals, Q = 103 is utilized in the performed computations considering dampings from material, air, and mounting.
Figure 4 depicts the resonance capacitance with respect to the driving frequency. Resonance capacitance C is normalized by C 0 = 4 ε 11 h p / ( 2 c ) , and ω 0 is calculated from (9). Three main resonance frequencies Modes 1-3 in Figure 4 can be observed, namely 0.9938 ω0, 1.008 ω0 and 1.031 ω0. In order to evaluate the three fundamental resonances in Figure 4 in detail, the corresponding thickness-twist strain distribution u 3 , 1 ( 1 ) and flexure strain distribution u 2 , 1 ( 0 ) are plotted in Figure 5a,b, respectively. In this case, since the lateral electric field cannot stimulate the thickness-shear mode u 1 ( 1 ) , the thickness-shear strain distribution is not considered here.
In Figure 5a, it is shown that the intensity of thickness-twist strain u 3 , 1 ( 1 ) of Mode 1 is largest, and those of Modes 2 and 3 are both very weak. For Mode 1, although the distribution of u 3 , 1 ( 1 ) is considerable in the electroded area, it rapidly declines to zero around the plate edge. The mentioned phenomenon is the so-called energy-trapping effect, in which the resonance characteristics can hardly be affected when mounting the device near the plate edge. As presented in Figure 5b, the intensity of flexure strain u 2 , 1 ( 0 ) of Mode 1 is very weak. Thus, the influences of flexure vibrations on thickness-twist vibration are negligible. Therefore, there exists a good energy-trapping effect for vibrations of thickness-twist, and Mode 1 is ideal for device applications.
In addition, the vibration mode shape for Mode 1 is simulated by using COMSOL Multiphysics, which is shown in Figure 6. It is shown that the main vibration energy is concentrated in the electroded area, vibrations in the unelectroded area are very weak; namely, the energy-trapping effect is obvious. The resonance frequency obtained by the simulation is 24.894 MHz, which is close to that obtained by the theoretical calculation (24.845 MHz).

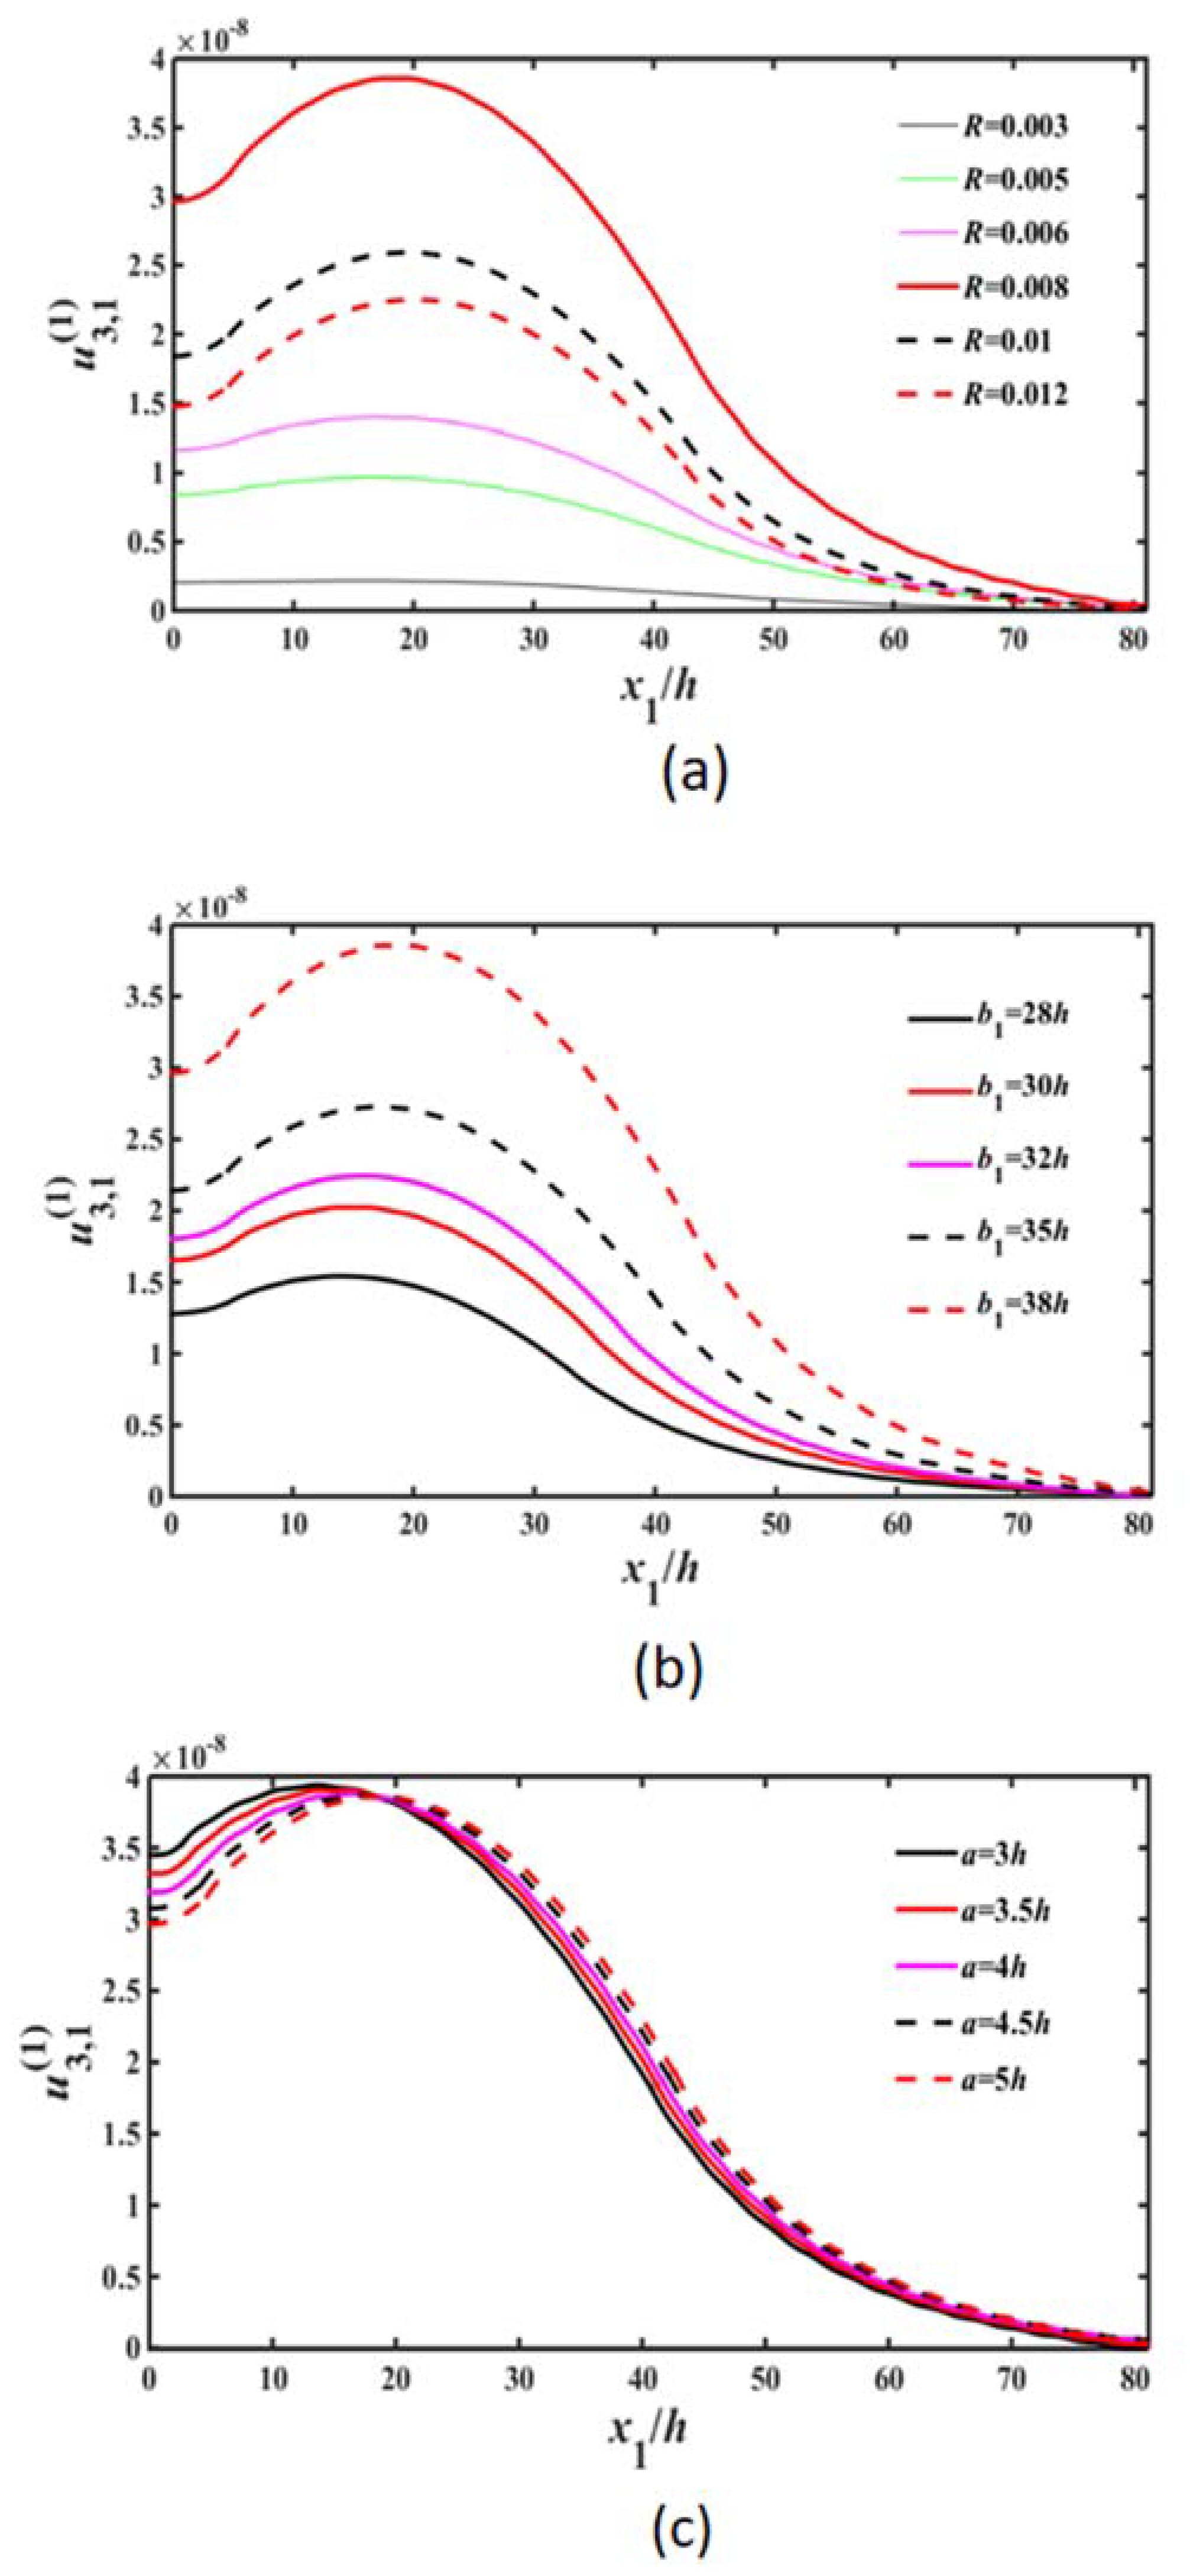
5.2. Effects of Electrode Parameters on the Device’s Vibration Performances

The influences of electrode parameters on the resonator’s vibration performances are examined. In Figure 7a, the electrode/plate mass ratio R is changed while maintaining the other parameters same to those for Figure 5a. It is shown that the vibration intensity is largest when R = 0.008. When R is smaller than 0.008, the vibration intensity increases while increasing the electrode mass ratio R which leads to the resonator’s decreasing impedance value. When R increases to be large enough, the mass effect of the electrode plays a dominant role, which leads to the decreasing of the vibration intensity. Thus, in Figure 7a, when R is larger than 0.008, the vibration intensity decreases with the increasing R.
In Figure 7b, the electrode width b1 is changed while maintaining the other parameters same to those for Figure 5a. It is shown that the vibration intensity increases monotonically with the increase of the electrode width. The reason for this phenomenon lies in that as the electrode width increases, the impedance value (Reciprocal of conductance) of the resonator decreases, which leads to the larger vibration intensity. However, considering the actual installation of the device, a certain installation area should be left, so the electrode width is not be too large.
In Figure 7c, the electrode gap value a (the width of the central unelectroded region) is varied while all other parameters are kept the same as those for Figure 5a. It is shown that the vibration intensity decreases monotonically with the increase of the electrode gap value. When the two electrodes are closer to each other, the attenuation degree of the vibration from energy-trapping is smaller, which results in the larger vibration intensity.

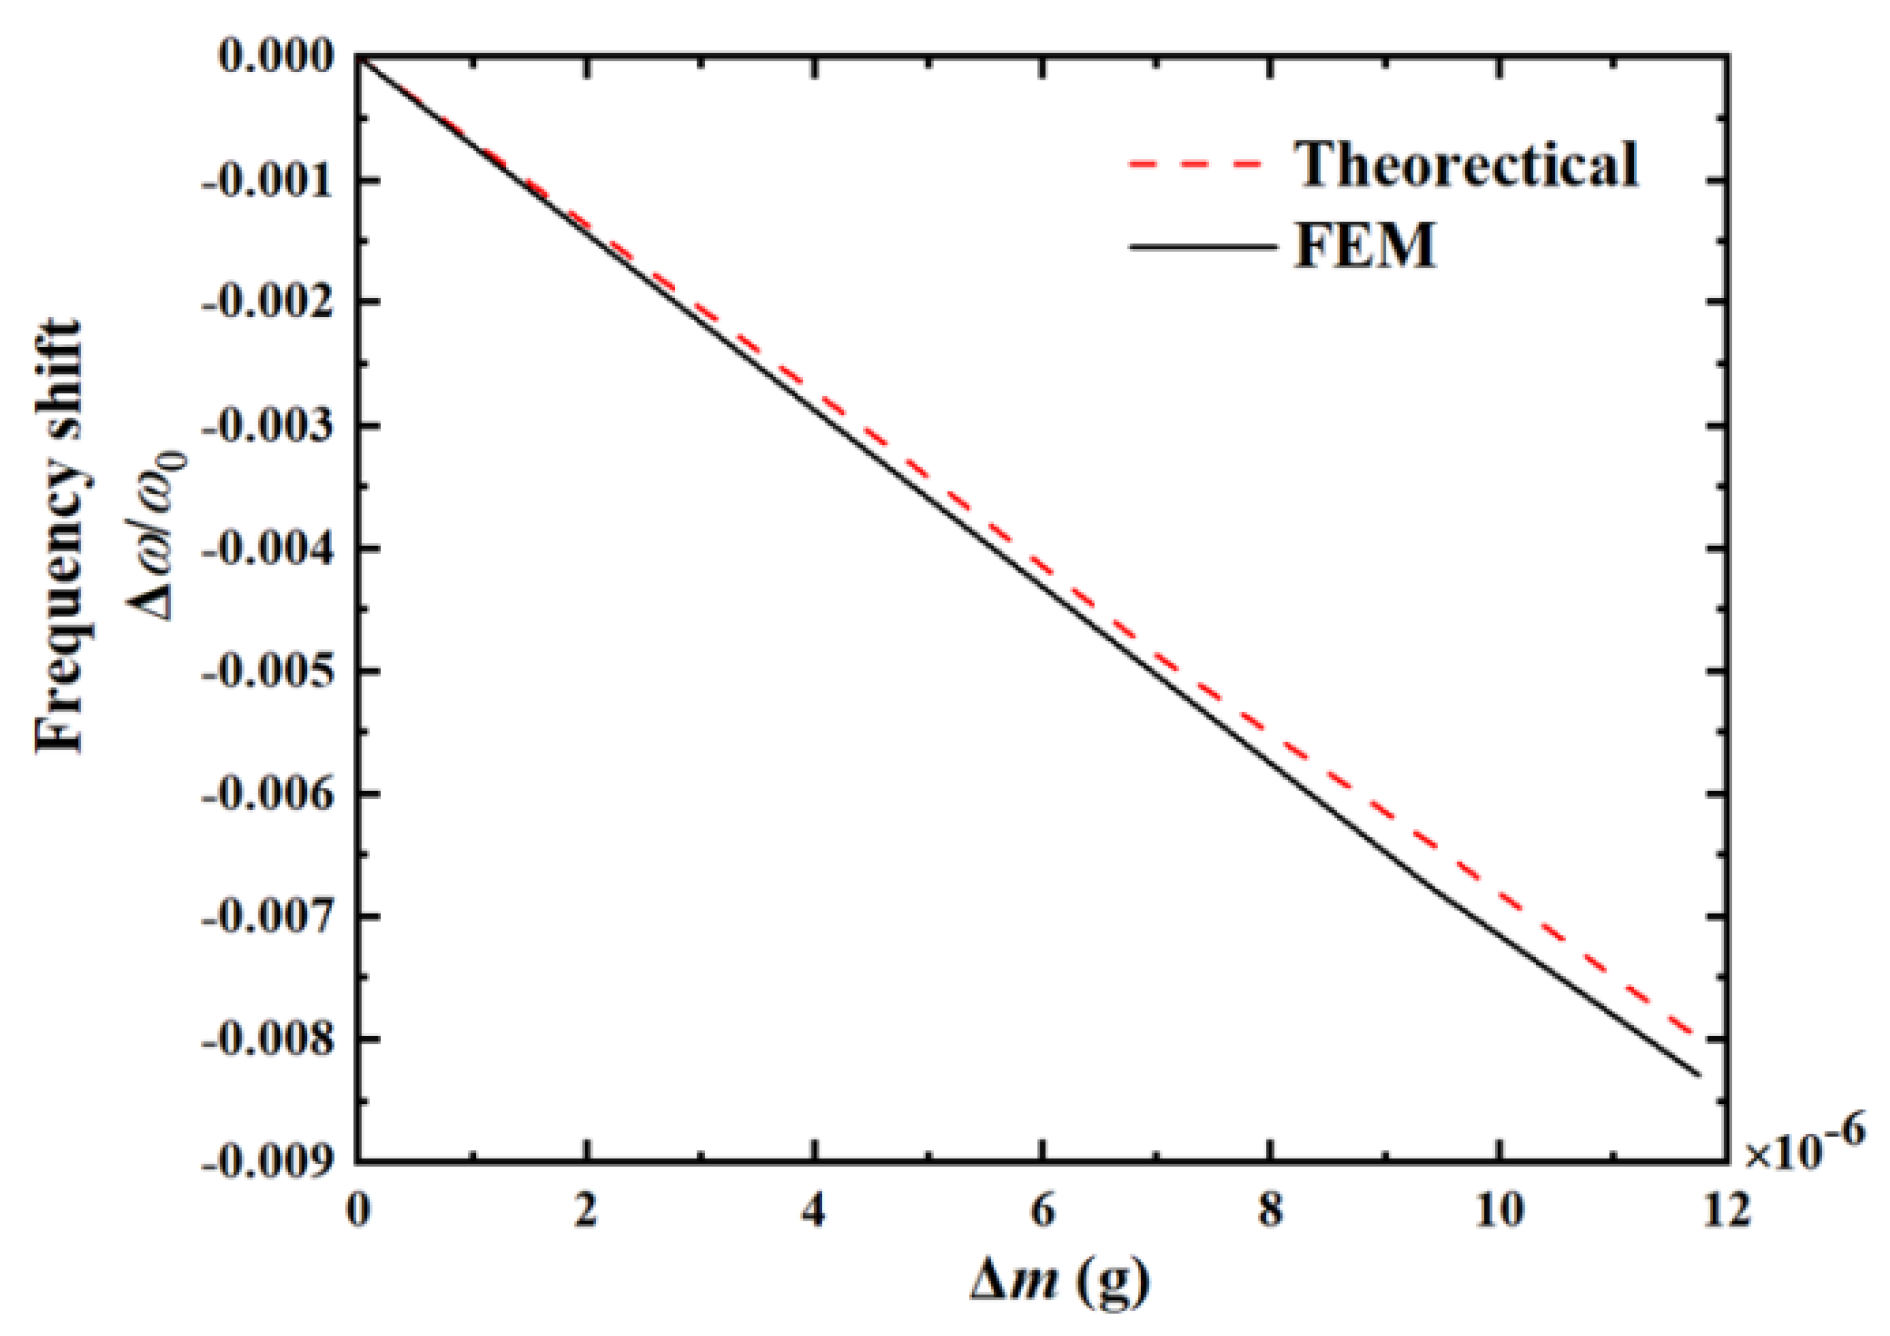
5.3. Frequency Shifts Caused by the Added Mass and Effects of Electrode Parameters on the Mass Sensitivity

The theoretical model is employed to obtain the mass induced normalized frequency shifts Δ ω / ω . In order to evaluate the changing trends of the frequency shift versus the added mass, finite element-based simulations via COMSOL Multiphysics are also accomplished to achieve the frequencies shifts of the devices’ thickness-twist mode. The device parameters are set as below: the thickness is 2h = 0.0592 mm, the electrode/plate mass ratio is R = 0.008, the dimension of crystal plate along x 1 and x 3 are 2c = 4.8 mm and 2p = 4.736 mm, respectively.
As presented in Figure 8, for the theoretical results, the normalized frequency shift declines by 7.989 × 10⁻³ when the added mass increases from 0 to 1.17 × 10⁻⁵ g. The added mass causes a approximately linear decline in the frequency shift. The calculation results obtained by FEM are slightly lower than the theoretical ones. The observed errors may be due to the differences between the Mindlin plate theory with two-dimensional approximations and the three-dimensional model in the FEM method.
Figure 9 show the relationships between the frequency sensitivity on added mass vs. the electrode width b1 and the electrode gap width a, respectively. The frequency sensitivity is described by the ratio of the normalized frequency shift to the mass variation. As depicted in Figure 9a, for the theoretical results, when b1 grows from 28 h to 38 h, the device’s frequency sensitivity increases from 585 to 680 (1/g). With the increase of the electrode width b1, since the device’s vibration strength grows, the frequency sensitivity becomes higher. As shown in Figure 9b, for the theoretical results, while increasing the electrode gap a from 6 h to 10 h, the device’s frequency sensitivity decreases from 726 to 680 (1/g). With the increase of the electrode gap a, the intensity of the lateral electric field declines, while the vibration strength reduces. Accordingly, the frequency sensitivity on the added mass becomes smaller. Similar conclusions are obtained from the simulation results.

6. Conclusions

In the current work, the high-frequency resonances of LFE devices based on monoclinic YCOB crystals stimulated through a lateral electric field are investigated. The coupling relationships between the vibration modes of the device are clarified. It is shown that the capacitance presents maxima at some resonances around the main thickness-twist frequency. The mentioned maxima are associated with thickness-twist, thickness-shear, and flexure modes. The thickness-twist vibration is trapped in the electroded and unelectroded central areas, and thus is appropriate to be the device’s working mode. Moreover, the influences of the electrode parameters on the resonance characteristics are revealed. It is shown that vibrations in the central area are sensitive to the values of the electrode/plate mass ratio, the electrode width, and the electrode gap. Trapped modes with sufficient thickness-twist vibration intensity in the central area can be attained through proper parameter designs. In addition, the influences of the added mass on the LFE devices’ frequency shift using monoclinic YCOB crystals are examined and the effects of the structure parameters on the mass sensitivity are analyzed. It is demonstrated that the mass sensitivity of the device grows while increasing the electrode width b1 and declines while increasing the electrode gap value a. As the monoclinic YCOB crystals can still maintain good piezoelectric properties until 800 °C, LFE devices based on that have great potentialities in high-temperature piezoelectric acoustic wave sensors. The results obtained in this work give an essential theoretical basis for the parameter designs of high-temperature LFE bulk acoustic wave sensors using crystals with a monoclinic system.

Author Contributions

D.C., P.Z., and T.M. presented the idea and performed the theoretical analysis. F.S., L.Y., R.W., P.L., and Z.Q. accomplished the FEM analysis. Discussion about the results and the manuscript writing is contributed to by all the authors. All authors have read and agreed to the published version of the manuscript.

Funding

This work was supported by the National Natural Science Foundation of China (Nos. 11972276, 12172171), the Natural Science Foundation of Zhejiang Province (Nos. LY21A020007, LY19A020003), and the Ningbo Municipal Bureau of Science and Technology (No. 2019B10122).

Institutional Review Board Statement

Not applicable.

Informed Consent Statement

Not applicable.

Data Availability Statement

Not applicable.

Conflicts of Interest

The authors state that there is no conflict of interest.

References

  1. Abe, T.; Higuchi, M. A monolithic QCM array designed for mounting on a flow cell. IEEE Sens. J. 2011, 11, 86–90. [Google Scholar] [CrossRef]
  2. Qiu, H.; Li, F.X. In-plane selective excitation of arbitrary vibration modes using thickness-shear (d15) piezoelectric transducers. Smart Mater. Struct. 2022, 31, 03LT01. [Google Scholar] [CrossRef]
  3. Qian, Z.H.; Kishimoto, K.; Yang, J.S. Propagation of thickness-twist wave in a piezoelectric cramic plate in contact with viscous fluids. Acta Mech. 2009, 212, 263–270. [Google Scholar] [CrossRef]
  4. Zhang, H.; Gao, Y. Acoustic vortex beam generation by a piezoelectric transducer using spiral electrode. Chin. Phys. Lett. 2019, 36, 114302. [Google Scholar] [CrossRef]
  5. Liu, N.; Yang, J.S.; Jin, F. Transient thickness-shear vibration of a piezoelectric plate of monoclinic crystals. Int. J. Appl. Electromagnet. Mech. 2012, 38, 27–37. [Google Scholar] [CrossRef]
  6. Li, P.; Jin, F.; Yang, J.S. Effects of semiconduction on electromechanical energy conversion in piezoelectrics. Smart Mater. Structm 2012, 24, 025021. [Google Scholar] [CrossRef]
  7. Hu, Y.T.; Yang, J.S.; Zeng, Y.; Jiang, Q. A high-sensitivity, dual-plate, thickness-shear mode pressure sensor. IEEE Trans. Ultrason. Ferroelectr. Freq. Contr. 2006, 53, 2193–2197. [Google Scholar] [CrossRef]
  8. Wang, S.H.; Shen, C.Y.; Lin, Y.M.; Du, J.C. Piezoelectric sensor for sensitive determination of metal ions based on the phosphate-modified dendrimer. Smart Mater. Struct. 2016, 25, 085018. [Google Scholar] [CrossRef]
  9. Hu, Y.H.; French, L.A.; Radecsky, K.; da Cunha, M.P.; Millard, P.; Vetelino, J.F. A lateral field excited liquid acoustic wave sensor. IEEE Trans. Ultrason. Ferroelectr. Freq. Contr. 2004, 51, 1373–1380. [Google Scholar] [CrossRef]
  10. Hu, Y.H.; Pinkham, W.; Jr, L.A.F.; Frankel, D.; Vetelino, J.F. Pesticide detection using a lateral bulk excited acoustic wave sensor. Sens. Actuators B Chem. 2005, 108, 910–916. [Google Scholar] [CrossRef]
  11. Hempel, U.; Lucklum, R.; Hauptmann, P.R. Lateral field excited acoustic wave devices: A new approach to bio-Interface sensing. In Proceedings of the 2007 IEEE Frequency Control Symposium, Geneva, Switzerland, 29 May–1 June 2007; pp. 426–430. [Google Scholar]
  12. Ma, T.F.; Zhang, C.; Feng, G.P. Lateral field excited Y-cut langasite bulk acoustic wave sensor. Sens. Actuators B Chem. 2011, 153, 50–53. [Google Scholar] [CrossRef]
  13. Wang, W.Y.; Zhang, C.; Zhang, Z.T.; Liu, Y.; Feng, G.P. Three operation modes of lateral-field-excited piezoelectric devices. Appl. Phys. Lett. 2008, 93, 242906. [Google Scholar] [CrossRef]
  14. Johnson, J.A.; Kim, K.; Zhang, S.J.; Wu, D.; Jiang, X.N. High-temperature acoustic emission sensing tests using a Yttrium calcium oxyborate sensor. IEEE Trans. Ultrason. Ferroelectr. Freq. Contr. 2014, 61, 805–814. [Google Scholar] [CrossRef]
  15. Zhang, S.J.; Fei, Y.T.; Chai, B.H.T.; Frantz, E.; Snyder, D.W.; Jiang, X.N.; Shrout, T.R. Characterization of piezoelectric single crystal YCa4O(BO3)3 for high temperature applications. Appl. Phys. Lett. 2008, 92, 202905. [Google Scholar] [CrossRef]
  16. Borodina, I.A.; Zaitsev, B.D.; Teplykh, A.A.; Shikhabudinov, A.M.; Kuznetsova, I.E. Array of piezoelectric lateral electric field excited resonators. Ultrasonics. 2015, 62, 200–202. [Google Scholar] [CrossRef]
  17. Zhang, S.J.; Fei, Y.T.; Frantz, E.; Snyder, D.W.; Chai, B.H.T.; Shrout, T.R. High-temperature piezoelectric single crystal ReCa4O(BO3)3 for sensor applications. IEEE Trans. Ultrason. Ferroelectr. Freq. Contr. 2008, 55, 2703–2708. [Google Scholar] [CrossRef]
  18. Yu, F.P.; Duan, X.L.; Zhang, S.J.; Yu, Y.J.; Ma, T.F.; Zhao, X. Temperature dependence of electro-elastic properties of yttrium calcium oxyborate single crystals. In Proceedings of the Symposium on Piezoelectricity, Acoustic Waves, and Device Applications (SPAWDA), Shanghai, China, 23–25 November 2012; pp. 293–297. [Google Scholar]
  19. Zu, H.Z.; Wu, A.H.; Wang, Y.Z.; Zhang, S.J.; Shrout, T.R.; Wang, Q.M. Properties of single crystal piezoelectric Ca3TaGa 3Si2O14 and YCa4O(BO3)3 resonators at high-temperature and vacuum conditions. Sens. Actuators A Phys. 2014, 216, 167–175. [Google Scholar] [CrossRef]
  20. Yu, F.P.; Zhang, S.J.; Zhao, X.; Yuan, D.R.; Wang, Q.M.; Shrout, T.R. High temperature piezoelectric properties of yttrium calcium oxyborate single crystals. Phys. Status Solidi-R. 2010, 4, 103–105. [Google Scholar] [CrossRef]
  21. Liu, B.; Jiang, Q.; Xie, H.M.; Yang, J.S. Energy trapping in high-frequency vibrations of piezoelectric plates with partial mass layers under lateral electric field excitation. Ultrasonics 2011, 51, 376–381. [Google Scholar] [CrossRef]
  22. Liu, B.; Jiang, Q.; Hu, Y.T.; Yang, J.S. High-frequency vibrations of piezoelectric plates driven by lateral electric fields. Int. J. Eng. Sci. 2011, 49, 1435–1442. [Google Scholar] [CrossRef]
  23. Ma, T.F.; Zhang, C.; Wang, W.Y.; Zhang, Z.T.; Feng, G.P. Optimal electrode shape and size of lateral-field-excited piezoelectric crystal resonators. IEEE Trans. Ultrason. Ferroelectr. Freq. Contr. 2011, 58, 263–266. [Google Scholar]
  24. Yang, J.S. The Mechanics of Piezoelectric Structures; World Scientific: Singapore, 2006. [Google Scholar]
  25. Mindlin, R.D. High frequency vibrations of piezoelectric crystal plates. Int. J. Solids Struc. 1972, 8, 895–906. [Google Scholar] [CrossRef]
  26. Chen, H.; Wang, J.; Du, J. Electrically Forced Vibrations of Partially Electroded Rectangular Quartz Plate Piezoelectric Resonators. Int. J. Acoust. Vib. 2017, 22, 161–166. [Google Scholar] [CrossRef]
Figure 1. A monoclinic YCOB crystal plate with a lateral-field-excitation.
Crystals 12 00542 g001
Figure 2. Dispersion relationships of ( z x w ) 90 YCOB plate under LFE.
Crystals 12 00542 g002
Figure 3. The YCOB crystal plate’s frequency spectra curves under LFE.
Crystals 12 00542 g003
Figure 4. Normalized capacitance versus driving frequency.
Crystals 12 00542 g004
Figure 5. (a) Thickness-twist strain distribution u 3 , 1 ( 1 ) . (b) Flexure strain u 2 , 1 ( 0 ) distribution.
Crystals 12 00542 g005
Figure 6. The vibration mode shape of the device obtained from COMSOL Multiphysics.
Crystals 12 00542 g006
Figure 7. Effects of electrode parameters on TT1 strain distribution. (a) Electrode mass ratio R. (b) Electrode width b1. (c) Electrode gap a.
Crystals 12 00542 g007
Figure 8. The influences of the added mass on the YCOB LFE device’s frequency shift.
Crystals 12 00542 g008
Figure 9. Frequency sensitivities on added mass vs. electrode parameters. (a) Electrode width b1. (b) Electrode gap a.
Crystals 12 00542 g009
Publisher’s Note: MDPI stays neutral with regard to jurisdictional claims in published maps and institutional affiliations.

