Article

Phase Transitions and Amorphization of M2AgF4 (M = Na, K, Rb) Compounds at High Pressure

1
Centre of New Technologies, University of Warsaw, Banacha 2C, 02-097 Warsaw, Poland
2
Department of Inorganic Chemistry and Technology, Jožef Stefan Institute, Jamova Cesta 39, SI-1000 Ljubljana, Slovenia
3
Center for High Pressure Science and Technology Advanced Research, Shanghai 201203, China
*
Author to whom correspondence should be addressed.
Crystals 2022, 12(4), 458; https://doi.org/10.3390/cryst12040458
Submission received: 5 February 2022 / Revised: 8 March 2022 / Accepted: 22 March 2022 / Published: 25 March 2022
(This article belongs to the Special Issue Advances in Halide Perovskite Materials)

Abstract

:
We report the results of high-pressure Raman spectroscopy studies of alkali metal fluoroargentates (M2AgF4, where M = Na, K, Rb) combined with theoretical and X-ray diffraction studies for the K member of the series. Theoretical density functional calculations predict two structural phase transitions for K2AgF4: one from low-pressure monoclinic P21/c (beta) phase to intermediate-pressure tetragonal I42d structure at 6 GPa, and another to high-pressure triclinic P1 phase at 58 GPa. However, Raman spectroscopy and X-ray diffraction data indicate that both polymorphic forms of K2AgF4, as well as two other fluoroargentate phases studied here, undergo amorphization at pressures as low as several GPa.

1. Introduction

The alkaline metal fluoroargentate M2AgF4 family (M = Na, K, Rb) [1] is a group of compounds analogous in many properties to the important La2CuO4 oxocuprate [2,3], which is a precursor of the first known oxocuprate superconductor [4]. Specifically, [AgF2] layers are isoelectronic with [CuO2] planes, both formally hosting one hole in the d10 set of the transition metal [5,6,7]. The ambient-pressure crystal structures and magnetic properties of these compounds have recently been explored in experimental and computational studies [8,9].
At ambient pressure, double fluoroargentates crystallize in different space groups depending on the alkali metal cation embedded in the structure. Na2AgF4 adopts a monoclinic P21/c post-perovskite structure [10], while Rb2AgF4 adopts an orthorhombic layered double-perovskite structure [11]. Under ambient pressure and at room temperature, K2AgF4 can, depending on the route of synthesis, adopt either the lower-enthalpy P21/c structure (β-K2AgF4 polymorph [12]) or the higher-enthalpy metastable orthorhombic Cmce structure (disordered α-K2AgF4) [1]. The effect of high pressure on double fluoroargentates and the effect of chemical pressure from the smaller alkaline metal cations (Na, K) have been predicted to lead to a structural phase transition to a more closely packed β structure [12]. However, it remains an open question whether the application of pressure could result in the formation of [AgF2] sublattice, similar to that for pristine antiferromagnetic AgF2, that is, free from the antiferrodistortive ordering of the [AgF6] octahedra. Lack of antiferrodistortive ordering is a prerequisite for the possible generation of superconductivity in these materials [2].
The purpose of this study was to determine the behavior of Na2AgF4 and isostructural β-K2AgF4, as well as α-K2AgF4 and isostructural Rb2AgF4, at high external pressure, using a combination of theoretical and experimental methods.

2. Materials and Methods

2.1. Synthesis

Powder samples of K and Rb fluoroargentates were prepared at high temperature using anhydrous alkaline metal fluorides and silver difluoride, as described in the literature [1]. Platinum boats enclosed in nickel reactors were used to handle reactive specimens. The solid substrates were loaded in an argon-filled glove box, with residual water content lower than 2 ppm. AgF2, which was used as a substrate in all syntheses, was prepared using a previously described method [13]. β-K2AgF4 polymorph was obtained via thermal annealing of the α-form at 180 °C for 6 h [12].
Sodium analogue was obtained using a somewhat similar synthetic pathway as the one reported for high-purity KAgF3 [14], that is, via a trivalent silver intermediate.
2   MF + AgF 2 T M 2 AgF 4                 ( M = K ,   T = 480   C ;   M = Rb ,   T = 400   C ) 2   NaF + AgF 2   aHF ,   KrF 2   NaF + NaAgF 4 400   C 550   C ,   vacuum   Na 2 AgF 4 α - K 2 AgF 4 180   C , 6   h β - K 2 AgF 4

2.2. Instrumental Methods

All Raman spectra were measured using T64000 spectrometer with an LN2-cooled CCD detector. A SpectraPhysics Ar/Kr gas laser provided a 514.5 nm excitation line. A confocal microscope with 200 µm aperture was used in all experiments. A 300 L/mm diffraction grating was used in every experiment. Laser power lower than 5 mW was used. Rayleigh-scattered light was cut off using a low-pass edge filter.
Pressure was determined in all cases using a Ruby2020 gauge [15], and in the XRD experiments was additionally crosschecked with pressure calculated using a position of (111) reflection of gold [16]. Good agreement was observed and the ruby scale was consistently applied. IIAS diamond anvil pairs with 250 µm or 300 µm culets were used. Gaskets composed of stainless steel with 250 µm thickness were indented by compression up to approximately 20 GPa, after which holes with 100 µm diameter were drilled using tungsten carbide drills. Thin slices of FEP (fluorinated ethylene-propylene) foil were used as pressure medium in all measurements, except for Na2AgF4, where tightly pressed dry NaF powder (Sigma Aldrich, Saint Louis, USA) was used for this purpose. All samples were loaded in an argon-filled glove box, with residual water content lower than 1 ppm. Raman measurements were conducted for samples enclosed in Almax Diacell SymmDAC60, whereas XRD diffraction patterns were obtained for samples enclosed in Almax One20DAC.
Laser heating of the samples was not used, since the materials used tend to decompose with the elimination of F2; moreover, when laser heated, these samples would be extremely reactive with respect to diamond and gasket.
XRD diffraction patterns were collected at 293 K using a SuperNova Single Source Rigaku Oxford diffractometer with laboratory source, an Ag lamp (λ = 0.56087 Å). Due to the low intensity of signals from the sample, the scans were conducted for 2θ < 45°.

2.3. Computational Methods

Computational exploration of structures of K2AgF4 at high pressure was conducted using the following method: first, candidates for high-pressure polymorphs in the 0–100 GPa range were selected by learning algorithms implemented in XtalOpt r11.0 [17,18] and additionally by modifying the proposed high-pressure structures of Ag3F4 [19] via substitution of Ag(I) with K(I); such substitution is justified because the Pauling ionic radii of silver and potassium cations are quite similar (Ag(I): 1.26 Å, K(I): 1.33 Å). DFT (PBE) geometry optimization with cut-off energy of 950 eV and self-consistent-field convergence criterion of 10−6 eV per atom was then carried out, yielding a set of candidate structures (VASP software was utilized for this purpose [20,21,22,23,24]). Further optimization of geometry using DFT + U method (U = 5.5 eV, J = 1 eV) [25] with PBE functional adapted for solids (PBEsol [26]) was carried out for a range of different ferromagnetic and antiferromagnetic models. Finally, one minimum-enthalpy structure was selected for each external pressure point. This structure was then used for additional single-point calculations for several different magnetic models to estimate the strength of magnetic superexchange using the DFT + U method (cf. ESI). A typical density of the k-point grid was 0.04 Å−1.
Since learning algorithms produce P1 structures, symmetry-recognition routines were applied. Space groups for unit cells presented in the Supplemental Material (SM) were determined with an accuracy of 0.05 Å.

3. Results

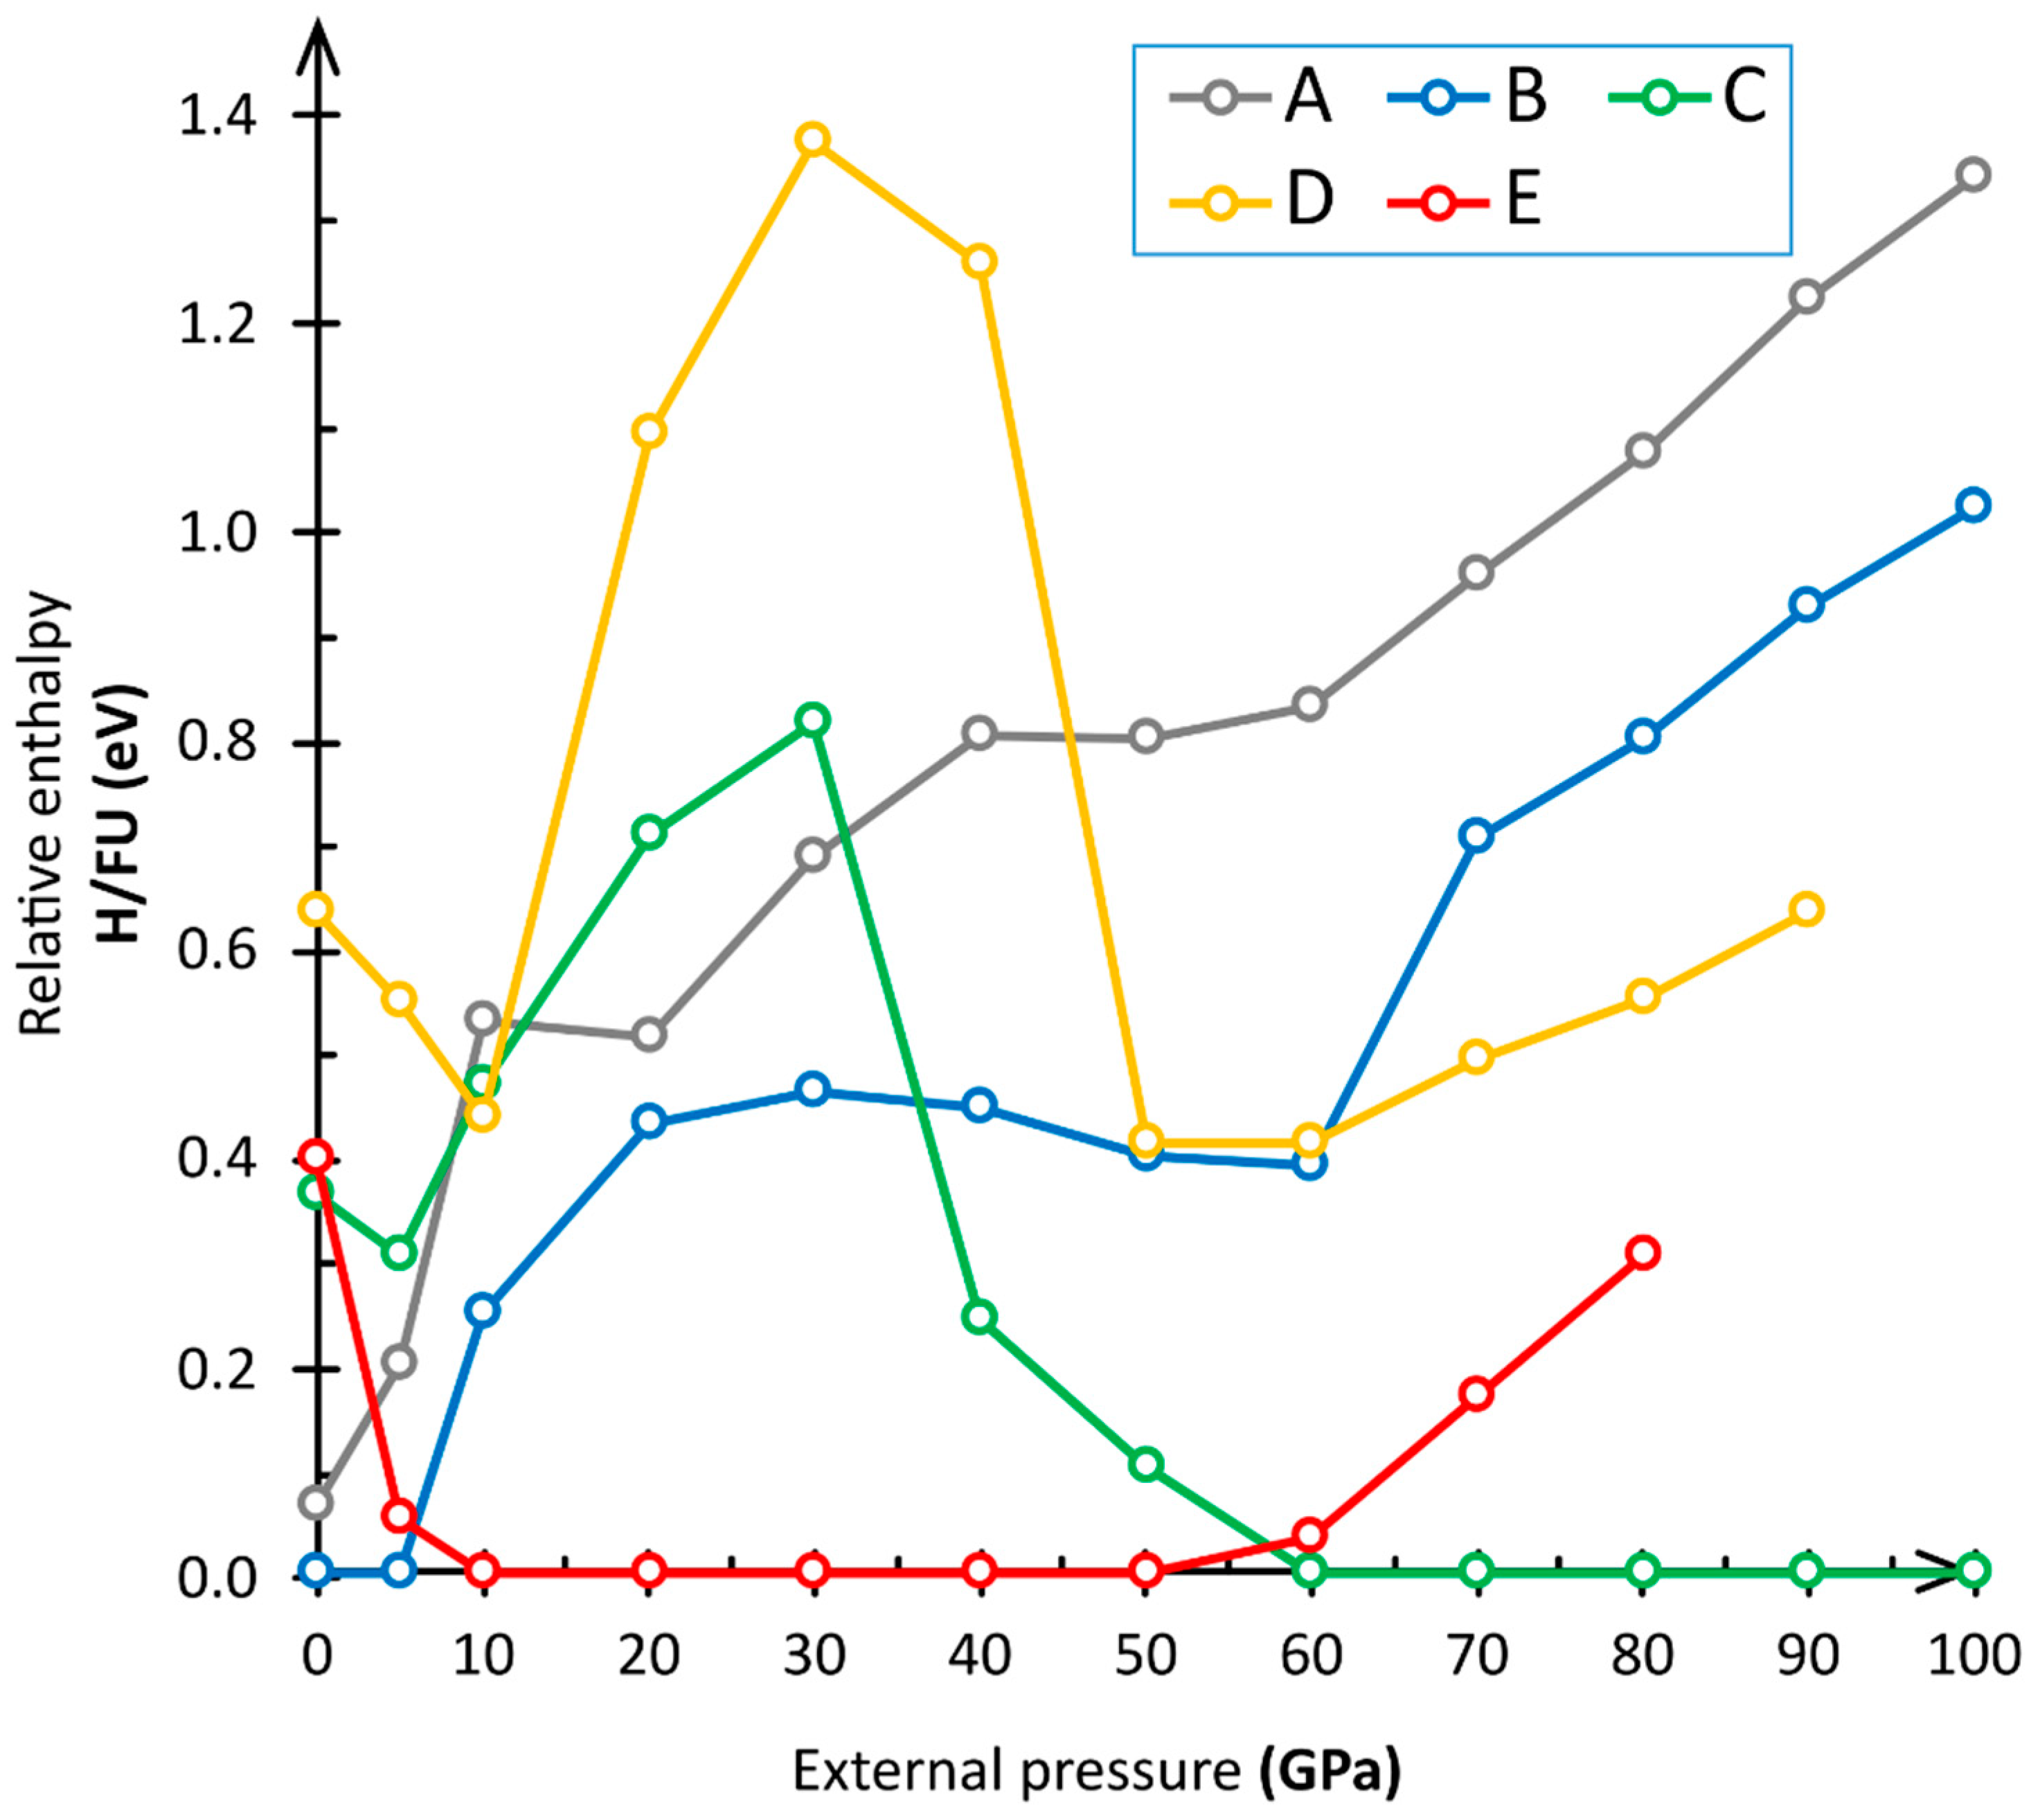
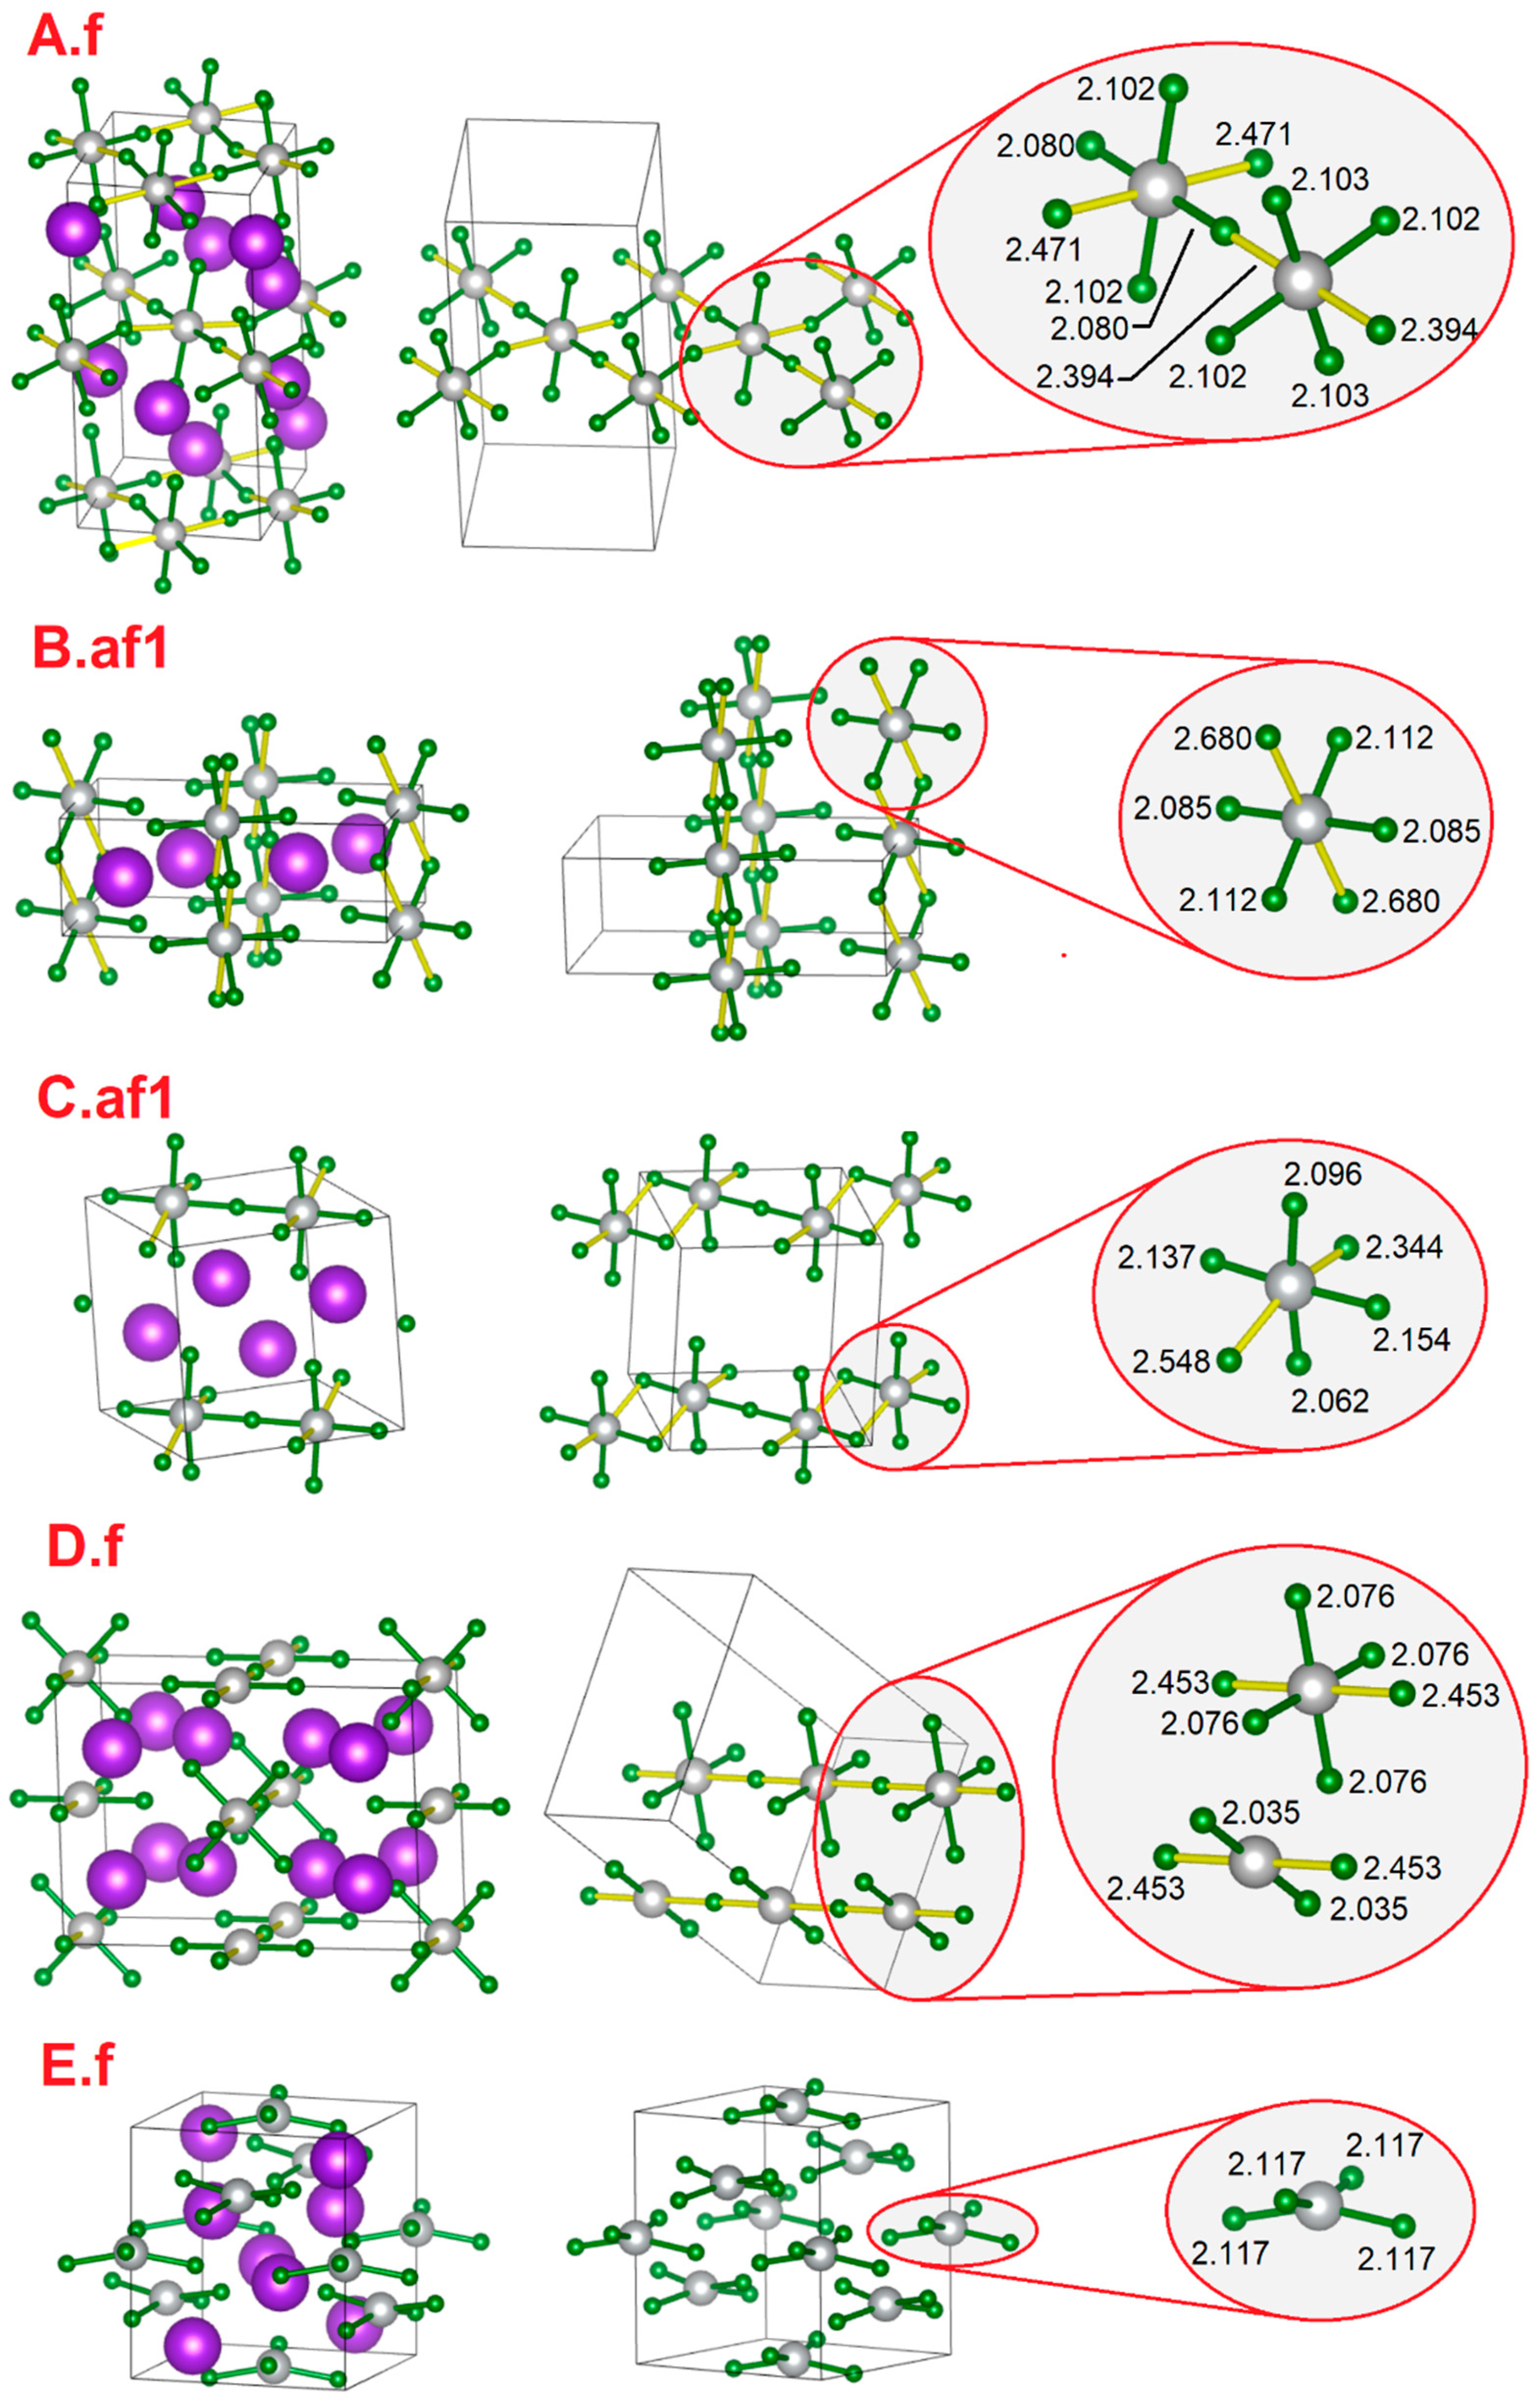
3.1. Computational Results

We begin by discussing theoretical results obtained for K2AgF4. The potassium compound was selected for the theoretical study because it is the only fluoroargentate(II) which exhibits polymorphism in the absence of external pressure. Therefore, it can be used to validate the accuracy of the computational approach, and conclusions from its study may be qualitatively applied to systems with smaller (Na) or larger (Rb) alkali metal cations.
The learning algorithms used for the structure prediction of K2AgF4 at ambient and elevated pressure up to 100 GPa produced a large number of structures. However, many corresponded (within error margins) to the same few structure types. Moreover, only a few structures were relevant to the phase diagram in terms of their enthalpy. Therefore, only the five most important polymorph candidates (labeled from A to E) are described here; the label of each structure also contains the letters f (for ferromagnetic) or af (for antiferromagnetic ordering), as is typical for each structure in its magnetic ground state. Their crystal structures and structural parameters are shown and listed in the SM.
Inter alia, using manual feed of XtalOpt we considered the Ammm form, which was proposed as a high-pressure structure of K2CuF4 [27,28], but its enthalpy was always larger than those reported here.
The five structures mentioned (cf. SM for .cif files) correspond to:
A—the layered double perovskite corresponding to the lowest-energy ordered variant of the disordered experimental α-K2AgF4 polymorph;
B—the monoclinic post-perovskite structure corresponding to experimental β-K2AgF4 polymorph;
C—a triclinic chain structure hosting Ag2F7 dimers interconnected to another chain via F anions;
D—another orthorhombic chain structure with a more complex arrangement of AgF4 squares and AgF2 dumbbells;
E—tetragonal structure originating from Ag(I)2Ag(II)F4 [19] by Ag(I) to K(I) substitution.
Since only three of these structures (A, B, E) are relevant to investigate in terms of possible phase transitions, they are shown jointly in Figure 1 (structures corresponding to 0 GPa are shown). The unit cell vector and volumes of the high-pressure structures are given as a percent value of the 0 GPa theoretical structures in Table 1. The relative enthalpies of the five structures in the 0–100 GPa range are presented in Figure 2 (cf. also the Supplementary Materials).
DFT calculations correctly grasp the key structural features of the α and β polymorphs of K2AgF4, the associated magnetic properties, as well as their respective stability at 0 GPa [9]. α-K2AgF4 hosts an antiferrodistortive ordering of tilted AgF6 octahedra, which leads to the ferromagnetic ground state [9,29]. Our calculations for the ordered P21/c model correctly predict the ferromagnetic lowest-energy state for this polymorph. On the other hand, the β-K2AgF4 polymorph features infinite chains composed of isolated AgF4 units which are stacked in such a manner that the magnetic superexchange is very weak, and the antiferromagnetic and ferromagnetic solutions are close in energy [29]. Moreover, the β-form is more stable at 0 GPa than the α one, as evidenced by the facile structural collapse of metastable α-K2AgF4 in a properly designed experiment [12]. Since the β-form is more suited than the α-form to accommodate the K(I) cation, it is expected that the former should prevail over the latter as pressure is increased. This is indeed what the calculations show; the enthalpy of the α-form increased rapidly with the pressure increase.
The β-form is predicted here to be the ground state of K2AgF4 up to ca. 6 GPa, when it should be substituted by the Ag2AgF4-type polymorph (E); the E form, in turn, should be stable to at least 58 GPa, while the C form should prevail in enthalpy. Theoretical calculations also predict that pressure increases should lead to progressive cross-linking of the structural element features in all polymorphs studied, as is usual at elevated pressure [30,31,32].
The body-centered tetragonal E form (I-42d) is analogous to that predicted recently for Ag2AgF4 at elevated pressure, and it features AgF4 squares which are distorted in a butterfly manner from the ideal plane forms. The C form, which is stable at the highest pressures studied here, features direct Ag-F-Ag links between the AgF4 squares; the proof of progressive increase is in the degree of network “polymerization”.
The A, B, C, D, and F forms exhibit a decreasing volume per formula unit, ranging from 125.0 Å3 for form A to 109.2 Å3 for form E. Obviously, the volume per formula unit drops substantially at elevated pressure. For example, it equals 91.3 Å3 for form E at 10 GPa and as little as 66.8 Å3 for form C at 60 GPa; the latter implies a 2-fold reduction with respect to form A at 0 GPa. Remarkably, despite that, the shortest Ag-F bond lengths drop only insignificantly, from 2.08 Å (form A, 0 GPa) to 2.04 Å (form C, 60 GPa). This is evidence of the very small compressibility of stiff covalent Ag-F bonds, as also observed for AgF2 at elevated pressure [33].

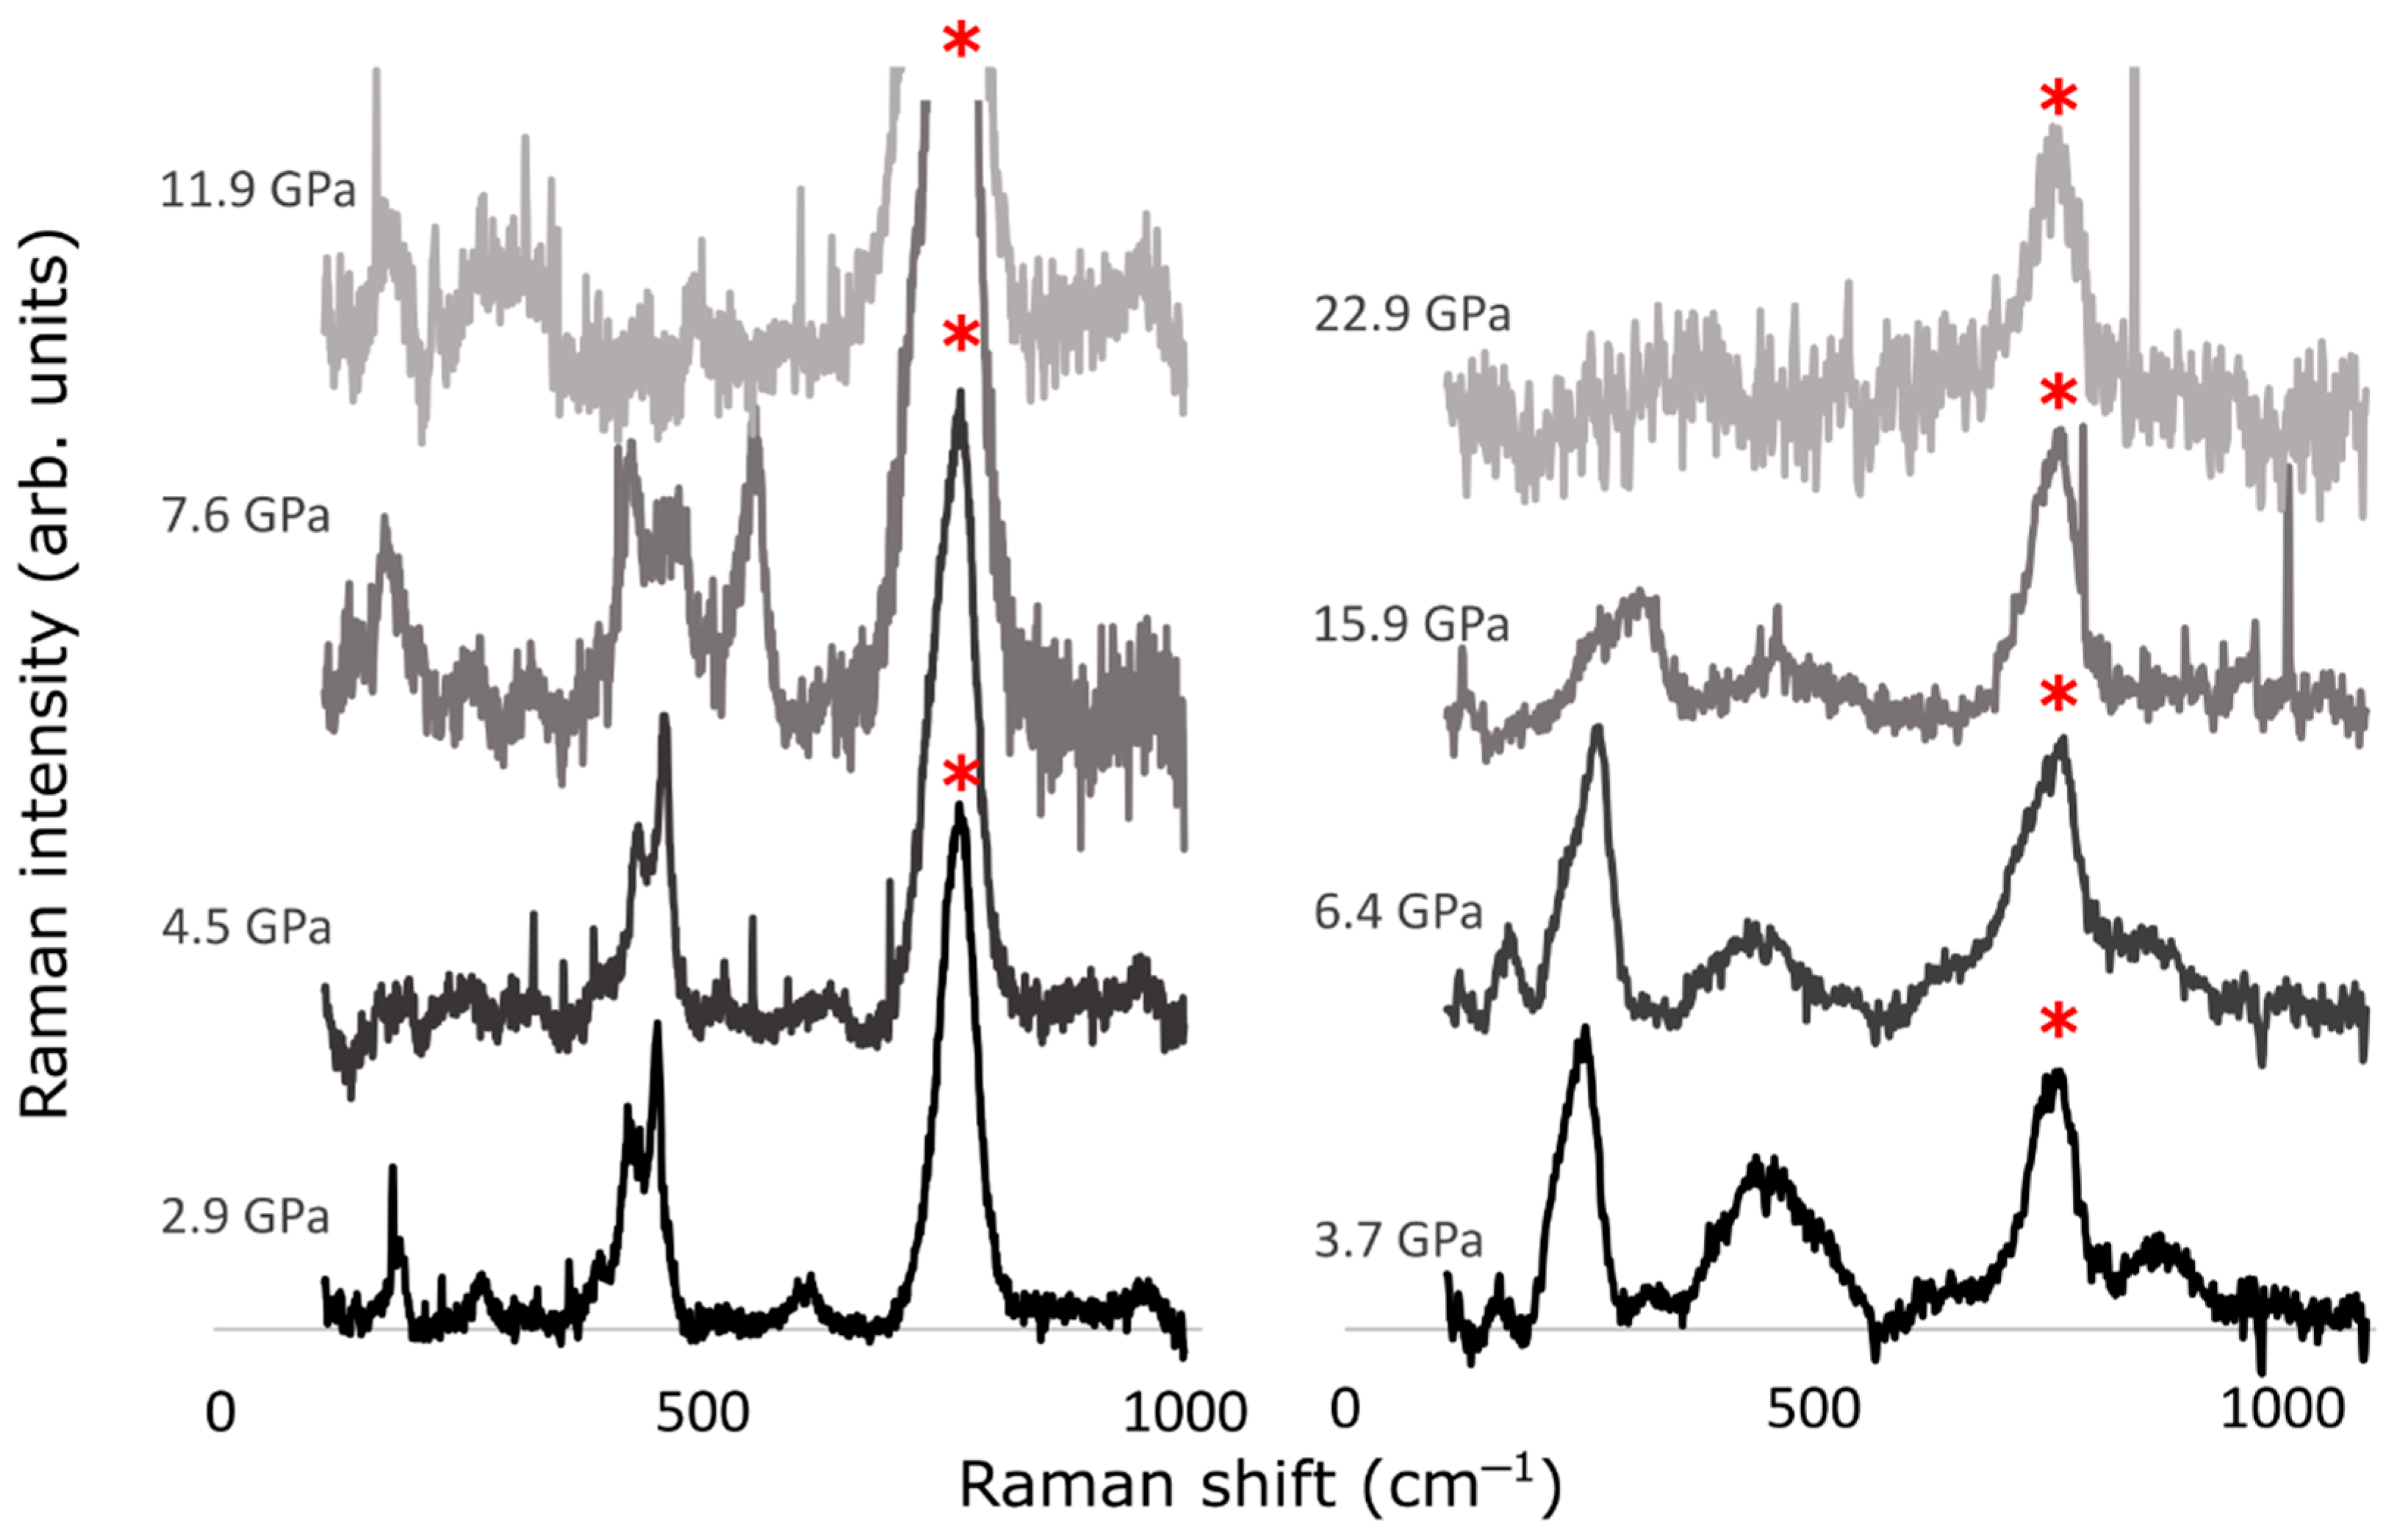
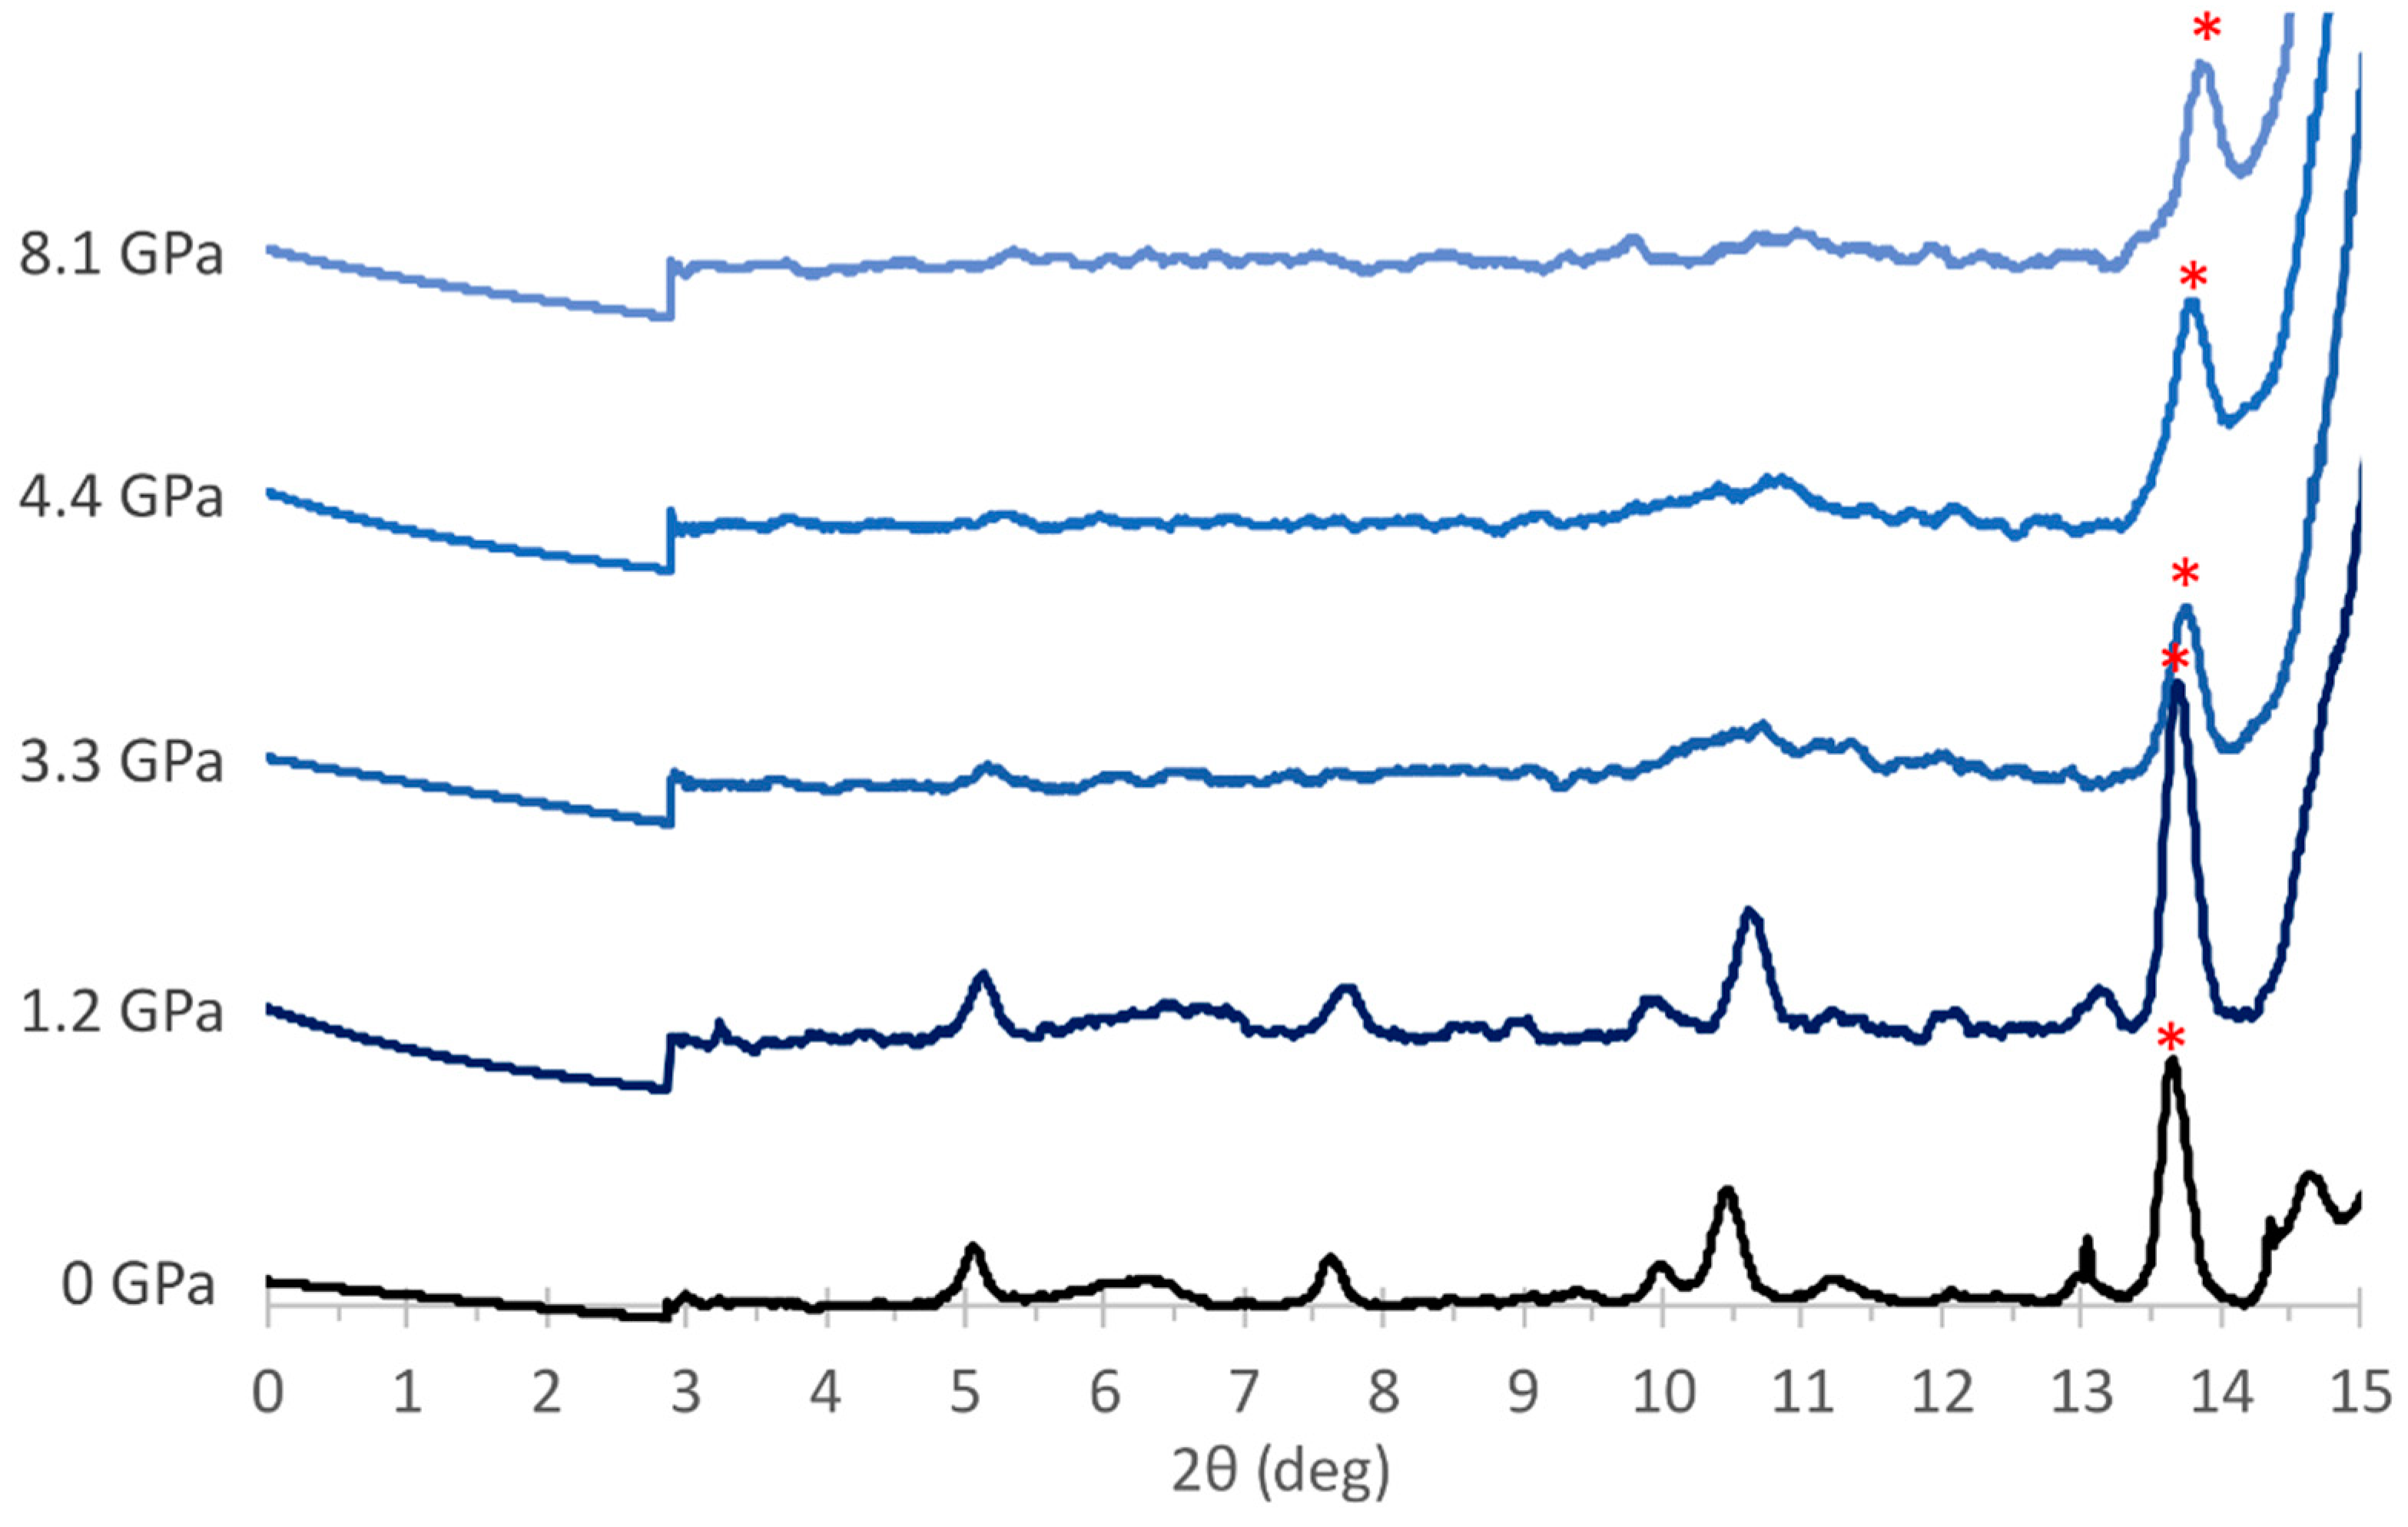
3.2. Experimental Results

We begin our analysis of experimental data with the case of α-K2AgF4, for which both Raman spectra and X-ray diffraction patterns (XRDPs) were obtained as a function of pressure. An analogous set of results was also obtained for β-K2AgF4.
Raman spectra of both polymorphs of K2AgF4 are presented in Figure 3, while XRDPs of the α-form are shown in Figure 4.
Because the sample of α-K2AgF4 was loaded into DAC along with FEP slices used as an inert hydrostatic medium, the measured Raman spectrum contains bands from both materials. More precisely, the broad, strong band near 760 cm−1 is caused by symmetric stretching of C-C-C chains in the polymer, while a shoulder band at 395 cm−1 originates from bending of the polymer skeleton—both bands are indicated with red asterisks in the respective figures. Further analysis of these FEP bands is omitted here.
The Raman spectrum of α-K2AgF4 at the rather low pressure of 2.9 GPa is reminiscent of that at 1 atm (cf. Supporting Information to ref. [12]). The ambient pressure spectrum is predominated by three bands coming from vibrational fundamentals at 320 cm−1 (weak), 415 cm−1 (strong), and 476 cm−1 (very strong) [12]. The weakest of these bands is not seen in the spectrum measured at 2.9 GPa, but the strongest two are clearly visible at 427 cm−1 and 453 cm−1. The upshift of the former band by 12 cm−1 and the downshift of the latter by 23 cm−1 clearly originate from the impact of external pressure. These bands further migrate to 433 cm−1 and 461 cm−1 (both showing a small upshift), respectively, at 4.5 GPa. A more dramatic effect is seen at 7.6 GPa, when three bands appear in the spectra at 413 cm−1, 470 cm−1, and 547 cm−1. While the former two might be reminiscent of the bands seen for α-K2AgF4, the highest Raman shift band certainly signifies the appearance of a new phase. Its wavenumber is unusually large, and it suggests the presence of very short Ag-F bonds, whose stretching mode could give rise to this band.
It is tempting to associate the appearance of the high-wavenumber band with either β-K2AgF4 (which is certainly more stable then α-K2AgF4) or even with the E structure, predicted to be minimum of enthalpy at this pressure. However, the Raman spectra of the β-K2AgF4 form (Figure 2) show that the main broad Raman doublet detected for this form at 437 and 460 cm−1 (420 and 486 cm−1 at ambient pressure) does not stiffen as pressure is raised, hence it cannot be responsible for the appearance of the band at 547 cm−1. Simultaneously, theoretical analysis of Ag-F bond lengths seen for the A, B, and E structures suggests that it is polymorph A, which hosts the shortest Ag-F bonds, that is observed here. Therefore, the appearance of the 547 cm−1 band cannot be explained by the presence of polymorph E. The origin of the latter band is not clear at present.
Unfortunately, further analysis of the evolution of the Raman bands for α-K2AgF4 and β-K2AgF4 at higher pressures was precluded by very low signal-to-noise ratios in the spectra measured at 11.9 GPa and 22.9 GPa, respectively. The disappearance of bands indicative of K2AgF4 phases likely reflects amorphization or even decomposition of both samples.
In order to elucidate the nature of the phase transition taking place between 4.5 and 7.6 GPa, we attempted to obtain additional insight from the evolution of the XRDPs of α-K2AgF4 at 2θ > 14° with pressure (Figure 4). Unfortunately, the XRDPs are dominated by contributions from DAC elements (diamond, stainless-steel gasket) and gold (i.e., the pressure gauge). Furthermore, due to the size and position of the beamstop in our experimental setup, patterns were cut off at 2θ < 3°. Therefore, usable information can be extracted from the patterns only for the narrow 3–14° 2θ range. This of course increases the difficulty of the analysis, although some basic information about the crystal structure (i.e., cell parameters) could be deduced. This is because for the α-K2AgF4 form at 0 GPa, five strong reflections are expected in the available 2θ range: (002), (111), (020), (200), and (113) (Figure 4). The positions of those reflections can be then used to calculate the cell vectors and volume in the orthogonal system.
In the case of the α-K2AgF4 sample, our measurement inside DAC at 0 GPa properly reproduced the expected diffraction pattern of this compound at 1 atm [12]. Increasing pressure to 1.2 GPa yielded a very similar pattern, with positions slightly shifted to higher 2θ values, as expected for pressure-induced compression. Precise calculation of the unit cell vectors is complicated by broadening of the reflections. Diffraction patterns measured at still higher pressures of 3.3, 4.4, and 8.1 GPa do not improve the analysis, as most of the α-K2AgF4 reflections fade away in intensity, and they are hardly discernible at the largest pressure applied here. This observation is consistent with the Raman data and suggests that α-K2AgF4 likely undergoes amorphization at pressures above ca. 8 GPa. In view of this discouraging result, and as indicated by equally poor-quality Raman spectra of the β-form, its XRDPs were not studied.
Two analogs of K2AgF4, that is, disodium and dirubidium salts, were also studied using Raman scattering spectroscopy.
The most prominent band in the ambient-pressure Raman spectrum of Na2AgF4 (Figure 5) is present at 450 cm−1. As we have seen, analogous bands are present in Raman spectra of other members of the M2AgF4 family, and the 450 cm−1 band corresponds to the totally symmetric vibrations of [AgF4]2− square subunits. Several other, much weaker, bands can be found at 153, 222, 273 (sh), 330, 370 (sh), and 524 (sh) cm−1. Compression of the Na2AgF4 sample led to a clear decrease in spectral quality associated also with band broadening, and the disappearance of all weaker features; only the broad 276 and 458 cm−1 features are seen. Between 2.1 GPa and 11.6 GPa the signal-to-noise ratio for all bands decreased even further; two main bands are seen at 463 and 505 cm−1. The appearance of the new band might indicate a structural phase transition. Subsequent measurements at even higher pressures up to 54.5 GPa led to additional broadening of the bands, indicating a possible amorphization of the fluoroargentate. At the highest recorded pressure for which spectra were recorded, only two extremely broad bands are seen: at 640 cm−1 and a shoulder at 467 cm−1. They likely correspond to the stretching and deformation vibrations, respectively, of the [AgF4]2− units in a disordered structure.
The Rb2AgF4 spectrum at ambient pressure (Figure 5) contains two strong/very strong bands at 405 and 485 cm−1, as well as several weaker bands at 193, 320, and 605 cm−1. The former two bands correspond to analogous bands seen at 415 cm−1 (strong) and 476 cm−1 (very strong) in the Raman spectrum of α-K2AgF4. Compression of the sample from 0 to 3.9 GPa led to substantial stiffening of the main bands from 485 to 538 cm−1 and from 405 to about 443 cm−1. Stiffening of the fundamentals was quite large (>10%) for a relatively small pressure increment, which together with the fact that the Ag-F bonds are quite incompressible [33] hints at the occurrence of a structural phase transition below 3.9 GPa. This scenario would be further supported by the appearance of several weaker spectral features in the Ag-F stretching region. Unfortunately, progressive compression up to 37.7 GPa had a similar effect as already seen for the other members of the M2AgF4 family—that is, an immense band broadening which might again suggest sample amorphization.

4. Discussion

At first glance, there seems to be an apparent discrepancy between the theoretical and experimental results obtained in this study. Theory suggests the occurrence of at least two structural pressure-induced phase transitions in the pressure range up to 60 GPa for K2AgF4. Based on the general rules for high-pressure research [31,32], one may expect that these transitions would also be present for Na and Rb analogues, occurring at higher and lower pressures, respectively, than for potassium salt. On the other hand, experiments pointed to a progressive amorphization of all samples as pressure was increased. Importantly, we did not observe a transition to the La2CuO4-like structure, with the ferrodistortive arrangement of the AgF6 octahedra, as this would be a prerequisite for the generation of superconductivity in these layered materials. Additionally, the quantum mechanical calculations do not suggest the appearance of such structures at elevated pressures.
One explanation for this discrepancy between experimental and theoretical data could be that the energy barrier for structural transitions predicted here is too large to be overcome at the studied p/T conditions. Indeed, it can be noticed that, for example, the low-pressure B → E structural transition is associated with the breaking up of [AgF4] infinite chains and reorganization of the local [AgF4] square subunits, which adopt a strained (not flat) orientation in the B polymorph. Since the heavy atom sublattice is also strongly affected by the transition, its energy barrier could be large indeed. Note that our experiments were conducted without laser heating of the samples, since such heating would inevitably lead to reactions between extremely reactive Ag(II) salts and DAC elements. As a consequence, phases observed in the experiment may not correspond to the most thermodynamically stable ones (i.e., ones which are predicted using the theoretical approach). Computations of amorphous systems are certainly possible using programs adapted for periodic systems (e.g., [34]). Regretfully, they require extremely large supercells (“quasi-amorphous periodic systems”) and they are currently beyond the possibilities of our supercomputer resources.
It is clear that there are many factors at play which determine the high-pressure behavior of fluoroargentates(II), and this will supposedly lead to further experimental and computational studies aimed at elucidating the structural features of the amorphous phases.

5. Conclusions

The compression of selected fluoroargentates (M2AgF4, M = Na, K, Rb) at ambient temperature led to amorphization of the samples at relatively moderate pressures. On the other hand, the DFT calculations for K2AgF4 indicate possible presence of stable high-pressure polymorphs. Two structural phase transitions were predicted: to the body-centered tetragonal form at ca. 6 GPa, and then to the triclinic form at ca. 58 GPa. Further studies on this subject require careful computations of the mechanism of amorphization, or experiments probing other p/T conditions via laser heating (however damaging this might be to the diamond anvil cells).

Supplementary Materials

The following supporting information can be downloaded at: https://www.mdpi.com/article/10.3390/cryst12040458/s1. Structures and crystallographic information files for five computationally studied polymorphs of K2AgF4.

Author Contributions

J.G. and W.G. conceived the study; J.G. and Z.M. synthesized the samples; J.G. and V.S. performed high-pressure experiments; Ł.W. performed quantum-mechanical computations; J.G. wrote the manuscript; A.G. and W.G. revised the manuscript. All authors have read and agreed to the published version of the manuscript.

Funding

J.G. would like to thank Polish National Science Centre (NCN) for the Preludium 14 project (2017/27/N/ST5/01066). Z.M. acknowledges the financial support from the Slovenian Research Agency (research core funding No. P1-0045; Inorganic Chemistry and Technology). Computations were conducted using supercomputers of the Interdisciplinary Centre for Mathematical and Computational Modelling, ICM, University of Warsaw, within grant no. GA83-34 (SAPPHIRE). Research was carried out with the use of CePT infrastructure financed by the EU (the European Regional Development Fund within the Operational Programme “Innovative economy” for 2007–2013, POIG.02.02.00-14-024/08-00).

Data Availability Statement

Experimental data (Raman spectra and XRD patterns) are available from the corresponding author upon request.

Conflicts of Interest

The authors declare no conflict of interest.

References

  1. Mazej, Z.; Goreshnik, E.; Jagličić, Z.; Gaweł, B.; Łasocha, W.; Grzybowska, D.; Jaroń, T.; Kurzydłowski, D.; Malinowski, P.; Koźminski, W.; et al. KAgF3, K2AgF4 and K3Ag2F7: Important Steps towards a Layered Antiferromagnetic Fluoroargentate(II). CrystEngComm 2009, 11, 1702–1710. [Google Scholar] [CrossRef]
  2. McLain, S.E.; Dolgos, M.R.; Tennant, D.A.; Turner, J.F.C.; Barnes, T.; Proffen, T.; Sales, B.C.; Bewley, R.I. Magnetic Behaviour of Layered Ag Fluorides. Nat. Mater. 2006, 5, 561–565. [Google Scholar] [CrossRef] [PubMed]
  3. Grochala, W. On Similaritsies and Differences of the Electronic Structure for Cu(II)/O2-and Ag(II)/F1-Infinite Layer Compounds. Scr. Mater. 2006, 55, 811–814. [Google Scholar] [CrossRef]
  4. Bednorz, J.G.; Müller, K.A. Possible High Tc Superconductivity in the Ba-La-Cu-O System. Z. Phys. B Condens. Matter 1986, 64, 189–193. [Google Scholar] [CrossRef]
  5. Grochala, W.; Mazej, Z. Chemistry of Silver(II): A Cornucopia of Peculiarities. Philos. Trans. R. Soc. A Math. Phys. Eng. Sci. 2015, 373, 20140179. [Google Scholar] [CrossRef]
  6. Grochala, W.; Hoffmann, R. Real and Hypothetical Intermediate-Valence AgII/AgIII and AgII/AgI Fluoride Systems as Potential Superconductors. Angew. Chem. Int. Ed. 2001, 40, 2742–2781. [Google Scholar] [CrossRef]
  7. Mazej, Z.; Kurzydłowski, D.; Grochala, W. Unique Silver(II) Fluorides: The Emerging Electronic and Magnetic Materials. In Photonic and Electronic Properties of Fluoride Materials: Progress in Fluorine Science Series; Tressaud, A., Poeppelmeier, K.R., Eds.; Elsevier: Amsterdam, The Netherlands, 2016; Volume 1, pp. 231–260. ISBN 9780128017951. [Google Scholar]
  8. Zhang, X.; Zhang, G.; Jia, T.; Zeng, Z.; Lin, H.Q. α-K2AgF4: Ferromagnetism Induced by the Weak Superexchange of Different eg Orbitals from the Nearest Neighbor Ag Ions. AIP Adv. 2016, 6, 055702. [Google Scholar] [CrossRef] [Green Version]
  9. Kurzydłowski, D.; Derzsi, M.; Mazej, Z.; Grochala, W. Crystal, Electronic, and Magnetic Structures of M2AgF4 (M = Na–Cs) Phases as Viewed from the DFT+U Method. Dalton Trans. 2016, 45, 16255–16261. [Google Scholar] [CrossRef]
  10. Kurzydłowski, D.; Mazej, Z.; Grochala, W. Na2AgF4: 1D Antiferromagnet with Unusually Short Ag2+⋯Ag2+ Separation. Dalton Trans. 2013, 42, 2167–2173. [Google Scholar] [CrossRef]
  11. Odenthal, R.H.; Paus, D.; Hoppe, R. Zur Magnetochemie Des Zweiwertigen Silbers Neue Fluoroargentate(II): Cs2AgF4, Rb2AgF4 Und K2AgF4. Z. Anorg. Allg. Chem. 1974, 407, 144–150. [Google Scholar] [CrossRef]
  12. Kurzydłowski, D.; Derzsi, M.; Budzianowski, A.; Jagličić, Z.; Koźmiński, W.; Mazej, Z.; Grochala, W. Polymorphism of Fluoroargentates(II): Facile Collapse of a Layered Network of α-K2AgF4 Due to the Insufficient Size of the Potassium Cation. Eur. J. Inorg. Chem. 2010, 2919–2925. [Google Scholar] [CrossRef]
  13. Gawraczynski, J.; Kurzydłowski, D.; Ewings, R.A.; Bandaru, S.; Gadomski, W.; Mazej, Z.; Ruani, G.; Bergenti, I.; Jaron, T.; Ozarowski, A.; et al. Silver Route to Cuprate Analogs. In Proceedings of the National Academy of Sciences of the United States of America. Proc. Natl. Acad. Sci. USA. 2019, 116, 1495–1500. [Google Scholar] [CrossRef] [PubMed] [Green Version]
  14. Kurzydłowski, D.; Mazej, Z.; Jagličić, Z.; Filinchuk, Y.; Grochala, W. Structural Transition and Unusually Strong Antiferromagnetic Superexchange Coupling in Perovskite KAgF3. Chem. Commun. 2013, 49, 6262. [Google Scholar] [CrossRef] [PubMed]
  15. Shen, G.; Wang, Y.; Dewaele, A.; Wu, C.; Fratanduono, D.E.; Eggert, J.; Klotz, S.; Dziubek, K.F.; Loubeyre, P.; Fat’yanov, O.V.; et al. Toward an International Practical Pressure Scale: A Proposal for an IPPS Ruby Gauge (IPPS-Ruby2020). High Press. Res. 2020, 40, 299–314. [Google Scholar] [CrossRef]
  16. Dewaele, A.; Loubeyre, P.; Mezouar, M. Equations of State of Six Metals above 94 GPa. Phys. Rev. B 2004, 70, 094112. [Google Scholar] [CrossRef] [Green Version]
  17. Lonie, D.C.; Zurek, E. XtalOpt: An Open-Source Evolutionary Algorithm for Crystal Structure Prediction. Comput. Phys. Commun. 2011, 182, 372–387. [Google Scholar] [CrossRef]
  18. Avery, P.; Falls, Z.; Zurek, E. XtalOpt Version R11: An Open-Source Evolutionary Algorithm for Crystal Structure Prediction. Comput. Phys. Commun. 2018, 222, 418–419. [Google Scholar] [CrossRef]
  19. Kurzydłowski, D.; Derzsi, M.; Zurek, E.; Grochala, W. Fluorides of Silver under Large Compression. Chem. Eur. J. 2021, 27, 5536–5545. [Google Scholar] [CrossRef]
  20. Kresse, G.; Hafner, J. Ab Initio Molecular Dynamics for Liquid Metals. Phys. Rev. B 1993, 47, 558–561. [Google Scholar] [CrossRef]
  21. Kresse, G.; Hafner, J. Ab Initio Molecular-Dynamics Simulation of the Liquid-Metalamorphous- Semiconductor Transition in Germanium. Phys. Rev. B 1994, 49, 14251–14269. [Google Scholar] [CrossRef]
  22. Kresse, G.; Furthmüller, J. Efficiency of Ab-Initio Total Energy Calculations for Metals and Semiconductors Using a Plane-Wave Basis Set. Comput. Mater. Sci. 1996, 6, 15–50. [Google Scholar] [CrossRef]
  23. Kresse, G.; Furthmüller, J. Efficient Iterative Schemes for Ab Initio Total-Energy Calculations Using a Plane-Wave Basis Set. Phys. Rev. B Condens. Matter Mater. Phys. 1996, 54, 11169–11186. [Google Scholar] [CrossRef] [PubMed]
  24. Kresse, G.; Joubert, D. From Ultrasoft Pseudopotentials to the Projector Augmented-Wave Method. Phys. Rev. B 1999, 59, 1758–1775. [Google Scholar] [CrossRef]
  25. Liechtenstein, A.I.; Anisimov, V.I.; Zaanen, J. Density-Functional Theory and Strong Interactions: Orbital Ordering in Mott-Hubbard Insulators. Phys. Rev. B 1995, 52, R5467–R5470. [Google Scholar] [CrossRef] [Green Version]
  26. Perdew, J.; Ruzsinszky, A.; Csonka, G.; Vydrov, O.; Scuseria, G.; Constantin, L.; Zhou, X.; Burke, K. Restoring the Density-Gradient Expansion for Exchange in Solids and Surfaces. Phys. Rev. Lett. 2008, 100, 136406. [Google Scholar] [CrossRef] [Green Version]
  27. Liang, C.T.; Schotte, K.-D. Structural Changes and Jahn-Teller-Effect of K2CuF4 under Pressure. J. Phys. Soc. Jpn. 2005, 74, 3221–3226. [Google Scholar] [CrossRef]
  28. Ishizuka, M.; Terai, M. Pressure-Induced Structural Phase Transition in the Two-Dimensional Heisenberg Ferromagnet K2CuF4. Phys. Rev. B 1998, 57, 64–67. [Google Scholar] [CrossRef]
  29. Kurzydłowski, D.; Jaroń, T.; Ozarowski, A.; Hill, S.; Jagličić, Z.; Filinchuk, Y.; Mazej, Z.; Grochala, W. Local and Cooperative Jahn-Teller Effect and Resultant Magnetic Properties of M2AgF4 (M = Na–Cs) Phases. Inorg. Chem. 2016, 55, 11479–11489. [Google Scholar] [CrossRef]
  30. McMillan, P.F. Chemistry at High Pressure. Chem. Soc. Rev. 2006, 35, 855. [Google Scholar] [CrossRef]
  31. Prewitt, C.T.; Downs, R.T. Chapter 9 High-Pressure Crystal Chemistry. Rev. Mineral. Geochem. 1998, 37, 283–317. [Google Scholar]
  32. Grochala, W.; Hoffmann, R.; Feng, J.; Ashcroft, N.W. The Chemical Imagination at Work in Very Tight Places. Angew. Chem. Int. Ed. 2007, 46, 3620–3642. [Google Scholar] [CrossRef] [PubMed]
  33. Grzelak, A.; Gawraczyński, J.; Jaroń, T.; Kurzydłowski, D.; Budzianowski, A.; Mazej, Z.; Leszczyński, P.J.; Prakapenka, V.B.; Derzsi, M.; Struzhkin, V.V.; et al. High-Pressure Behavior of Silver Fluorides up to 40 GPa. Inorg. Chem. 2017, 56, 14651–14661. [Google Scholar] [CrossRef] [PubMed]
  34. Kroll, P. Searching Insight into the Atomistic Structure of SiCO Ceramics. J. Mater. Chem. 2010, 20, 10528–10534. [Google Scholar] [CrossRef]
Figure 1. Crystal structures of five important polymorphs of K2AgF4 derived from DFT computations (all at 0 GPa). Color code: gray = Ag, green = F, purple = K. Green lines indicate the presence of Ag-F bonds shorter than or equal to 2.2 Å, whereas yellow lines show Ag-F distances between 2.2 and 2.8 Å. Only AgF4 sublattice is shown in the right panel, with potassium atoms removed for clarity. Structure labelling corresponds to that from Table 1. Indexes f or af1 stand for types of magnetic ordering. E.g., af1 for the B structure indicates that among the several computed models of the antiferromagnetic ordering of spins the one noted af1 (cf. Supplementary Materials) has the lowest enthalpy.
Crystals 12 00458 g001
Figure 2. Relative enthalpy of five important polymorphs of K2AgF4 in the 0–100 GPa pressure range. Enthalpy of the most stable polymorph at any given pressure is taken as reference (0 eV) at that pressure.
Crystals 12 00458 g002
Figure 3. Raman spectra of α-K2AgF4 (left) and β-K2AgF4 (right) measured with 514 nm laser at increasing pressure, with pressure values labelled next to each spectrum. Red asterisks indicate bands originating from FEP used as pressure medium.
Crystals 12 00458 g003
Figure 4. X-ray diffraction patterns of α-K2AgF4 at increasing pressure; pressure values are labelled next to each pattern. Radiation with wavelength λ = 0.56087 Å was applied. The reflexes marked with an asterisk are derived from gold powder used as an additional pressure gauge.
Crystals 12 00458 g004
Figure 5. Raman spectra of Na2AgF4 (left) and Rb2AgF4 (right) measured with 514 nm laser at increasing pressure; the pressure values are labelled next to each spectrum. Red asterisks indicate bands originating from FEP used as pressure medium.
Crystals 12 00458 g005
Table 1. Crystallographic data regarding ambient-pressure and high-pressure polymorphs of K2AgF4 as derived from DFT computations. The .cif files are provided in the Supplementary Materials.
External Pressure (GPa) 000001060
Magnetic model (SM)A.fB.af1C.af1D.fE.fE.fC.f
Z42 &24442
SymmetryCmceP21/cP-1ImmmI-42dI-42dP-1
a [Å]6.333.716.0311.607.306.924.64
b [Å]6.3310.226.934.917.306.925.95
c [Å]12.486.387.088.268.207.635.95
α [°]909094.5909090113.5
β [°]9091.9112.7909090103.7
γ [°]9090114.0909090105.6
V/Z3]125.0121.0119.7117.4109.291.366.8
Ordered P21/c representation is provided here due to removal of substitutional disorder from the disordered experimental Cmce structure. & The ground-state magnetic structure requires the use of a supercell that is twice the size, Z = 4.
Publisher’s Note: MDPI stays neutral with regard to jurisdictional claims in published maps and institutional affiliations.

