Article

A Microstructural and Compositional Study of ε-Fe2O3 Crystals in the Hare’s Fur Jian Ware

1
Laboratory of Micro-Nano Optoelectronic Materials and Devices, Shanghai Institute of Optics and Fine Mechanics, Chinese Academy of Sciences, Shanghai 201800, China
2
Key Laboratory of Inorganic Coating Materials CAS, Shanghai Institute of Ceramics, Chinese Academy of Sciences, Shanghai 201899, China
3
Materials Science and Engineering Department, University of Chinese Academy of Sciences, Beijing 100049, China
*
Author to whom correspondence should be addressed.
Crystals 2022, 12(3), 367; https://doi.org/10.3390/cryst12030367
Submission received: 13 February 2022 / Revised: 3 March 2022 / Accepted: 7 March 2022 / Published: 9 March 2022

Abstract

:
The Jian kilns in the present-day Jianyang County of Fujian Province are well known for their thick and lustrous black-glazed porcelain production. The hare’s fur (HF) glazed Jian wares characterized by radial fur-like strips, as one of the most typical representatives of black-glazed tea bowls, originate from phase separation of glaze melt and crystallization of iron oxides. In this study, various techniques were performed on the yellowish-brown HF samples, including portable energy-dispersive X-ray fluorescence (PXRF), synchrotron X-ray absorption near-edge spectroscopy (XANES), optical microscopy (OM), scanning electron microscopy (SEM), X-ray diffraction (XRD) and Raman spectroscopy (RS). The objective of this study was to well understand the microstructure characteristics and chemical compositions of glaze patterns. Results showed that the main constituents of the ceramic glaze were alumina (10.61–16.43 wt.%), silica (62.20–77.07 wt.%), calcium (3.85–6.97 wt.%), and iron oxide (4.10–8.35 wt.%). The studies provided evidence that metastable epsilon-iron oxide crystals (ε-Fe2O3) formed on the brownish-yellow glazed surface. Microstructural analysis revealed that there were three types of crystal structures in the glaze surface: One consisted of well-grown leaf-like or dendritic-like structure with highly ordered branches at micrometers scales; another comprised flower-like clusters accompanied by branches radiating from the center, petals growing along the branches, and needles on both sides of the petals; the last type involved a honeycomb structure tightly packed with plentiful spherical or irregular-shaped particles. In addition, ε-Fe2O3 crystals in the cross-section of the glaze showed a gradient distribution.

Graphical Abstract

1. Introduction

The Jian kiln is located in present-day Jianyang County of Fujian Province, one of the representative folk kilns producing black-glazed tea bowls. This kiln began firing porcelain in the Tang dynasty (618–907 AD), manufactured particularly during the Southern Song dynasty (1127–1279 AD), and closed down in the Yuan dynasty (1271–1368 AD) [1]. In the Song dynasty, due to the abundant raw materials, low prices, and the prevailing trend of tea tasting and competition, the production of black-glazed tea bowls increased greatly. The prevalence of these Jian wares also reflected the pursuit of simplicity and elegance. Apart from their thick and lustrous black glaze, Jian wares are greatly appreciated due to the striking streaked or mottled patterns, generally recognized as “hare’s fur (HF)”, “oil spot (OS)”, and “partridge spot” [2,3]. Different glaze decoration effects can be achieved by changing the firing schedules to modify the crystallization behavior and microstructure of the glazes [4,5,6]. Among these, hare’s fur is the most common and famous variety, recognized by a sparkling black glaze showing fine radial rust-colored fur-like strips. HF patterns are encountered in the black glaze due to phase separation and crystallization during the firing process in the dragon kiln [5].
The hare’s fur glaze is one kind of ferric phase separation glaze. These unique colored patterns are inevitably derived from local iron-enrichment raw materials and the firing process. During the high-temperature firing process, ceramic glaze begins to melt, and iron oxides in the glaze decompose to give off oxygen once the temperature reaches 1240 °C. Oxygen bubbles continuously generate in the glaze layer and grow during the heating stage, and the concentration of iron-rich oxides around bubbles improves gradually. Eventually, the large bubbles move outward within the molten glaze and carry iron toward the surface, forming a local iron-rich area on the glaze [7,8,9]. Due to the low viscosity at certain spots, iron oxides supersaturate and crystallize on the glaze surface during the cooling stage, forming iron-rich streaks. Meanwhile, the surface iron-rich areas begin to flow down along the sides of the bowl. The control of the atmosphere during the firing process (oxidizing and/or reducing) will have a significant impact on the color of streaks. In 2014, the aggregate crystals in the hare’s fur glaze were first confirmed as metastable epsilon-iron oxide phase (ε-Fe2O3) rather than the most thermally stabled hematite (α-Fe2O3) [10]. ε-Fe2O3 only existing in nanoparticles, nanorods, nanowires, or thin-film forms has recently received growing attention due to its significant and promising magnetic properties such as a giant coercive field of around 2T at room temperature, magneto-resistance, a millimeter-wave ferromagnetic resonance (FMR) absorption [11,12,13,14].
It is worth mentioning that subsequent studies on ε-Fe2O3 in ancient Chinese porcelains have been carried out to understand the formation process and color variation in glaze patterns [15,16,17]. The crystalline markings of precipitated iron oxide on hare’s fur glazed bowl sherds excavated from the Jian kiln are orderly organized in well-grown leaf-like or dendritic-like manners in a micrometer size, some typically present in the form of millimeter-sized flower-like clusters [18]. Interestingly, surface crystals of HF samples exclusively consist of ε-Fe2O3 microcrystals, which are significantly larger than the currently synthetic ε-Fe2O3 nanoparticles [10]. ε-Fe2O3 has become a research hotspot as the chromogenic crystals. Researchers also reported the existence of ε-Fe2O3 polymorph in the oil spot Jian wares [19], sauce glaze porcelain from the Qilizhen kiln [20], rusty-oil-spotted glaze at the Linfen kiln [21] and/or Xiao kiln [22], hare’s fur glaze of Jizhou kiln [23], brown glaze porcelain of Yaozhou kiln [24], sauce glaze and black glaze porcelains from Qingliangsi site [25], and purple-gold glaze porcelain from the Forbidden City [26]. It is believed that research studies on the growth mechanism of ε-Fe2O3 in ancient porcelains will provide guidance for the artificial synthesis of this promising material, in addition to having a profound impact on Asian ceramic history.
In this study, a representative fragment of yellowish-brown hare’s fur Jian ware was selected to further analyze forming cause and growth process of glaze patterns via a variety of characterization methods. The microstructure and phase composition of chromogenic crystals in the hare’s fur area were systematically studied. Specifically, the synchrotron XANES technique was used to confirm the oxidation valence of Fe iron in both hare’s fur area and black glaze area. The existing studies [16,18] were mostly focused on morphological features and compositional differences in hare’s fur glaze patterns with distinguishing color or were detailed studies concentrated on one type of flower-shaped crystals in hare’s fur area, lacking comprehensive and in-depth analysis on microstructural and compositional studies of different types of ε-Fe2O3 crystals. Therefore, this basic research may provide some useful insights for scientific studies of other ancient Chinese porcelain.

2. Materials and Methods

2.1. Sample Preparation

Archaeological fragments of the brownish colored hare’s fur glaze bowl (Figure 1, labeled the HF sample) excavated from Jian kiln relics (Jianyang District, Nanping City, Fujian Province, China) were brought to the laboratory for analysis; these fragments presumably belong to Song dynasty (960–1279 AD). The tested zone of the sample was cut into small pieces by a water cutting machine to perform subsequent experiments. Some specimens whose cross-sections were analyzed needed to be impregnated with epoxy and then finely polished by routine metallographic methods.

2.2. Characterization Techniques

Portable energy-dispersive X-ray fluorescence spectroscopy (PXRF, OURSTEX 100FA, OURSTEX, Osaka, Japan) was applied to analyze the chemical composition of glaze and body of the HF sample (the concentration of light elements such as Na and Mg can be measured by this PXRF instrument [27,28,29,30]). It was equipped with a low-vacuum sample chamber, which can effectively reduce the absorption of characteristic spectra of light elements in air.
Synchrotron X-ray absorption near-edge spectroscopy (XANES) was employed to identify the valence state of iron in the hare’s fur glaze. The Fe K-edge XANES spectra were collected at the beamline station BL15U1, Shanghai Synchrotron Radiation Facility (SSRF), Chinese Academy of Sciences, China. In this experiment, XANES spectra were obtained in the fluorescence yield mode with a Lytle detector. In total, 28 points were measured with a scanning step of 50 μm, and the acquisition time of each energy point was 2 s. Particularly, the scanning area was approximately in the range of 7050–7349.5 eV, and the step size was 0.5 eV.
The surface morphology of the porcelain sample was first examined by an optical microscope equipped with an ultra-depth-of-field system (OM, VHX-50000, Keyence, Osaka, Japan). Images can be taken with a magnification ranging from 20× to 1000×. The microstructure and elemental composition of crystals in glaze were performed by scanning electron microscope (SEM) fixed with energy-dispersive X-ray spectroscopy (EDS) operated in backscattered electron image mode (TM3000, HITACHI, Tokyo, Japan). Secondary electron images with higher magnification were obtained by another SEM equipment (SU8220, HITACHI, Tokyo, Japan).
The information on phase constituents of glaze was characterized by an X-ray diffractometer (XRD, D/max 2550V, Rigaku, Tokyo, Japan) with filtered Cu Kα (40 kV, 40 mA) radiation at a scan rate of 0.5° min−1 in the 2θ range of 20–80°. The Raman spectra were collected using a Laser Confocal Micro-Raman spectrometer (LabRAM XploRA, Horiba, Palaiseau, France), and a diode near-infrared (NIR) (532 nm) laser was used for the excitation.

3. Results

3.1. Chemical Composition

The main constituents of the hare’s fur glaze, black glaze, and porcelain body are shown in Table 1. The ceramic glaze mainly consisted of alumina (10.61–16.43 wt.%), silica (62.20–77.07 wt.%), calcium (3.85–6.97 wt.%), and iron oxide (4.10–8.35 wt.%). The results demonstrated that SiO2 and Al2O3 were major components of the HF sample, in accordance with the aluminum-deficient and silicon-rich traits of black-glazed porcelain. Minor elements such as sodium, potassium, and calcium existed as flux. Jian glazes are classified as high-temperature calcium-iron oxide-aluminosilicate glazes, and iron oxide functions as both flux and a phase-separation accelerator during firing [31]. Previous studies indicated that [32,33] there are two kinds of microstructural forming mechanisms: (1) local phase separation in glaze surface neighboring area, followed by crystallization of iron oxide; (2) crystallization of anorthite accompanied by inter-crystal phase separation and the subsequent crystallization of iron oxide.
To further confirm the oxidation valence state of iron in the crystalline area, the synchrotron XANES technique was employed to measure the cleaned surface. Before the experiment, spectra of iron foil (Fe), hematite (Fe2O3), and magnetite (Fe3O4) were collected as standard references, against which HF sample spectra can be compared accurately. As transition metal element, iron atom has electron configuration of 3d64s2, while Fe3+ and Fe2+ correspond to 3d5 and 3d6, respectively. Fe3+ exhibits good stability when compared with Fe2+ due to electrons partially occupying the d orbit. The XANES results are illustrated in Figure 2.
For iron foil in which the absorption K-edge was observed at 7131.2 eV, the spectrum was characterized by a small shoulder, together with one inapparent crest. In the post-edge region, a series of peaks appeared in succession. These characters were distinguished well between the hematite and magnetite. There was a striking pre-edge shoulder in divalent or trivalent iron, which contributed to the 1s to 3d transition. As seen in Figure 2b, the spectra of hematite and magnetite crystals behaved differently in the post-edge peak position. Fe3O4 reference showed three evident divisive crests at 7184.2, 7229.1, and 7271.8 eV, respectively. By contrast, the corresponding position in the Fe2O3 spectrum did not seem obvious. In the HF sample result (Figure 2a), the absorption edge peak appeared at 7133.6 eV, followed by a small shoulder at 7147.3 eV. In the post-edge region, the peaks were very weakly displayed. This showed a similar character to the Fe2O3 spectrum. The iron in the yellowish-brown hare’s fur area seemed fully oxidized, which is consistent with the reported studies (namely, that the iron ions in the crystalline zone of the yellowish-brown HF sample occurred as positive trivalent ions) [10,18]. In addition, divalent iron ions contributed to deepening the blue-green of the glaze surface, while trivalent iron ions presented yellow. This indicated that Fe3+ was the color mechanism of the sample.

3.2. Microstructure Analysis by OM

Figure 3 presents the surface morphology of the HF sample revealed by optical microscopes. A low magnification image of the glaze surface (Figure 3a) showed the typical characteristic of a brown streak-like or silk-like hare’s fur pattern. As seen in Figure 3b–d, there were three types of crystal clusters in the glaze surface: One displayed a fan-shaped structure consisting of plentiful needle-like crystals; one involved a grid structure tightly packed with plentiful spherical or irregular-shaped particles, and some white and translucent crystals were also clearly visible, which may be attributed to the residual unmelted quartz particles; the last type was a flower-like cluster, ranging from several hundred micrometers to more than one millimeter in size. Some large-scale flower-like or fan-shaped crystals mainly aggregated at the edge of the bowl. These crystals on the surface all appeared to be brownish, which was in accordance with the appearance of hematite crystals. The cross-sectional observation showed that the glaze contained significant numbers of bubbles and crystals in the glaze–body interface and the body. In addition, a brownish-yellow devitrified layer appeared at the top zone of HF glaze, which may be concentrated by numerous small Fe-rich crystals [10].

3.3. Phase Analysis by XRD and RS

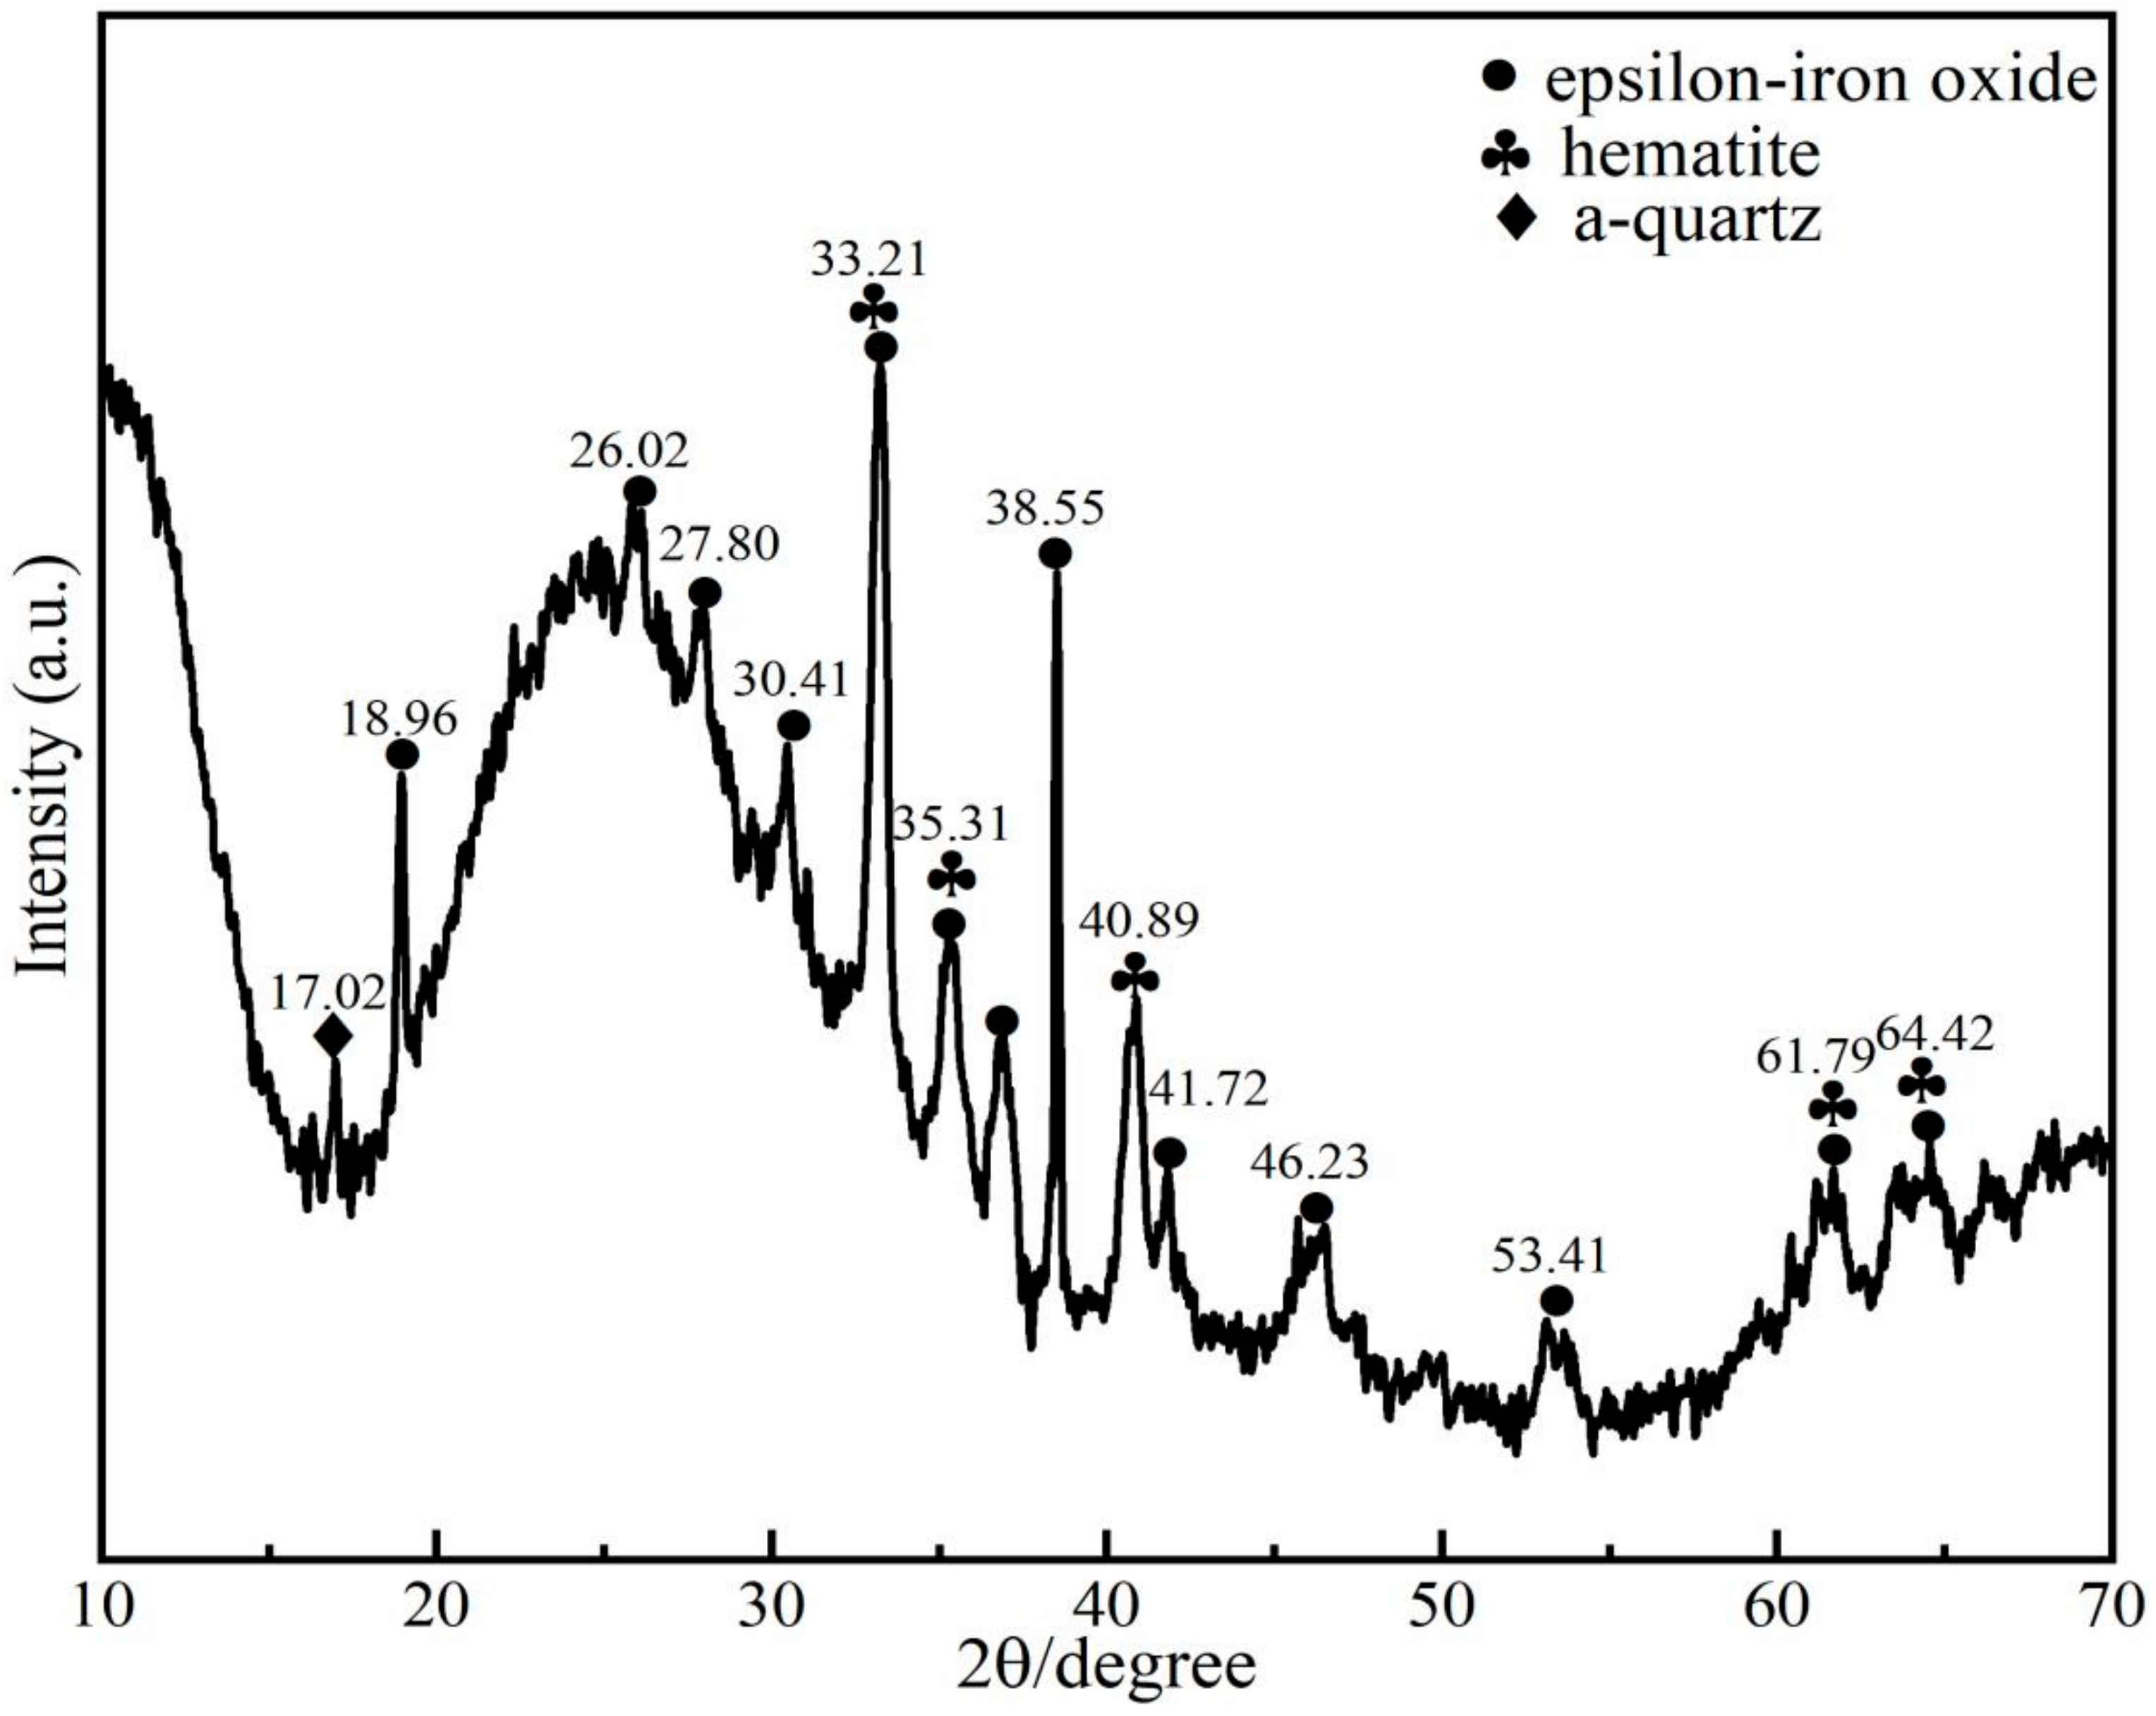
With the aim to study the crystallization behavior, the XRD pattern was performed on the glaze surface to trace the mineral composition, and the relevant results are displayed in Figure 4. Compared with the standard PDF card, the main crystalline phase was epsilon-iron oxide (ε-Fe2O3), with a small amount of hematite (α-Fe2O3) and quartz (α-SiO2) on the glaze. Both thermodynamic qualification and equilibrium thermodynamic conditions for the crystallization during the firing process were conducive to the precipitation of crystals from the glaze. The porous and loose structure of the porcelain body increased the concentration of dissolved oxygen and allowed the oxidation of the Fe-rich phase into hematite. The unmelted quartz in the molten glaze originated from the residual mineral raw materials. It is possible that the free energy per volume of ε-Fe2O3 is lower than that of α-Fe2O3 for small crystals due to the unique chemical compositions of Jian glaze (high Ca and Mn) and firing temperature [10,14]. Thus, a traditional phase transformation pathway of ε-Fe2O3 to α-Fe2O3 would occur under these conditions. Small hematite existed as the particle size increased.
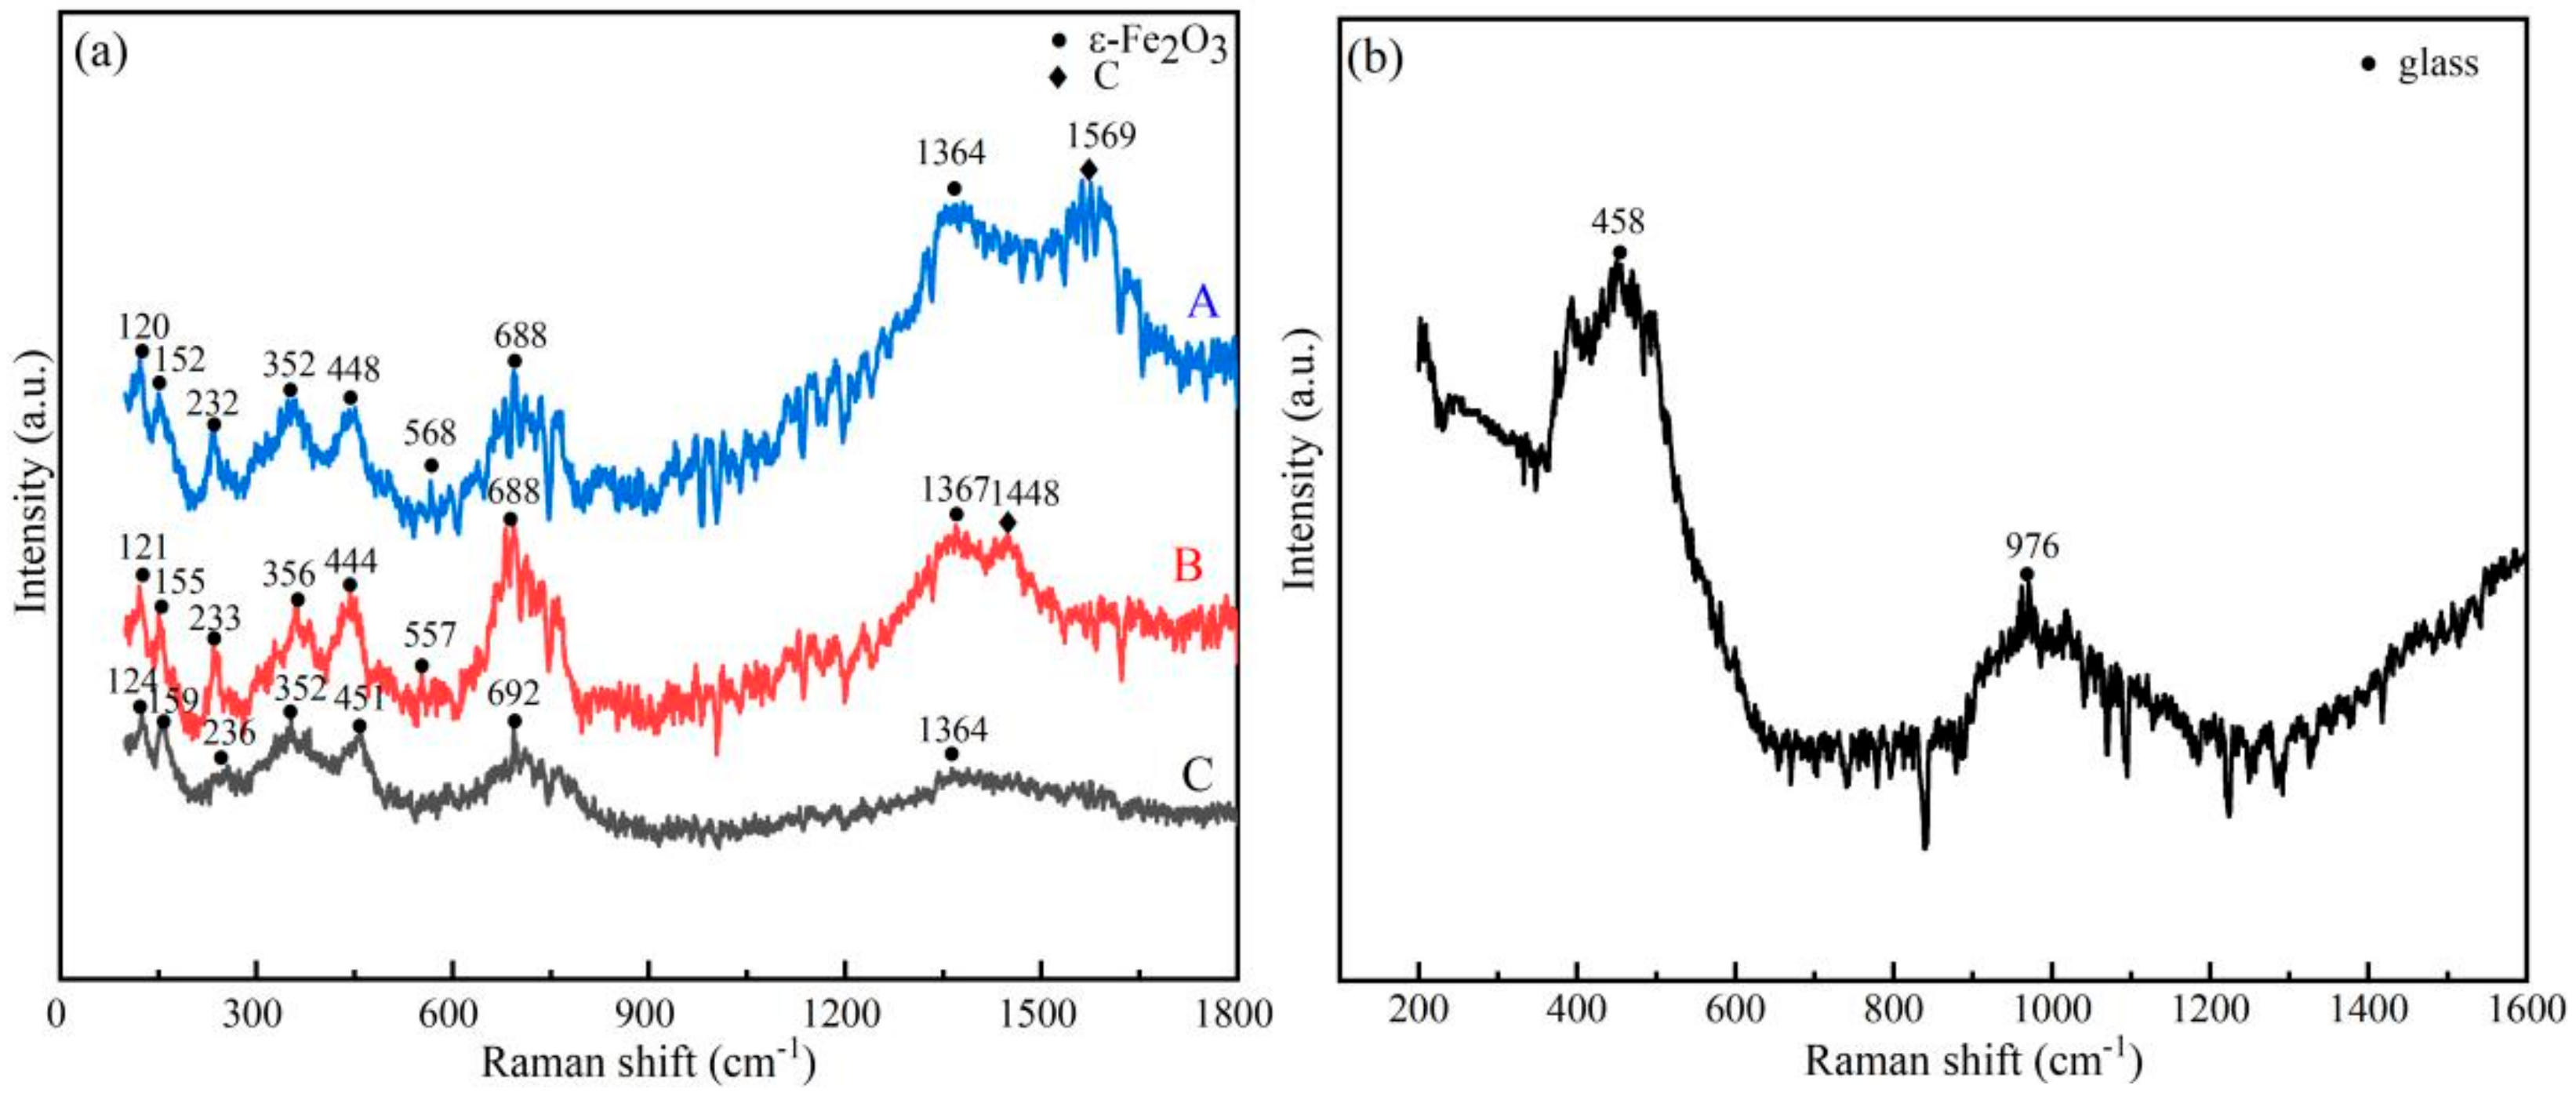
To unambiguously confirm the iron oxide phases, Raman spectra were carried out at different spots on the outer surface of HF glaze were shown in Figure 5. As can be seen, the spectra taken at flower-like crystal clusters (spectrum A corresponding to Figure 3d), fan-shaped crystal clusters (spectrum B corresponding to Figure 3b), and honeycomb crystal clusters (spectrum C corresponding to Figure 3c) were all identified to belong to the epsilon-iron oxide (ε-Fe2O3). ε-Fe2O3 phase, a rare and metastable Fe2O3 polymorph, has an orthorhombic crystal structure, with a Pna21 space group (a = 5.0810 Å, b = 8.7411 Å, c = 9.4083 Å) [34]. It is defined as an intermediate between hematite (α-Fe2O3) and maghemite (γ-Fe2O3). The collected Raman peaks here shared similar peak positions at 122, 155, 234, 353, 448, 563, and 689 cm−1, which correspond to first-order phonon vibrational modes of ε-Fe2O3 [35]. Nevertheless, the main Raman bands of hematite (α-Fe2O3) were at 220, 290, 410, 600, and 1330 cm−1. The main Raman band of magnetite (Fe3O4) was at 670 cm−1. It was clear that these Raman peaks were not consistent with those of hematite and magnetite. The majority of the detected Raman peak positions at the spectrum A, B, and C matched well with each other, while few of them shifted slightly due to the faceted aspect of crystal lattice originated from the laser source (λ = 532 nm) and/or phonon confinement effect in our samples [36]. We noticed that spectra of the ε-Fe2O3 phase collected from ancient Fe-rich porcelains were almost the same [10,18,21]. The similarities among Raman spectra taken at “A”, ”B”, and “C” strongly suggested that those three types of crystals clusters shared the same mineral composition. Weak C peaks around 1360 and 1580 cm−1 would appear if amorphous carbon existed in the glaze [37,38]. Besides these observations, we measured the phase constituent of the underlying black glaze (Figure 5b); due to its amorphous nature, the received spectrum showed obvious, glassy peaks (458 cm−1 and 976 cm−1 are the typical envelope peaks of glass [25]).

3.4. Microstructure Analysis by SEM–EDS

Figure 6 shows the morphological features of the hare’s fur glaze. Based on surface observation, the boundaries between the yellowish-brown hare’s fur area and black glaze area were distinct, and the chromogenic crystals on the yellowish-brown hare’s fur area were uniformly distributed, as revealed in Figure 6a. The crystals in the yellowish-brown hare’s fur area can be divided into three types (hereafter, types A, B, C) on account of their sizes and microstructure, which are presented in Figure 6b–d. With type A, the crystals inhomogeneous dispersed on the streak embraced flower-shaped structures, characterized by many branches radiating from its center, petals growing along the branches, and needles on both sides of the petals. This type of crystal was usually small in size. With type B, the crystals were organized orderly in dendritic-like or leaf-like manners at micrometers scales. This structure was generally accompanied by large main branches, and the secondary branches were tightly arranged on the two sides of the main branch and were parallel to each other. Under the higher magnification in Figure 6g, some large-scale dendrites were even approximately hundreds of microns, and the high-order subbranches were covered by numerous intensive smaller twigs. Type C was featured as a honeycomb structure closely packed with plentiful spherical or irregular-shaped crystal clusters. These crystals mainly existed in the junction zones between the hare’s fur area and the black glaze area.
Figure 6e,f present the cross-section morphology of the HF sample. The glaze was about 1 mm thick. In comparison with the porcelain body, the glaze was rather less impure. The layer near the glaze surface contained some irregular and disordered circles or spots with higher average atomic contrast, indicating that most of the impurities were a single crystal or crystal clusters precipitated from the glaze layer, combined with a low coverage rate. Figure 6h displays a detailed image of the upper glaze layer. A large number of small-scale flower-shaped or feather-like crystals distributed discretely and showed a gradient variation tendency on the shape and arrangement from the glaze surface inward.
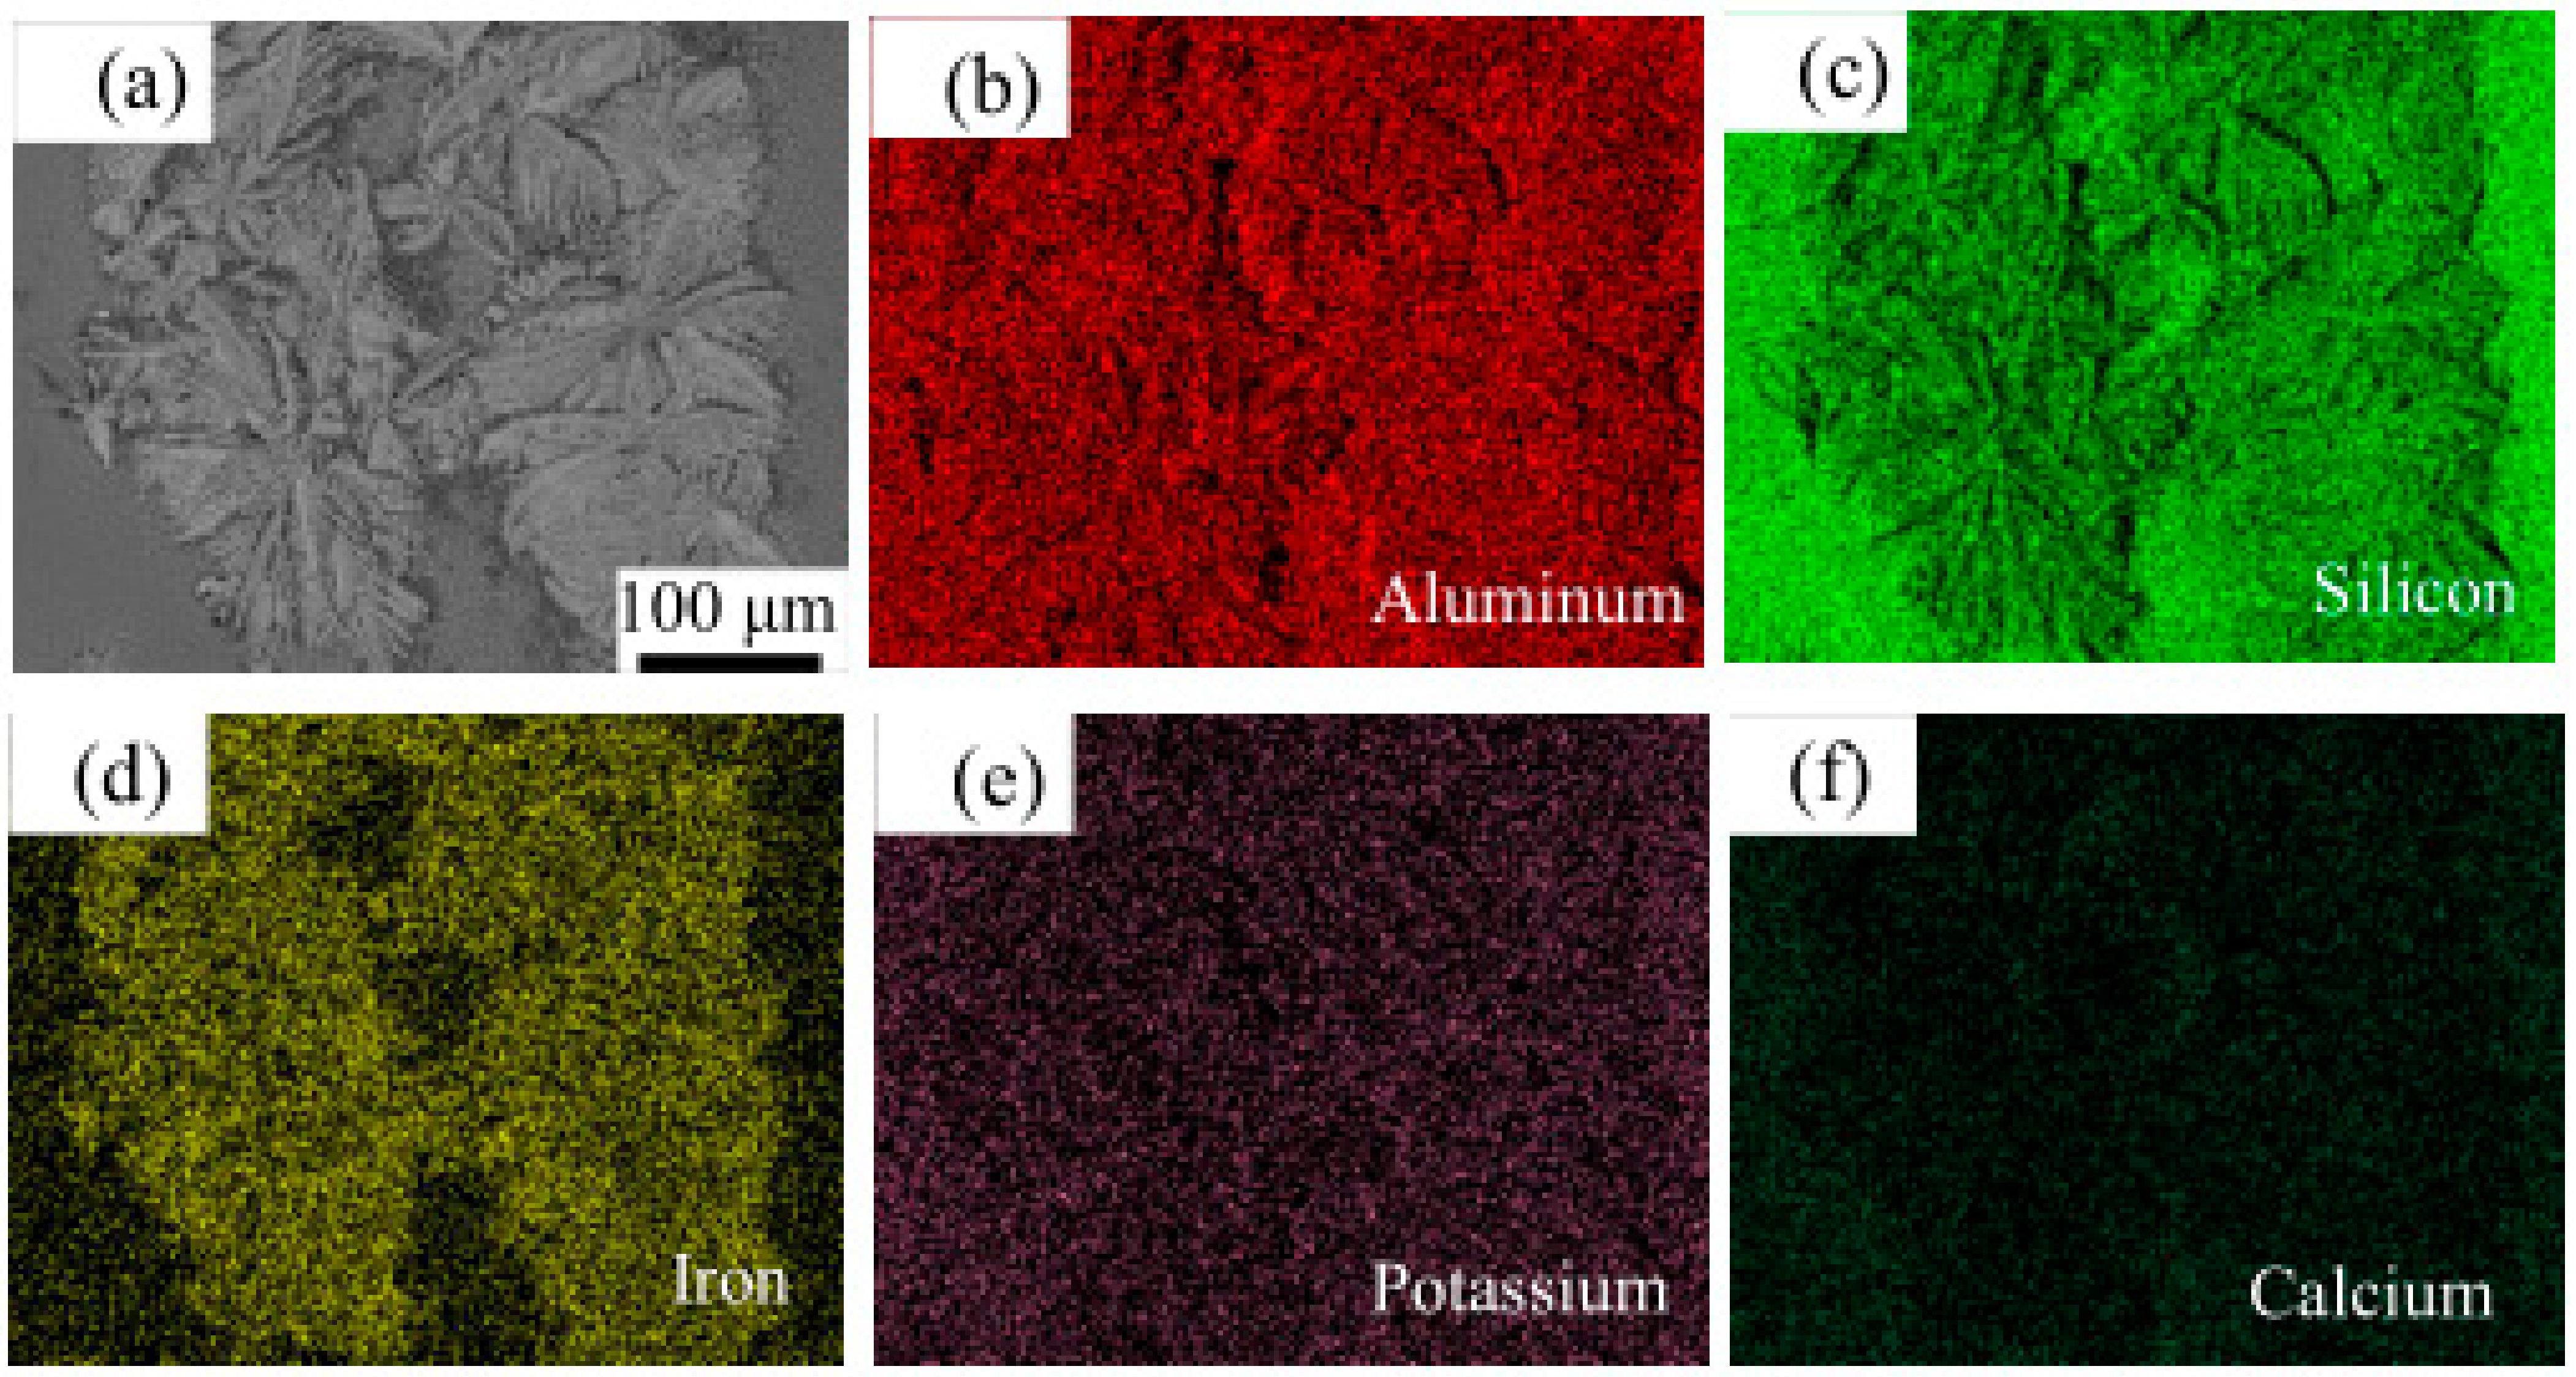
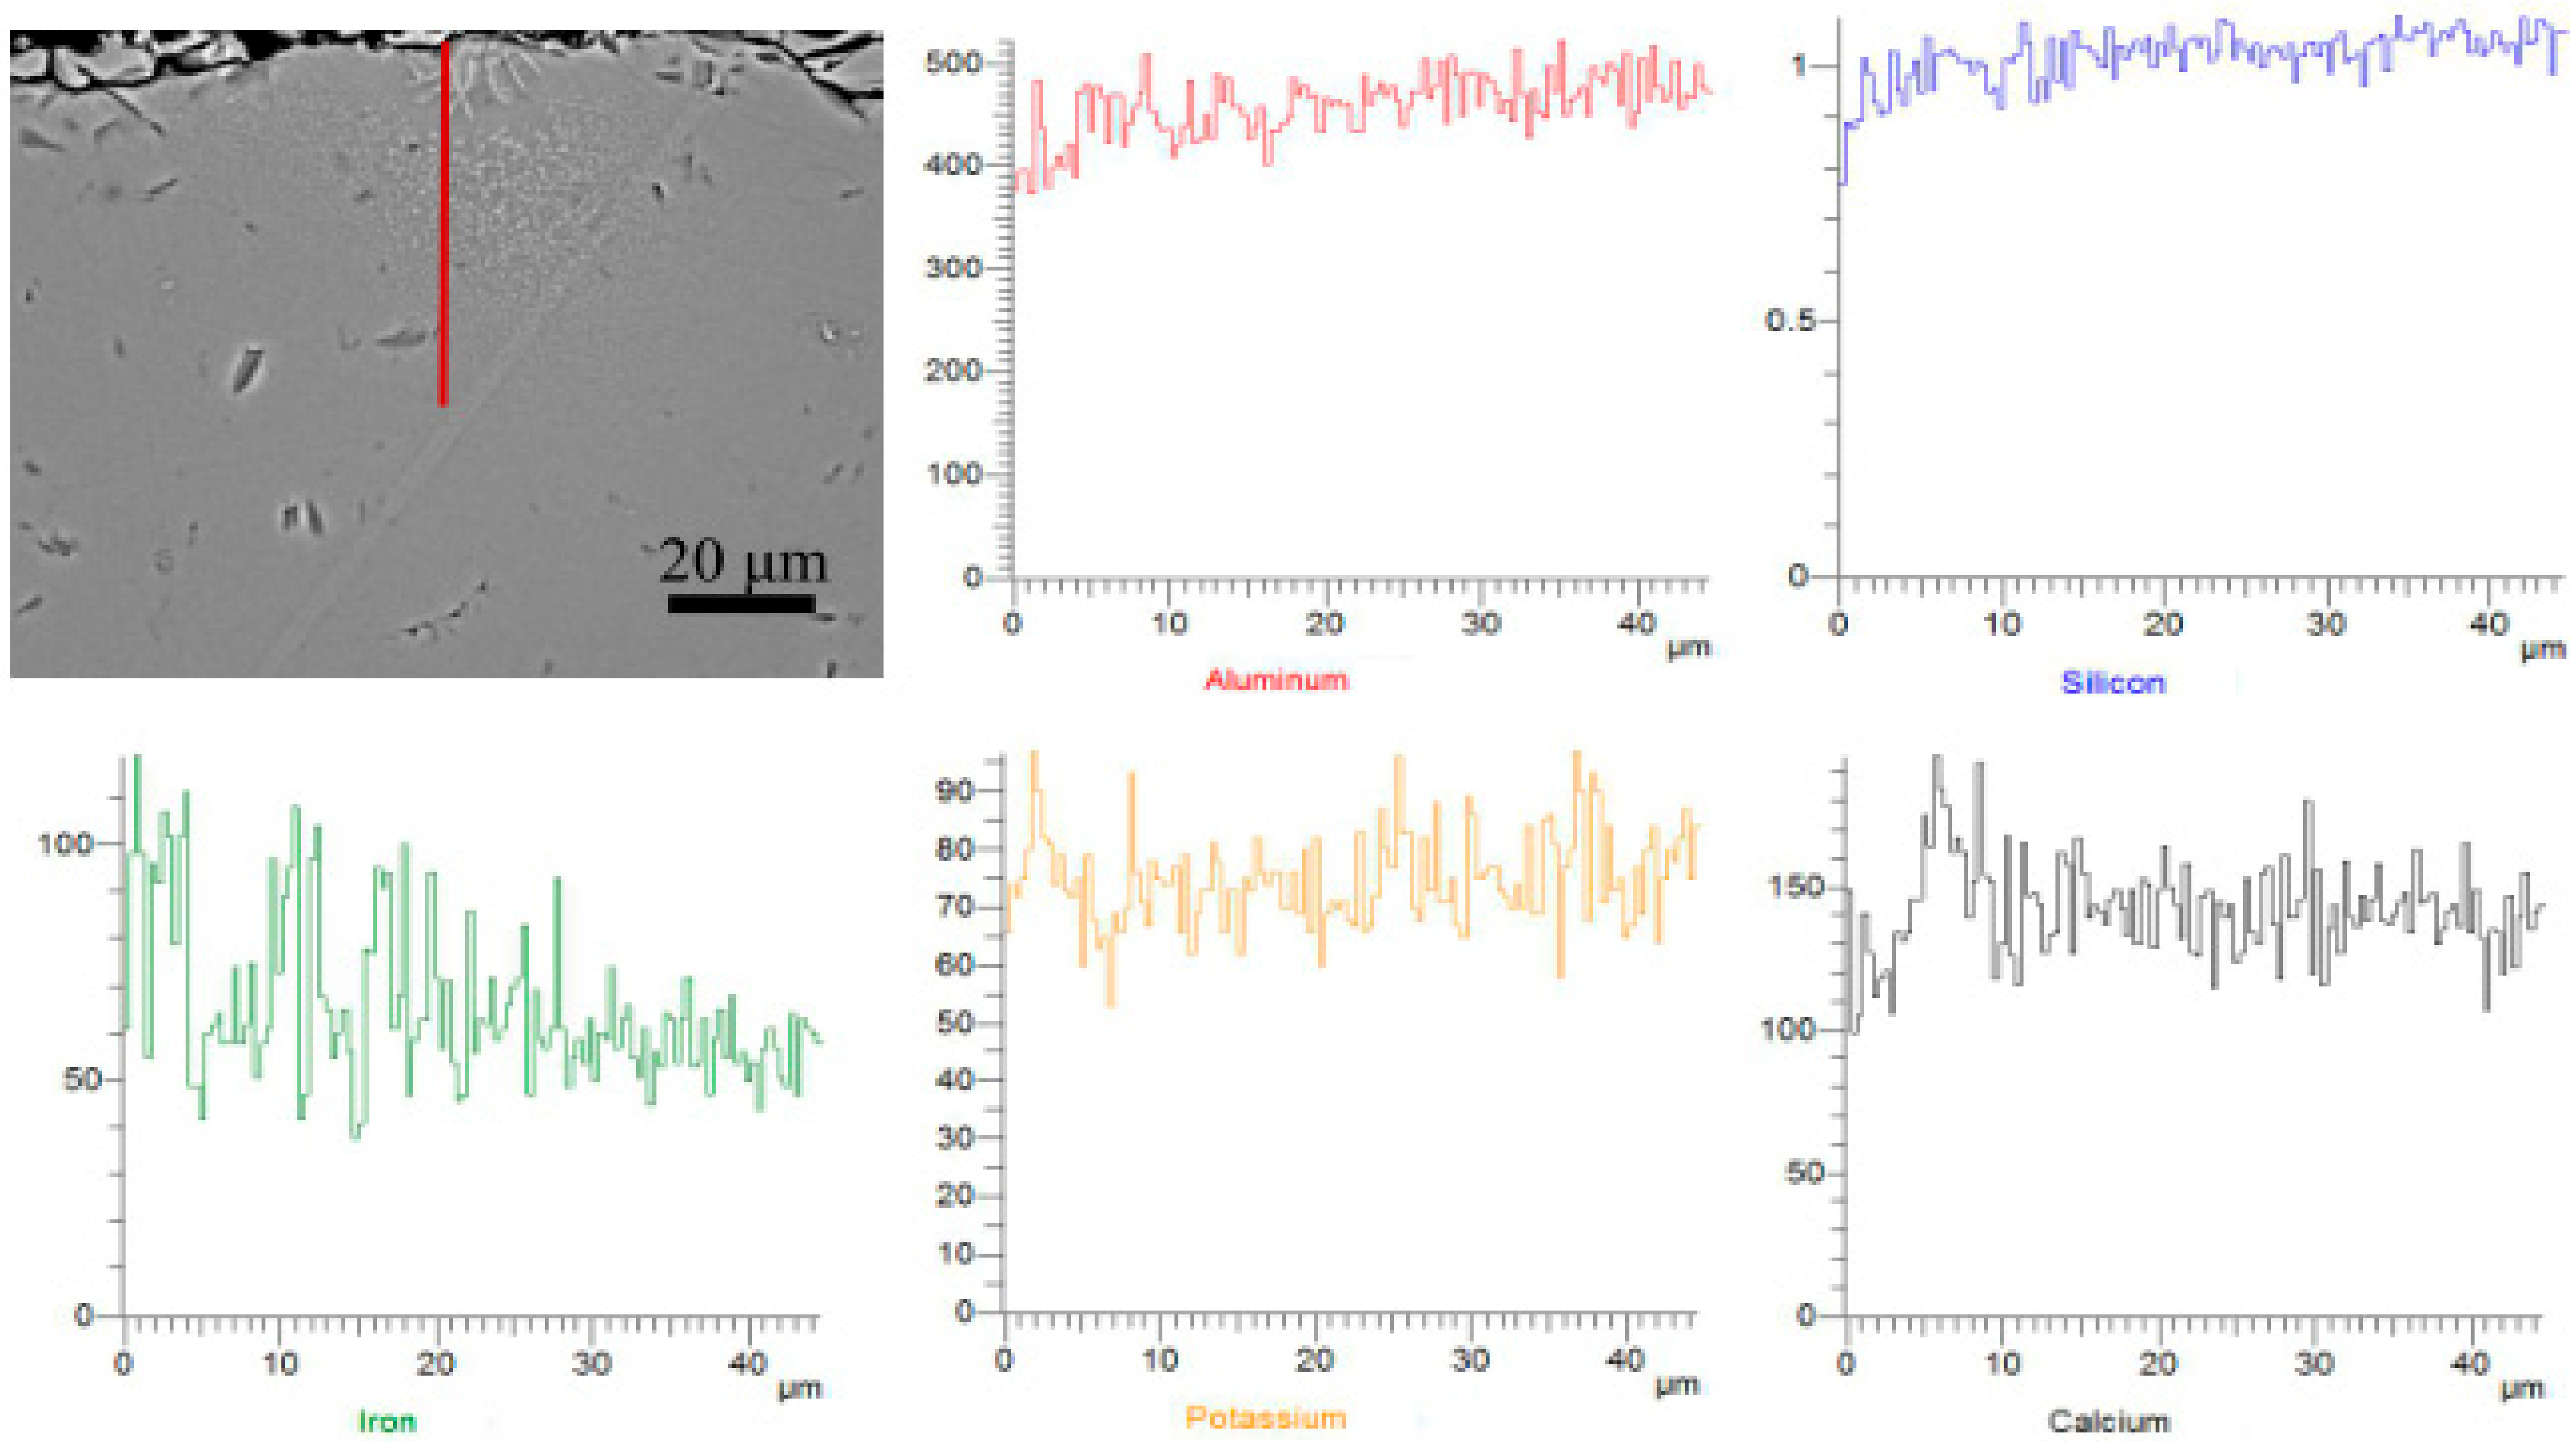
EDS analyses performed on the glaze are shown in Figure 7 and Figure 8. From Figure 7, it was revealed that the whole glaze (both hare’s fur and black glaze areas) were mainly composed of the following elements: Al, Si, Fe, K, Ca, and O. Comparatively, the element contents in the yellowish-brown hare’s fur area differed considerably from those in the black area, indicating that phase separation occurred in the surface glaze. Fe was enriched in the yellowish-brown hare’s fur area, while Si was enriched in the black glaze area. Al was distributed uniformly. This meant that Al-substituted ε-Fe2O3 formed on the streaks. No Si, K, and Ca enrichments were found in the crystalline zone. For Fe element, it had a higher concentration than that of other elements in the hare’s fur area, confirming that the chromogenic crystals in the crystallization zone were ε-Fe2O3, which is in accordance with previous studies. From the elemental distribution map examined on the cross-sections with a depth of about 45 μm inside the glaze surface, we observed that the crystals in the upper layer were much larger than those of the following part, and the content of Fe-rich crystals varied unevenly along the thickness direction. The ferric oxides gathered around the bubbles were carried to the glaze surface, causing an iron enrichment area on or beneath the surface. In addition, the element content of different points in the glaze surface (A, B, C, D, and E, shown in Figure 6) was analyzed, the results of which are outlined in Table 2. The concentration of iron in the crystalline region was significantly higher than that in the non-crystalline region. Moreover, for dendritic-like crystals, the concentration of iron on the large-scale main dendrites was greater than that of on the secondary or tertiary branches.
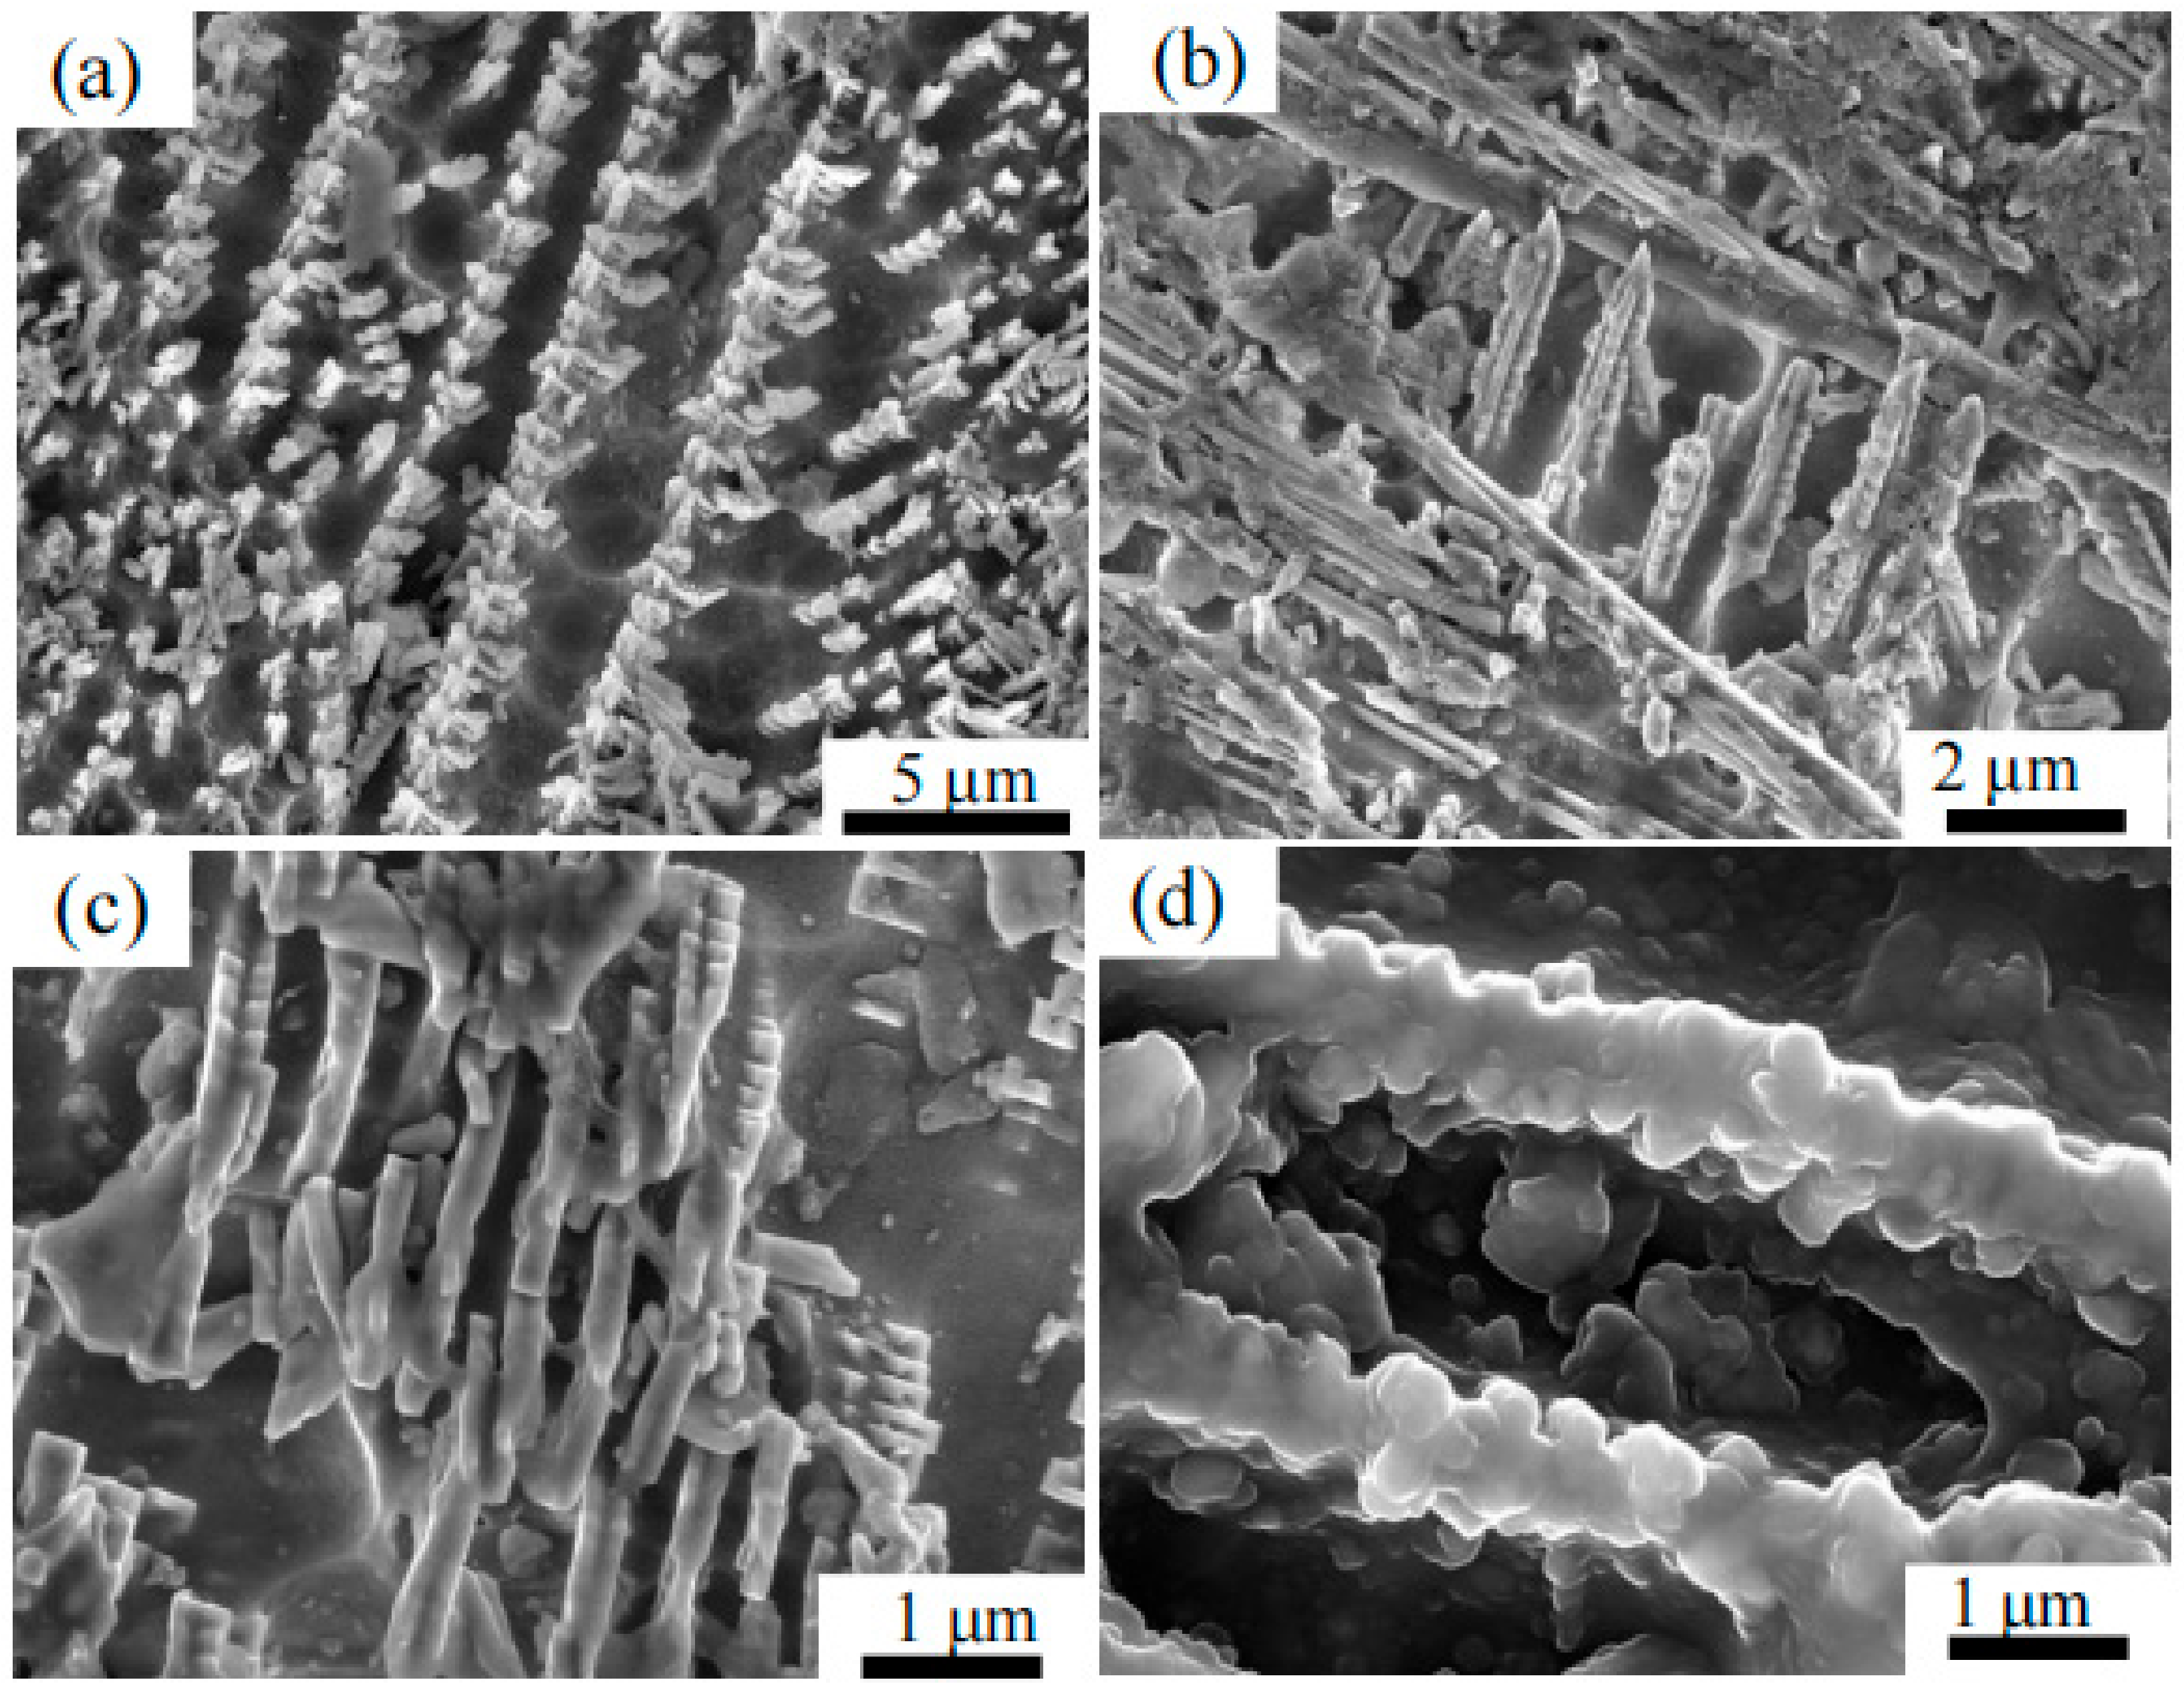
Figure 9 shows the secondary electron images and corresponding magnified view of parts in the well-defined dendritic-like and leaf-like crystals. As discussed above, the dendritic crystals had a typical hierarchical structure with large main branches and parallel secondary branches on the two sides arranged symmetrically in rows. Specifically, some small-scale feather-like or leafy crystal clusters aggregating at the hare’s fur streaks were mainly constitutive of acicular rods growing out the glaze surface with different lengths, as portrayed in Figure 9b,c. It can be observed that both ε-Fe2O3 crystals in the yellowish-brown hare’s fur area were matured over the underlying black glaze layer, corroborating the previous XRD and RS results. Based on these results, this highly differentiated and well-bedded structure in distribution provides some useful guidance for the forming mechanism of hare’s fur pattern.

4. Discussion

In 1934, a new ferromagnetic variety of ferric oxide (ε-Fe2O3) was first reported by Forestier and Guillain [39]. In 1998, Tronc et al. [40] provided the first detailed crystallographic structural analyses of ε-Fe2O3, which was later studied in 2004 by Jin et al. [41]. On the side of archeological research, Dejoie et al. [10] identified the presence of ε-Fe2O3 phase in the black-glazed Jian wares until 2014, manifesting themselves in the hare’s fur or oil-spot pattern. The formation of HF patterns occurred as a result of phase separation between melted glaze and crystallized iron oxides [42].
As is known, Jian wares possess a higher iron concentration in the porcelain glaze and body. When the firing temperature in the dragon kiln reaches 1240 °C, iron minerals in the melting glaze thermally decompose into iron oxide and release oxygen. Oxygen gathers and forms gas bubbles, which rise toward the surface with iron-enriched melts [18,22]. When these bubbles move outward from the glaze, they cause local iron enrichment. Liquid phase separation occurs during the cooling procedure. As the temperature continues to drop, iron oxide crystals can be precipitated due to supersaturation. Radial fur-like stripes occur with a slower cooling rate. The HF pattern on the surface tends to be golden or yellowish-brown when fired at an oxidizing atmosphere but is silver in a reducing atmosphere. Additionally, the firing technology has a significant influence on the composition and appearance of iron-rich crystalline glaze [43]. It is generally recognized that the firing temperature of black-glazed porcelain is between 1250 °C and 1350 °C. The evolution and growth of iron crystals are affected by iron content and dissolved oxygen content in the glaze. The higher oxygen concentration helps hematite form and grow larger. Reducing atmosphere is more conducive to the formation of ε-Fe2O3 phase, and a mixture of stable α-Fe2O3 and metastable ε-Fe2O3 phases appear jointly in a strong oxidizing atmosphere [44,45]. Moreover, Libor et al. [34] found that at the SiO2 matrix, phase transition of γ-Fe2O3 to ε-Fe2O3 occurred when the temperature increased to 1000 °C, and with a continuous improvement in temperature (~1300 °C), ε-Fe2O3 phase completely transformed into α-Fe2O3 phase. According to the above analysis, it can be deduced that the yellowish-brown HF sample might fire between 1250 °C and 1300 °C with a weaker reducing or oxidizing atmosphere.
Based on the morphology and structure of ε-Fe2O3 crystals found in the hare’s fur streaks, a possible formation mechanism of HF pattern was proposed while drawing on previous reports [10,15,18,20]: (1) Hematite nucleation seeds were initially formed at the gas–liquid interface of oxygen bubbles inside the glaze and gradually grew into plentiful spherical or irregular-shaped particles at the nanoscale; (2) then, these particles started to crystallize to form a two-dimensional plane structure, such as flower-shaped structure with the primary branches formed radially; (3) as the reaction time increased, more main branches such as secondary branches emerged and grew. The longer branches quickly grew preferentially in certain directions and some began to diverge into a fan-like “petal” form, while the subsequent shorter branches would be blocked due to the competitive growth rates; (4) with the same growth processes, tertiary branches or other small high-order branches grew in succession, with the progressively accumulated particles attached on them, and acicular structure tended to be increasingly thicker with abundant raw materials and space, while particles on the side branches retained their shape as nanoparticles or nanorods until the end, because they were restricted to the narrow gaps. Eventually, a highly differentiated or well-defined hierarchical structure was formed. Previous studies have suggested that many factors such as firing temperature, cooling time, and concentration of the precursor played crucial roles in the formation of crystalline morphology. The dendritic-like and flower-like crystals usually exist in the hare’s fur area, whereas crystals with honeycomb structures are located at the junction zones between the hare’s fur area and black glaze area.

5. Conclusions

In this research, yellowish-brown hare’s fur (HF) glazed samples were investigated by a variety of characterization methods. The morphology, chemical content, and phase composition of HF glaze were presented, and a possible formation mechanism of HF pattern was revealed. The main conclusions were drawn as follows:
  • The main constituents of the HF glaze were alumina (10.61–16.43 wt.%), silica (62.20–77.07 wt.%), calcium (3.85–6.97 wt.%), and iron oxide (4.10–8.35 wt.%). Minor elements such as sodium, potassium, and calcium existed as flux. The formation of HF patterns in the glaze occurred as a result of phase separation between melted glaze and crystallized iron oxides.
  • There were three types of ε-Fe2O3 crystals in the glaze surface: One consisted of well-grown leaf-like or dendritic-like structure, with highly ordered branches at micrometers scales; one comprised flower-like clusters accompanied by branches radiating from the center, petals growing along the branches, and needles on both sides of the petals; the last type entailed a honeycomb structure tightly packed with plentiful spherical or irregular-shaped particles. In addition, ε-Fe2O3 crystals in the cross-section of the glaze showed a gradient distribution.
  • At first, the nucleation seeds were formed and gradually grew into plentiful spherical or irregular-shaped particles. Then, these particles started to crystallize to form a two-dimensional plane structure, such as a flower-shaped structure with the primary branches formed radially. As the reaction time increased, more main branches such as secondary branches emerged and grew. The longer branches quickly grew preferentially in certain directions and some began to diverge. Tertiary branches grew with the accumulated particles attached to them, following the above processes. Eventually, highly differentiated or well-defined hierarchical structures were formed.

Author Contributions

Conceptualization, S.T. and Q.L.; data curation, S.T.; formal analysis, S.T., S.L., Y.Y., J.D., and Q.L.; writing—original draft preparation, S.T.; writing—review and editing, S.L. and Q.L. All authors have read and agreed to the published version of the manuscript.

Funding

This research was supported by the National Key R&D Program of China (Funder: Qinghui Li; Grant Number: 2019YFC1520203).

Institutional Review Board Statement

Not applicable.

Informed Consent Statement

Not applicable.

Data Availability Statement

The data or report of this study can be requested via the corresponding author.

Acknowledgments

The authors are grateful for the technical assistance provided by Shiqian Tao.

Conflicts of Interest

The authors declare no conflict of interest.

References

  1. Chen, X.; Chen, S.; Huang, R. A study on Song dynasty Jian bowl. China Ceram. 1983, 2, 61–69. (In Chinese) [Google Scholar]
  2. Huang, R.; Chen, X.; Chen, S. A high resolution electron microscopic investigation on the imitative glaze of Yaobian Tenmoku in Southern Song Dynasty. China Ceram. 1988, 1, 17–21. (In Chinese) [Google Scholar]
  3. Li, X.; Lu, J.; Yu, X. Imitation of ancient black-glazed Jian bowls (Yohen Tenmoku): Fabrication and characterization. Ceram. Int. 2016, 42, 15269–15273. [Google Scholar] [CrossRef]
  4. Xu, C.; Li, W.; Lu, X. Unveiling the science behind the tea bowls from the Jizhou kiln. Part I. Chemical compositions and the two-layer glazing technique. Ceram. Int. 2018, 44, 8540–8549. [Google Scholar]
  5. Li, W.; Zhang, W.; Lu, X. Chemical compositions and microstructures of hare’s fur black-glazed porcelains from Jian kiln, Jizhou kiln and Yaozhou kiln sites. J. Build. Mater. 2011, 14, 329–334. (In Chinese) [Google Scholar]
  6. Wu, B.; Zhao, W.; Ren, X.; Liu, X.; Li, B.; Feng, S.; Feng, X.; Zhao, H. Firing process and colouring mechanism of black glaze and brown glaze porcelains from the Yuan and Ming dynasties from the Qingliang Temple kiln in Baofeng, Henan, China. Ceram. Int. 2021, 47, 32817–32827. [Google Scholar] [CrossRef]
  7. Zhang, A. Scientific research on Jianzhan in Song Dynasty. Ceramics 2021, 5, 157–158. [Google Scholar]
  8. Chen, N. Taking the Hare’s fur glazed bowls as an example, discussing the firing process of Jian wares. Orient. Collect. 2020, 6, 48–50. (In Chinese) [Google Scholar]
  9. Chen, X.; Sun, J. Discussion on the peculiarity of oil spot national treasure Tenmoku Wares Jian of spot through the research results of the rare sherds. J. Ceram. 1995, 1, 26. [Google Scholar]
  10. Dejoie, C.; Sciau, P.; Li, W. Learning from the past: Rare ε-Fe2O3 in the ancient black-glazed Jian (Tenmoku) wares. Sci. Rep. 2014, 4, 4941. [Google Scholar] [CrossRef] [Green Version]
  11. Gich, M.; Frontera, C.; Roig, A. Magnetoelectric coupling in ε-Fe2O3 nanoparticles. Nanotechnology 2006, 17, 687–691. [Google Scholar] [CrossRef] [Green Version]
  12. Knížek, K.; Pashchenko, M.; Levinský, P. Spin seebeck effect in ε-Fe2O3 thin films with high coercive field. J. Appl. Phys. 2018, 124, 213904. [Google Scholar] [CrossRef]
  13. Ding, Y.; Morber, J.; Snyder, R. Nanowire structural evolution from Fe3O4 to ε-Fe2O3. Adv. Funct. Mater. 2007, 17, 1172–1178. [Google Scholar] [CrossRef]
  14. Tuček, J.; Zbořil, R.; Namai, A. ε-Fe2O3: An advanced nanomaterial exhibiting giant coercive field, millimeter-wave ferromagnetic resonance, and magnetoelectric coupling. Chem. Mater. 2010, 22, 6483–6505. [Google Scholar] [CrossRef]
  15. Kusano, Y.; Fujii, T.; Takada, J. Epitaxial growth of ε-Fe2O3 on mullite found through studies on a traditional Japanese stoneware. Chem. Mater. 2008, 20, 151–156. [Google Scholar] [CrossRef]
  16. Guan, M.; Kang, B.; Wei, X. The microstructure of multicolor hare’s fur glaze: The correlation between morphological and compositional characteristics and glaze color. Herit. Sci. 2021, 9, 21. [Google Scholar] [CrossRef]
  17. Chen, X.; Li, W.; Xu, C. Angle dependence of Jian bowl color and its coloring mechanism. J. Eur. Ceram. Soc. 2022, 42, 693–706. [Google Scholar] [CrossRef]
  18. Hoo, Q.; Liang, Y.; Yan, X. Millimeter-sized flower-like clusters composed of mullite and ε-Fe2O3 on the Hare’s Fur Jian Ware. J. Eur. Ceram. Soc. 2020, 40, 4340–4347. [Google Scholar] [CrossRef]
  19. Franci, G.; Akkas, T.; Yildirim, S. Characterization of a Jian-like sherd with the optical microscope, confocal Raman, wavelength-dispersive X-ray fluorescence, and portable XRF spectrometers. J. Raman Spectrosc. 2020, 51, 1343–1352. [Google Scholar] [CrossRef]
  20. Wang, L.; Wang, Y.; Zhang, M. Three-dimensional microstructure of ε-Fe2O3 crystals in ancient Chinese sauce glaze porcelain revealed by focused ion beam scanning electron microscopy. Anal. Chem. 2019, 91, 13054–13061. [Google Scholar] [CrossRef]
  21. Wang, M.; Wang, T.; Wang, F. Raman study of rusty oil spotted glaze produced in Linfen kilns (Shanxi province, AD 1115–1368). J. Raman Spectrosc. 2021, 8, 1–11. [Google Scholar] [CrossRef]
  22. Xu, Y.; Qin, Y.; Ding, F. Characterization of the rare oil spot glazed bowl excavated from the Xiao kiln site of north China. Ceram. Int. 2017, 43, 8636–8642. [Google Scholar] [CrossRef]
  23. Xu, C.; Li, W.; Lu, X. Unveiling the science behind the tea bowls from the Jizhou kiln. Part II. Microstructures and the coloring mechanism. Ceram. Int. 2018, 44, 19461–19473. [Google Scholar]
  24. Wen, R.; Wang, D.; Wang, L. The colouring mechanism of the brown glaze porcelain of the Yaozhou Kiln in the Northern Song Dynasty. Ceram. Int. 2019, 45, 10589–10595. [Google Scholar] [CrossRef]
  25. Zhong, D.; Guo, M.; Liu, Y. Nondestructive analysis of iron rich porcelains excavated from Qingliangsi Site in Baofeng Country, Henan Province. Spectrosc. Spectr. Anal. 2019, 1, 172–179. (In Chinese) [Google Scholar]
  26. Liu, Z.; Jia, C.; Li, L. The morphology and structure of crystals in Qing Dynasty purple-gold glaze excavated from the Forbidden City. J. Am. Ceram. Soc. 2018, 101, 5229–5240. [Google Scholar] [CrossRef]
  27. Liu, S.; Li, Q. Characterization of some ancient glass vessels fragments found in Xinjiang, China, using a portable energy dispersive XRF spectrometer. X-ray Spectrom. 2011, 40, 364–375. [Google Scholar] [CrossRef]
  28. Liu, S.; Li, Q.; Gan, F. Silk Road glass in Xinjiang, China: Chemical compositional analysis and interpretation using a high-resolution portable XRF spectrometer. J. Archaeol. Sci. 2012, 39, 2128–2142. [Google Scholar] [CrossRef]
  29. Tantrakarn, K.; Kato, N.; Hokura, A. Archaeological analysis of Roman glass excavated from Zadar, Croatia, by a newly developed portable XRF spectrometer for glass. X-ray Spectrom. 2009, 38, 121–127. [Google Scholar] [CrossRef]
  30. Ma, Q.; Pollard, A.M.; Jiang, J. Evaluation of quantitative XRF analysis applied to determine cobalt sources in Chinese Blue-and-White porcelain. Archaeometry 2021, 63, 194–203. [Google Scholar] [CrossRef]
  31. Min, Y. The Development of Ancient Iron-Based Glaze and Its Impact; Jingdezhen Ceramic Institute: Jingdezhen, China, 2009. (In Chinese) [Google Scholar]
  32. Li, W.; Luo, H.; Li, J. Studies on the microstructure of the black-glazed bowl sherds excavated from the Jian kiln site of ancient China. Ceram. Int. 2008, 34, 1473–1480. [Google Scholar] [CrossRef]
  33. Liu, Z.W.; Zhang, Z.G.; Li, H.; Wu, W.; Hua, J.J.; Cheng, G.F.; Lin, C.C. Microstructure Characteristics of the Black-Glazed Shreds Excavated from the Qingliangsi Kiln. Key Eng. Mater. 2011, 492, 112–117. [Google Scholar] [CrossRef]
  34. Libor, M.; Jiri, T.; Radek, Z. Polymorphous Transformations of Nanometric Iron (III) Oxide: A Review. Chem. Mater. 2011, 23, 3255–3272. [Google Scholar]
  35. López-Sánchez, J.; Serrano, A.; Del Campo, A.; Abuín, M.; Rodríguez de La Fuente, O.; Carmona, N. Sol-gel synthesis and micro-raman characterization of ε-Fe2O3 micro- and nanoparticles. Chem. Mater. 2016, 28, 511–518. [Google Scholar] [CrossRef]
  36. Mukherjee, S.; Garg, A.; Gupta, R. Probing magnetoelastic coupling and structural changes in magnetoelectric gallium ferrite. J. Phys.-Condens. Matter 2011, 23, 445403. [Google Scholar] [CrossRef] [Green Version]
  37. Puech, P.; Kandara, M.; Paredes, G.; Moulin, L.; Weiss-Hortala, E.; Kundu, A.; Monthioux, M. Analyzing the Raman Spectra of Graphenic Carbon Materials from Kerogens to Nanotubes: What Type of Information Can Be Extracted from Defect Bands? C-J. Carbon Res. 2019, 5, 69. [Google Scholar] [CrossRef] [Green Version]
  38. Spoto, S.; Paladini, G.; Caridi, F. Multi-Technique Diagnostic Analysis of Plasters and Mortars from the Church of the Annunciation (Tortorici, Sicily). Materials 2022, 15, 958. [Google Scholar] [CrossRef] [PubMed]
  39. Forestier, H.; Guiot-Guillain, G. New ferromagnetic variety of ferric oxide. C. R. Acad. Sci. 1934, 199, 720. [Google Scholar]
  40. Tronc, E.; Chaneác, C.; Jolivet, J. Structural and magnetic characterization of ε-Fe2O3. J. Solid State Chem. 1998, 139, 93–104. [Google Scholar] [CrossRef]
  41. Jin, J.; Ohkoshi, S.; Hashimoto, K. Giant coercive field of nanometer-sized iron oxide. Adv. Mater. 2004, 16, 48–51. [Google Scholar] [CrossRef]
  42. Shi, P.; Wang, F.; Zhu, J. Effect of phase separation on the Jian ware blue colored glaze with iron oxide. Ceram. Int. 2018, 44, 16407–16413. [Google Scholar] [CrossRef]
  43. Zhang, W.; Zheng, N.; Li, W. Scientific study of high-iron crystallization glaze. China Ceram. 2010, 46, 20–25. (In Chinese) [Google Scholar]
  44. Lahlil, S.; Xu, J.; Li, W. Influence of manufacturing parameters on the crackling process of ancient Chinese glazed ceramics. J. Cult. Herit. 2015, 16, 401–412. [Google Scholar] [CrossRef]
  45. Li, M.; Li, W.; Lu, X. Controllable preparation and decorative effect of iron-based crystalline glazes. J. Chin. Ceram. Soc. 2020, 48, 1134–1144. [Google Scholar]
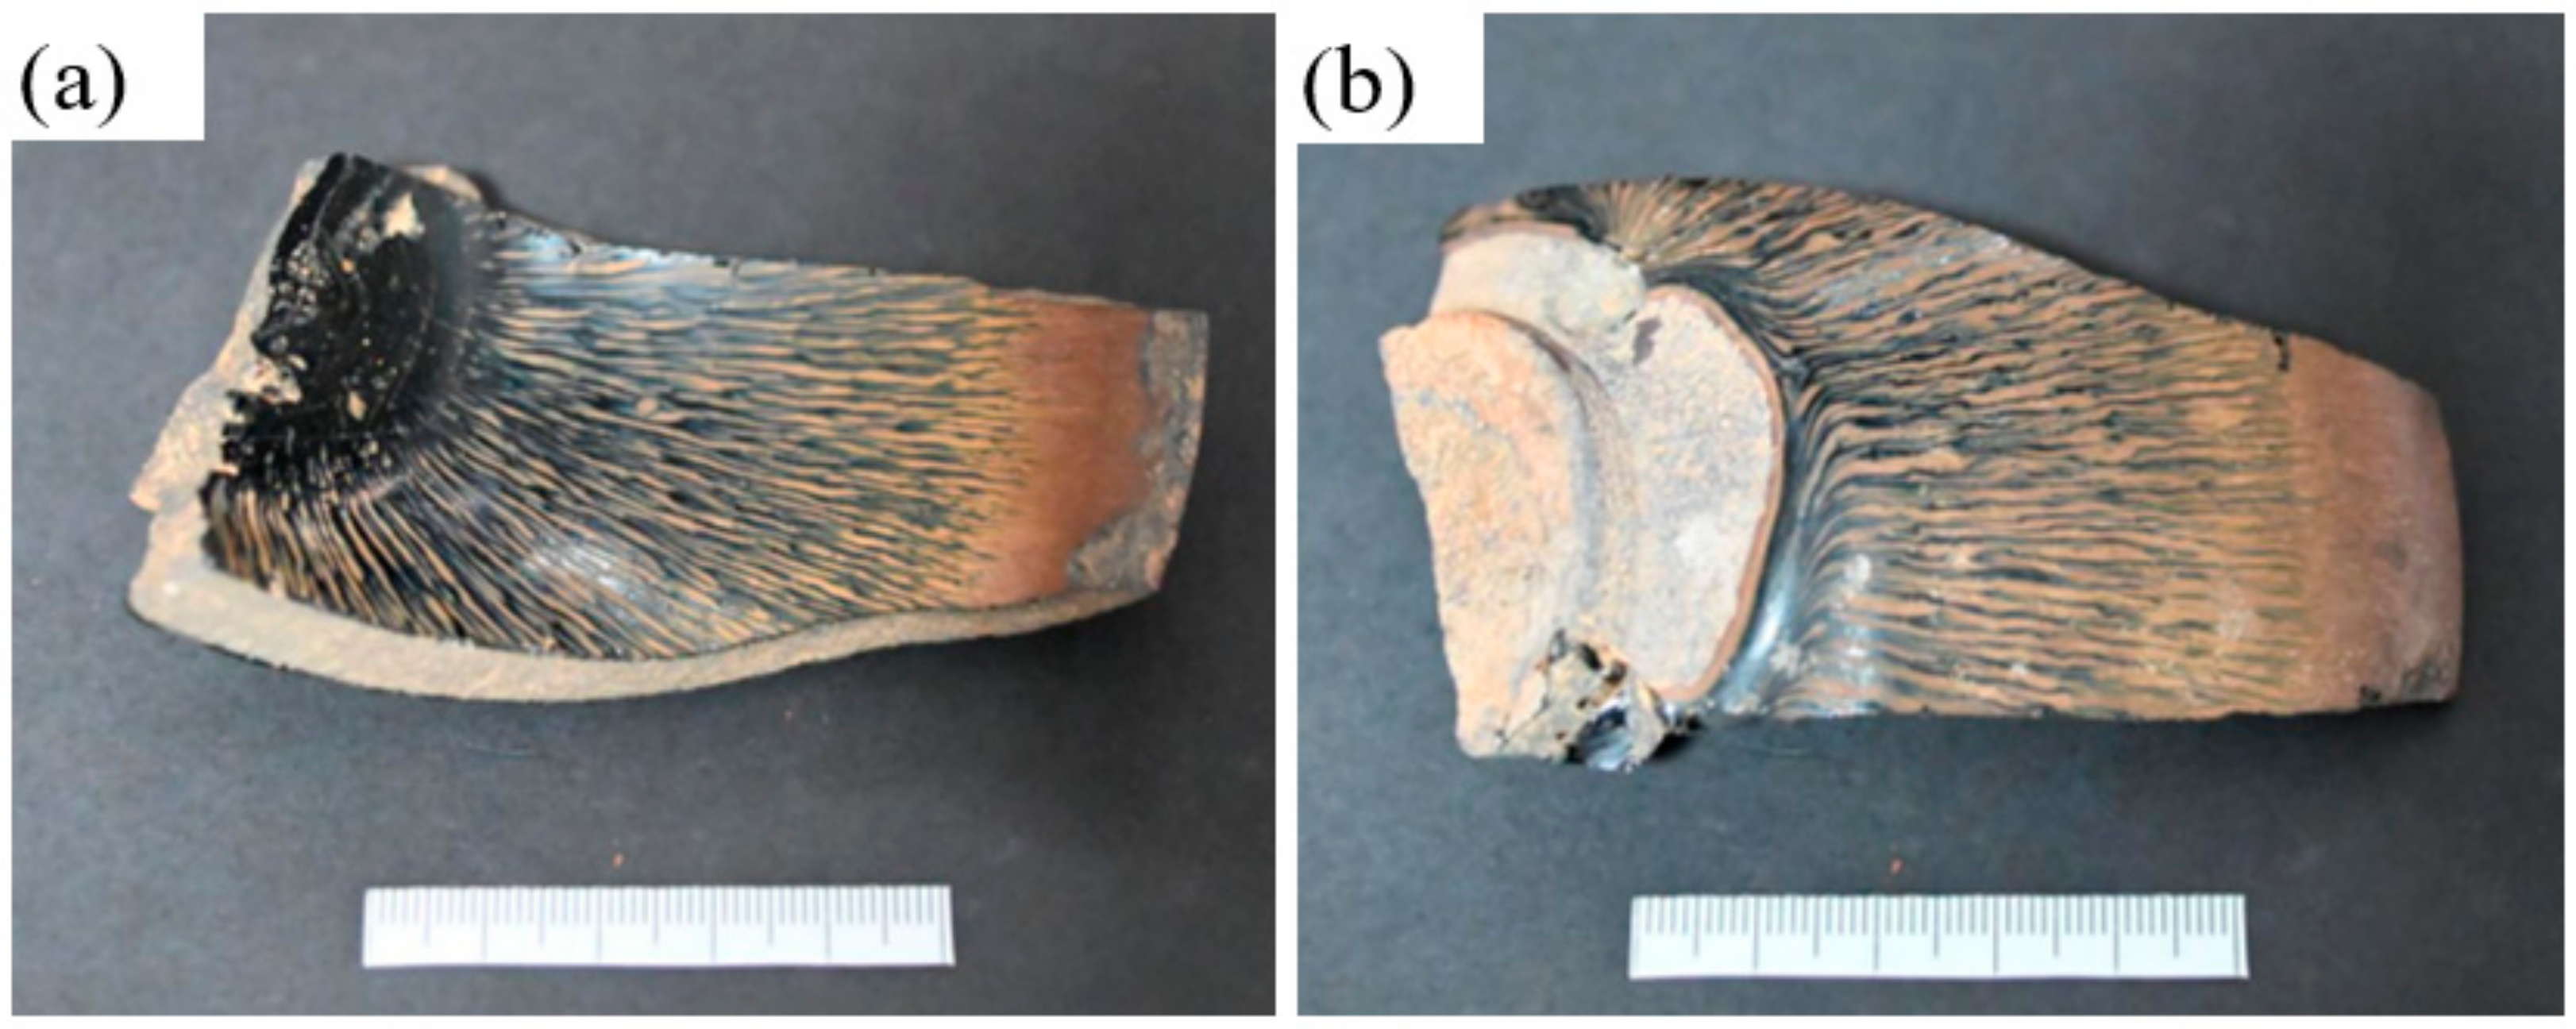
Figure 1. (a) Top and (b) bottom views of the hare’s fur Jian ware in Fujian Province, China.
Crystals 12 00367 g001
Figure 2. Fe K-edge XANES spectra: (a) the HF sample (points A, B, C, D, E correspond to the crystallization zone); (b) standard spectra of iron foil (Fe), hematite (Fe2O3), and magnetite (Fe3O4).
Crystals 12 00367 g002
Figure 3. Optical observation of the HF sample with different magnifications: (ad) the glaze surface; (e,f) the polished cross-section.
Crystals 12 00367 g003
Figure 4. XRD pattern of the glaze surface.
Crystals 12 00367 g004
Figure 5. Raman spectra of the sample: (a) different spots at the yellowish-brown hare’s fur area; (b) black glaze area.
Crystals 12 00367 g005
Figure 6. SEM images of the HF glaze with different magnifications: (ad,g) surface morphology; (e,f,h) the polished cross-section morphology. (Point A: black glazed area; Point B: crystalline area; Point C: large-scale main branches; Point D: secondary branches; Point E: tertiary branches).
Crystals 12 00367 g006
Figure 7. The element map distribution results of the surface glaze: (a) SEM micrograph, (b) Al, (c) Si, (d) Fe, (e) K, and (f) Ca.
Crystals 12 00367 g007
Figure 8. The element map distribution results of the polished cross-section (Al, Si, Fe, K, and Ca).
Crystals 12 00367 g008
Figure 9. Secondary electron image of crystals on the glaze surface: (a) dendritic-like crystals and (bd) magnified view of parts in (a).
Crystals 12 00367 g009
Table 1. Major chemical compositions of glaze and body by XRF analysis (wt.%).
SiO2Al2O3Fe2O3Na2OK2OCaOMgOTiOMnOP2O5
Hare’s fur glaze62.2016.438.35N.D.3.026.971.790.580.580.07
Black glaze 77.0710.614.10N.D.2.063.851.540.360.360.06
Body66.3218.5010.041.412.490.110.510.620.080.01
Table 2. Element content of different points (A, B, C, D, and E, shown in Figure 6) in glaze surface.
Elementswt.%
Point APoint BPoint CPoint DPoint E
O45.56140.11147.51246.44647.784
Al8.7226.2937.79010.72611.193
Si30.2818.53814.13018.06321.998
K3.6511.1021.5842.1342.150
Ca4.2030.7851.0161.7251.609
Fe5.99441.56926.59819.71613.851
Publisher’s Note: MDPI stays neutral with regard to jurisdictional claims in published maps and institutional affiliations.