Article

Identification of Heat-Treated Sapphires from Sri Lanka: Evidence from Three-Dimensional Fluorescence Spectroscopy

Gemmological Institute, China University of Geosciences, Wuhan 430074, China
*
Author to whom correspondence should be addressed.
Crystals 2022, 12(2), 293; https://doi.org/10.3390/cryst12020293
Submission received: 29 January 2022 / Revised: 8 February 2022 / Accepted: 15 February 2022 / Published: 19 February 2022
(This article belongs to the Special Issue Gem Crystals)

Abstract

:
Heat treatment is an important method used to improve the value of sapphires. The identification of heat-treated sapphires is a significant and challenging subject in gemology. In this study, natural sapphire samples from Ratnapura, Sri Lanka, were heated at different temperatures from 900 °C to 1500 °C. Then, the samples were examined by FTIR and three-dimensional fluorescence spectrometry. When excited by 450 nm light, most natural samples emitted a fluorescence band between 540 nm and 560 nm. This fluorescence disappeared after low-temperature heat treatment. Therefore, the presence of fluorescence between 540 nm and 560 nm is evidence of unheated sapphires from Sri Lanka. Almost all of the samples emitted fluorescence centered at 470 nm after high-temperature treatment. Therefore, fluorescence at 470 nm indicates that the sapphires from Sri Lanka were treated at a high temperature. Three-dimensional fluorescence spectroscopy can serve as a method to identify heat-treated sapphires.

1. Introduction

Sapphires are a variety of the mineral corundum, mainly composed of Al2O3. Their lustrous and colorful appearance, excellent durability and long mining history make them one of the most valuable gems in the market. However, most natural specimens cannot be used for this purpose due to the low quality of their color. To improve their color and greatly enhance their commercial value, sapphires are treated with different methods, among which heat treatment is the most important. Taking the melting temperature of rutile needle inclusion (1200–1350 °C) as the boundary, the heat treatment of sapphires is divided into low-temperature (below 1200 °C) and high-temperature heat treatment (above 1350 °C) [1].
Due to the huge difference in commercial value between natural and treated sapphires, it is important for gem laboratories to identify whether sapphires submitted by customers have been treated. However, this identification is challenging. The classical characteristics of heat-treated sapphires include stress fractures, residual sodium borate and chalky fluorescence. The application of spectroscopic technology has shown that absorption peaks of 3309 cm−1 and 3232 cm−1 in the FTIR spectrum could be evidence of heat treatment [1]. However, key evidence of heat treatment can be difficult to find due to different sample properties and treatment conditions. Therefore, gemologists are looking for more effective identification methods. The key piece of evidence that allows gemologists to identify heat-treated sapphires is the presence of an anomalous chalky fluorescence [2], which indicates that it is possible to explore evidence of heat treatment in sapphires using fluorescence. In this research, we used traditional methods (photomicrograph and FTIR) and fluorescence spectroscopy to obtain characteristics of sapphires before and after heat treatment, finding new evidence of heated sapphires.

2. Materials and Methods
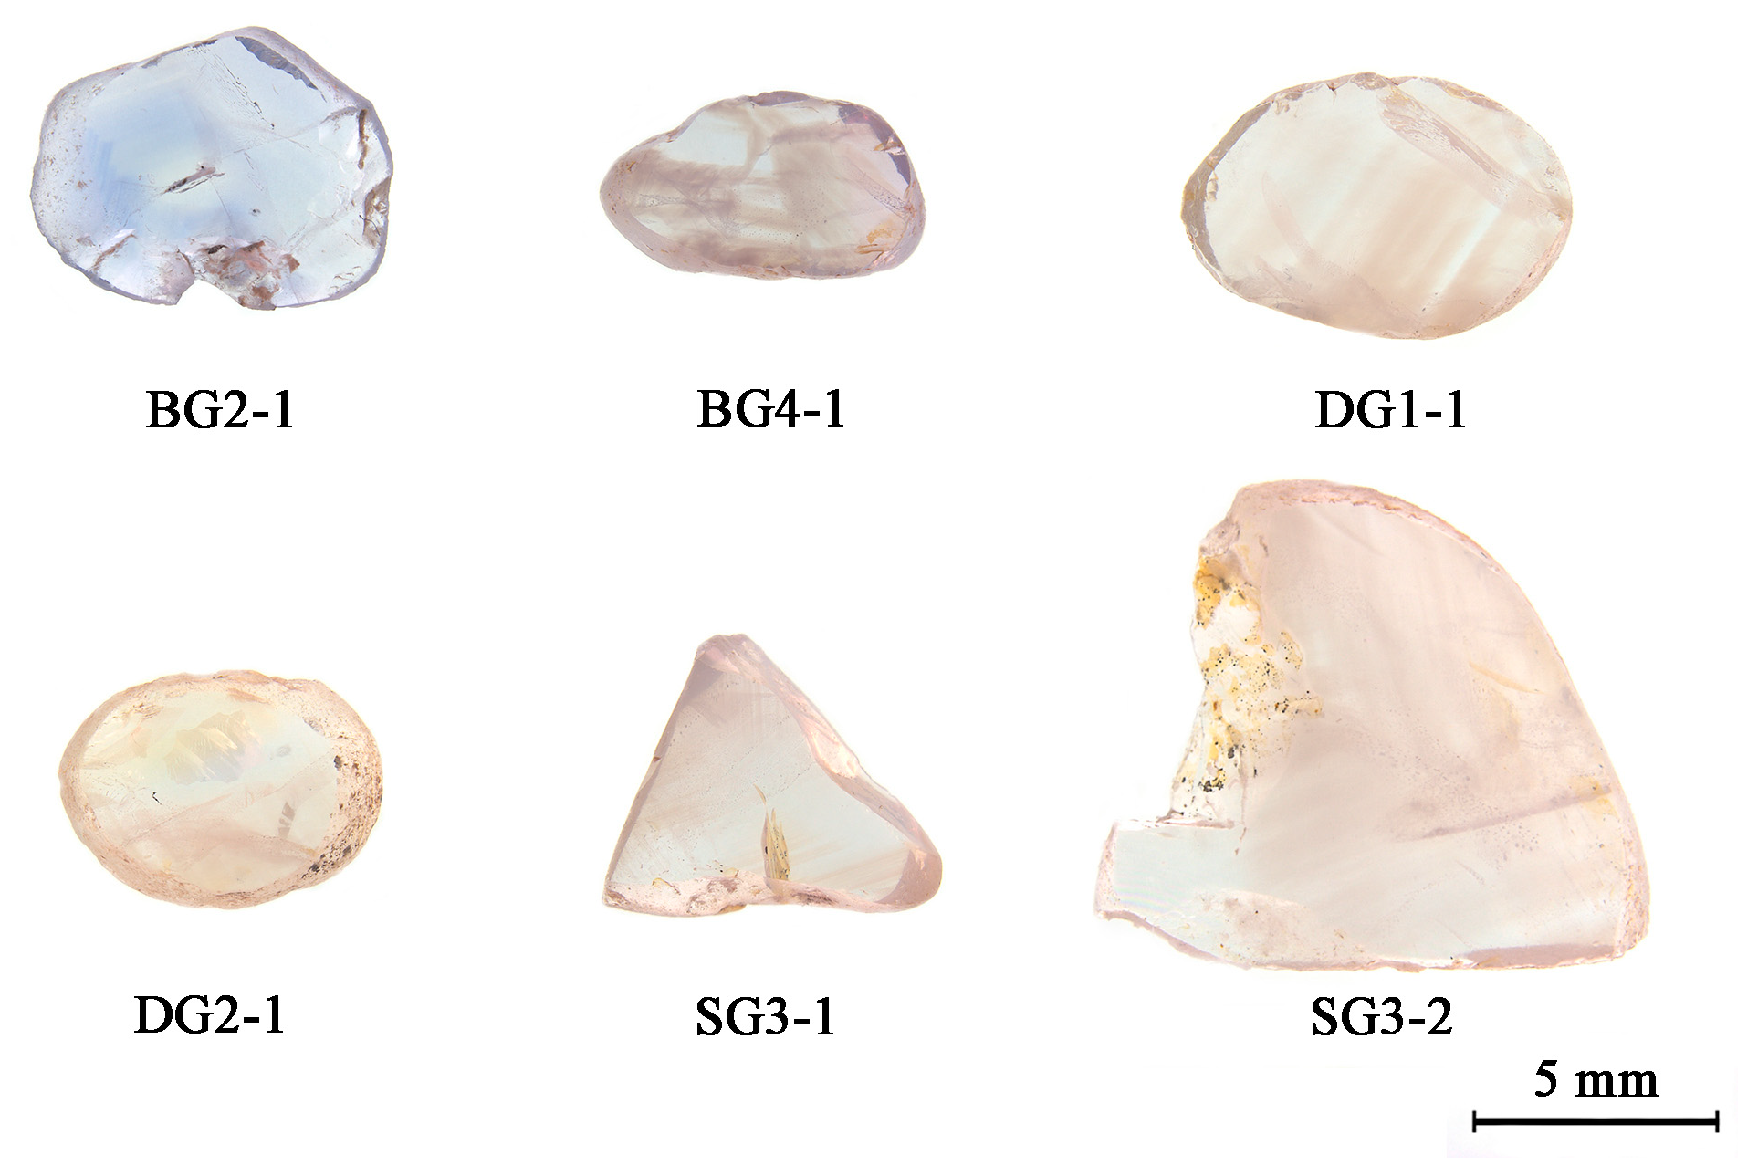
2.1. Materials

Six sapphire samples from a metamorphic-related placer in Ratnapura, Sri Lanka [3], were selected for study in this research. Regional and/or contact metamorphism favored the formation of corundum by removing silica and water, transforming aluminum- and magnesium-bearing silicates into oxides [3]. Sapphires from alluvial deposits in Ratnapura have been transported long distances, so they are usually rounded pebbles. Historically, sapphires from these deposits have been an important mineral resource, but most of them must be heat-treated to be used in jewelry.
Rough stones were cut into six 2 mm slices along the approximately vertical C-axis direction to reduce the influence of crystallographic orientation and crystal habit on the results. Photos were taken with a Nikon D810 camera (Figure 1). The general gemological properties of samples are listed in Table 1. All of these samples are pale blue–colorless and will need to be heated to improve their color.

2.2. Methods

Photomicrographs of the inclusions in the samples were taken using a Leica DFC 550-Leica M205 A Microphotographic system (Leica, Weztlar, Germany).
Chemical analysis was performed using a GeoLas 2005-Agilent 7500a LA-ICP-MS (Agilent, Santa Clara, CA, USA) with a 44 μm beam spot and a frequency of 6 Hz.
Infrared spectra of all samples were obtained using a Bruker Vertex 80 Fourier-transform infrared (FTIR) spectrometer (Bruker, Ettlingen, Germany). The transmittance method was used, with the following parameters: 64 scans, 1800–4000 cm−1 range, and 4 cm−1 resolution.
The UV–Vis spectra were detected by the Skyray Gem 100 (Skyray, Suzhou, China). The test range was 220–1000 nm, and the light sources were a tungsten lamp and a xenon lamp.
The fluorescence emission spectra and three-dimensional fluorescence spectra of all samples were obtained using a JASCO FP8500 fluorescence spectrometer (JASCO, Ishikawamachi Hachioji-shi Tokyo, Japan) with the following parameters: Ex bandwidth–5 mm, Em bandwidth–5 mm, PMT voltage–600V, and scan speed–2000 nm/min.
The equipment used for heat treatment was the GSL-1700X high-temperature tube furnace (HF-Kejing, Hefei, China). A low-temperature oxidation atmosphere was used to reduce the blue hues of sapphires, while a high-temperature reduction atmosphere was used to enhance the blue hues. Therefore, this experiment divided the heat treatment conditions into four groups using low-temperature oxidation treatments and one group using a high-temperature reduction treatment (Table 2).

3. Results and Discussion

3.1. Properties of Unheated Sapphire Samples

3.1.1. Chemical Analysis

The quantitative chemical composition, which was obtained with LA-ICP-MS, is shown in Table 3. The main component of the samples was Al2O3, which is in accordance with the composition of corundum. Moreover, low concentrations of Fe and Ga indicated that these samples were metamorphic-related corundum.

3.1.2. Infrared Spectroscopy Features

The FTIR spectra of samples are shown in Figure 2. All samples showed peaks at 2300–2400 cm−1, 2916 cm−1 and 2851 cm−1. The 2300–2400 cm−1 peak was assigned to CO2 in the environment. The 2916 cm−1 and 2851 cm−1 peaks were assigned to the stretching vibrations of CH [4], which may originate from organic matter filling the surfaces or fissures of the samples.
Sample DG2-1 showed 2123 cm−1 and 1994 cm−1 peaks, which indicated the presence of diaspore [5]. The cause of 3309/3232 cm−1 peaks is believed to be related to OH [1], but none of the samples investigated in this work showed this absorption peak.

3.1.3. UV–Vis Spectroscopy Features

The UV– Vis spectra of samples are shown in Figure 3. Sample BG4-1 displayed peaks at 388 nm and 450 nm. The other five samples showed a 450 nm peak but no 388 nm peak. The 388 nm peak was assigned as Fe3+, and Fe2+-Fe3+ led to absorption at 450 nm [6,7].
Samples BG2-1 and BG4-1 showed a wide absorption peak near 570 nm. The other samples had no obvious absorption. This absorption peak was produced by Fe2+-Ti4+, and is the main cause for the blue color of sapphires.
Samples BG4-1, SG3-1 and SG3-2 showed a Cr3+-related peak at 694 nm [8].

3.2. Fluorescence Features of Sapphire Samples

3.2.1. Fluorescence Excited by 365/254 nm UV Lamp

Samples BG4-1, SG3-1 and SG3-2 showed weak red fluorescence when excited by the 365 nm UV lamp. Other samples were inert under the same conditions. This reaction was consistent with UV–vis spectra. All samples were inert when excited by the 254 nm UV lamp.

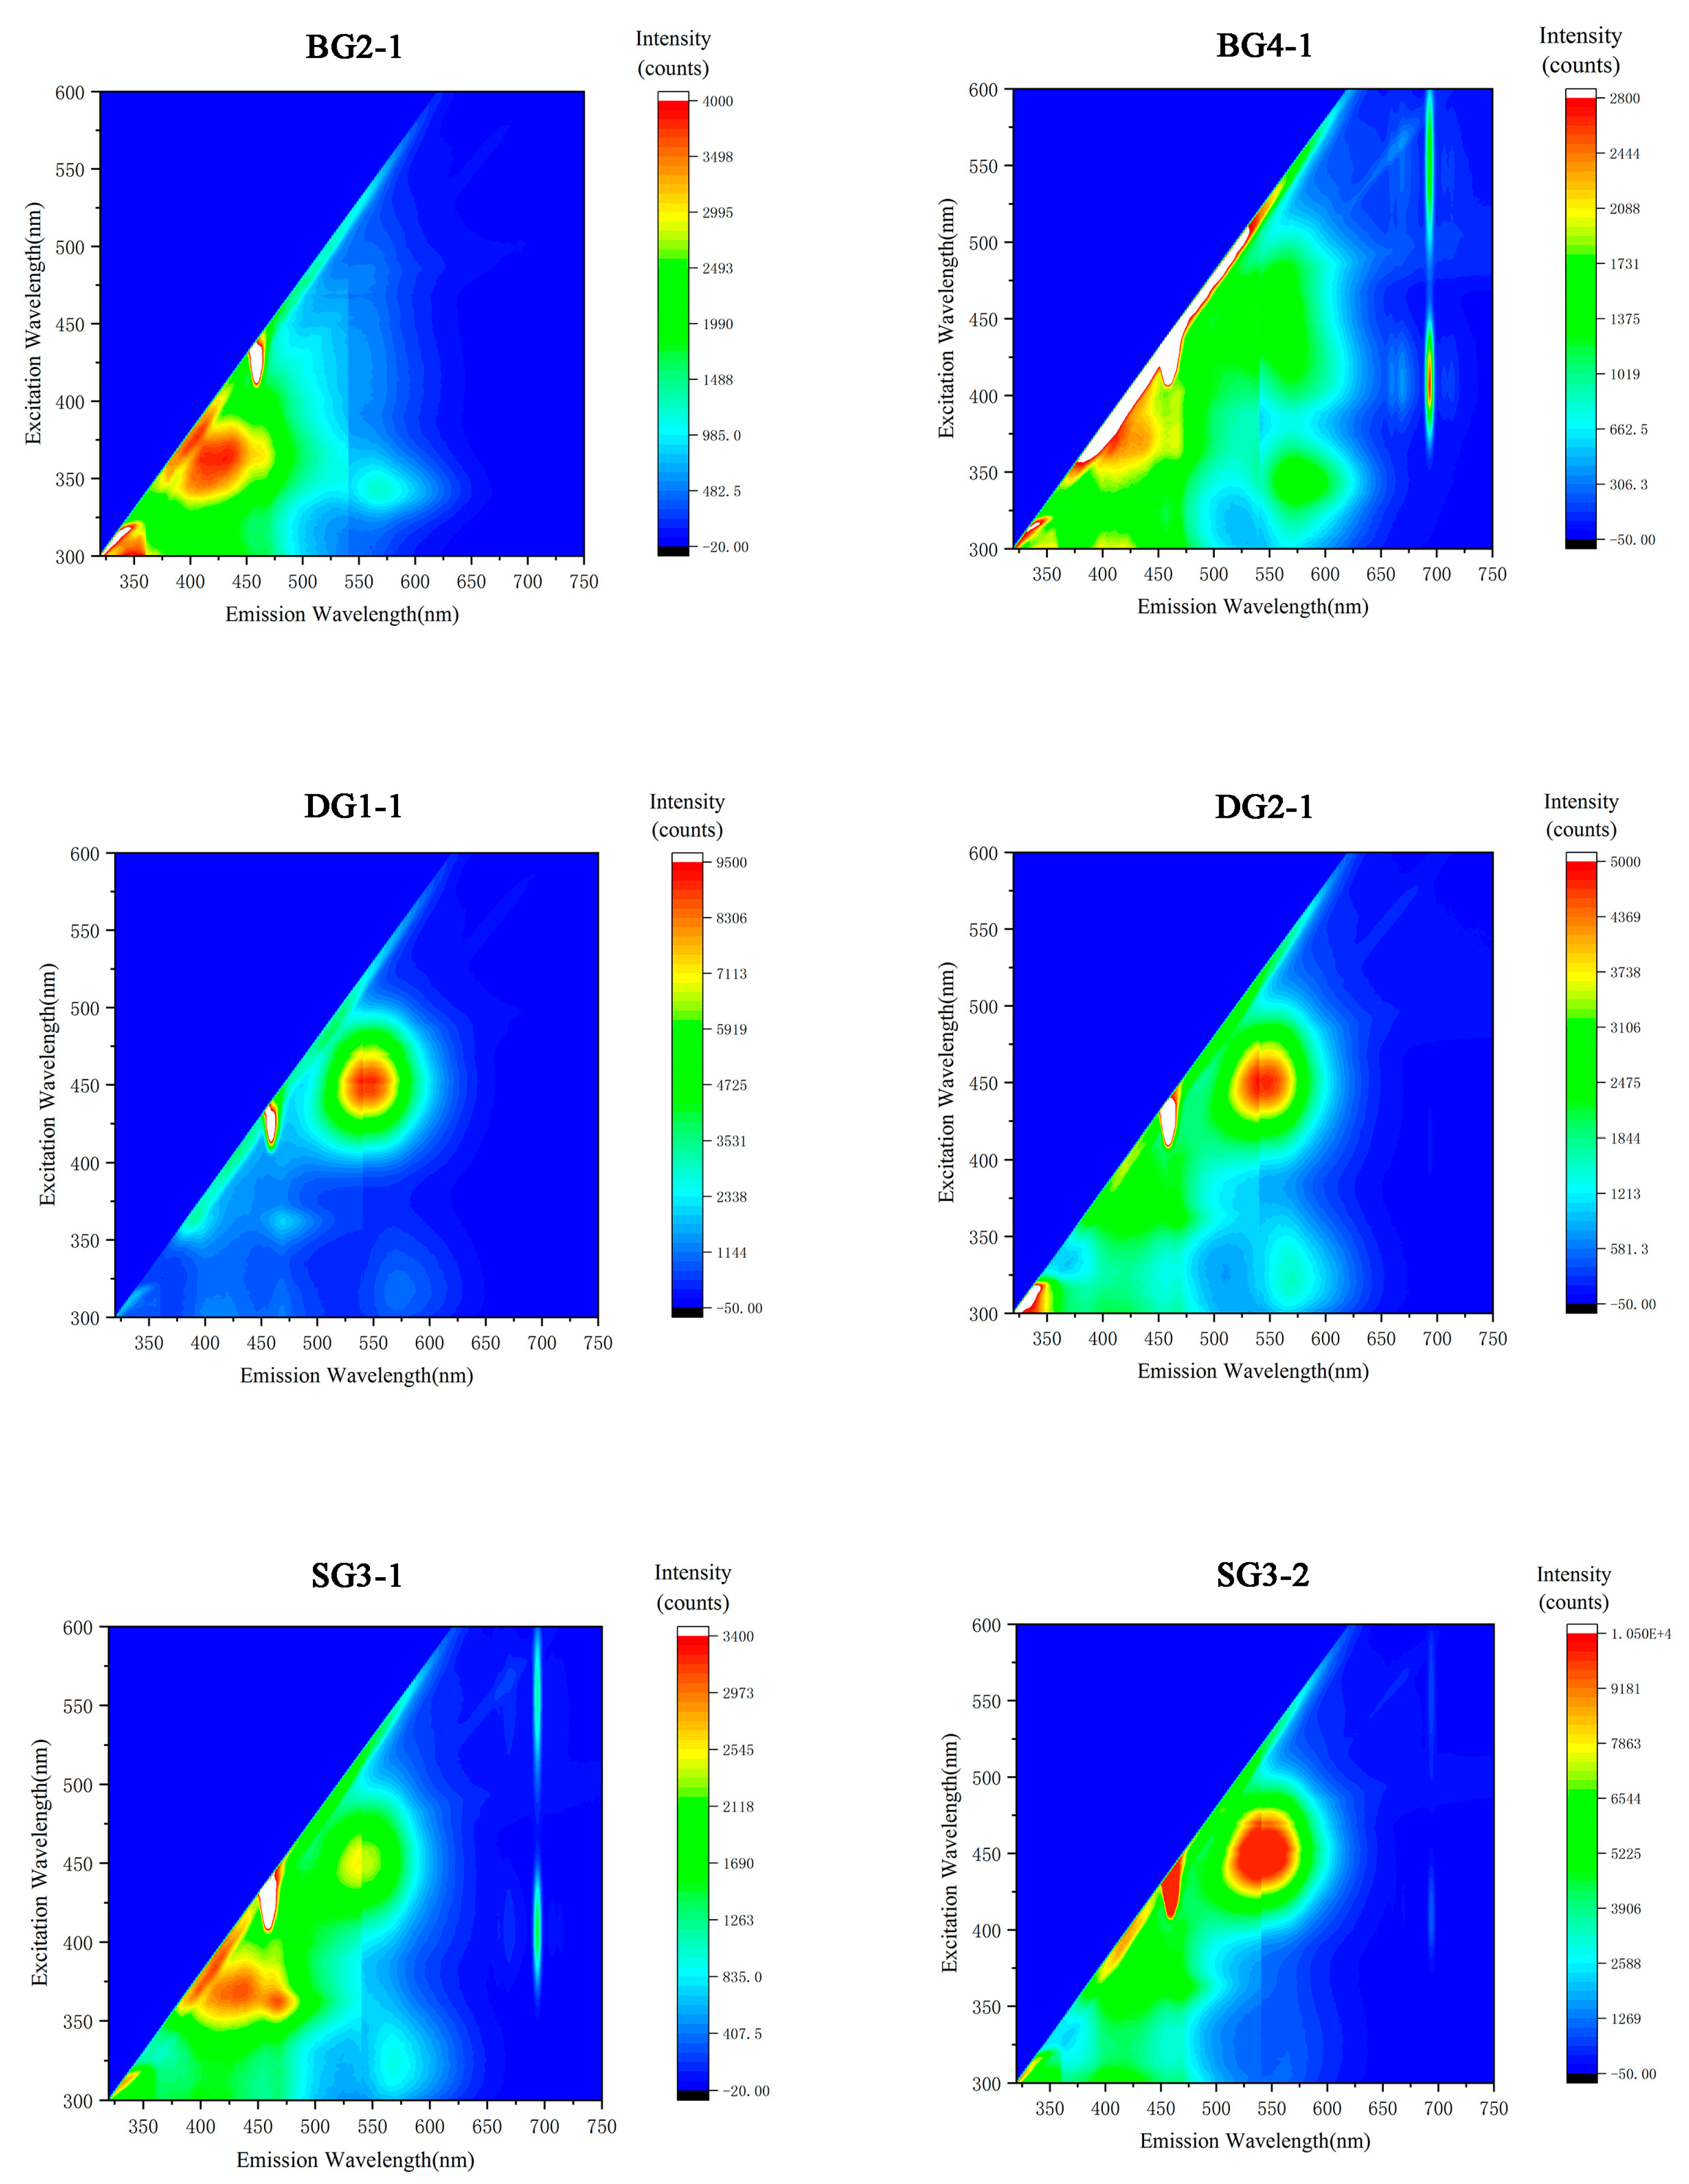
3.2.2. Three-Dimensional Fluorescence Spectroscopy Features

Three-dimensional fluorescence spectroscopy (3D fluorescence spectroscopy) is widely used in biology, chemistry, mineralogy and gemology. It magnifies the contrast between the signal and background and completely filters out the excitation light source without blocking the fluorescence emitted by the sample, which makes weak fluorescence clearly visible [9]. For example, the use of fluorescence spectroscopy can effectively distinguish whether pearls have been brightened [10] or dyed [11], and can also provide evidence regarding the origin of amber [12].
The 3D fluorescence spectra of the samples are shown in Figure 4 and are as follows:
(1)
Except for DG1-1, the samples showed 420–440 nm fluorescence when excited by the 360 nm light source. The fluorescence in this range was assigned to the charge transfer of O2−-Ti4+. The fluorescence was located at 415 nm when the concentration of Ti4+ was low. With the increase in Ti4+ concentration, this fluorescence shifted to a longer wavelength position [1].
(2)
Except for BG2-1, the samples showed obvious 540–560 nm fluorescence when excited by the 450 nm light source. All six samples emitted 560–580 nm fluorescence when excited by the 320 nm light source.
(3)
Samples BG4-1, SG3-1 and SG3-2 displayed strong 694 nm fluorescence when excited by the 410 nm and 550 nm light sources. The 694 nm fluorescence excited by 410 nm was assigned to 4A2-4T1 of Cr3+, while the fluorescence excited by 550 nm was assigned to 4A2-4T2 of Cr3+ [8,13]. Samples that emitted 694 nm fluorescence were consistent with the UV–vis spectra. The reason why the fluorescence peaks of samples DG1-1 and BG2-1 were not completely consistent with the other samples is currently unclear.
The fluorescence near 460 nm (emission wavelength) can be attributed to the inherent error of the instrument. The abrupt change near 540 nm (emission wavelength) was caused by raster conversion.
In order to more clearly identify the peaks of various fluorescence, light sources with wavelengths of 320 nm, 360 nm, 410 nm and 450 nm were selected to excite the samples and plot the emission spectra (Figure 5). Most samples emitted fluorescence at 420 nm, 460 nm, 550 nm and 570 nm. Samples BG4-1, SG3-1 and SG3-2 showed fluorescence at 694 nm.
As shown in Figure 5, the excitation efficiency for each luminescent center was different when different excitation sources were used. This indicates that some important information may be missed when observing fluorescence under a 365 nm/254 nm UV lamp, while by using three-dimensional fluorescence it is possible to discover the luminous centers of gems comprehensively and in more detail.

3.3. Properties of Heated Sapphire Samples

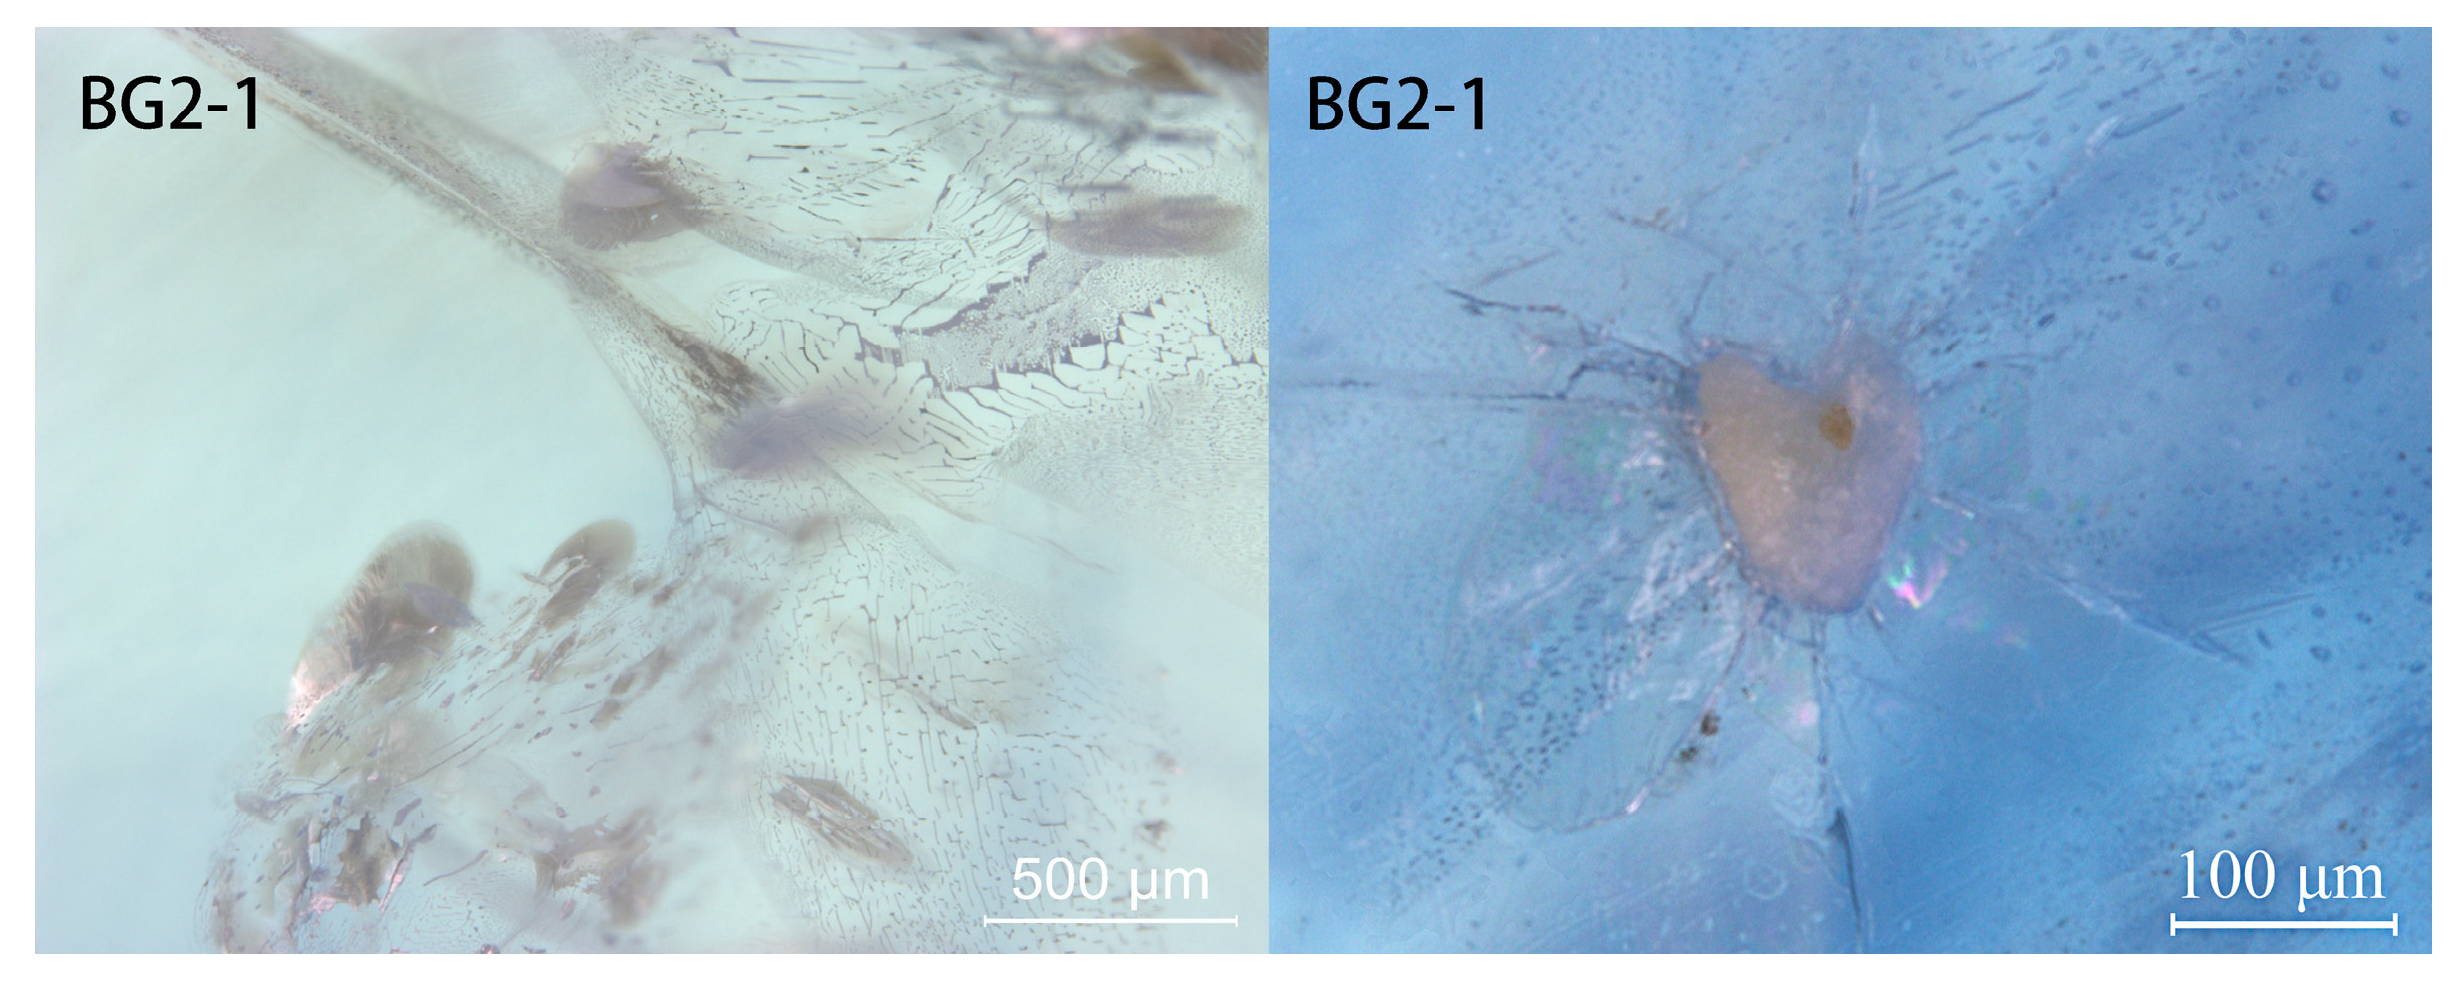
3.3.1. Appearance and Inclusion Features after Heat Treatment

To compare the color changes of the sapphire samples after heat treatment under different conditions, images were taken with a Nikon D810 camera in a D65 light box, and color correction was performed with an X-Rite gray plate (Figure 6).
After heat treatment at 900 °C, 1000 °C, 1100 °C and 1200 °C in an oxidation atmosphere, the sapphires, which were colorless, did not show any obvious color changes. After heat treatment at 1500 °C in the reduction atmosphere, only samples BG2-1 and BG4-1 showed an obvious blue color, while the remaining samples did not display the expected blue color.
As Figure 7 shows, the blue band of sample BG2-1 was hexagonal. Some parallel banded structures in sample DG1-1 turned blue after heat treatment. Veil-like fillings can be observed, which were caused by sodium borate melting and filling into cracks at a high temperature. Stress cracks were observed around the crystal inclusions, providing evidence that the sapphires were heated (Figure 8).

3.3.2. Infrared Spectroscopy Features of Heated Sapphire Samples

The peaks of 3309 cm−1 and 3232 cm−1 in the FTIR spectrum are important evidence of heat treatment in sapphires. It is generally believed that the simultaneous occurrence of the 3309 cm−1 and 3232 cm−1 peaks indicates a metamorphic sapphire that was heated at a high temperature [1].
Spectra were obtained before and after heating at each temperature (Figure 9), with the following results:
(1)
No samples showed a 3309 cm−1 peak after heating at 900 °C, 1000 °C or 1100 °C. After heating to 1200 °C, sample BG2-1 showed a peak of 3309 cm−1, while the other five samples did not. Samples BG2-1, BG4-1 and DG1-1 showed a 3309 cm−1 peak after heating at 1500 °C. Therefore, the occurrence of a 3309 cm−1 peak in the FTIR spectrum is only auxiliary evidence of high temperature heating in Sri Lankan sapphires.
(2)
No obvious 3232 cm−1 peak appeared in all samples after heat treatment at each temperature. Therefore, the mere presence/absence of the peak at 3232 cm−1 does not allow us to establish whether the sapphire has been heated.
(3)
Sample DG2-1 showed peaks of 2123 cm−1 and 1994 cm−1 when it was not heated, and these two peaks disappeared after heat treatment at 900 °C. This indicates that the existence of the diaspore (2123 cm−1 and 1994 cm−1 peaks) is evidence of unheated sapphires.

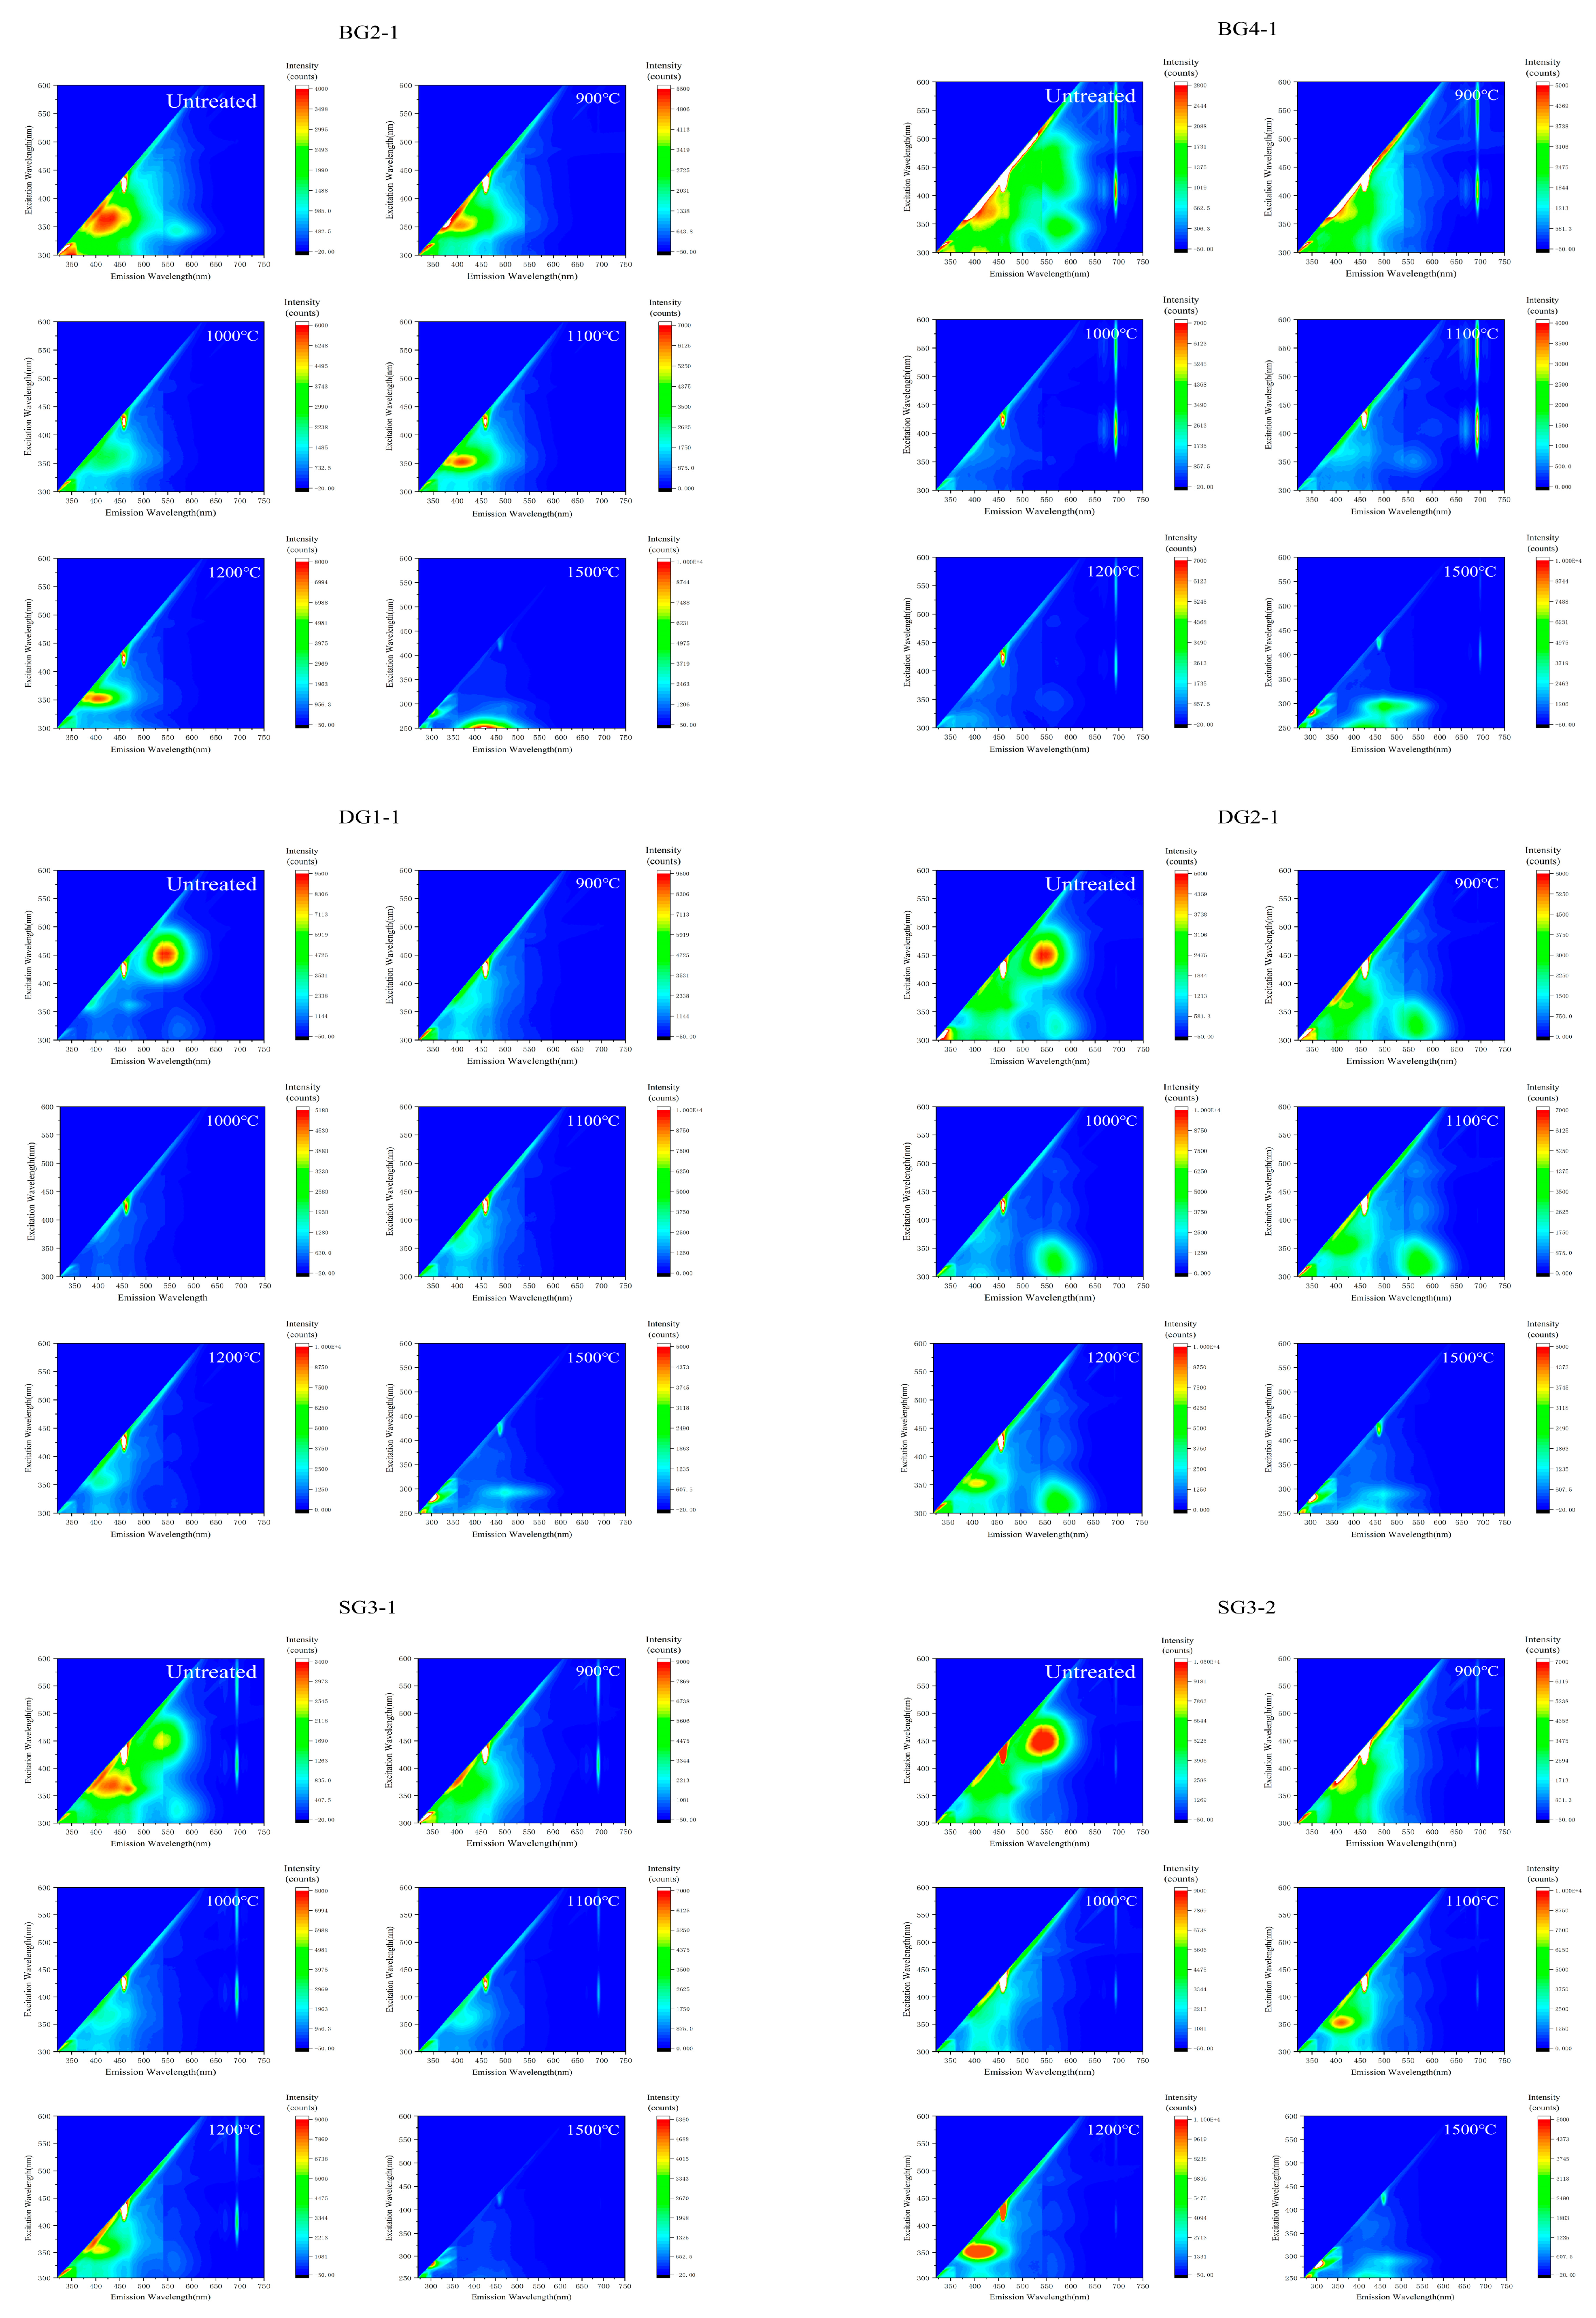
3.4. Three-Dimensional Fluorescence Spectroscopy Features of Heated Samples

The 3D fluorescence spectra were obtained after heating at each temperature (Figure 10). The changes in fluorescence after heating were as follows:
(1)
Fluorescence with emission wavelengths of 420–440 nm. As can be observed from the fluorescence changes of samples BG2-1, DG1-1, DG2-1, SG3-1 and SG3-2 heated at different temperatures, the 420–440 nm fluorescence tends to increase after heat treatment at 1000 °C and 1100 °C. This may be consistent with the chalky fluorescence that Hughes (2019) observed in sapphires from Madagascar after low-temperature heat treatment [14].
(2)
Fluorescence with emission wavelengths of 470 nm. All samples showed fluorescence with an emission wavelength of 470 nm after heat treatment at 1500 °C, except SG3-1. This fluorescence did not appear in sapphires without heat treatment or after treatment at a low temperature below 1200 °C. Therefore, it is speculated that the 470 nm fluorescence is evidence of high-temperature heat treatment in Sri Lankan sapphires. The reason for the absence of 470 nm fluorescence in sample SG3-1 is unclear.
(3)
Fluorescence with emission wavelengths of 540–560 nm and 560–580 nm. This fluorescence almost disappeared after heat treatment. In all samples, the 540–560 nm fluorescence of disappeared after heat treatment at 900 °C, indicating that the fluorescence was greatly affected by the temperature. Since the fluorescence at 540–560 nm and at 560–580 nm disappeared after heat treatment, the fluorescence at these two sites can be evidence of unheated Sri Lankan sapphires.
(4)
Fluorescence with emission wavelengths of 694 nm. This fluorescence appeared after heating at all temperatures, indicating that heat treatment at 1500 °C and below did not change the environment around Cr3+ significantly.
It is worth noting that Hughes (2017) previously tested the emission spectra and believed that the luminescence center of sapphires after high-temperature heat treatment was located at 415 nm [1]. The 415 nm fluorescence was also observed in samples after heat treatment in this study. However, the most obvious difference before and after heating was the 470 nm fluorescence. Therefore, it is believed that the blue chalky fluorescence that appeared in the sapphires after heat treatment consisted of both the 415 nm and the 470 nm fluorescence.

4. Conclusions

In this study, sapphire samples were heated in a temperature range from 900 °C to 1500 °C. The gemological characteristics, FTIR spectra and 3D fluorescence spectra were tested before and after the heat treatment. The conclusions are as follows:
(1)
In our work, no peak of 3232 cm−1 in the FTIR spectra of the heated sapphires was observed. Therefore, FTIR has limitations in judging whether sapphires were heated by using only the 3232 cm−1 peak in the FTIR spectra. The absorption peaks of 2123 cm−1 and 1994 cm−1 indicated that the diaspore disappeared after low-temperature heat treatment. Thus, the 2123 cm−1 and 1994 cm−1 peaks indicate that the Sri Lankan sapphires were not heated;
(2)
According to the 3D fluorescence spectra analysis, the fluorescence with an emission wavelength of 540–560 nm in untreated samples disappeared after low-temperature heat treatment. Therefore, the existence of 540–560 nm fluorescence is evidence that Sri Lankan sapphires have not been heated;
(3)
The 470 nm fluorescence appeared in samples after heat treatment at 1500 °C. Therefore, the 470 nm fluorescence is evidence of the high-temperature heat treatment of sapphires. Together with the 415 nm fluorescence, the 470 nm fluorescence may form the blue-chalky fluorescence of the Sri Lankan sapphires after heat treatment.

Author Contributions

Writing—original draft preparation, Y.Z.; writing—review and editing, M.C. All authors have read and agreed to the published version of the manuscript.

Funding

This research received no external funding.

Institutional Review Board Statement

Not applicable.

Informed Consent Statement

Not applicable.

Data Availability Statement

All supporting data and computational details are available on written request. These data are stored by the main author of this article.

Acknowledgments

We thank three anonymous reviewers for comments that improved our manuscript.

Conflicts of Interest

The authors declare no conflict of interest.

References

  1. Hughes, R.H.; Manorotkul, W.; Hughes, E.B. Ruby and Sapphire: A Gemologist’s Guide; RWH Publishing/Lotus Publishing: Bangkok, Thailand, 2017; pp. 151–158. [Google Scholar]
  2. Crowningshield, R. Developments and Highlights at the Gem Trade Lab in New York: Unusual items encountered. Gems Gemol. 1966, 12, 73. [Google Scholar]
  3. Lucas, A.; Sammoon, A.; Jayarajah, A.P.; Hsu, T.; Padua, P. Sri Lanka: Expedition to the Island of Jewels. Gems Gemol. 2014, 50, 174–201. [Google Scholar] [CrossRef] [Green Version]
  4. Volynets, F.K.; Vorob’ev, V.G.; Sidorova, E.A. Infrared absorption bands in corundum crystals. J. Appl. Spectrosc. 1969, 10, 665–667. [Google Scholar] [CrossRef]
  5. Nicastro, I.; Vertriest, W.; Renfro, N.; Sun, Z.; Palke, A.; Mattlin, P. Purplish pink diaspore reportedly from Afghanistan. Gems Gemol. 2020, 56, 298–301. [Google Scholar]
  6. Ferguson, J.; Fielding, P.E. The origins of the colours of natural yellow, blue and green sapphires. Aust. J. Chem. 1972, 25, 1371–1385. [Google Scholar] [CrossRef]
  7. Smith, G. Evidence for absorption by exchange-coupled Fe2+-Fe3+ pairs in the near infra-red spectra of minerals. Phys. Chem. Miner. 1978, 3, 375–383. [Google Scholar] [CrossRef]
  8. Marfunin, A.S. Chapter 5: Luminescence. In Spectroscopy, Luminescence and Radiation Centers in Minerals; Springer: Berlin/Heidelberg, Germany; New York, NY, USA, 1979; pp. 141–222. [Google Scholar] [CrossRef]
  9. Lichtman, J.W.; Conchello, J.A. Fluorescence microscopy. Nat. Methods 2005, 2, 910–919. [Google Scholar] [CrossRef] [PubMed]
  10. Zhou, C.; Tsai, T.H.; Sturman, N.; Nilpetploy, N.; Manustrong, A.; Lawanwong, K. Optical Whitening and Brightening of Pearls: A Fluorescence Spectroscopy Study. Gems Gemol. 2020, 56, 258–265. [Google Scholar] [CrossRef]
  11. Tsai, T.-H.; Zhou, C. Fluorescence Spectroscopy for Colored Pearl Treatment Screening. Gems Gemol. 2020, 55, 136. [Google Scholar]
  12. Jiang, X.; Zhang, Z.; Wang, Y.; Kong, F. Gemmological and Spectroscopic Characteristics of Different Varieties of Amber from the Hukawng Valley, Myanmar. J. Gemmol. 2020, 37, 144–162. [Google Scholar] [CrossRef]
  13. Gaft, M. Modern Luminescence Spectroscopy of Minerals and Materials; Springer: Berlin/Heidelberg, Germany, 2005; pp. 14–16. [Google Scholar]
  14. Hughes, E.B.; Perkins, R. Madagascar Sapphire: Low-temperature heat treatment experiments. Gems Gemol. 2019, 55, 184–197. [Google Scholar] [CrossRef] [Green Version]
Figure 1. The studied sapphire samples.
Crystals 12 00293 g001
Figure 2. Infrared spectra of sapphire samples.
Crystals 12 00293 g002
Figure 3. UV–vis spectra of the sapphire samples.
Crystals 12 00293 g003
Figure 4. The 3D fluorescence spectra of the sapphire samples.
Crystals 12 00293 g004
Figure 5. Emission spectra of the sapphire samples excited by a (a) 320 nm, (b) 360 nm, (c) 410 nm and (d) 450 nm light source.
Crystals 12 00293 g005
Figure 6. Color changes of the sapphire samples after heat treatment at different temperatures.
Crystals 12 00293 g006
Figure 7. Hexagonal angular (left) and banded (right) blue band after heat treatment.
Crystals 12 00293 g007
Figure 8. Fractures filled with sodium borate after heat treatment (left) and stress fractures around crystal inclusions (right).
Crystals 12 00293 g008
Figure 9. Infrared spectra of sapphire samples after heat treatment at 900 °C, 1000 °C, 1100 °C, 1200 °C and 1500 °C.
Crystals 12 00293 g009
Figure 10. Three-dimensional fluorescence spectra of the sapphire samples before and after heat treatment.
Crystals 12 00293 g010
Table 1. General gemological properties.
Sample No.Specific GravityRefractive IndexColorTransparency
BG2-13.981.762–1.770pale bluetransparent
BG4-13.981.762–1.770colorlesstransparent
DG1-13.971.761–1.769colorlesstransparent
DG2-13.981.762–1.770colorlesstransparent
SG3-13.971.761–1.769colorlesstransparent
SG3-23.991.763–1.771colorlesstransparent
Table 2. Heat treatment scheme.
Maximum Temperature
(°C)
Heating Rate
(°C/min)
Heat Treatment Time
(h)
Atmosphere
900512oxidation
1000512oxidation
1100512oxidation
1200512oxidation
1500416reduction
Table 3. Chemical composition of samples obtained by LA-ICP-MS.
BG2-1BG4-1DG1-1DG2-1SG3-1SG3-2
Al2O3 (wt%)99.3598.9799.3299.4799.2799.02
Fe (ppma)163243137148204247
Ti (ppma)721596387144209
Mg (ppma)641797291113191
Ga (ppma)2914773524
Publisher’s Note: MDPI stays neutral with regard to jurisdictional claims in published maps and institutional affiliations.

