1. Introduction
Coal gangue is a solid waste produced in coal mining and washing, accounting for about 15–20% of coal output. It is one of the greatest industrial wastes worldwide. Moreover, coal gangue occupies territory, pollutes the environment, and even induces geological disasters [
1,
2]. Therefore, some scholars have carried out research on how to utilize coal gangue as a resource [
3,
4,
5].
After appropriate treatment, coal gangue can be viewed as a potential resource instead of industrial waste. In recent years, the utilization of coal gangue has attracted the attention of a large number of scholars. Qiu et al. [
6] investigated the influence of calcined coal gangue content on the mechanical behavior of cement mortar. Zhao et al. [
7] proposed that coal gangue can be employed as a primary cementitious material after being modified by an activation method. Huang et al. [
8] investigated the effect of the coal gangue replacement ratio as the coarse aggregate on the concrete properties of concrete subjected to freeze-and-thaw cycles. Abichou et al. [
9] pointed out that crushed coal gangue can be partly or entirely used as a fine aggregate in concrete. Li et al. [
10] proposed that coal gangue can be used as a coal mine goaf backfill. At present, relevant research mainly focuses on the application of coal gangue as supplementary cementitious materials [
11,
12,
13], aggregates [
14,
15], and backfill materials [
16,
17,
18]. Few investigations have concentrated on the feasibility of employing coal gangue to improve the subgrade performance of low-grade highways.
In view of its considerable transportation costs, coal gangue is still mainly employed to backfill goaf and land reclamation in many countries. Therefore, the application of in situ resource utilization technology is an effective method to improve the utilization rate of coal gangue. This paper proposes a modified tabia technology with composite-activated coal gangue (CACG) to enhance the subgrade performance of low-grade highways around coal mines. Furthermore, a composite activation method was adopted to improve the pozzolanic activity of coal gangue. The effects of calcination temperature (600 °C, 700 °C, 800 °C and 900 °C), holding time (1 h, 2 h, 3 h, and 4 h) and particle size (60 mesh, 100 mesh and 200 mesh) on the pozzolanic activity of coal gangue were investigated. The mineral compositions, chemical compositions, and microstructure of the coal gangue and CACG were identified, respectively. Moreover, the Ca(OH)2 consumption method was employed to evaluate the effects of mechanical activation and thermal activation on the pozzolanic activity of coal gangue. Four groups with different CACG content (0%, 10%, 30% and 50%) were designed to investigate the effects of CACG content on the performances of tabia. Furthermore, the mechanical properties, including the unconfined compressive strength, splitting strength, flexural tensile strength, seepage resistance, freeze-thaw resistance, and drying shrinkage properties of the modified tabia were experimentally investigated, respectively. Finally, the microstructure change and hydration mechanism of the modified tabia were revealed.
2. Experimental Section
2.1. Raw Materials
2.1.1. Coal Gangue
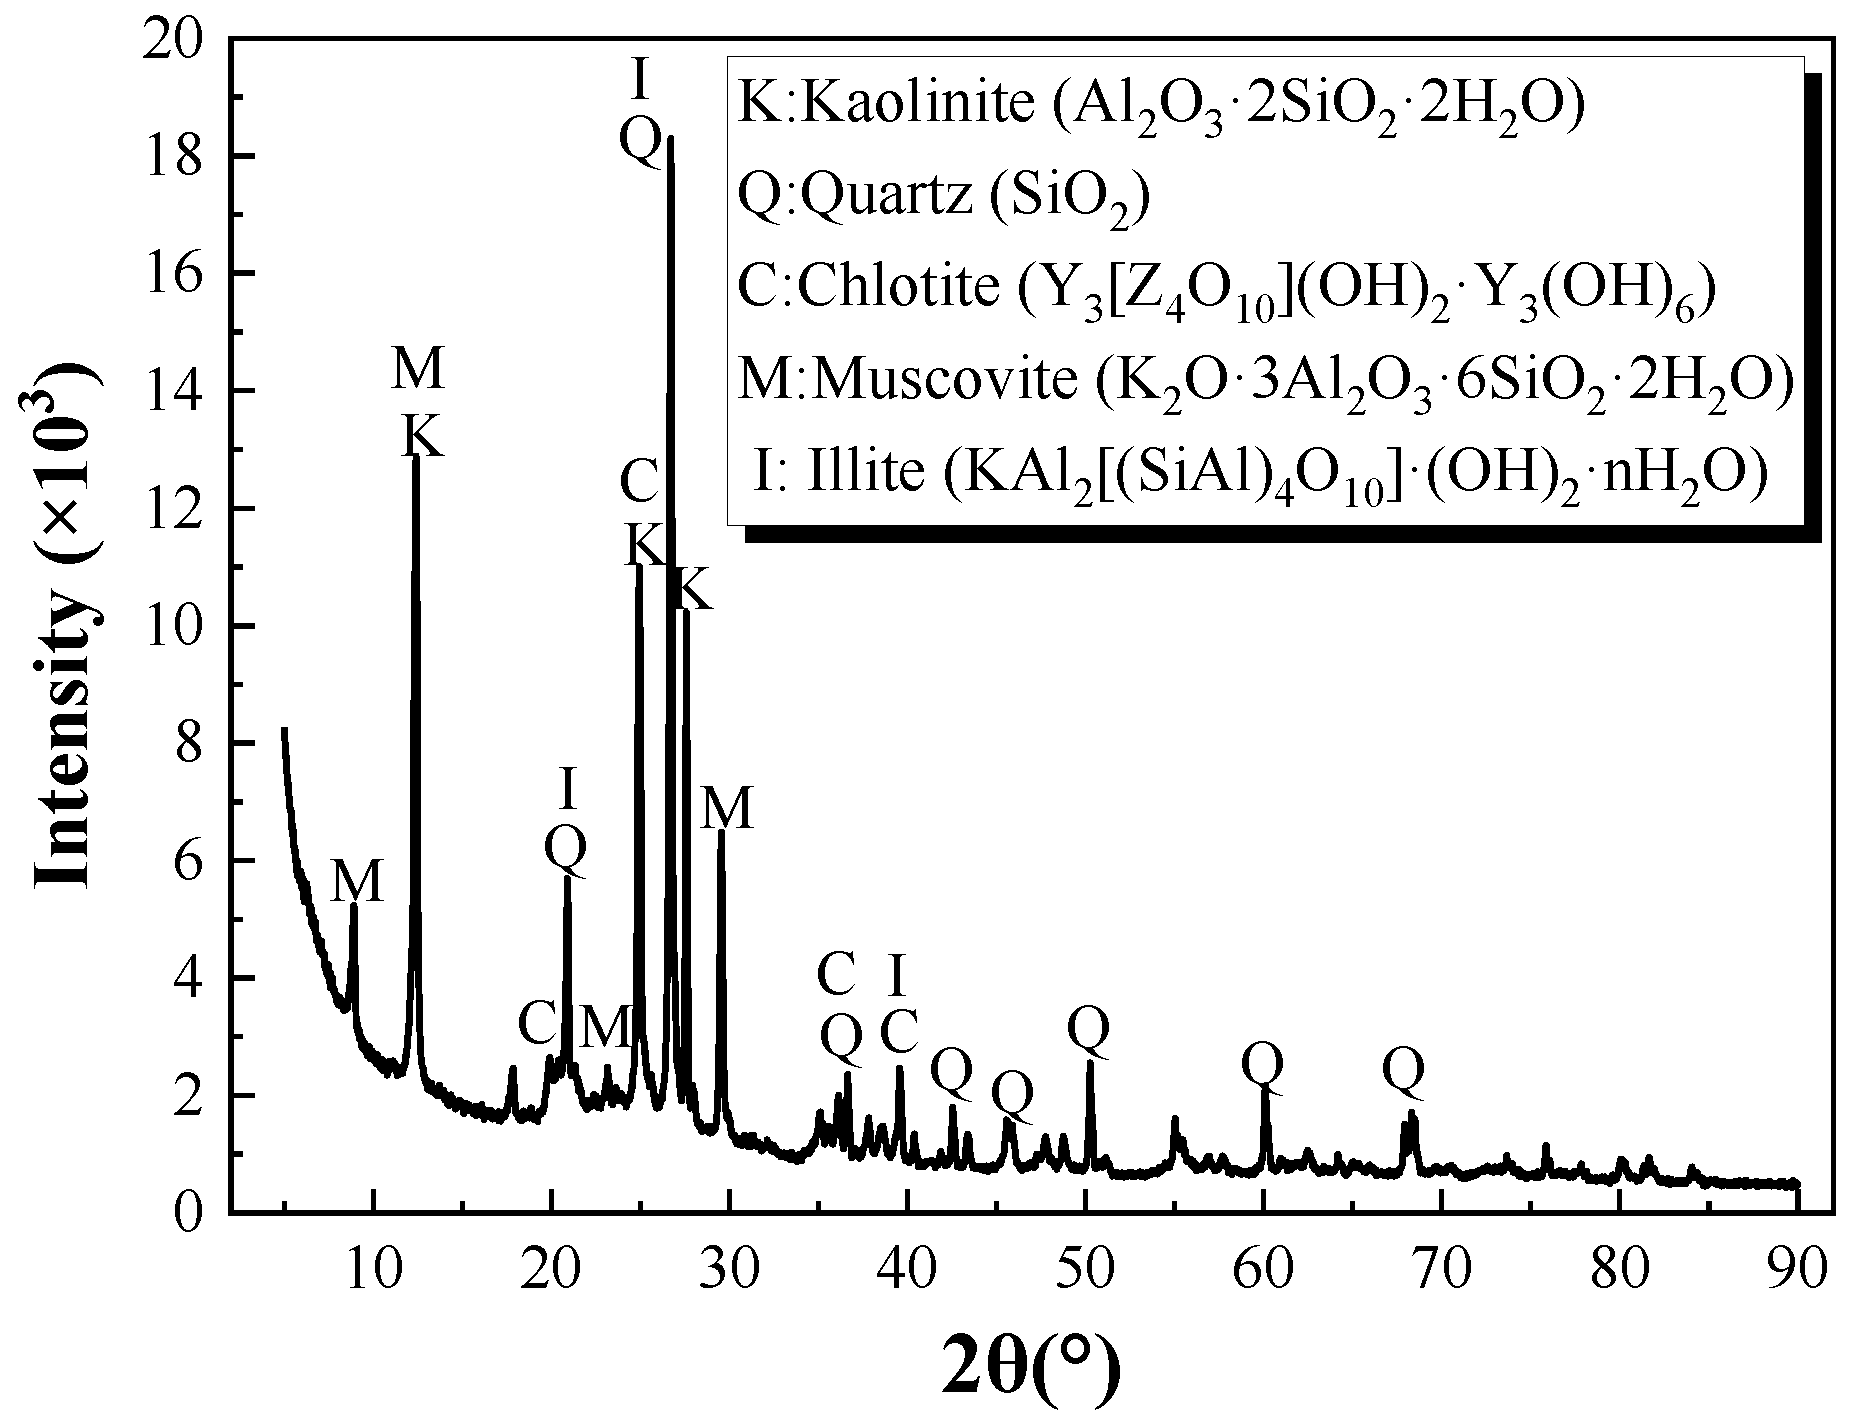
The raw coal gangue samples were mined from the Ordos area of the Inner Mongolia Autonomous Region of China. The mineral composition of the raw coal gangue was detected with an X-ray powder diffractometer (XRD, Rigaku Ultimate IV, Austin, TX, USA), as shown in
Figure 1. The chemical composition of rthe aw coal gangue was determined by an X-ray fluorescence spectrometer (XRF, Thermo fisher 3600, Waltham, MA, USA), as shown in
Table 1.
As shown in
Figure 1, the main mineral compositions of the raw coal gangue were quartz, kaolinite, muscovite, illite, and chlorite. The steep diffraction peaks of kaolinite in
Figure 1 indicate the high content of crystallization of quartz and kaolinite, which also indirectly reflect the negligible pozzolanic reactivity of the raw sample.
Table 1 demonstrates that the raw coal gangue was composed of SiO
2, Al
2O
3, Fe
2O
3, CaO, MgO, K
2O, SO
3, Na
2O, and organic carbon. The chemical content of SiO
2 and Al
2O
3 reached 95%, and the chemical components of the coal gangue were analogous to those of fly ash. Therefore, it may be a potential cementitious material after appropriate treatment for the construction industry. Furthermore, the test sample presented high loss on ignition (LOI), indicating the high organic carbon content and lower amount of reactive components in the Ordos area.
2.1.2. Lime
The lime, whose calcium oxide content was more than 99%, was from Wuxi Yatai United Chemical company in China.
Table 2 illustrates the chemical composition of the lime.
2.1.3. Clay
The clay samples were obtained from the Ordos area of the Inner Mongolia Autonomous Region of China.
Table 3 illustrates the properties of the clay samples. The plasticity index (
IP) was 11.5 (10 <
Ip < 20), indicating the clay was easy to crush and roll [
19,
20].
2.1.4. Sand
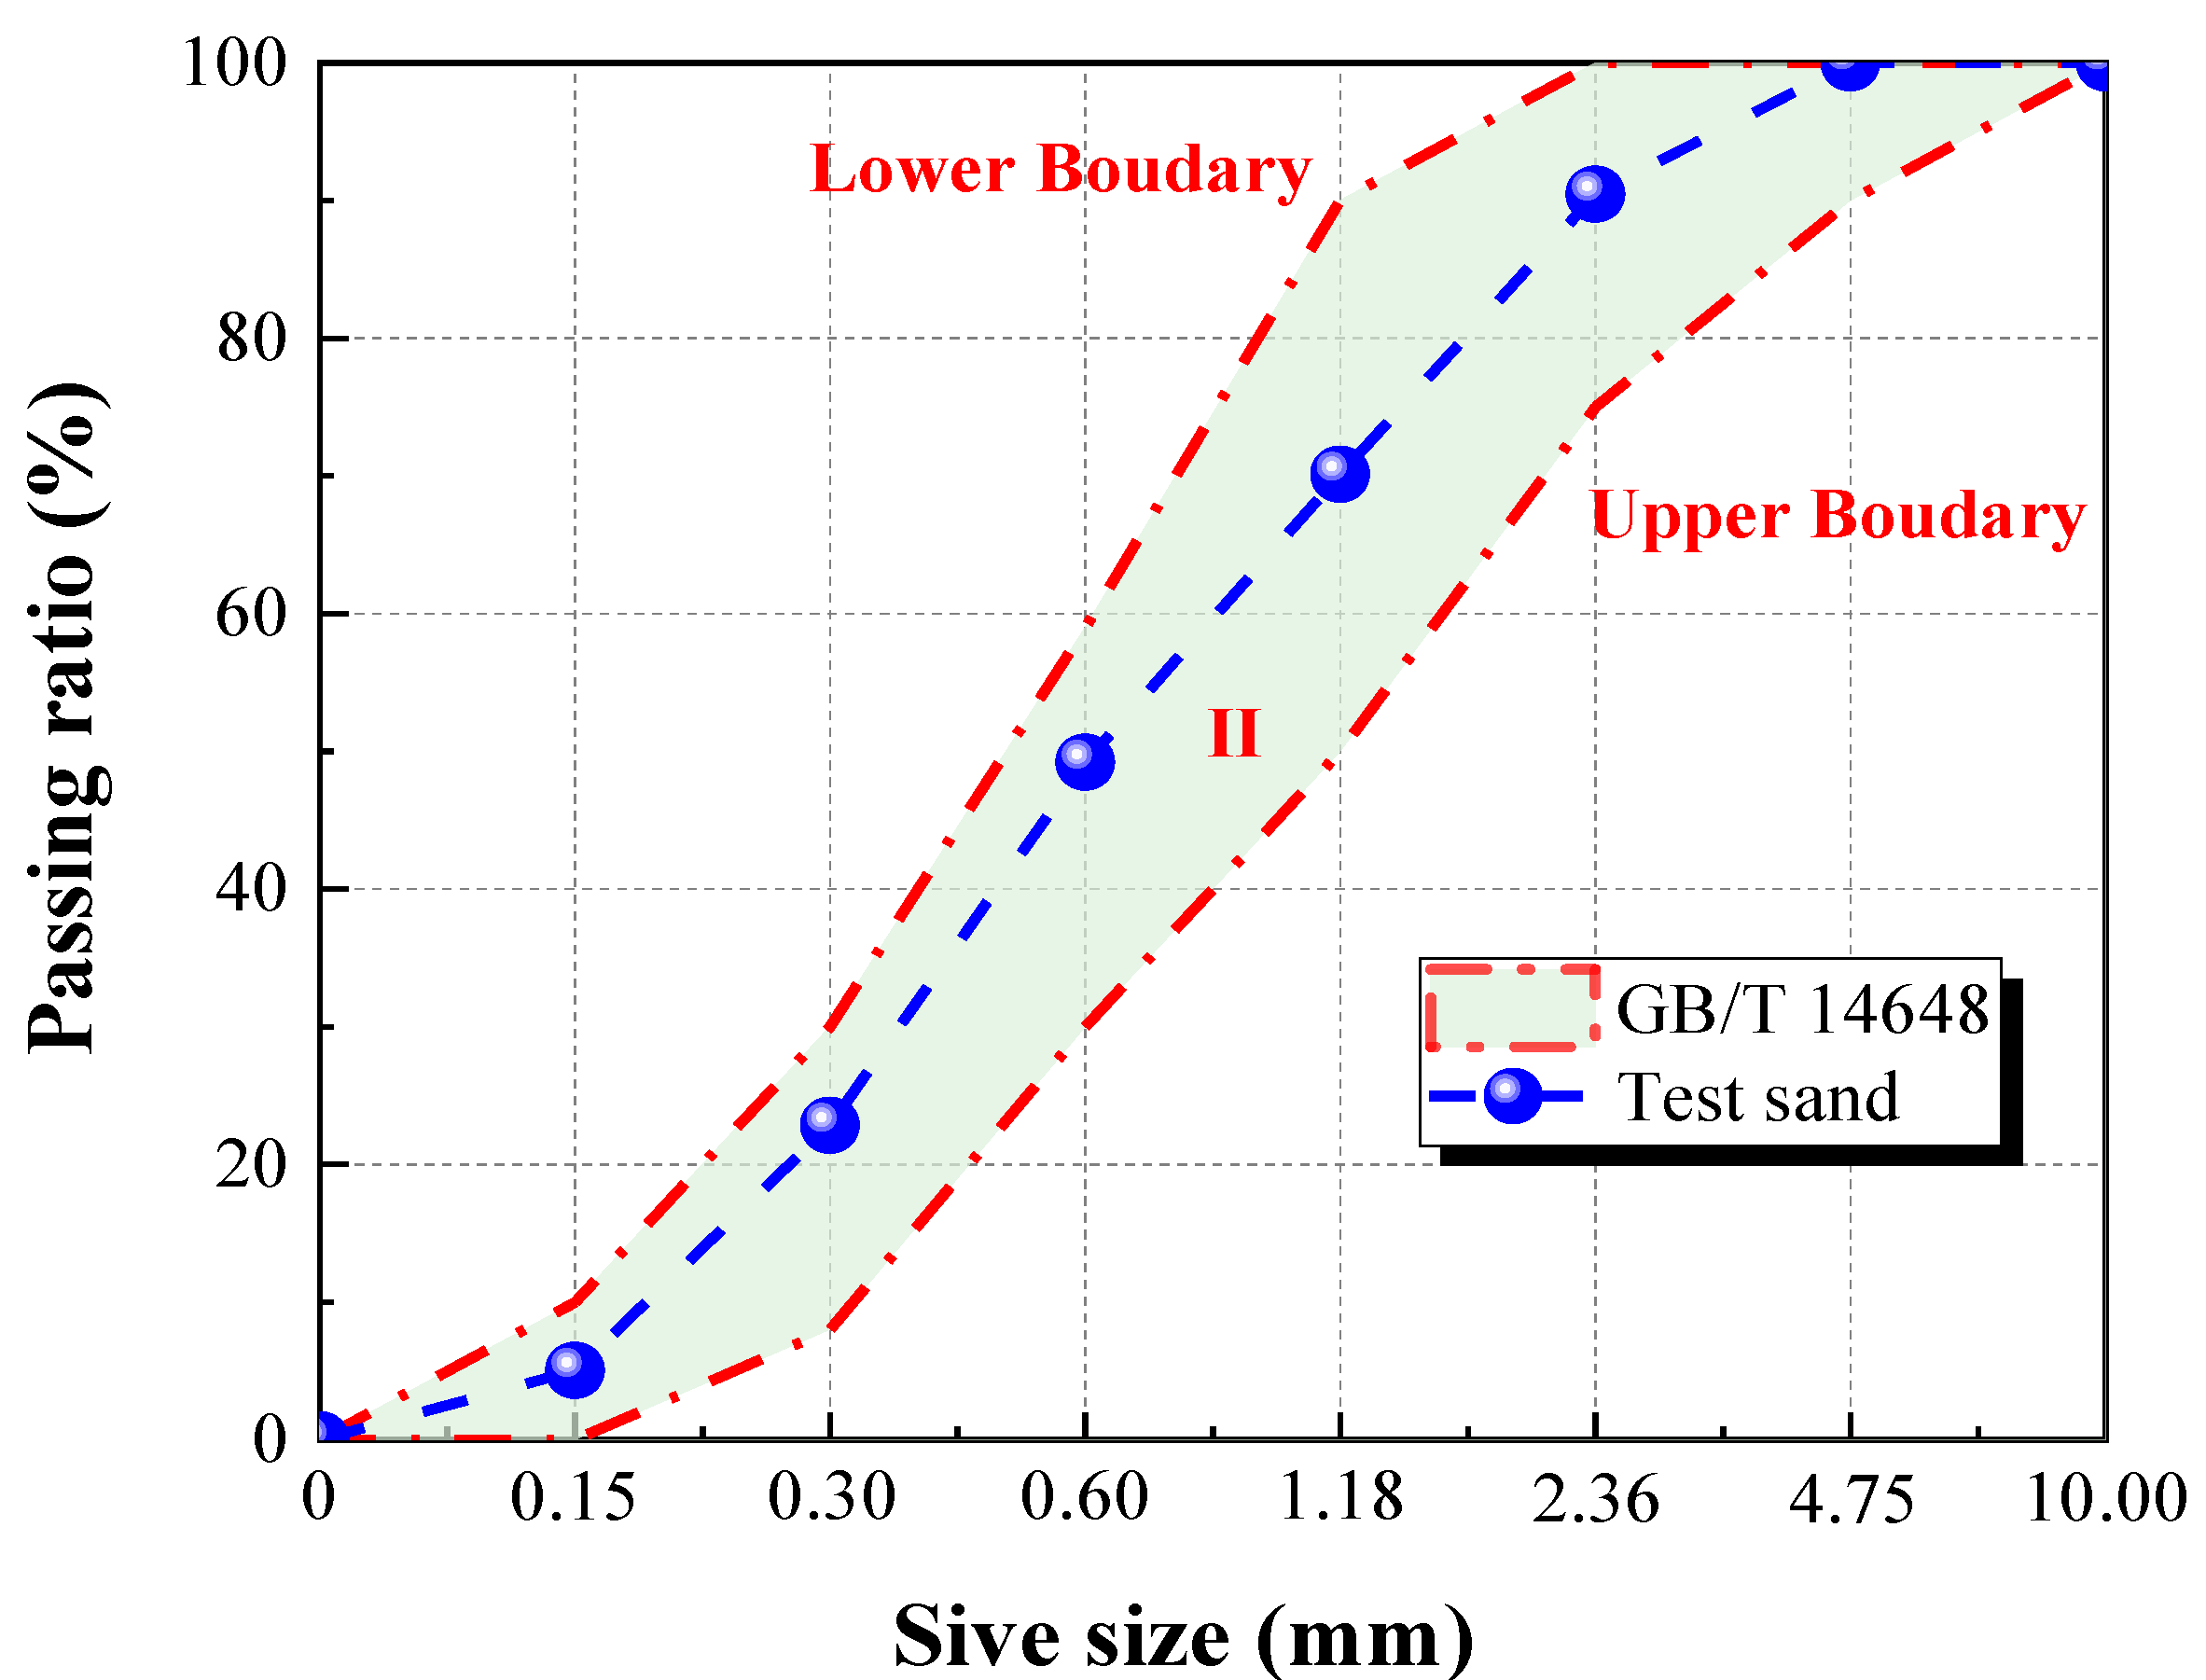
The sand, whose gradation curve is shown in
Figure 2, was also taken from the Ordos area of the Inner Mongolia Autonomous Region of China.
Figure 2 illustrates that the grading curve of the test sand is located between the upper boundary and lower boundary of class II sand [
21]. In addition, the fineness modulus was 2.62, belonging to medium sand (2.3~3.0). Furthermore the apparent density and bulk density of the sand were 2585 kg/m
3 and 1627 kg/m
3, respectively.
2.2. CACG Activation Process
The pozzolanic activity of raw coal gangue is low due to its stable crystal structure and scarce hydraulic substances. However, coal gangue can feature high pozzolanic activity after being appropriately treated. Existing studies show that it is difficult to effectively improve the pozzolanic activity of coal gangue through a single activation method [
22,
23]. Therefore, this paper adopted a composite activation method, combining mechanical activation and thermal activation to improve the activity of coal gangue.
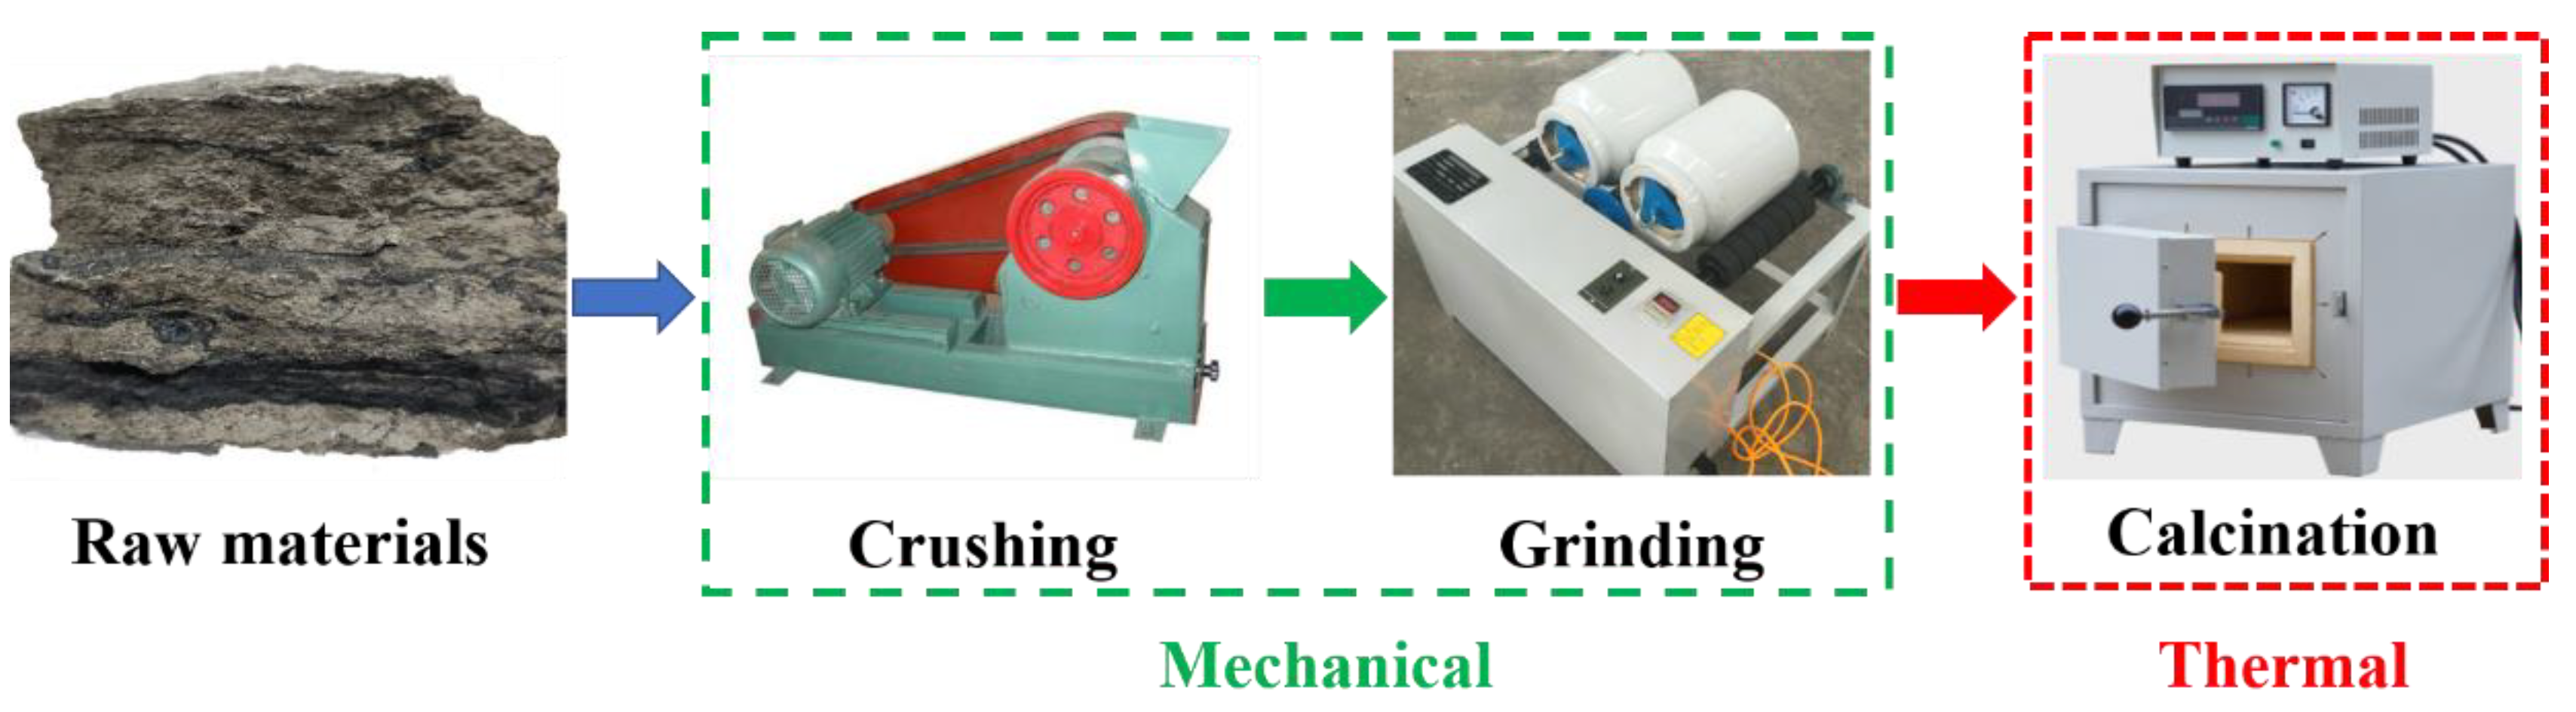
Figure 3 presents a schematic diagram of the composite activation procedure, which can be divided into three stages: crushing, grinding, and calcination.
Firstly, the raw coal gangue samples were crushed with a jaw crusher to ensure the particle sizes were smaller than 4.75 mm. Secondly, the coarse crushed particles were placed into a ball mill and ground until the coal gangue powder passed through a 200 mesh sieve; the residue was less than 8%. Finally, the coal gangue powder was calcined in a muffle furnace at the thermal activation stage according to the designed calcination temperature and holding time.
2.3. Proportion Design
Four groups with different CACG content were designed to investigate the effects of CACG content on the performances of the tabia.
Table 4 shows the mixed proportion of traditional tabia (TT) and modified tabia (MT), in which traditional tabia (TT), modified tabia (MT), composite-activated coal gangue (CACG), and the percentage of CACG replacing clay was 10%. In addition, the mass ratio of lime:clay:CACG:sand = 1:3:0:6 in the TT group.
According to the Chinese code [
24], the specimen sizes of various tests are shown in
Table 5.
In addition, the specimens for the drying shrinkage test were cured in a curing tank at a constant temperature of 20 ± 0.2 °C and a humidity of 60 ± 5%, and the other specimens were cured in a curing tank at a constant temperature of 20 ± 2 °C and a humidity >95%.
2.4. Test Methods
2.4.1. Ca(OH)2 Consumption Method
Previous studies have demonstrated that Ca(OH)
2 consumption can be used to evaluate the pozzolanic activity of coal gangue [
25,
26]. Therefore, the Ca(OH)
2 consumption method was adopted to evaluate the effects of mechanical activation and thermal activation on the pozzolanic activity of coal gangue in this study. Firstly, the CACG powder and calcium oxide were mixed evenly according to 4:1 by mass. Secondly, 20 g of the mixture and 10 g of water were stirred in a closed container in order to prevent a reaction between carbon dioxide in the air and the Ca(OH)
2. Furthermore, the samples were cured in a 20 °C tank for the set age. Next, the samples were stopped hydration, dried at 60 °C, and stored for further experiment. Thirdly, the residual Ca(OH)
2 content in the coal gangue-Ca(OH)
2-H
2O system was determined by using the glycerol-ethanol method [
27]. Finally, the Ca(OH)
2 consumption was calculated; it is presented in Equation (1):
where
is the Ca(OH)
2 consumption,
is the initial content of Ca(OH)
2, and
is the residual content of the Ca(OH)
2 after curing
n days.
2.4.2. Compaction Method
In order to study the compaction characteristics of modified tabia, the compaction method of category A in Chinese code [
24] was adopted to determine the compaction characteristics of four kinds of tabia with different CACG contents. The parameters of the compaction test are shown in
Table 6. Seven moisture contents (11%, 12%, 13%, 14%, 15%, 16%, and 17%) were set for each group. Firstly, all the materials were mixed evenly and sealed for 24 h. Secondly, the mixed materials were divided into five equal parts. The compaction experiment was carried out by using the layered compaction method, the number of hammering layers was set to 5, and the number of blows per layer was 27. Next, the specimens were removed from the mould and weighed, and samples were taken from the inside of the specimens. Finally, the samples were dried at 105 °C and the dry density of the specimens was calculated, as shown in Equation (2):
where
is the dry density of the specimens,
is the total mass of the test cylinder and specimens,
is the mass of the test cylinder,
is the volume of the tested cylinder, and
is the moisture content of specimens.
2.4.3. Seepage Test
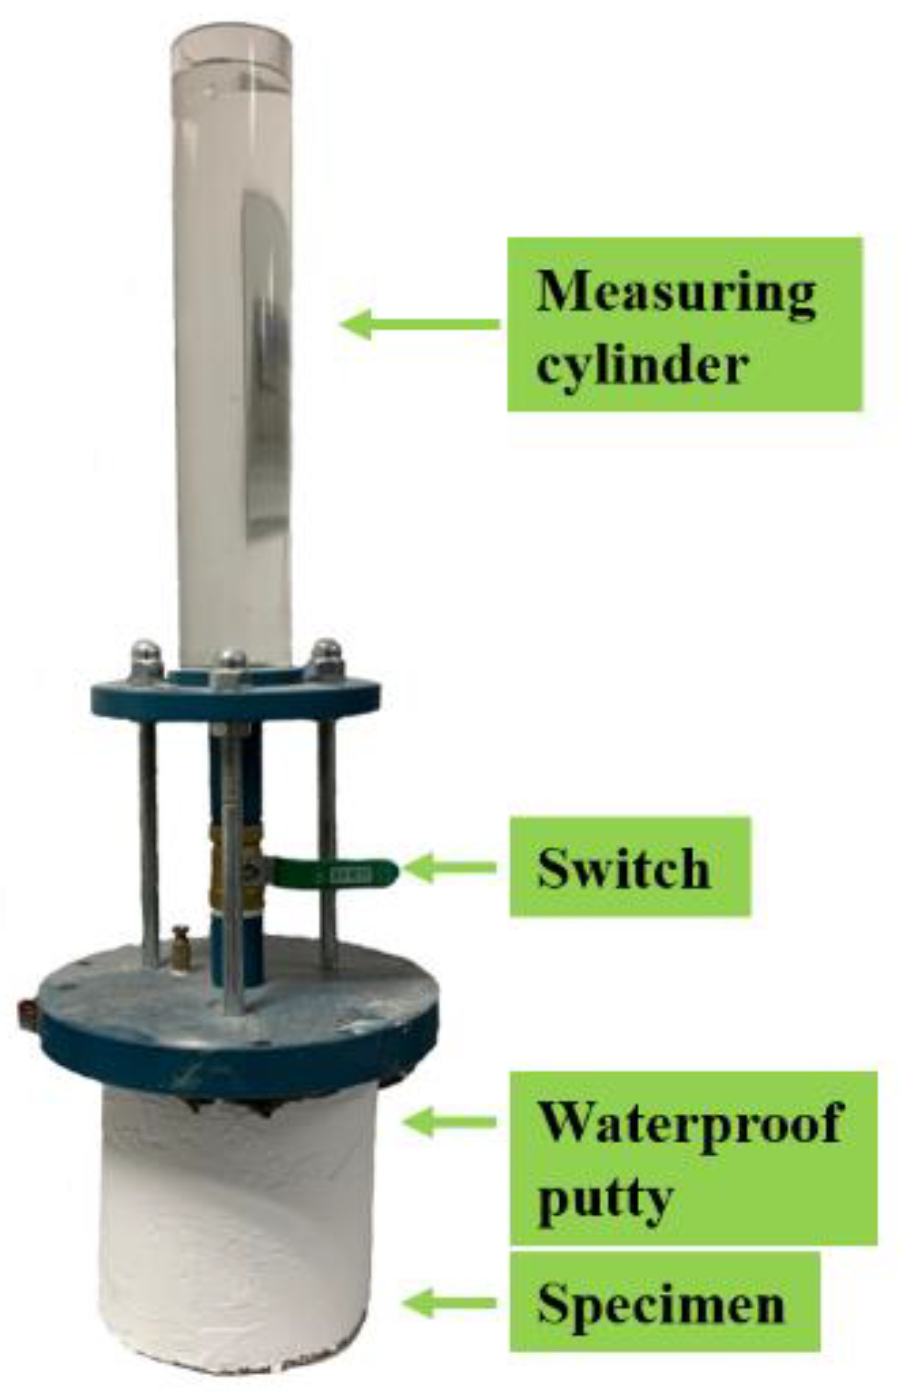
The cumulative seepage and permeability coefficient was determined by referring to the Chinese code [
24]; the test installation is shown in
Figure 4. Firstly, a layer of waterproof putty was brushed on the side of the specimens, and a circle of putty was daubed on the top edge of specimens, which prevented water seepage on the side and connection during the test process. Secondly, a total of 600 mL water was injected into the measuring cylinder, and the switch was opened quickly. When the water level dropped to 100 mL, the time was recorded. The water level was recorded every 60s until it dropped to 500 mL. Finally, the permeability coefficient was calculated; it is presented in Equation (3):
where
is the permeability coefficient (mL/s);
is the amount of water volume at the first recording (mL), usually 100 mL;
is the water volume at the second recording (mL);
is the time of the first recording (s); and
is the time of the second recording (s).
3. Pozzolanic Activity of CGCA
In general, several factors potentially influence the activation of coal gangue, such as particle size, calcination temperature, annealing rate, holding time, and additives. Previous researchers demonstrated that the most significant factors were particle size, calcination temperature and holding time [
7,
28]. Therefore, the effects of calcination temperature (600 °C, 700 °C, 800 °C, and 900 °C), holding time (1 h, 2 h, 3 h, and 4 h), and particle size (60 mesh, 100 mesh, and 200 mesh) on the pozzolanic activity of coal gangue were investigated, respectively. In addition, the phase transformation and microstructure were identified by XRD and ESEM, respectively. Finally, the Ca(OH)
2 consumption method was employed to evaluate the pozzolanic activity of CACG.
3.1. Phase Transformation
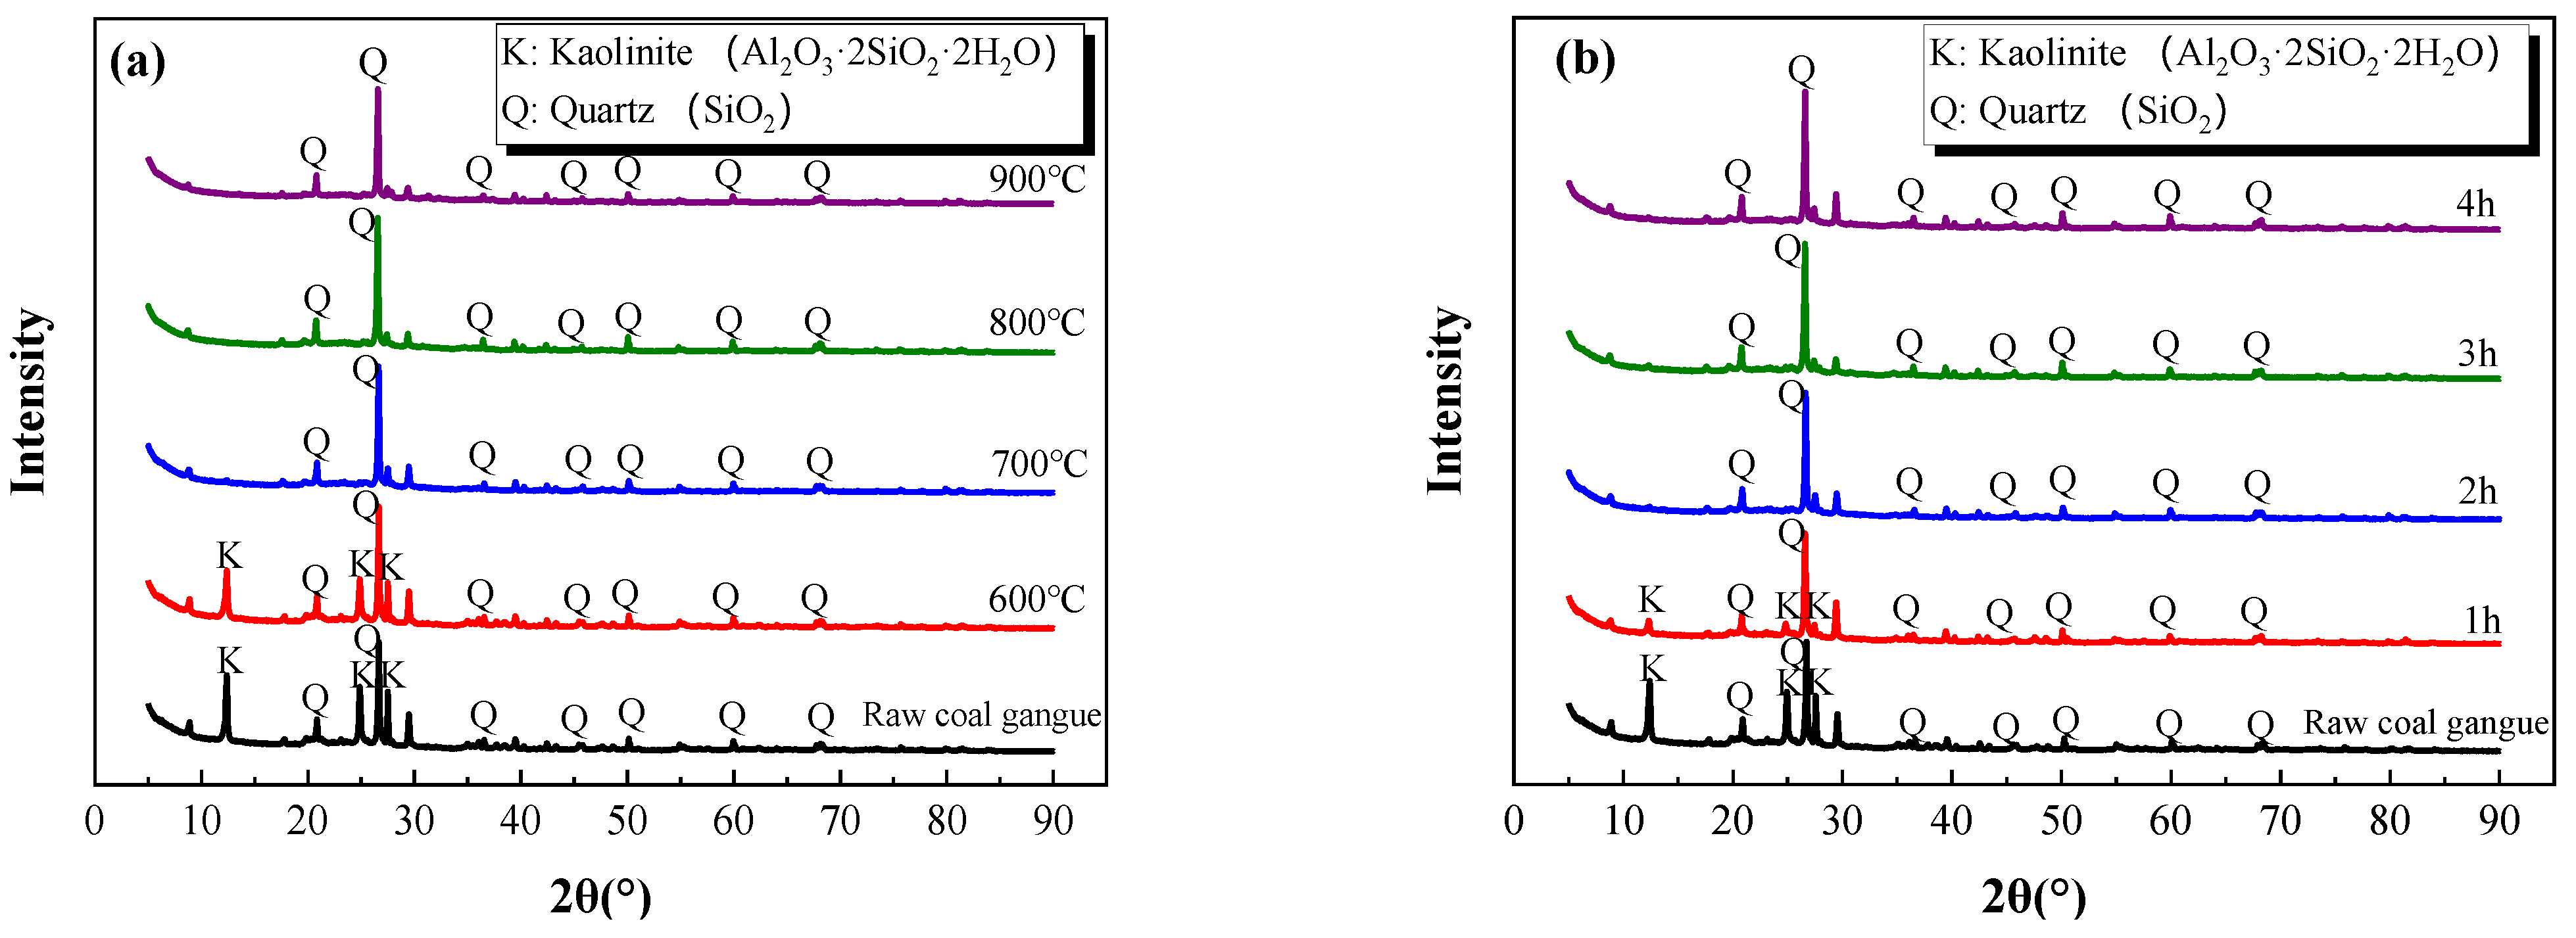
Figure 5 illustrates the XRD patterns of the samples at different calcination temperatures and holding times.
As can be seen from
Figure 5a, the diffraction peaks of kaolinite at 2
θ = 12–14° and 24–26° almost disappeared when the calcination temperature exceeded 700 °C. Moreover, the diffraction peaks of the kaolinite dramatically descended after one hour of calcination and almost disappeared after two hours (
Figure 5b). This was because kaolinite decomposes into amorphous silicon dioxide (SiO
2) and aluminum oxide (Al
2O
3) at 500–700 °C [
7,
29]. Moreover, the decomposed amorphous phases of kaolinite were undetectable by XRD due to the non-crystal characteristics.
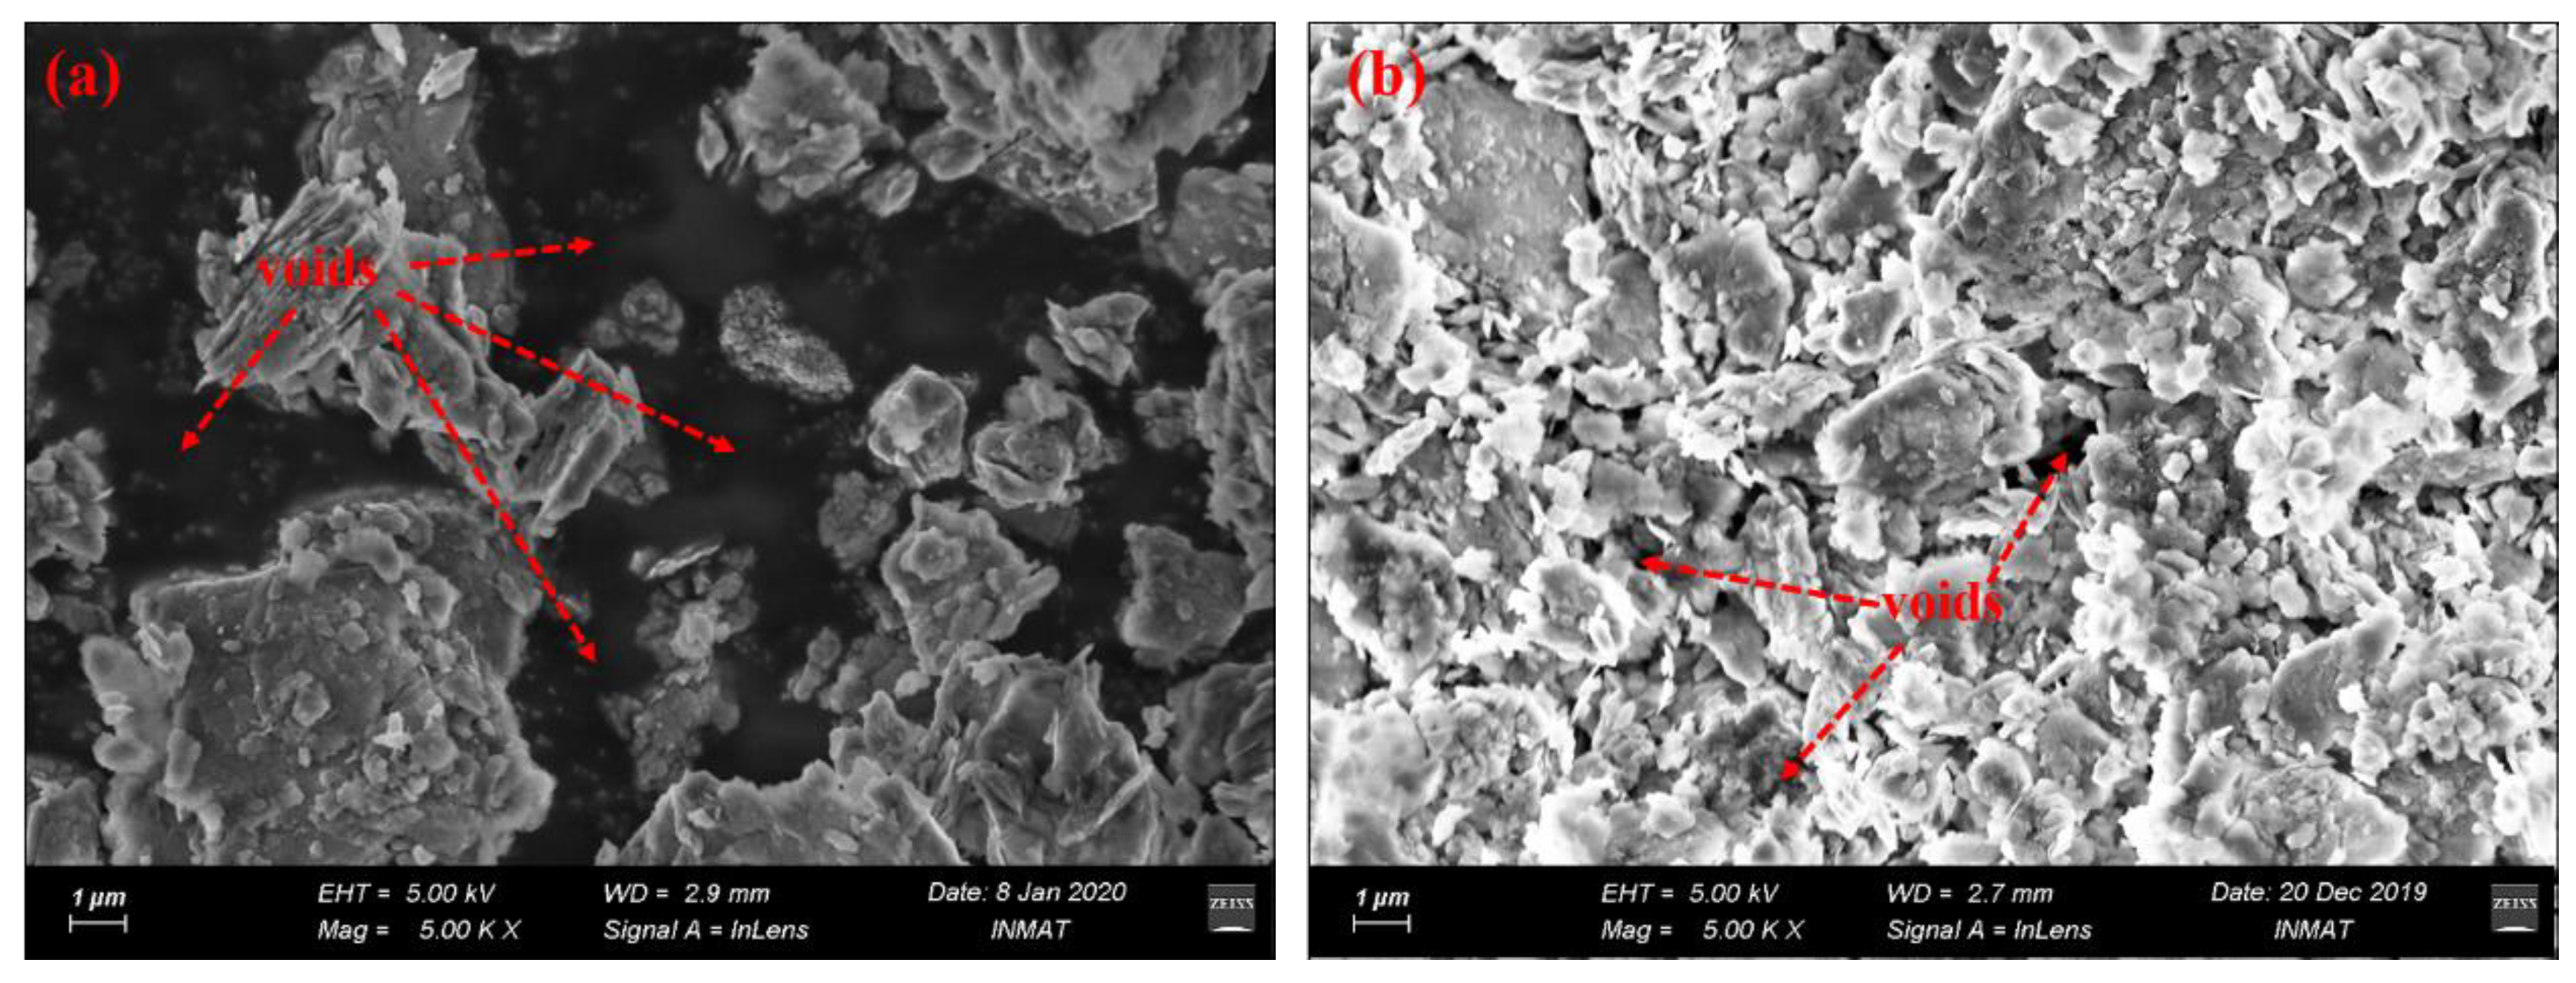
3.2. Microstructure
An environment-scanning electron microscope (ESEM) was used to observe the microstructure of the raw coal gangue and coal gangue calcined at 700 °C for two hours, as shown in
Figure 6.
As shown in
Figure 6, the ESEM images demonstrate that the raw coal gangue exhibited an apparently loose structure with remarkable voids between the dispersed particles. By stark contrast, the coal gangue was transformed by thermal treatment into layered, flaky, tightly connected structures, with fewer voids, as shown in
Figure 6b. This was because, in certain conditions, calcination reactions can result in the micro-expansion and volatilization of organic carbon. Meanwhile, the reacted amorphous productions possessed porous structures, with more soluble substances (such as SiO
2 and Al
2O
3) and higher internal energy compared to the original crystallized structure.
3.3. Activity Evaluation
3.3.1. Mechanical Activation
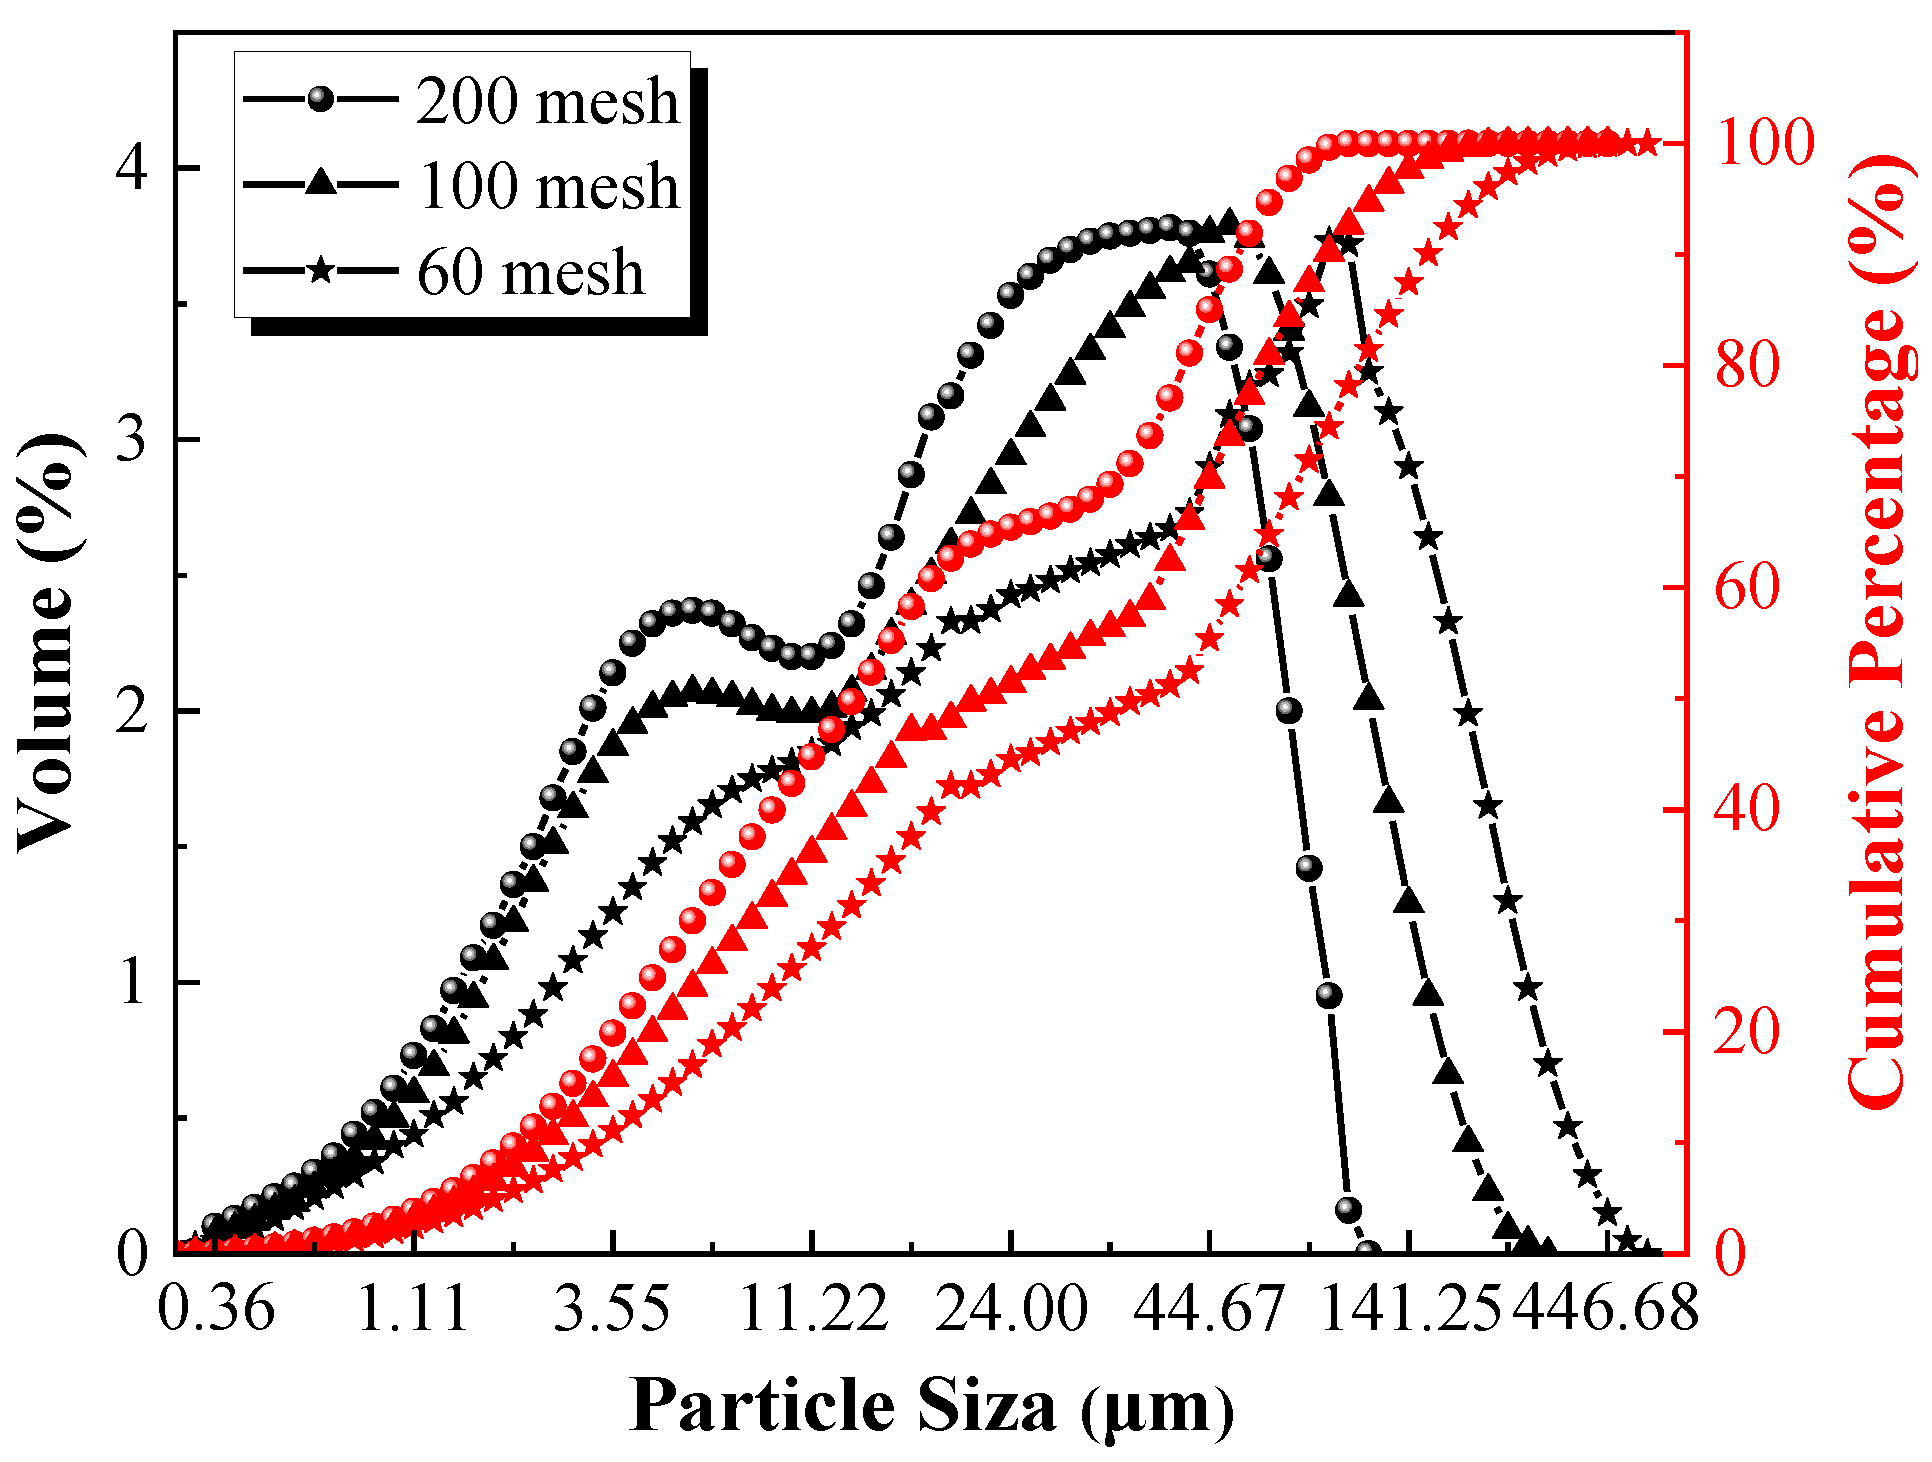
According to the above results, the CACG samples treated under the optimum calcination temperature (700 °C) and holding time (2 h) were selected for further investigation. The particle size distribution of the CACG at different levels of particle fineness was measured by a laser particle size analyzer, as shown in
Figure 7 and
Table 7, respectively.
Figure 7 and
Table 7 illustrate that the span, uniformity, D
10, and D
50 decreased with the increase in the particle fineness. However, the specific surface area displayed a noticeably contrasting trend. In addition, with the increase in the particle fineness of the CACG, the particle size distribution curve and cumulative percentage curve shifted to the left.
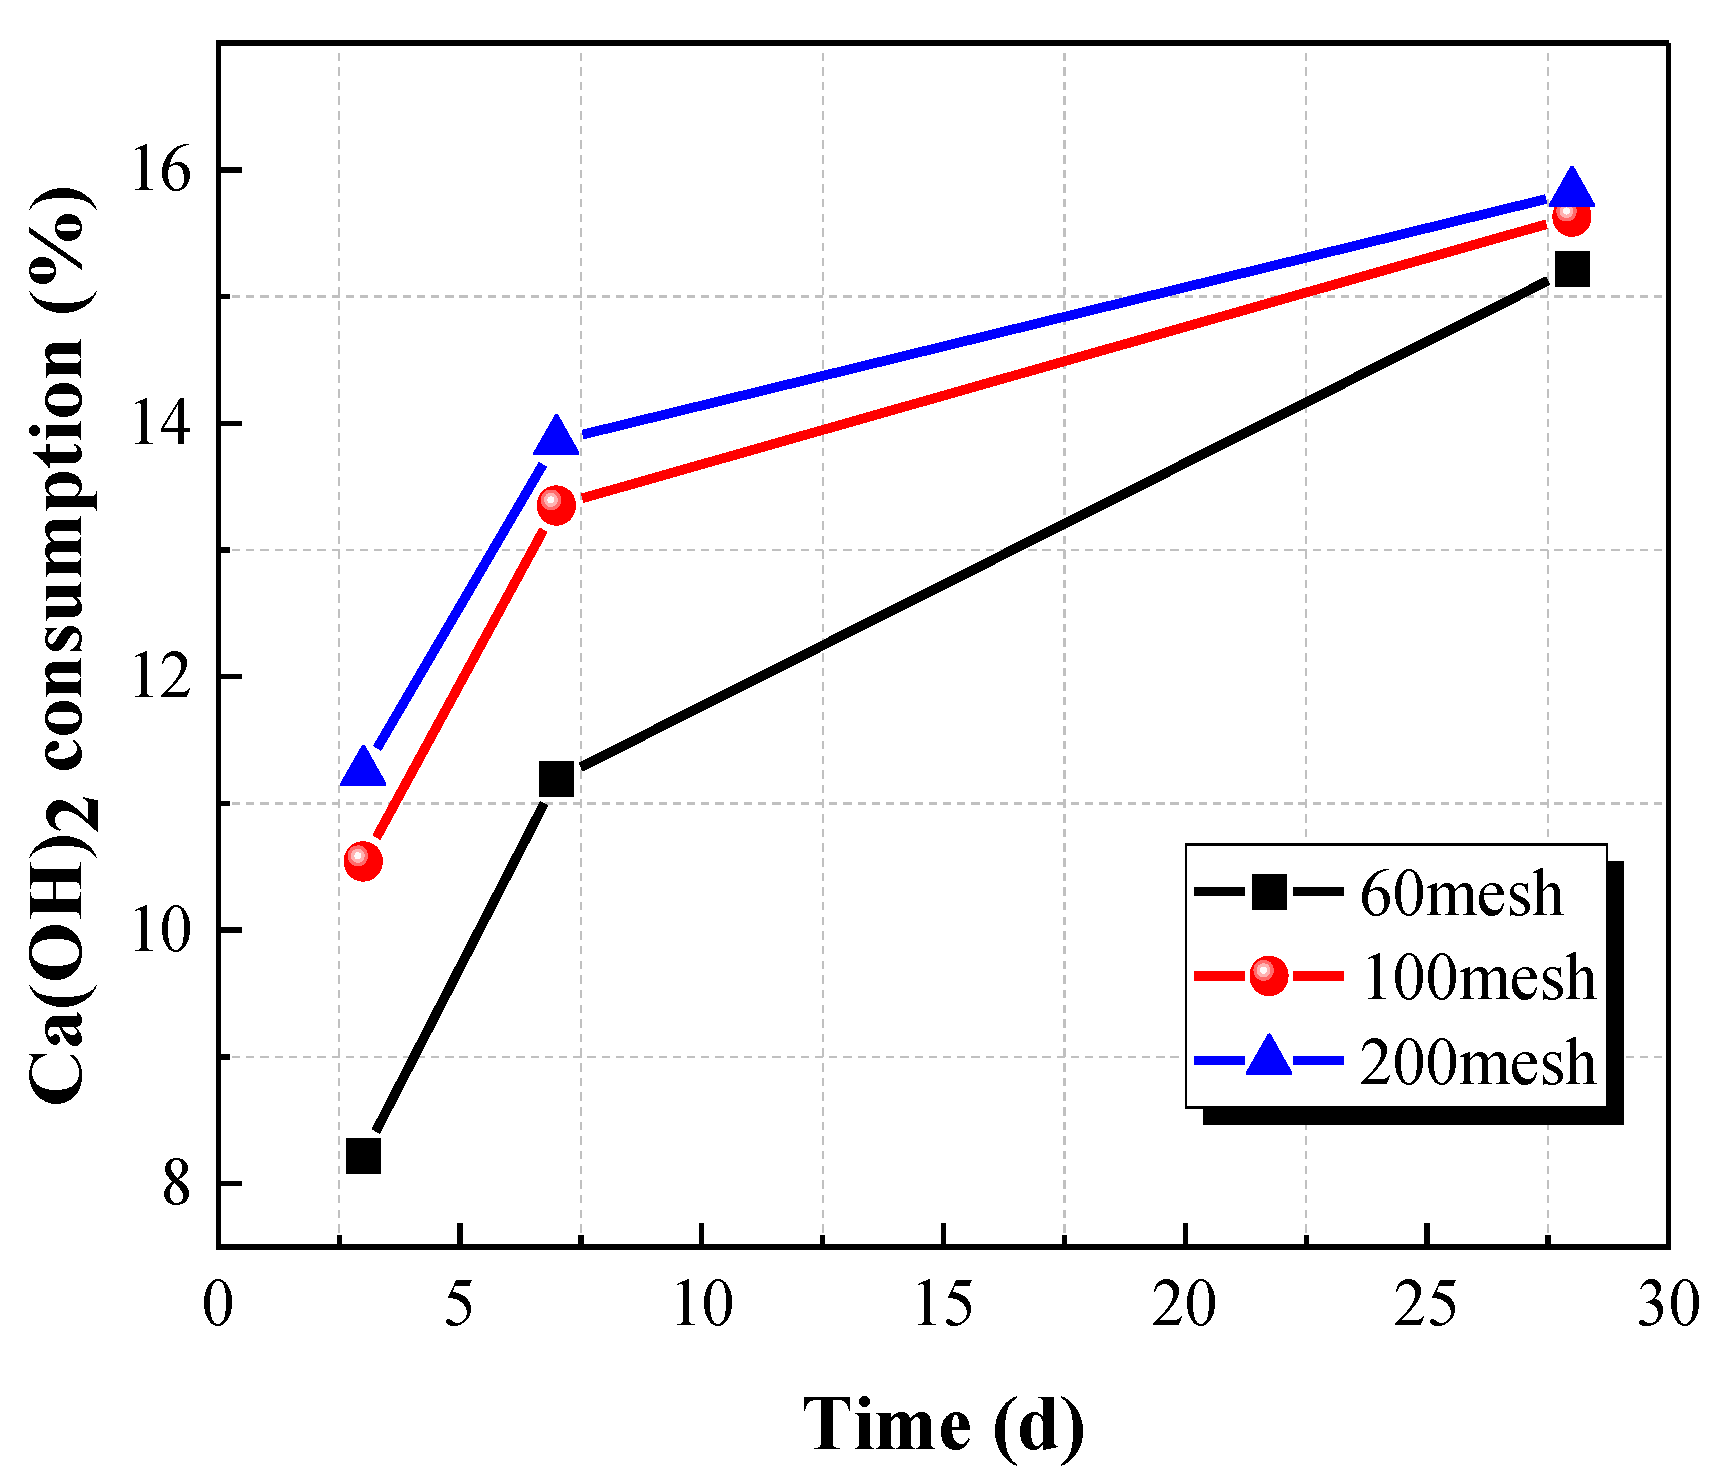
The influence of particle fineness (mechanical activation) on Ca(OH)
2 consumption at different curing times is shown in
Figure 8.
Figure 8 demonstrates that the Ca(OH)
2 consumption increased with the increase in the particle fineness, indicating Ca(OH)
2 consumption can reflect the change in pozzolanic reaction activity caused by different levels of fineness. The particle fineness of CACG powder exerted considerable effects on the early-stage reaction rate (<7d) and the Ca(OH)
2 consumption. However, the developments in later reactions were relatively insensitive to the particle sizes when the fineness exceeded 100 mesh. It is evident that the increase in particle fineness led to a larger contact surface for Ca(OH)
2 and CACG particles, which accelerated the early reaction rate.
3.3.2. Thermal Activation
The Ca(OH)
2 consumption at different calcination temperatures and holding times is shown in
Figure 9.
Figure 9 indicates that the Ca(OH)
2 consumption increased with the increase in the calcination temperatures and holding times, indicating that thermal activation can significantly improve the reactivity of raw coal gangue. However, Ca(OH)
2 consumption is stable when the calcination temperature exceeds 700 °C and the holding time exceeds two hours. The results are consistent with
Figure 5. Although further increasing the calcination temperatures and holding times may increase Ca(OH)
2 consumption, it is also not recommended because of the excessive energy costs. Therefore, the optimum calcination temperature and holding time are 700 °C and two hours, respectively.
4. Mechanical Properties
4.1. Compaction Characteristics
The relationship between dry density and moisture content, maximum dry density, and optimum moisture content for different CACG contents is shown in
Figure 10.
Figure 10a illustrates that the dry density increases first and then decreases with the increase in moisture content. Moreover, the dry density and the content of CACG exhibit a positive correlation, which indicates that the CACG could increase the dry density of the tabia. As shown in
Figure 10b,c, the maximum dry density and the optimum moisture content increased with the increase in the CACG content. It is worth noting that the maximum dry density was more sensitive than the optimum moisture content at low CACG contents. However, the difference between them progressively narrowed with the increase in CACG content.
4.2. Unconfined Compressive Strength
The unconfined compressive strength and relative strength of the specimens at different curing times are shown in
Figure 11.
Figure 11 demonstrates that the unconfined compressive strength and content of CACG exhibited a positive correlation. The unconfined compressive strength of MTS-50 cured for 28 days reached up to 8.86 MPa, which is 5.03 times, 2.92 times, and 1.46 times that of TS, MTS-10, and MTS-30, respectively. The relative strength presented similar trends regardless of the CACG content during the curing times, as shown in
Figure 11b. Moreover, the unconfined compressive strength increased as the curing time increased. This was because the active substances of clay and coal gangue reacted with Ca(OH)
2 to produce calcium silicate and calcium aluminate, which improved the unconfined compressive strength and compactness of specimens. Therefore, the CACG significantly improved the unconfined compressive strength of the specimens.
4.3. Splitting Strength
The splitting strength at different curing times and the relative ratio of the splitting strength to unconfined compressive strength after curing for 28 days are shown in
Figure 12.
Figure 12 indicates that the splitting strength and the CACG content were positively correlated. The splitting strength of MTS-50 cured for 28 days reached up to 0.68 MPa, which was 9.71 times, 3.23 times, and 1.67 times that of TS, MTS-10, and MTS-30, respectively. Moreover, the splitting strength increased with the increase in curing time. Because the reaction between coal gangue and Ca(OH)
2 produces hydrated calcium silicate and hydrated calcium aluminate, its bonding performance and strength are higher than calcium carbonate, which leads to greater compactness and mechanical properties. Therefore, CACG can improve the splitting strength of specimens. As shown in
Figure 12b, the relative ratio positively correlated with the CACG content.
4.4. Flexural Tensile Strength
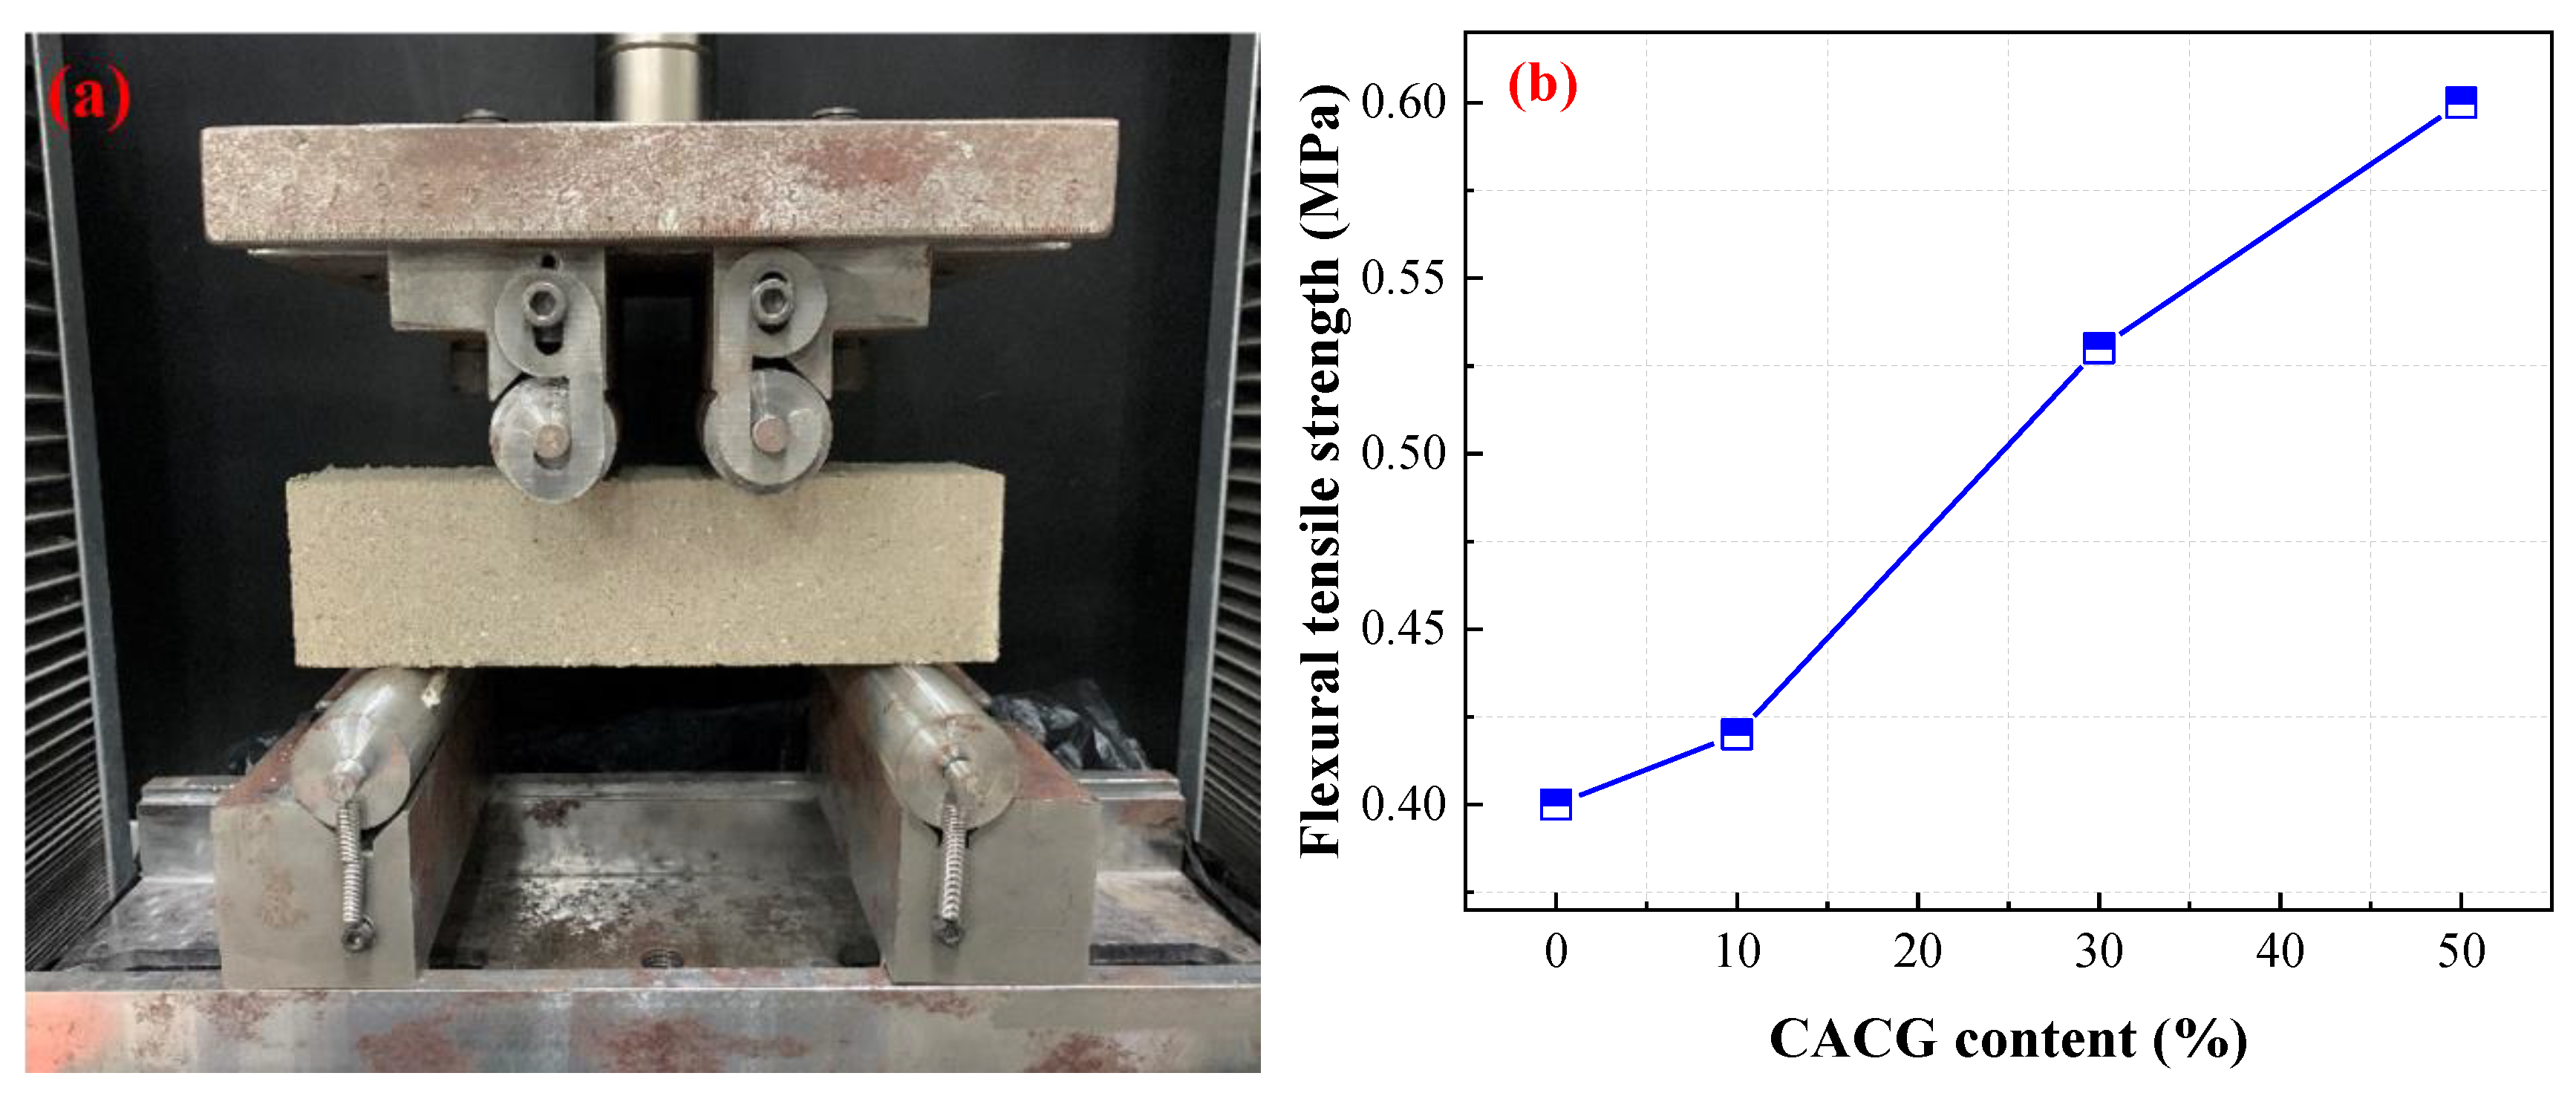
A four-point bending method was employed to investigate the flexural tensile strength of the specimens with a loading rate of 50 mm/min.
Figure 13 shows the test device and the flexural tensile strength of the specimens with different CACG contents.
Figure 13 illustrates that the flexural tensile strength increases with the increase in CACG content. The flexural tensile strength of MTS-50 cured for 28 days reached up to 0.60 MPa, which was 1.5 times, 1.43 times, and 1.13 times that of TS, MTS-10, and MTS-30, respectively. Therefore, CACG improved the flexural tensile strength of the specimens.
4.5. Impermeability
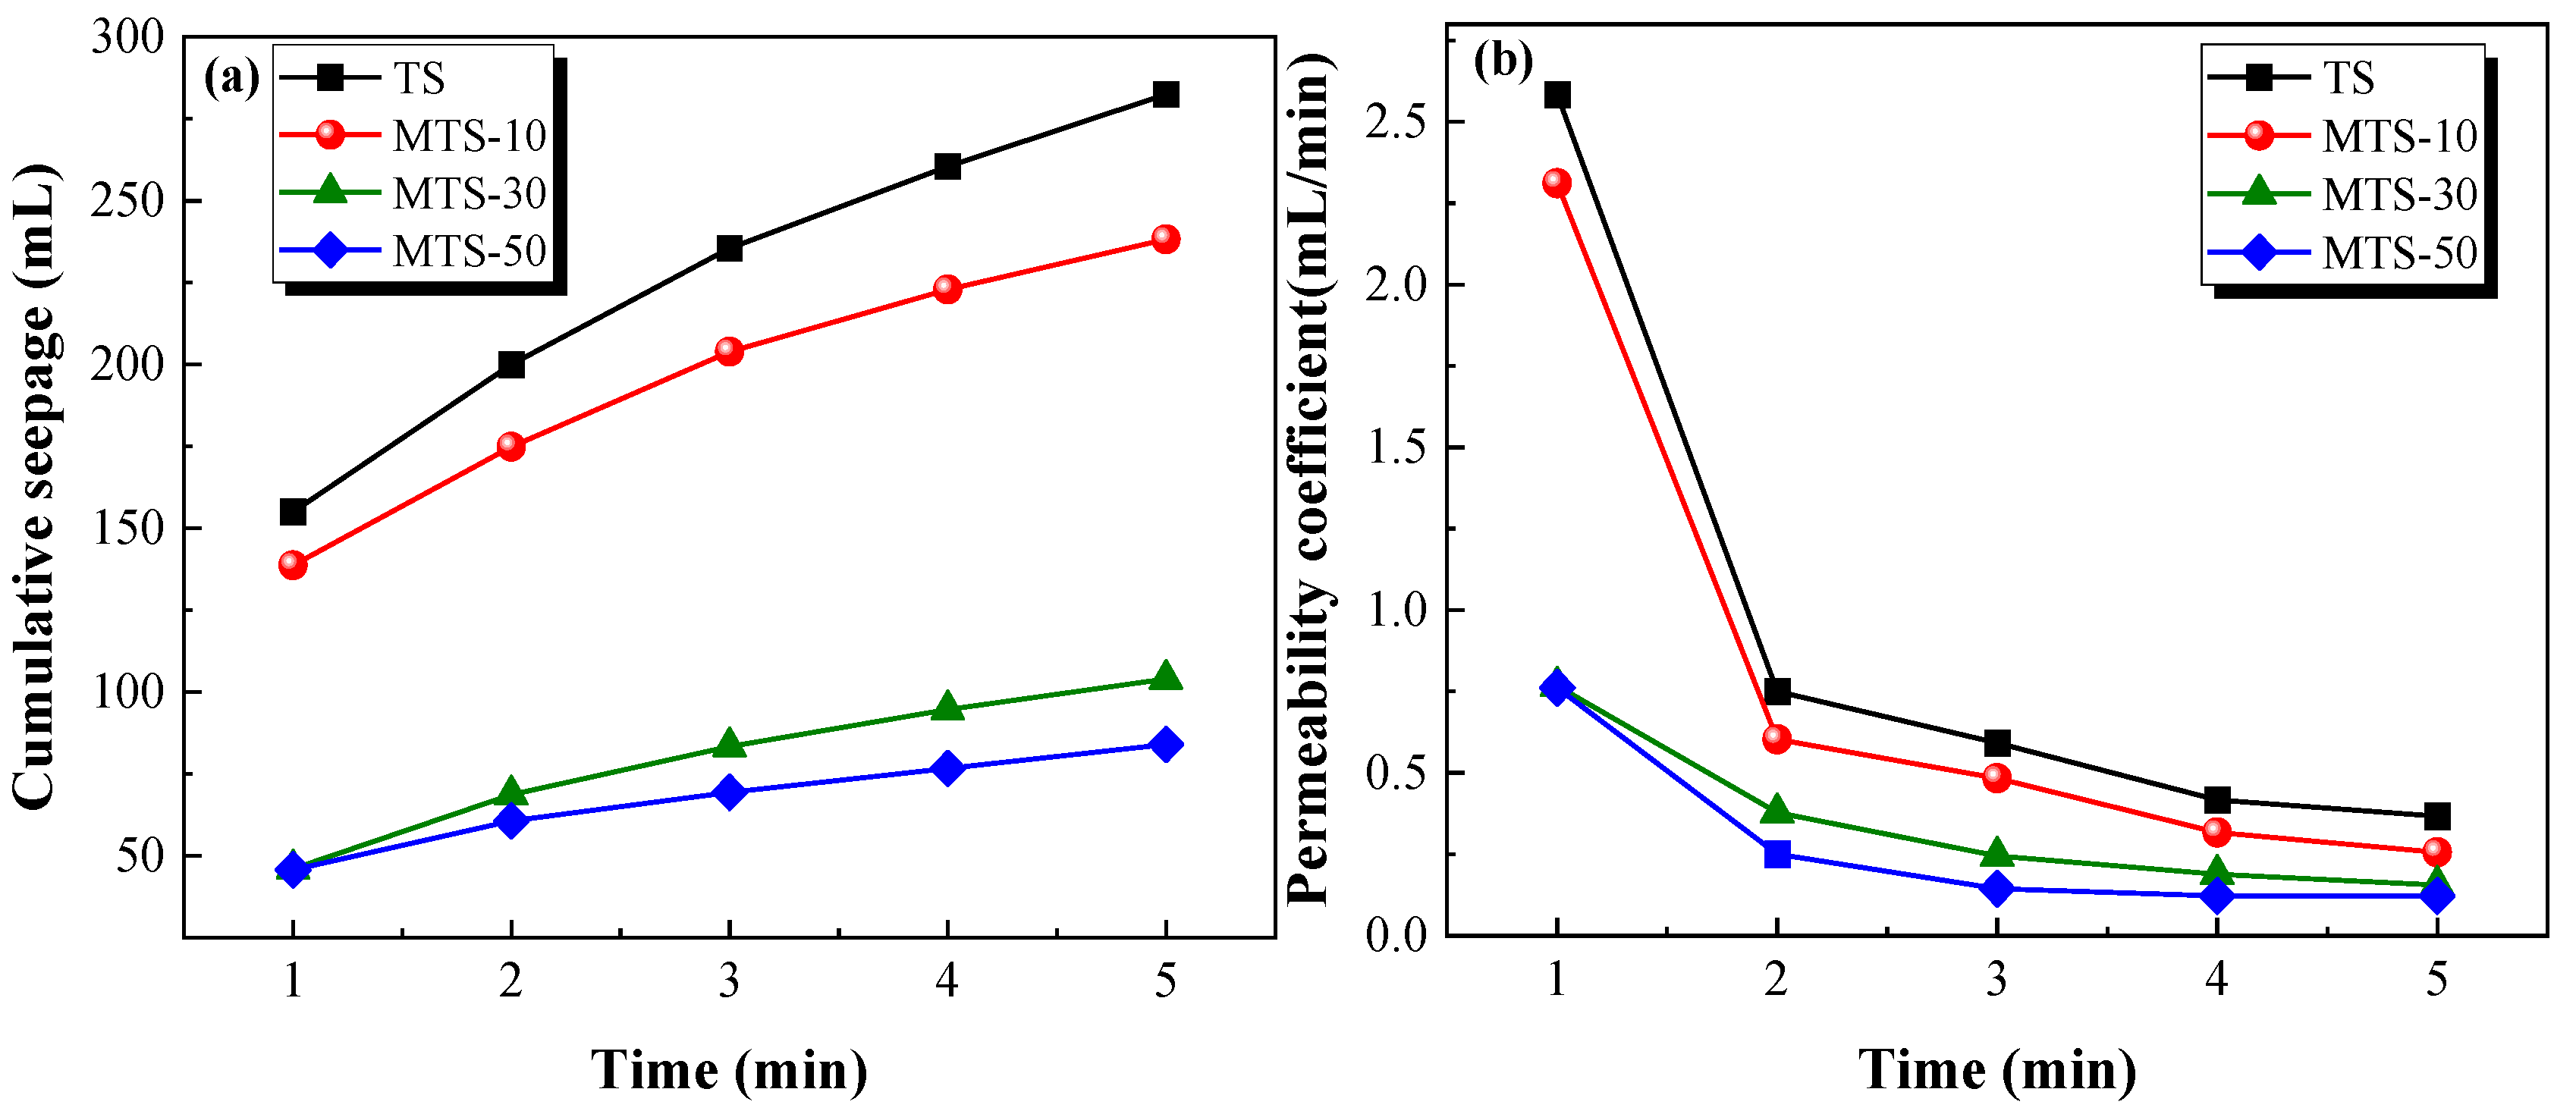
The cumulative seepage and permeability coefficient of specimens at different curing times are shown in
Figure 14.
Figure 14 indicates that the cumulative seepage decreased with the increase in CACG content. Moreover, the cumulative seepage and the test time exhibited a positive correlation. By contrast, the permeability coefficient displayed a noticeable contrasting trend, as shown in
Figure 14b. It should be mentioned that the cumulative seepage and permeability coefficient decreased dramatically when the CACG content was 30%. However, the cumulative seepage and permeability coefficient slowly decreased when the CACG content exceeded 30%. This also demonstrates that appropriate CACG contents significantly improved the seepage resistance of the specimens.
4.6. Freeze-Thaw Resistance
In order to investigate the effect of CACG content on the freezing-thawing resistance of tabia, 24 standard specimens were prepared, among which 12 were for the freezing–thawing cycle environment, and 12 were contrast specimens. A total of 40 freeze–thaw cycles were performed in the experiment, in which the freezing temperature was −18 °C, the freezing duration was 16 h, the melting temperature was set to 20 °C, and the melting time was 8 h [
24]. The rate of temperature change was set to 0.5 °C/min as referred to Chinese code (GBT50082-2009) [
30]. The surface change and mass of the specimens were checked every five freeze–thaw cycles until the end of the test.
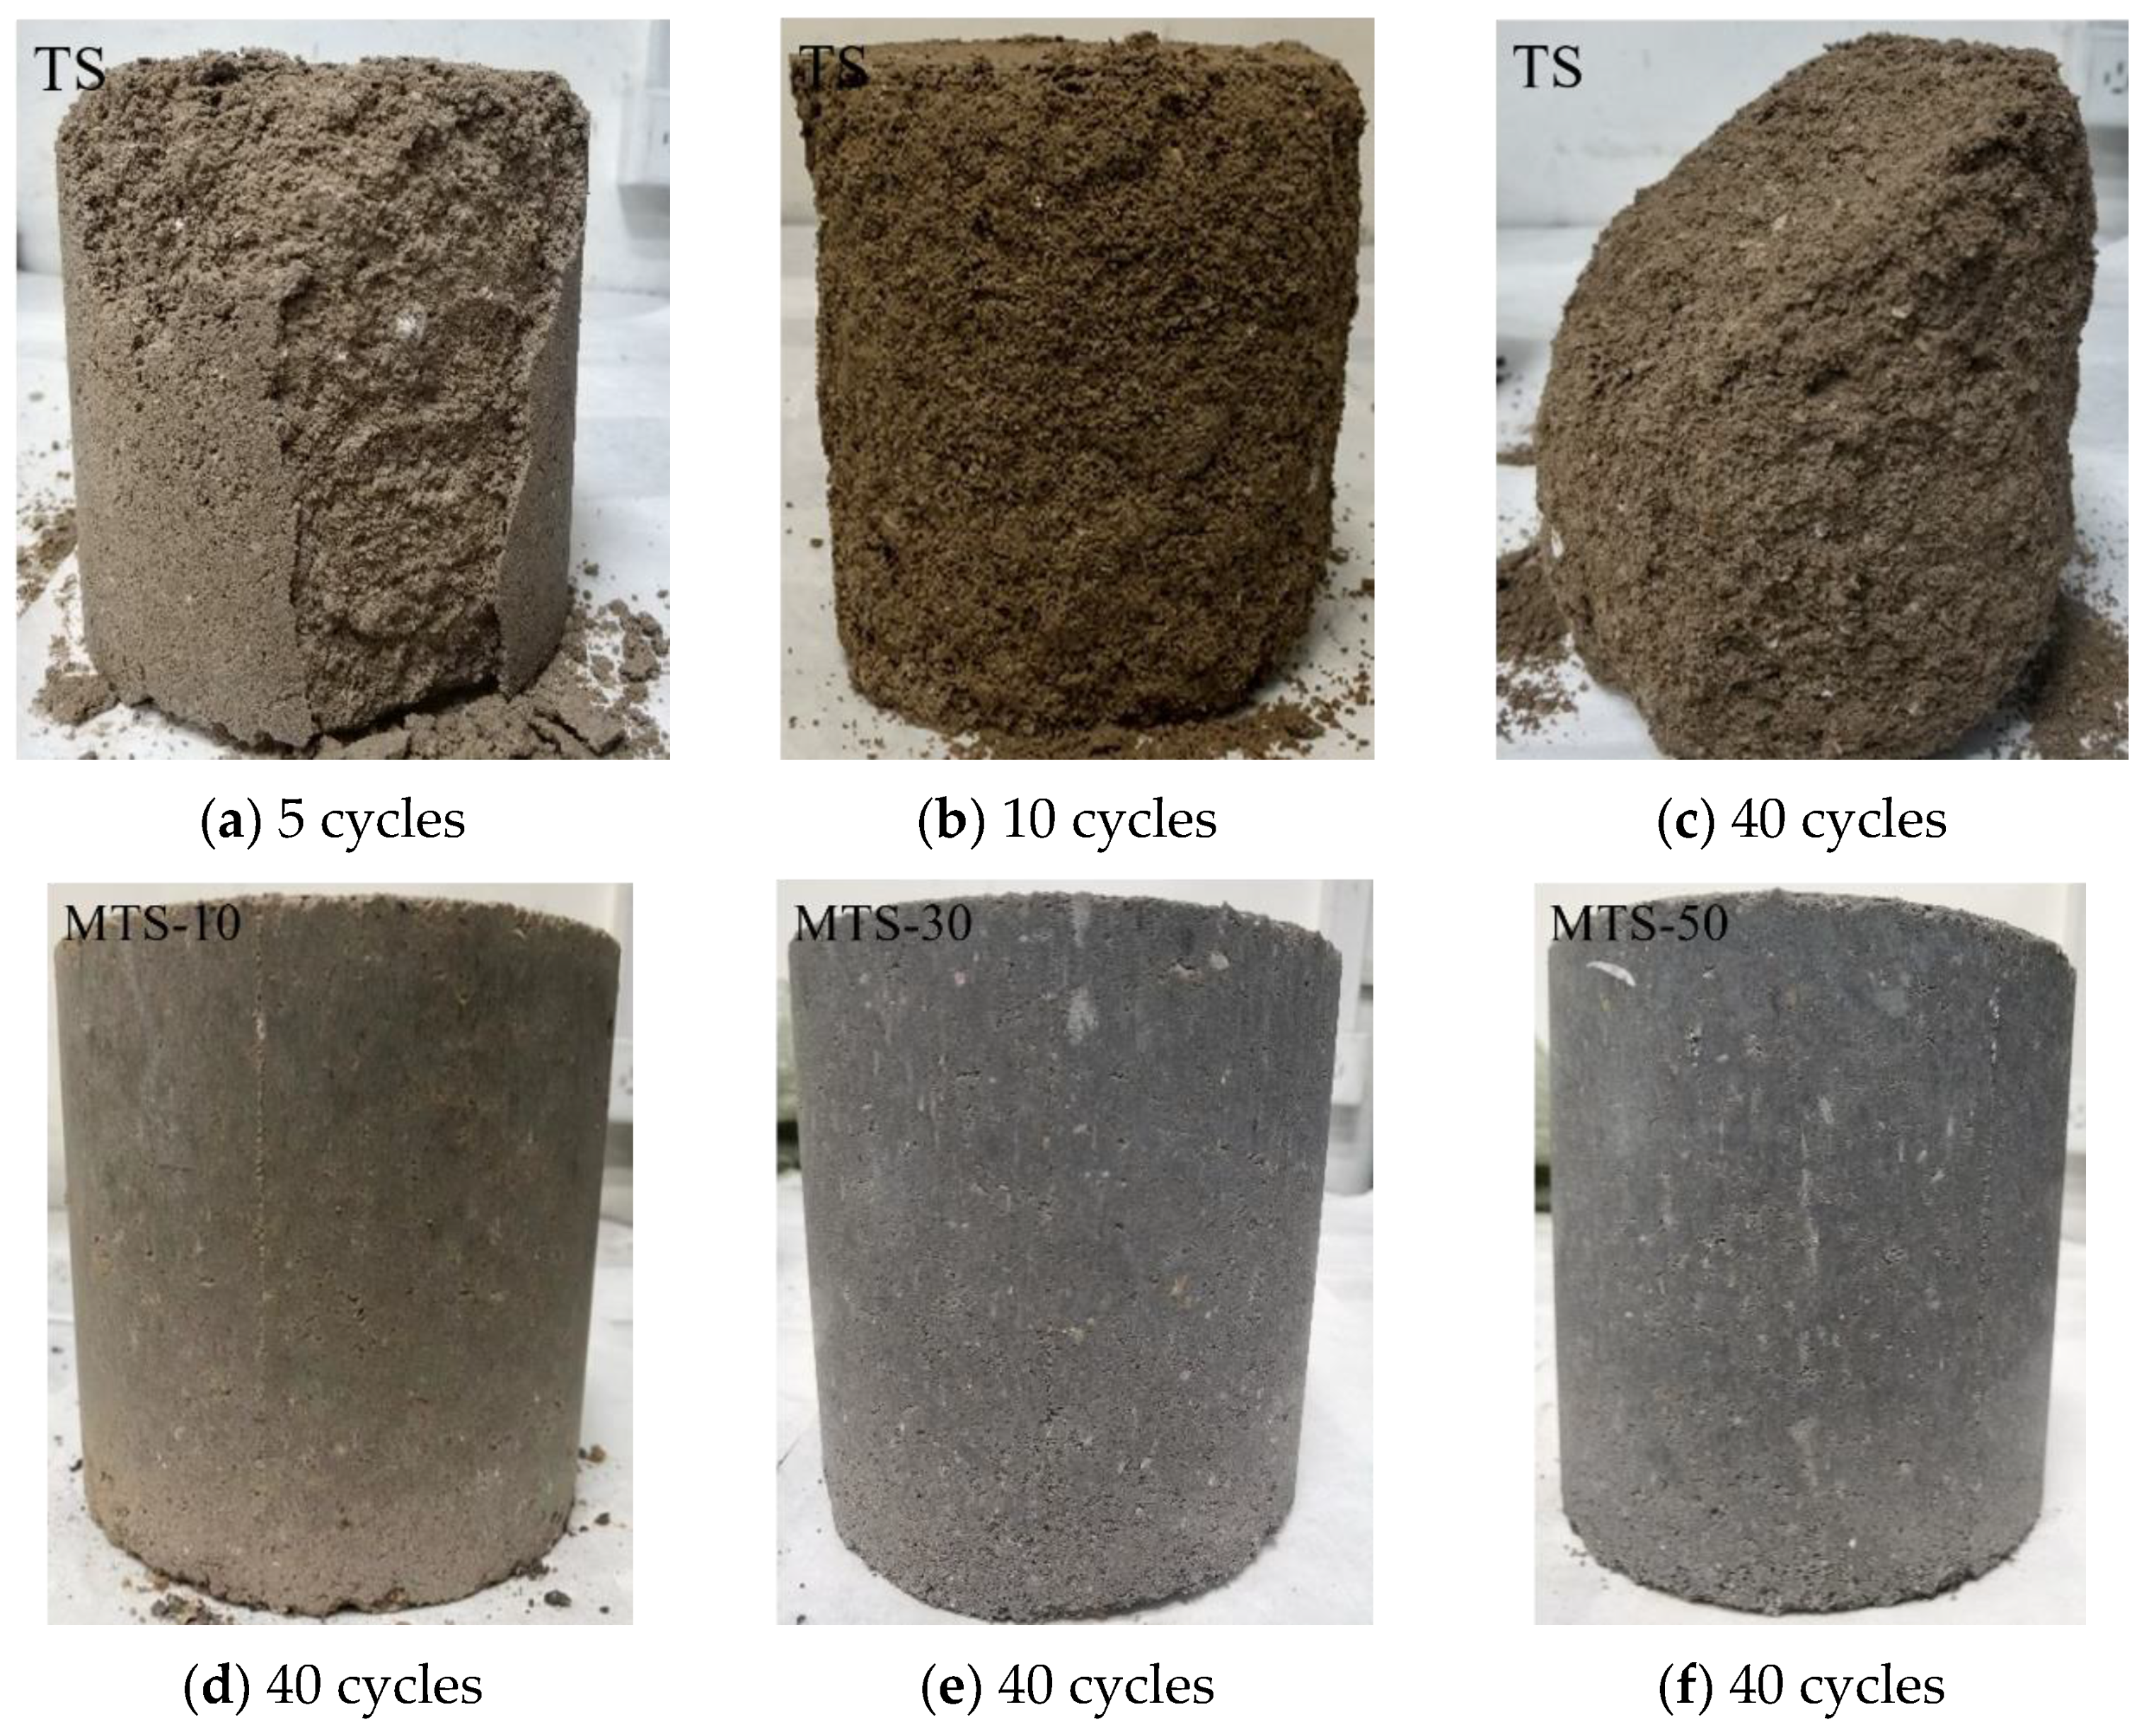
Figure 15 demonstrates that with the increase in the coal gangue content, the color of the specimen gradually changed from brown to dark gray. The top and side surfaces of the TS group specimens were damaged after five freeze–thaw cycles. After ten freeze-thaw cycles, the side of the specimen completely peeled off, and the interior began to damage and became loose. After forty freeze–thaw cycles, the specimen was seriously damaged, the mass loss rate reached 34.20%, and the compressive strength loss rate reached 100%. However, the surfaces of the MTS-10, MTS-30, and MTS-50 groups remained stable after forty freeze–thaw cycles. This was because the hydration products of Ca(OH)
2 reacted with the silica (SiO
2) and alumina (Al
2O
3) of the CACG to form a skeleton and fill pores, which produced greater compactness and strength in the specimens. Therefore, the CACG effectively improved the freeze–thaw resistance of the tabia.
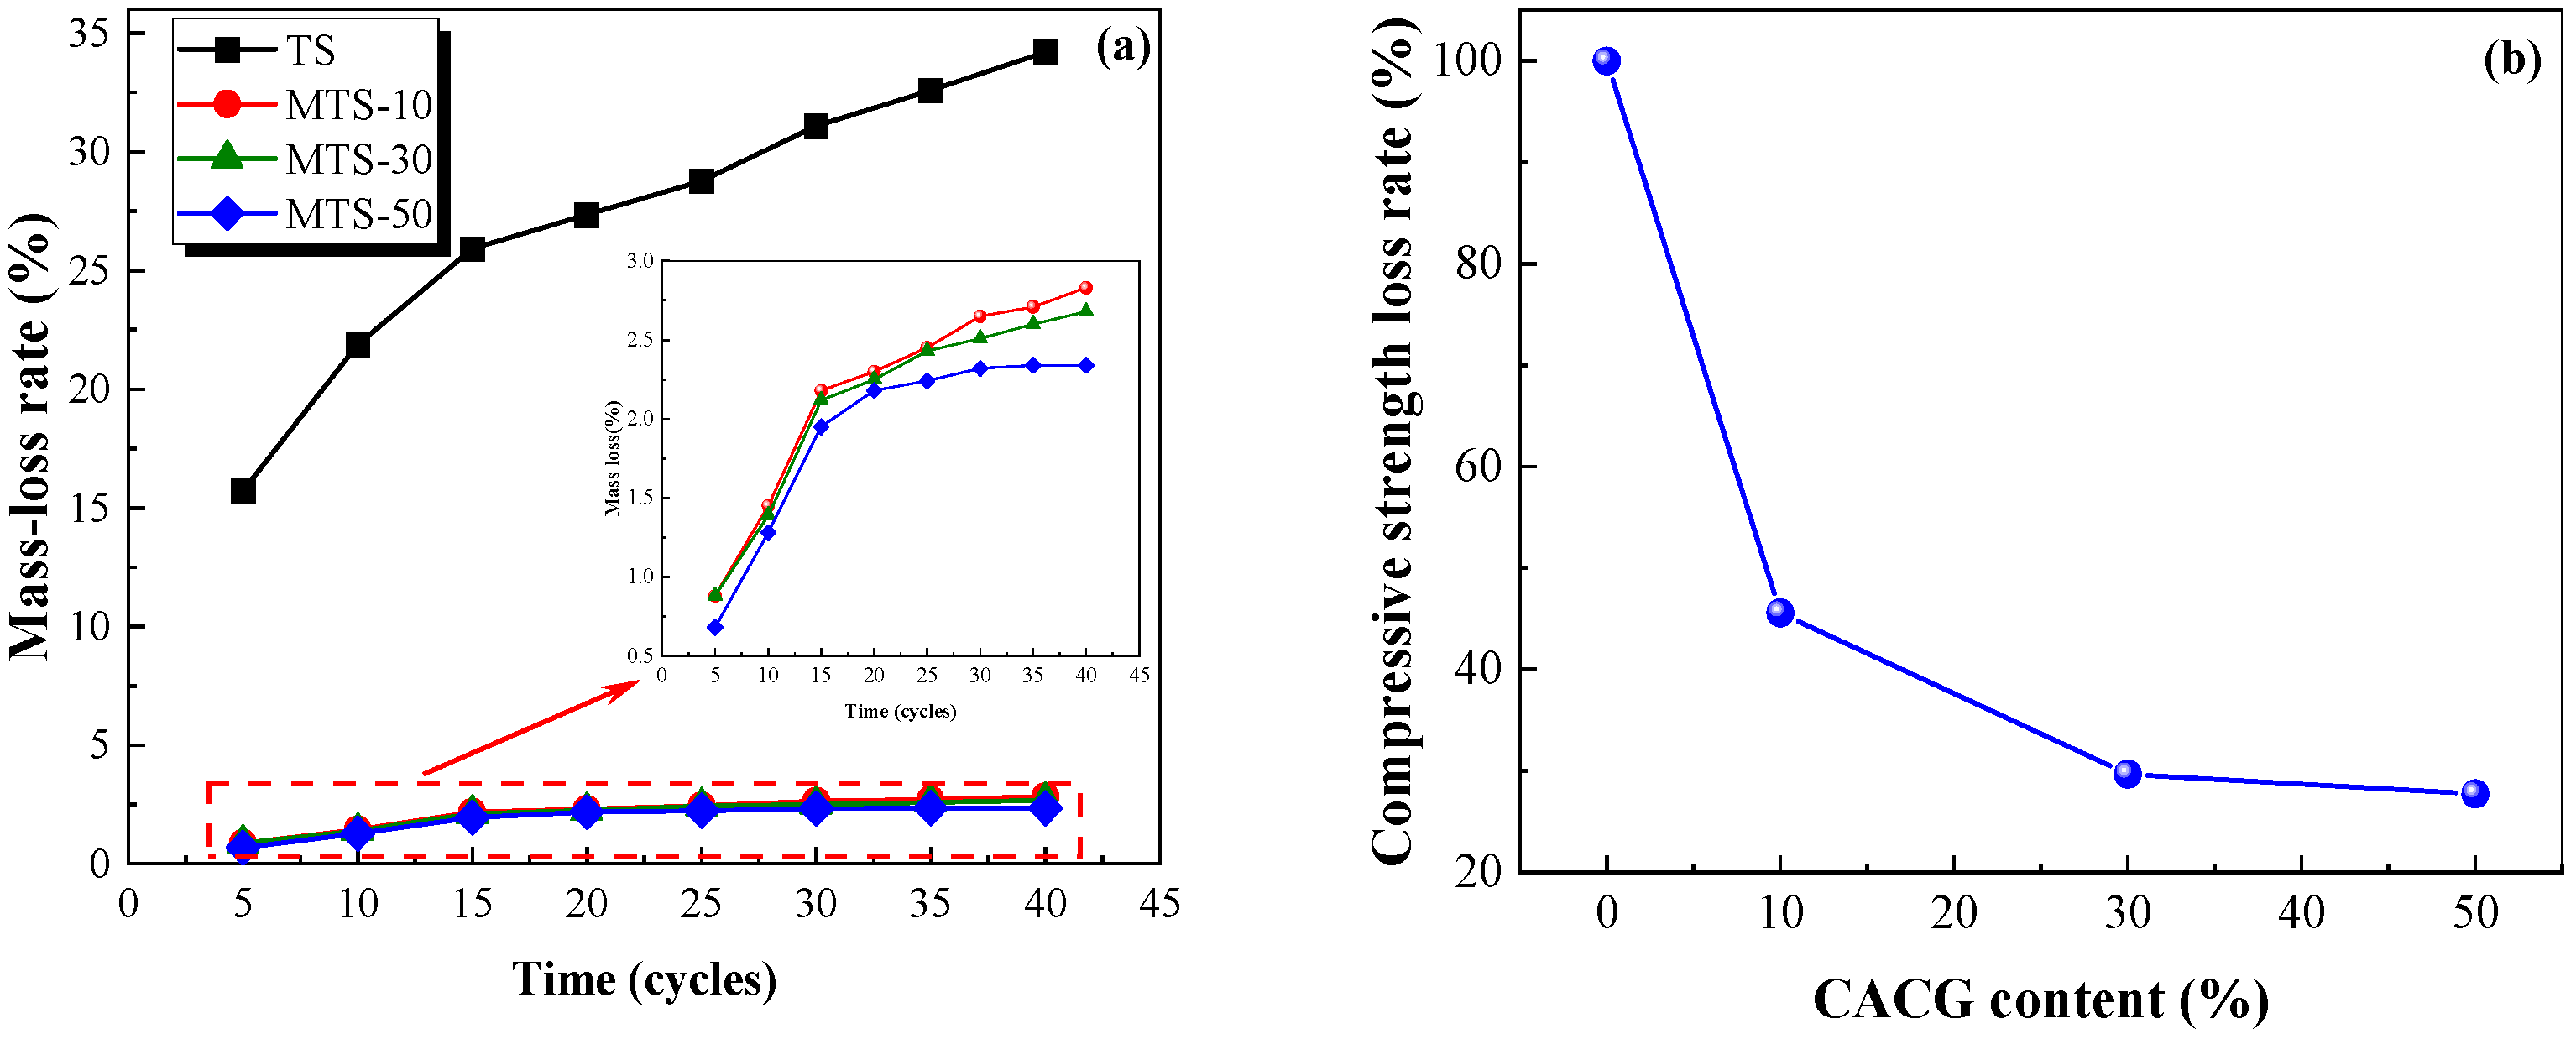
Figure 16 shows that the mass loss rate increased with the increase in the freeze–thaw cycles. By contrast, the mass loss rate displayed a negative correlation with the CACG content and the compressive strength loss rate decreased with the increase in the CACG content. It should be mentioned that the mass loss rate and the compressive strength rate showed a dramatic decrease when the CACG content was 10%, indicating that an appropriate CACG significantly improved the freeze–thaw resistance of the specimens. After 40 cycles, the mass loss rate of the specimens in the TS group was 34.20%, while the mass loss rates of the specimens in the MTS-10, MTS-30, and MTS-50 groups were 2.83%, 2.68%, and 2.64%, respectively. Because the reaction between coal gangue and Ca(OH)
2 produces hydrated calcium silicate and hydrated calcium aluminate, its bonding performance and strength are higher than calcium carbonate, which leads to the development of greater compactness and mechanical properties.
4.7. Drying Shrinkage Properties
The tabia modified by CACG is a kind of base material with a pore structure. The water of modified tabia exists in the pores in various morphologies, primarily including capillary water, crystal water, and bound water [
31,
32]. Previous studies have indicated that drying shrinkage is mainly caused by the evaporation of internal water from the pore network of the mixture [
33]. Water evaporation causes capillary tension, adsorption hydraulic action, intermolecular force, interlayer water action, and carbonization, resulting in the overall shrinkage of the material [
32]. There were six specimens in each group, of which three were used to measure the dry shrinkage deformation and three were used to investigate the mass loss. Dial gauge comparators with an accuracy of ± 0.001mm were employed to measure the dry shrinkage deformation. The calculation formula of the mass loss rate, the dry shrinkage deformation, and the dry shrinkage strain can be expressed as follows:
where
is the mass loss rate of the i-th time (%);
is the mass of the i-th time (g);
is the mass of specimens after drying (g);
is the drying shrinkage deformation at the i-th time (mm);
is the reading of the j-th dial indicator during the i-th test (mm);
is the drying shrinkage strain; and
is the initial length of the specimens (mm).
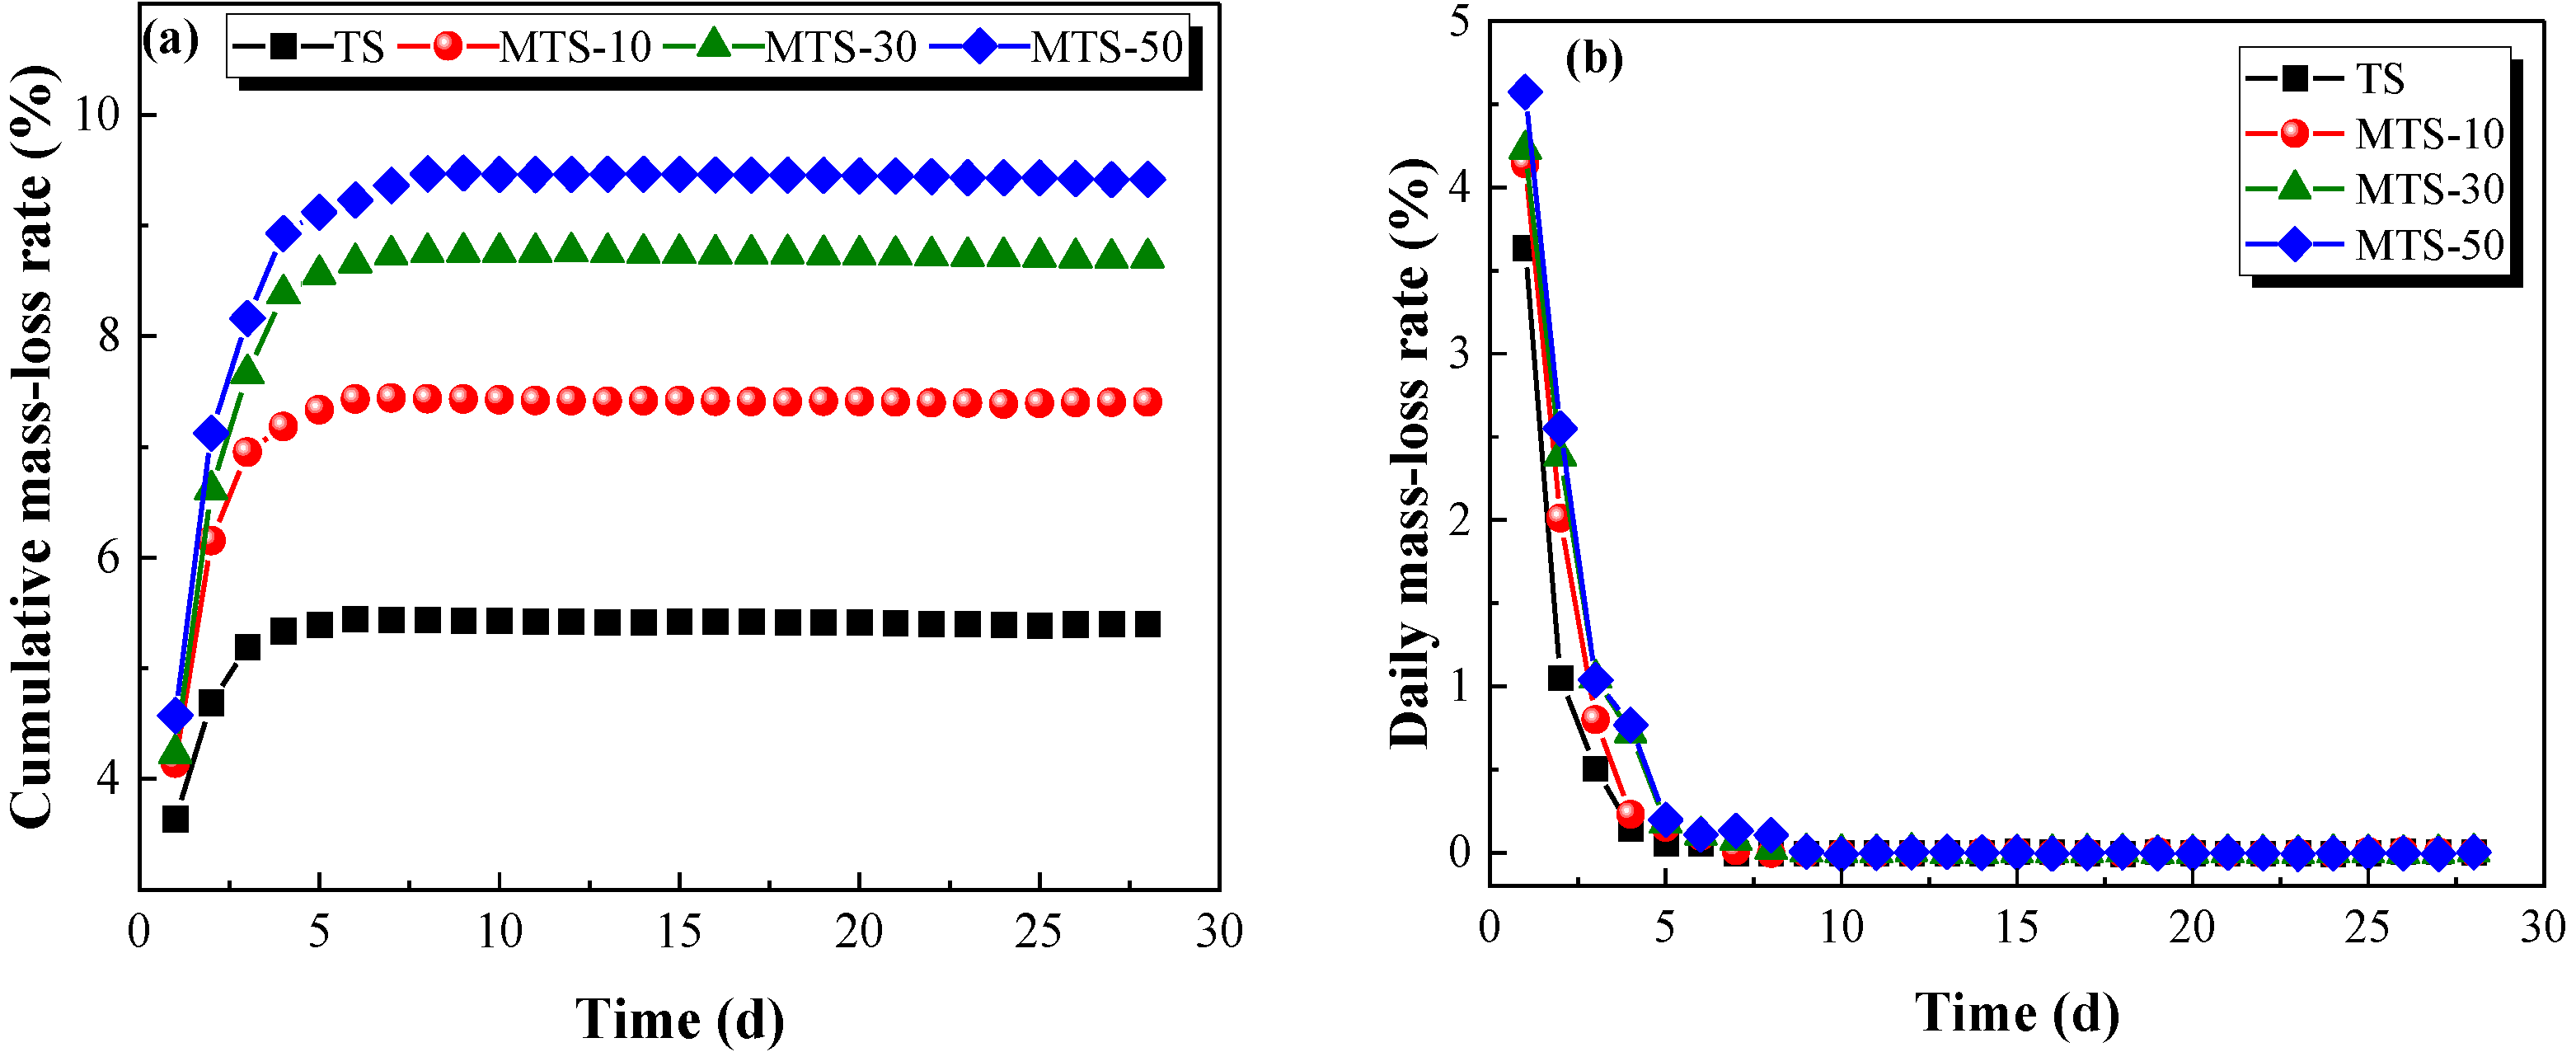
Figure 17 illustrates that the cumulative mass loss rate increased with the increase in CACG content. After curing 28 days, the cumulative mass loss rates of the MTS-10, MTS-30, and MTS-50 groups were 1.37, 1.61, and 1.74 times that of the traditional tabia, respectively. Moreover, the cumulative mass loss rate first increased and then tended to be stable with as the curing time increased. By contrast, the daily mass loss rate displayed the opposite trend (see
Figure 17b). It is worth noting that the mass loss primarily occurred in the early stage (<10 d).
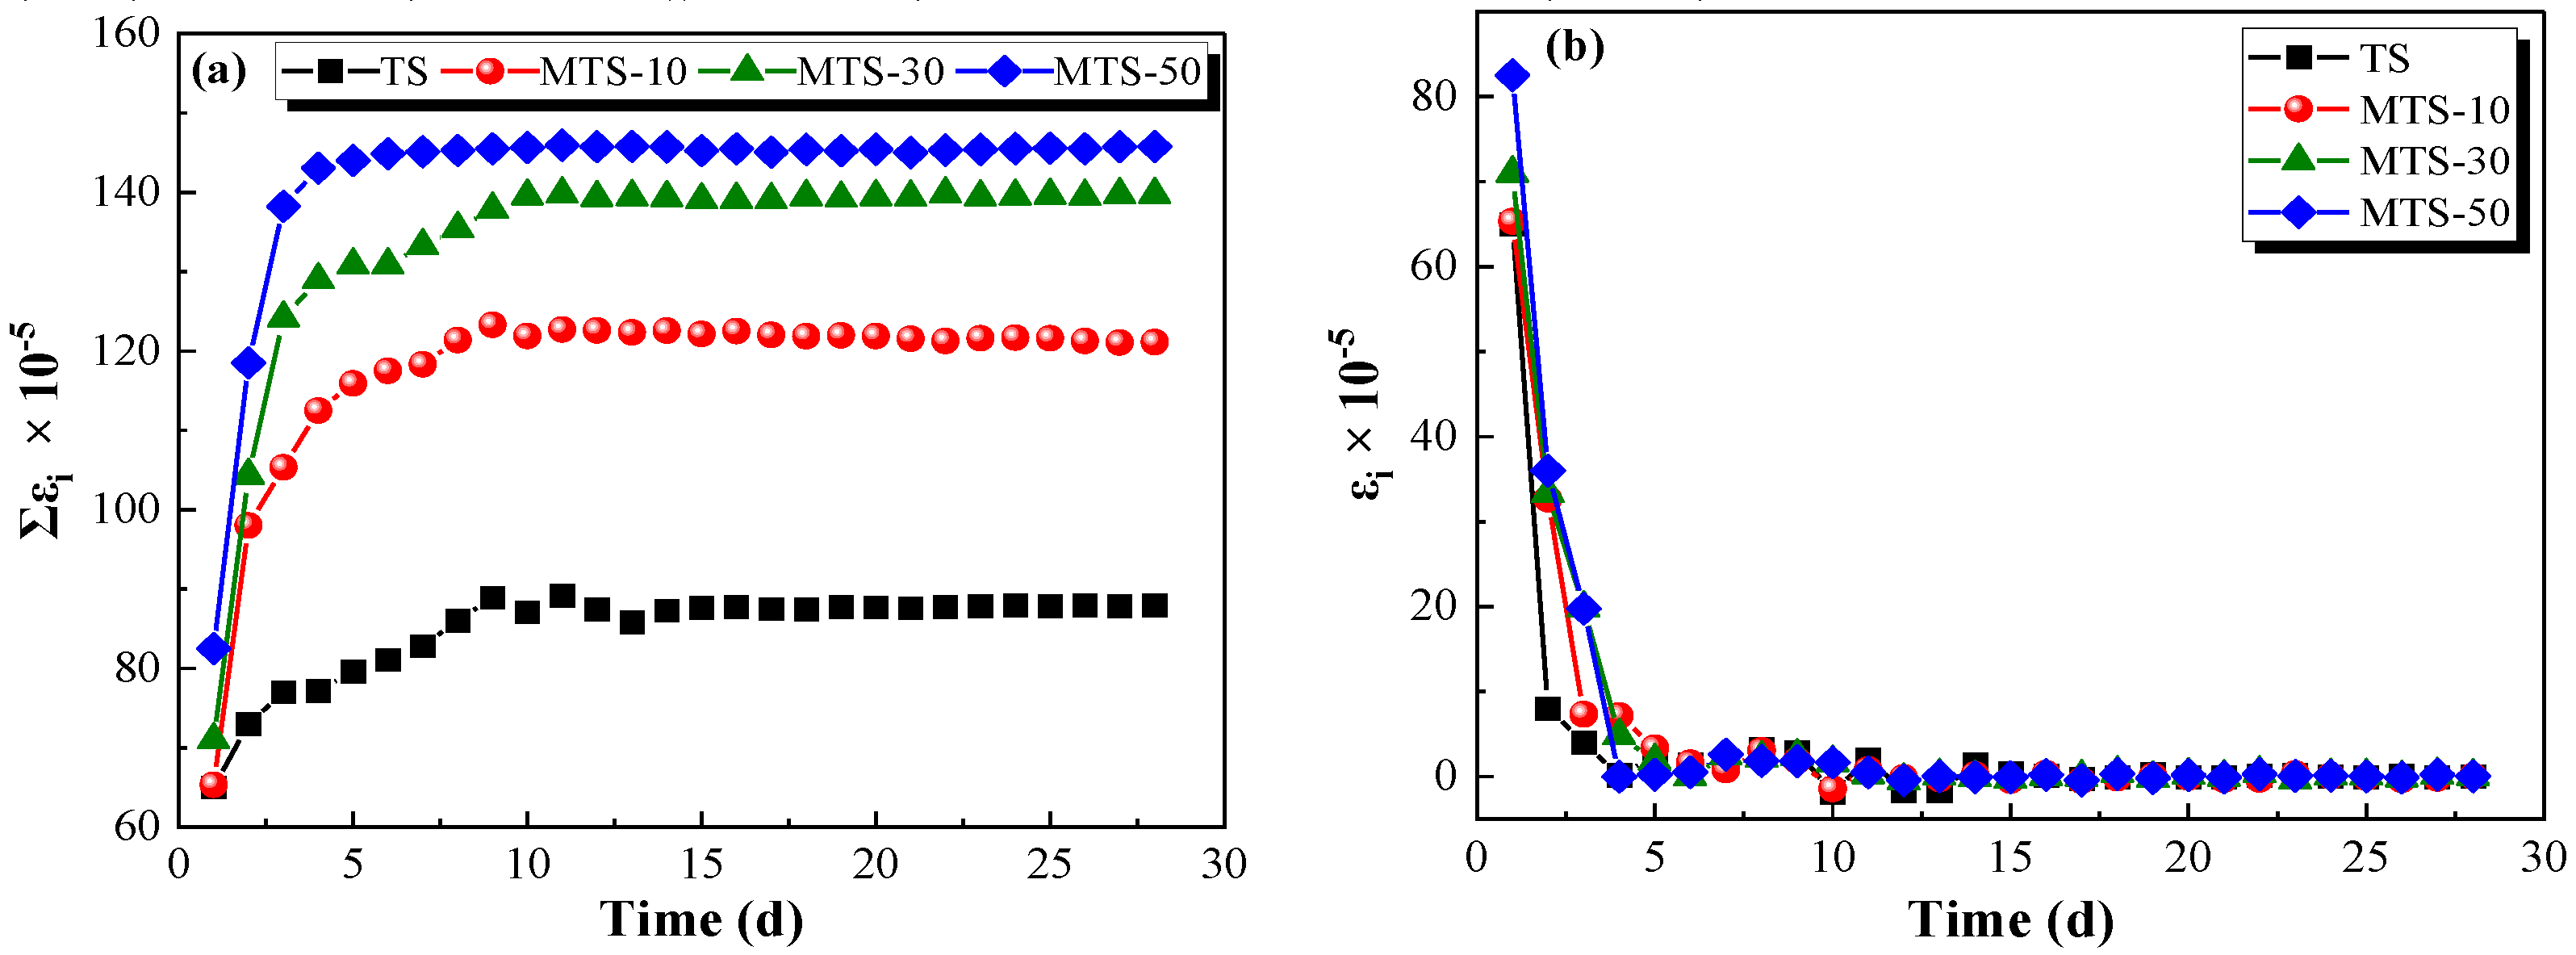
Figure 18a demonstrates that there was a positive correlation between the cumulative drying shrinkage strain and CACG content. The cumulative drying shrinkage strain first increased and then tended to be stable as the curing time increased. Nevertheless, the daily drying shrinkage strain displayed the opposite trend (see
Figure 18b). However, the drying shrinkage strain primarily occurred in the early stage (<10 d).
As shown in
Figure 17 and
Figure 18, the mass loss and the drying shrinkage strain primarily occur in the early stage (<10 d) and remained stable in the later stage. These results are consistent with previous findings [
21,
22,
23,
24,
25,
26,
27,
28,
29,
30,
31,
32,
33], and the drying shrinkage was mainly caused by the evaporation of internal water.
5. Hydration Mechanism
The above conclusions demonstrate that the mechanical properties, impermeability, freeze-thaw resistance, and hydration products of modified tabia and traditional tabia are significantly different. According to the different hydration products at different curing times, the hydration process of the modified tabia can be divided into three stages, including Lime’s dissolution–ionization stage, the pozzolanic reaction stage, and the carbonization–crystallization stage.
(1) Lime’s dissolution–ionization stage
Firstly, the lime reacts with water to form Ca(OH)
2. Next, the Ca(OH)
2 ionizes, and the PH value of the tabia gradually increases.
(2) Pozzolanic rection stage
The active substances (Al
2O
3 and SiO
2) of CACG react with Ca(OH)
2 in an alkaline environment to form hydrated calcium silicate and hydrated aluminum silicate. These hydrated products fill the pores between particles, which improves the compactness and strength of the specimens.
(3) Carbonization–crystallization stage
The pozzolanic reaction cannot be carried out stably and over the long term [
34]. When the various reactions of the tabia reach a certain degree, or a large amount of water is lost, the reaction enters the carbonization–crystallization stage. At this stage, Ca(OH)
2 reacts with carbon dioxide in the air to form crystalline calcium carbonate. However, the carbonization reaction is prolonged because it is challenging to obtain sufficient carbon dioxide with the internal Ca(OH)
2. In addition, Ca(OH)
2 crystals gradually precipitate due to decreasing moisture content.
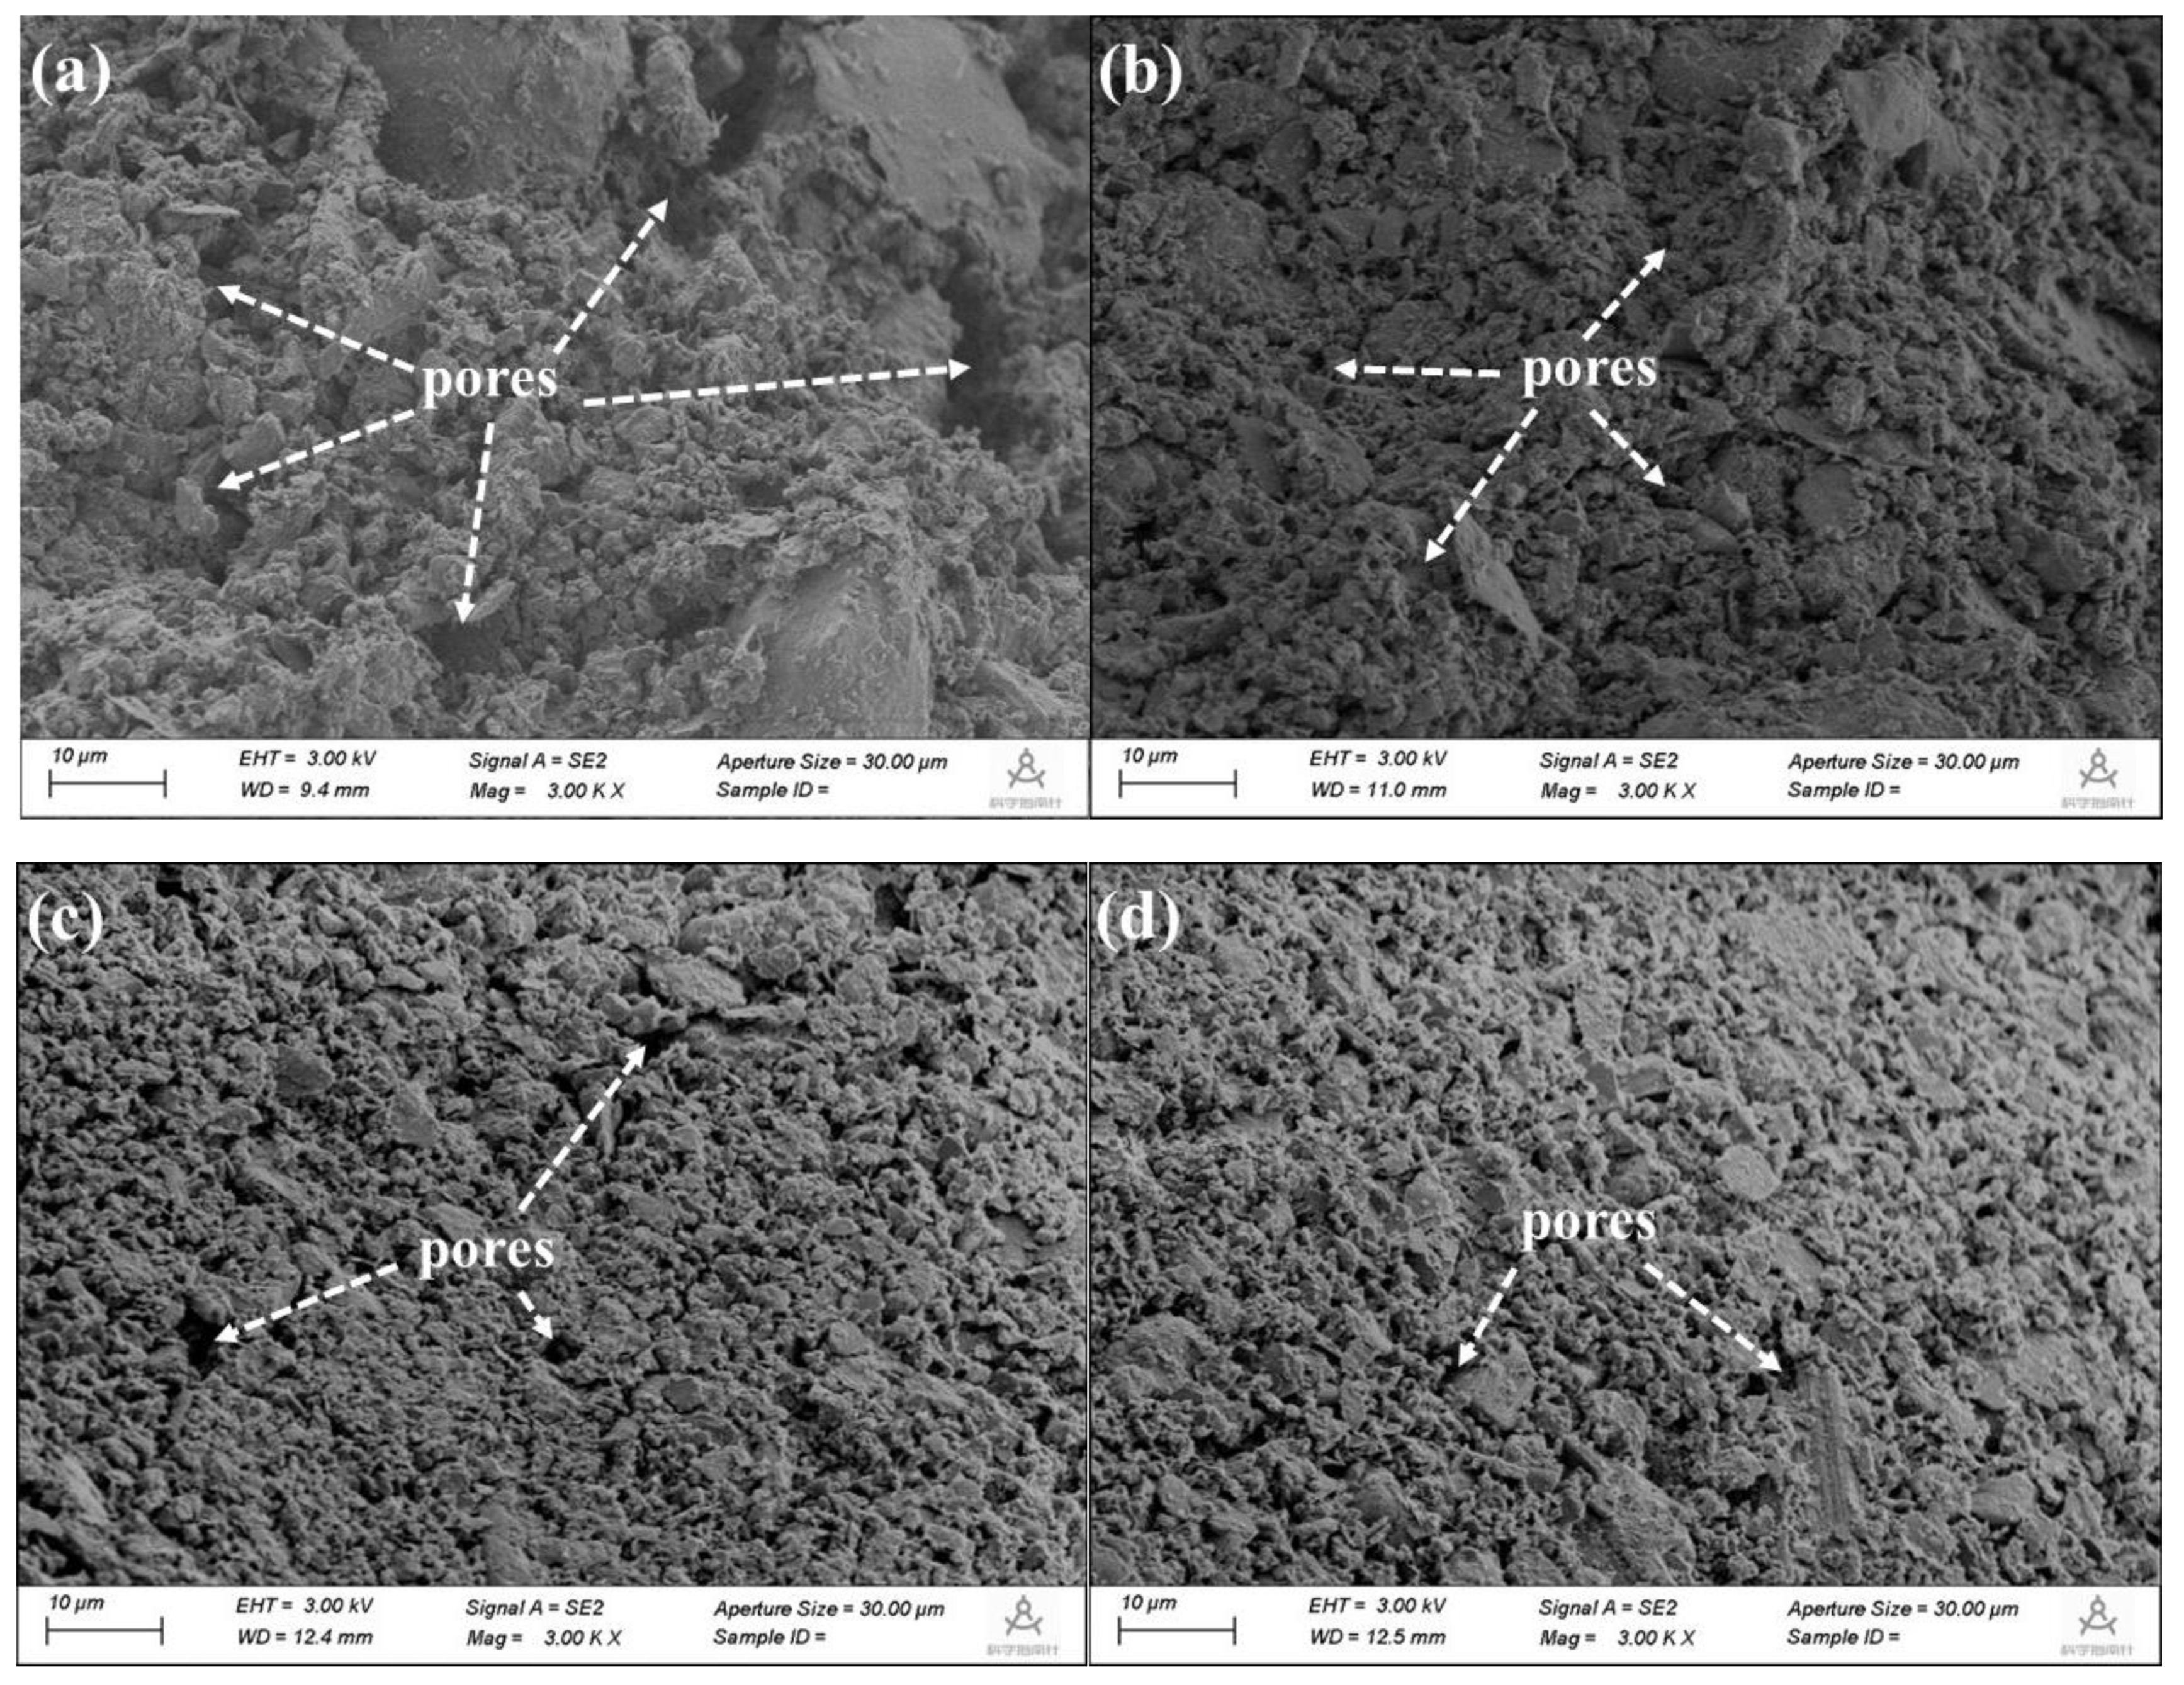
The microstructure of the specimens with different CACG contents after curing for 28 days was observed by ESEM, as shown in
Figure 19.
Figure 19a indicates that the samples in the TS group exhibited a loose microstructure with pore space between the particles. A small amount of calcium carbonate and calcium hydroxide (Ca(OH)
2) was deposited on the surfaces of the particles, formed by the reaction of calcium oxide, water, and carbon dioxide in the air.
Figure 19b shows that the pores on the surfaces of the samples in the MTS-10 group were decreased. Furthermore, many gelatinous hydration products and calcium carbonate crystals were deposited on the particles. This was because Ca(OH)
2 reacts with the silica(SiO
2) and alumina(Al
2O
3) of coal gangue to produce hydrated calcium silicate and hydrated calcium aluminate.
Figure 19c and
Figure 19d indicate that the hydration productions filled the pores and healed the entrapped micro-cracks in the hardened paste. These visible pores almost disappeared, and the microstructure became dense.
6. Conclusions
The following conclusions were drawn:
- (1)
The composited activation method can significantly enhance the pozzolanic reactivity of coal gangue. The optimum calcination temperature and holding time are 700 °C and two hours, respectively.
- (2)
Compared with the traditional tabia, the unconfined compressive strength, splitting strength, and flexural tensile strength of the modified tabia with a CACG content of 50% increased by 5.03 times, 9.71 times, and 1.50 times, respectively.
- (3)
The mass loss rate of MT was less than 2.83%, while it reached up to 34.20% in TT after being conditioned to 40 freez–thaw cycles. Therefore, CACG can remarkably improve the freeze–thaw resistance of tabia.
- (4)
The hydration products of the reaction between the active substances of CACG and Ca(OH)2 filled the pores between the particles, which produced specimens with greater compactness and strength.
Author Contributions
Conceptualization, C.Y. and Y.Z.; methodology, Z.W. and Y.Z.; writing—original draft preparation, Y.Z. and S.C.; writing—review and editing, C.Y. and Y.Z.; software, Y.Z. and B.W.; investigation, C.Y. and Y.Z.;supervision, C.Y. and Y.Z.; project administration, C.Y. All authors have read and agreed to the published version of the manuscript.
Funding
This research was funded by the National Natural Science Foundation of China, grant number 52078122 and the National Key R & D Program of China, grant number 2017YFC0504505.
Institutional Review Board Statement
Not applicable.
Informed Consent Statement
Not applicable.
Data Availability Statement
The data used to support the findings of this study are available from the corresponding author upon request.
Conflicts of Interest
The authors declare no conflict of interest.
References
- Kasassi, A.; Rakimbei, P.; Karagiannidis, A.; Zabaniotou, A.; Tsiouvaras, K.; Nastis, A.; Tzafeiropoulou, K. Soil contamination by heavy metals: Measurements from a closed unlined landfill. Bioresour. Technol. 2008, 99, 8578–8584. [Google Scholar] [CrossRef] [PubMed]
- Li, J.Y.; Wang, J.M. Comprehensive utilization and environmental risks of coal gangue: A review. J. Clean. Prod. 2019, 239, 117946. [Google Scholar] [CrossRef]
- Jabłońska, B.; Kityk, A.V.; Busch, M.; Huber, P. The structural and surface properties of natural and modified coal gangue. J. Environ. Manag. 2017, 190, 80–90. [Google Scholar] [CrossRef]
- Bashar, I.I.; Alengaram, U.J.; Jumaat, M.Z.; Islam, A. Development of sustainable geopolymer mortar using industrial waste materials. Mater. Today Proc. 2016, 3, 125–129. [Google Scholar] [CrossRef]
- Kong, D.; Jiang, R. Preparation of NaA Zeolite from High Iron and Quartz Contents Coal Gangue by Acid Leaching—Alkali Melting Activation and Hydrothermal Synthesis. Crystals 2021, 11, 1198. [Google Scholar] [CrossRef]
- Qiu, Y.L.; Zhang, X.X.; Liu, K.P.; Hu, X.Y.; Guan, B.W. Research on Mechanical Behaviour of Cement Mortar with High-Volume Coal Gangue. Adv. Mat. Res. 2011, 261–263, 685–689. [Google Scholar] [CrossRef]
- Zhao, Y.; Yang, C.; Li, K.; Qu, F.; Yan, C.; Wu, Z. Toward understanding the activation and hydration mechanisms of composite activated coal gangue geopolymer. Constr. Build. Mater. 2022, 318, 125999. [Google Scholar] [CrossRef]
- Huang, M.; Duan, J.; Wang, J. Research on Basic Mechanical Properties and Fracture Damage of Coal Gangue Concrete Subjected to Freeze-Thaw Cycles. Adv. Mater. Sci. Eng. 2021, 2021, 1–12. [Google Scholar] [CrossRef]
- Abichou, T.; Benson, C.H.; Edil, T.B. Foundry Green Sands as Hydraulic Barriers: Laboratory Study. J. Geotech. Geoenviron. 2000, 126, 1174–1183. [Google Scholar] [CrossRef]
- Li, M.; Li, A.; Zhang, J.; Huang, Y.; Li, J. Effects of particle sizes on compressive deformation and particle breakage of gangue used for coal mine goaf backfill. Powder Technol. 2020, 360, 493–502. [Google Scholar] [CrossRef]
- Li, W.X.; Wang, D.L.; Niu, J.S.; Ma, X.W. Preparation of Coal Gangue Cement Mortar. Adv. Mater. Res. 2013, 684, 159–162. [Google Scholar] [CrossRef]
- Zhou, M.; Li, Z.G.; Wu, Y.Q.; Zhang, X.F.; Ai, L. Experimental Research on Lime-Fly Ash-Cement Stabilized Coal Gangue Mixture. J. Build. Mater. 2010, 13, 213–217. [Google Scholar]
- Gao, X.; Liu, C.; Shui, Z.; Yu, R. Effects of Expansive Additives on the Shrinkage Behavior of Coal Gangue Based Alkali Activated Materials. Crystals 2021, 11, 816. [Google Scholar] [CrossRef]
- Duan, X.; Xia, J.; Yang, J. Influence of coal gangue fine aggregate on microstructure of cement mortar and its action mechanism. Jianzhu Cailiao Xuebao J. Build. Mater. 2014, 17, 700–705. [Google Scholar]
- Dong, Z.; Xia, J.; Fan, C.; Cao, J. Activity of calcined coal gangue fine aggregate and its effect on the mechanical behavior of cement mortar. Constr. Build. Mater. 2015, 100, 63–69. [Google Scholar] [CrossRef] [Green Version]
- Li, M.; Zhang, J.; Li, A.; Zhou, N. Reutilisation of coal gangue and fly ash as underground backfill materials for surface subsidence control. J. Clean. Prod. 2020, 254, 120113. [Google Scholar] [CrossRef]
- Wang, J.; Zhang, J.; Zhang, Q.; Wu, Z.; Gao, D. Analysis of the Control Effect and Parameter Optimisation of Urban Surface Deformation in Underground Coal Mining with Solid Backfilling. Adv. Civ. Eng. 2021, 2021, 1–13. [Google Scholar] [CrossRef]
- Guan, J.; Lu, M.; Yao, X.; Wang, Q.; Wang, D.; Yang, B.; Liu, H. An Experimental Study of the Road Performance of Cement Stabilized Coal Gangue. Crystals 2021, 11, 993. [Google Scholar] [CrossRef]
- Fang, F. Pavement Engineering. The People‘s Communication; China Communications Press: Beijing, China, 1990. [Google Scholar]
- Technical Guidelines for Construction of Highway Roadbases; CN-JTG/T F20-2015; Ministry of Transport of the People‘s Republic of China: Beijing, China, 2015.
- Sand for Construction; GB/T 14684–2011; Ministry of Transport of the People‘s Republic of China: Beijing, China, 2011.
- Zhang, C.; Xue, J.; Fang, L. Mechanical Properties and Microstructures of Alkali Activatedburned Coal Gangue Cementitious Material. Kuei Suan Jen Hsueh Pao J. Chin. Ceram. Soc. 2004, 32, 1276–1280. [Google Scholar]
- Liu, C.; Xia, J.; Zi, G.; Yu, F.; Xie, Y. Extraction of valuable element alumina from coal gangue based on microwave assisted and response surface methodology. Chin. J. Environ. Eng. 2015, 9, 5071–5077. [Google Scholar]
- Test Methods of Materials Stabilized with Inorganic Binders for Highway Engineering; JTG E51-2009; Ministry of Transport of the People‘s Republic of China: Beijing, China, 2009.
- Guo, W. Research on Coal Gangue Activation and its Activity Evaluation Method. Ph.D. Thesis, Nanjing University of Technology, Nanjing, China, 2005. [Google Scholar]
- Gu, B.W.; Wang, P.M. Study on pozzolanic reaction degree in calcined coal gangue-Ca(OH)2-H2O system. J. Tongji Univ. Nat. Sci. 2008, 36, 5. [Google Scholar]
- Guo, W.; Li, D.X.; Chen, J.H.; Yang, R.N. Early hydration process of cement with mechanically activated burned coal gangue. J. Chin. Ceram. Soc. 2008, 36, 94–98. [Google Scholar]
- Cao, Z.; Cao, Y.D.; Dong, H.J.; Zhang, J.S.; Sun, C.B. Effect of calcination condition on the microstructure and pozzolanic activity of calcined coal gangue. Int. J. Miner. Process. 2016, 146, 23–28. [Google Scholar] [CrossRef]
- Li, D.; Chen, Y.; Shen, J.; Su, J.; Wu, X. The influence of alkalinity on activation and microstructure of fly ash. Cem Concr Res. 2000, 30, 881–886. [Google Scholar] [CrossRef]
- Standard for Test Methods of Long-Term Performance and Durability of Ordinary Concrete; GBT50082-2009; Ministry of Transport of the People‘s Republic of China: Beijing, China, 2009.
- Ma, H.; Chen, H.; Zhu, H.; Shi, Y.; Hang, Z. Study on the drying shrinkage of alkali-activated coal gangue-slag mortar and its mechanisms. Constr. Build. Mate. 2019, 225, 204–213. [Google Scholar]
- Yang, Q. Research on Pavement Performance of Iron Tailings Sand Stabilized with Inorganic Binder; Dalian University of Technology: Dalian, China, 2008. [Google Scholar]
- Yang, T.; Zhu, H.; Zhang, Z. Influence of fly ash on the pore structure and shrinkage characteristics of metakaolin-based geopolymer pastes and mortars. Constr. Build. Mater. 2017, 153, 284–293. [Google Scholar] [CrossRef]
- Zhao, W.Y. Experimental Study on the Ratio of Semi-Rigid Base Course Material in Jilin City. Master’s Thesis, Jilin University, Jilin, China, 2007. [Google Scholar]
Figure 1.
XRD spectra of raw coal gangue.
Figure 1.
XRD spectra of raw coal gangue.
Figure 2.
Gradation cure of sand.
Figure 2.
Gradation cure of sand.
Figure 3.
Schematic diagram of the composite activation procedure.
Figure 3.
Schematic diagram of the composite activation procedure.
Figure 4.
Installation of seepage test.
Figure 4.
Installation of seepage test.
Figure 5.
XRD patterns at different calcination temperatures (a) and holding times (b).
Figure 5.
XRD patterns at different calcination temperatures (a) and holding times (b).
Figure 6.
ESEM images of samples at (a) raw coal gangue, (b) calcined coal gangue.
Figure 6.
ESEM images of samples at (a) raw coal gangue, (b) calcined coal gangue.
Figure 7.
Particle size distribution of CACG at different levels of particle fineness.
Figure 7.
Particle size distribution of CACG at different levels of particle fineness.
Figure 8.
Ca(OH)2 consumption at different particle fineness.
Figure 8.
Ca(OH)2 consumption at different particle fineness.
Figure 9.
Ca(OH)2 consumption at different calcination temperatures (a) and holding times (b).
Figure 9.
Ca(OH)2 consumption at different calcination temperatures (a) and holding times (b).
Figure 10.
(a) Relationship of dry density and moisture content, maximum dry density (b), and optimum moisture content (c) at different CACG contents.
Figure 10.
(a) Relationship of dry density and moisture content, maximum dry density (b), and optimum moisture content (c) at different CACG contents.
Figure 11.
(a) Unconfined compressive strength and (b) relative strength.
Figure 11.
(a) Unconfined compressive strength and (b) relative strength.
Figure 12.
(a) Splitting strength of specimens at different curing times; (b) relative ratio.
Figure 12.
(a) Splitting strength of specimens at different curing times; (b) relative ratio.
Figure 13.
(a) Test device; (b) flexural tensile strength of specimens.
Figure 13.
(a) Test device; (b) flexural tensile strength of specimens.
Figure 14.
Cumulative seepage (a) and permeability coefficient (b) at different curing times.
Figure 14.
Cumulative seepage (a) and permeability coefficient (b) at different curing times.
Figure 15.
Damage to specimens at different freeze-thaw cycles.
Figure 15.
Damage to specimens at different freeze-thaw cycles.
Figure 16.
Mass loss rate (a) and compressive strength loss rate (b) in different freeze–thaw cycles.
Figure 16.
Mass loss rate (a) and compressive strength loss rate (b) in different freeze–thaw cycles.
Figure 17.
(a) Cumulative mass loss rate; (b) daily mass loss rate.
Figure 17.
(a) Cumulative mass loss rate; (b) daily mass loss rate.
Figure 18.
(a) Cumulative drying shrinkage strain (Σεi); (b) daily drying shrinkage strain (εi).
Figure 18.
(a) Cumulative drying shrinkage strain (Σεi); (b) daily drying shrinkage strain (εi).
Figure 19.
Microstructure of TS (a), MTS-10 (b), MTS-30 (c), and MTS-50 (d).
Figure 19.
Microstructure of TS (a), MTS-10 (b), MTS-30 (c), and MTS-50 (d).
Table 1.
Primary chemical compositions of raw coal gangue.
Table 1.
Primary chemical compositions of raw coal gangue.
| Component | SiO2 | Al2O3 | Fe2O3 | SO3 | CaO | MgO | K2O | Na2O | LOI |
|---|
| Content (%) | 55.14 | 40.96 | 1.23 | 0.43 | 0.41 | 0.30 | 0.20 | 0.09 | 15.33 |
Table 2.
Primary chemical compositions of lime.
Table 2.
Primary chemical compositions of lime.
| Component | CaO | Cl | NO3 | SO4 | Fe | Pb | MgO |
|---|
| Content (%) | ≥99 | ≤0.003 | ≤0.004 | ≤0.1 | ≤0.015 | ≤0.005 | ≤0.5 |
Table 3.
Properties of the clay samples.
Table 3.
Properties of the clay samples.
| Properties | Liquid Limit (ωL) | Plastic Limit (ωP) | Plasticity Index (Ip) | Moisture Content (%) |
|---|
| Index | 33.5 | 22 | 11.5 | 3.2 |
Table 4.
Mix proportion.
| NO. | Lime | Clay | CACG | Sand |
|---|
| TT | 1 | 3 | 0 | 6 |
| MT-10 | 1 | 2.7 | 0.3 | 6 |
| MT-30 | 1 | 2.1 | 0.9 | 6 |
| MT-50 | 1 | 1.5 | 1.5 | 6 |
Table 5.
Specimen sizes of various tests.
Table 5.
Specimen sizes of various tests.
| Test Type | Specimen Sizes | Number of Each Group | Ref. |
|---|
| Length (mm) | Width (mm) | Height (mm) | Diameter (mm) |
|---|
| Compaction test | - | - | 127 | 100 | 3 | JTG E51-2009 [24] |
| Compressive strength test | - | - | 50 | 50 | 6 |
| Splitting strength test | - | - | 50 | 50 | 6 |
| Flexural tensile strength test | 200 | 50 | 50 | - | 6 |
| Seepage test | - | - | 150 | 150 | 3 |
| Freeze–thaw test | - | - | 150 | 150 | 6 |
| Drying shrinkage test | 200 | 20 | 20 | - | 6 |
Table 6.
Parameters of the compaction test.
Table 6.
Parameters of the compaction test.
| Hammer Quality | Hammer Diameter | Drop Height | Test Tube Size | Layers | Times | Average Power | Maximum Particle Size |
| Internal Diameter | Height | Volume |
| 4.5 kg | 5.0 cm | 45 cm | 10.0 cm | 12.7 cm | 997 cm3 | 5 | 27 | 2.687 J | 19.0 mm |
Table 7.
Parameters of the CACG at different levels of particle fineness.
Table 7.
Parameters of the CACG at different levels of particle fineness.
| Parameters | Span | Uniformity | Specific Surface Area (m2/g) | D10 * (μm) | D50 * (μm) |
|---|
| 60 mesh | 4.307 | 1.37 | 0.927 | 2.554 | 28.522 |
| 100 mesh | 3.785 | 1.22 | 0.948 | 2.396 | 22.696 |
| 200 mesh | 3.526 | 1.12 | 1.170 | 2.040 | 14.298 |
| Publisher’s Note: MDPI stays neutral with regard to jurisdictional claims in published maps and institutional affiliations. |
© 2022 by the authors. Licensee MDPI, Basel, Switzerland. This article is an open access article distributed under the terms and conditions of the Creative Commons Attribution (CC BY) license (https://creativecommons.org/licenses/by/4.0/).


