
Gemstone Inclusion Study by 3D Raman-Mapping and High-Resolution X-ray Computed Tomography: The Case of Trapiche Emerald from Swat, Pakistan

Abstract
:1. Introduction
2. Materials and Methods
2.1. Materials
2.2. Methods
2.2.1. Standard Gemology
2.2.2. Raman
2.2.3. HRXCT
3. Results and Discussion
3.1. The Metallic Inclusions
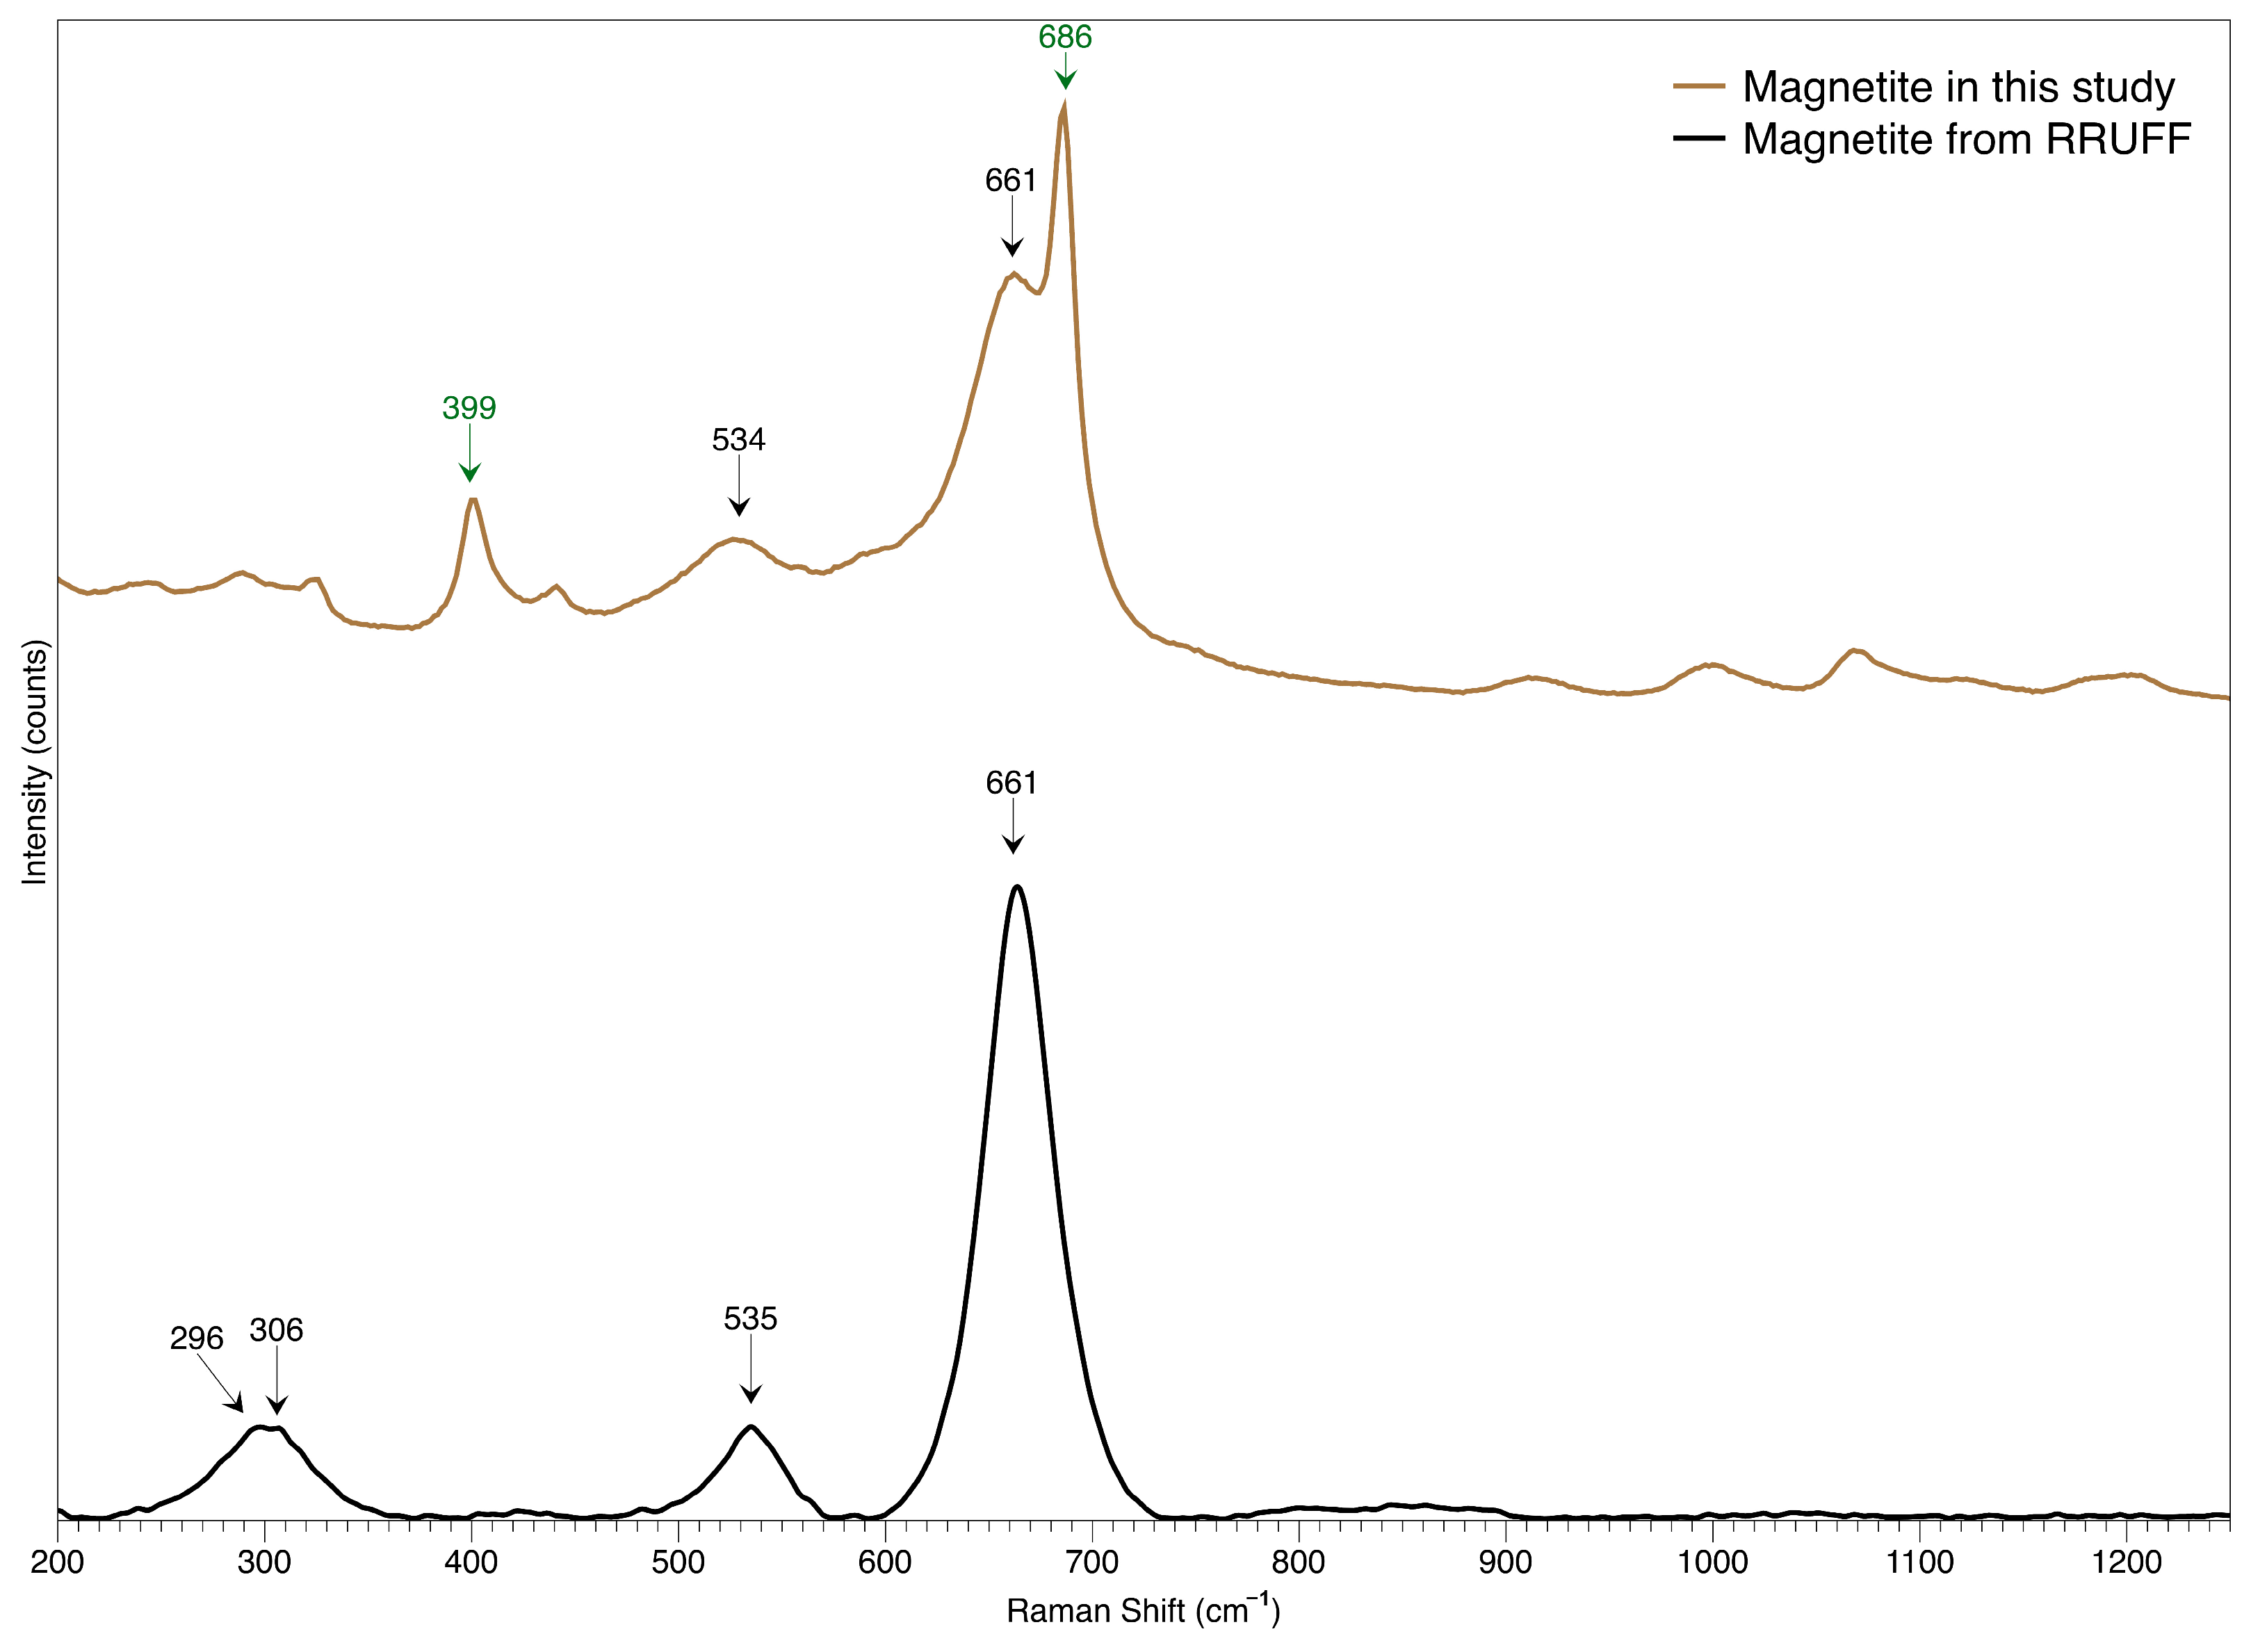
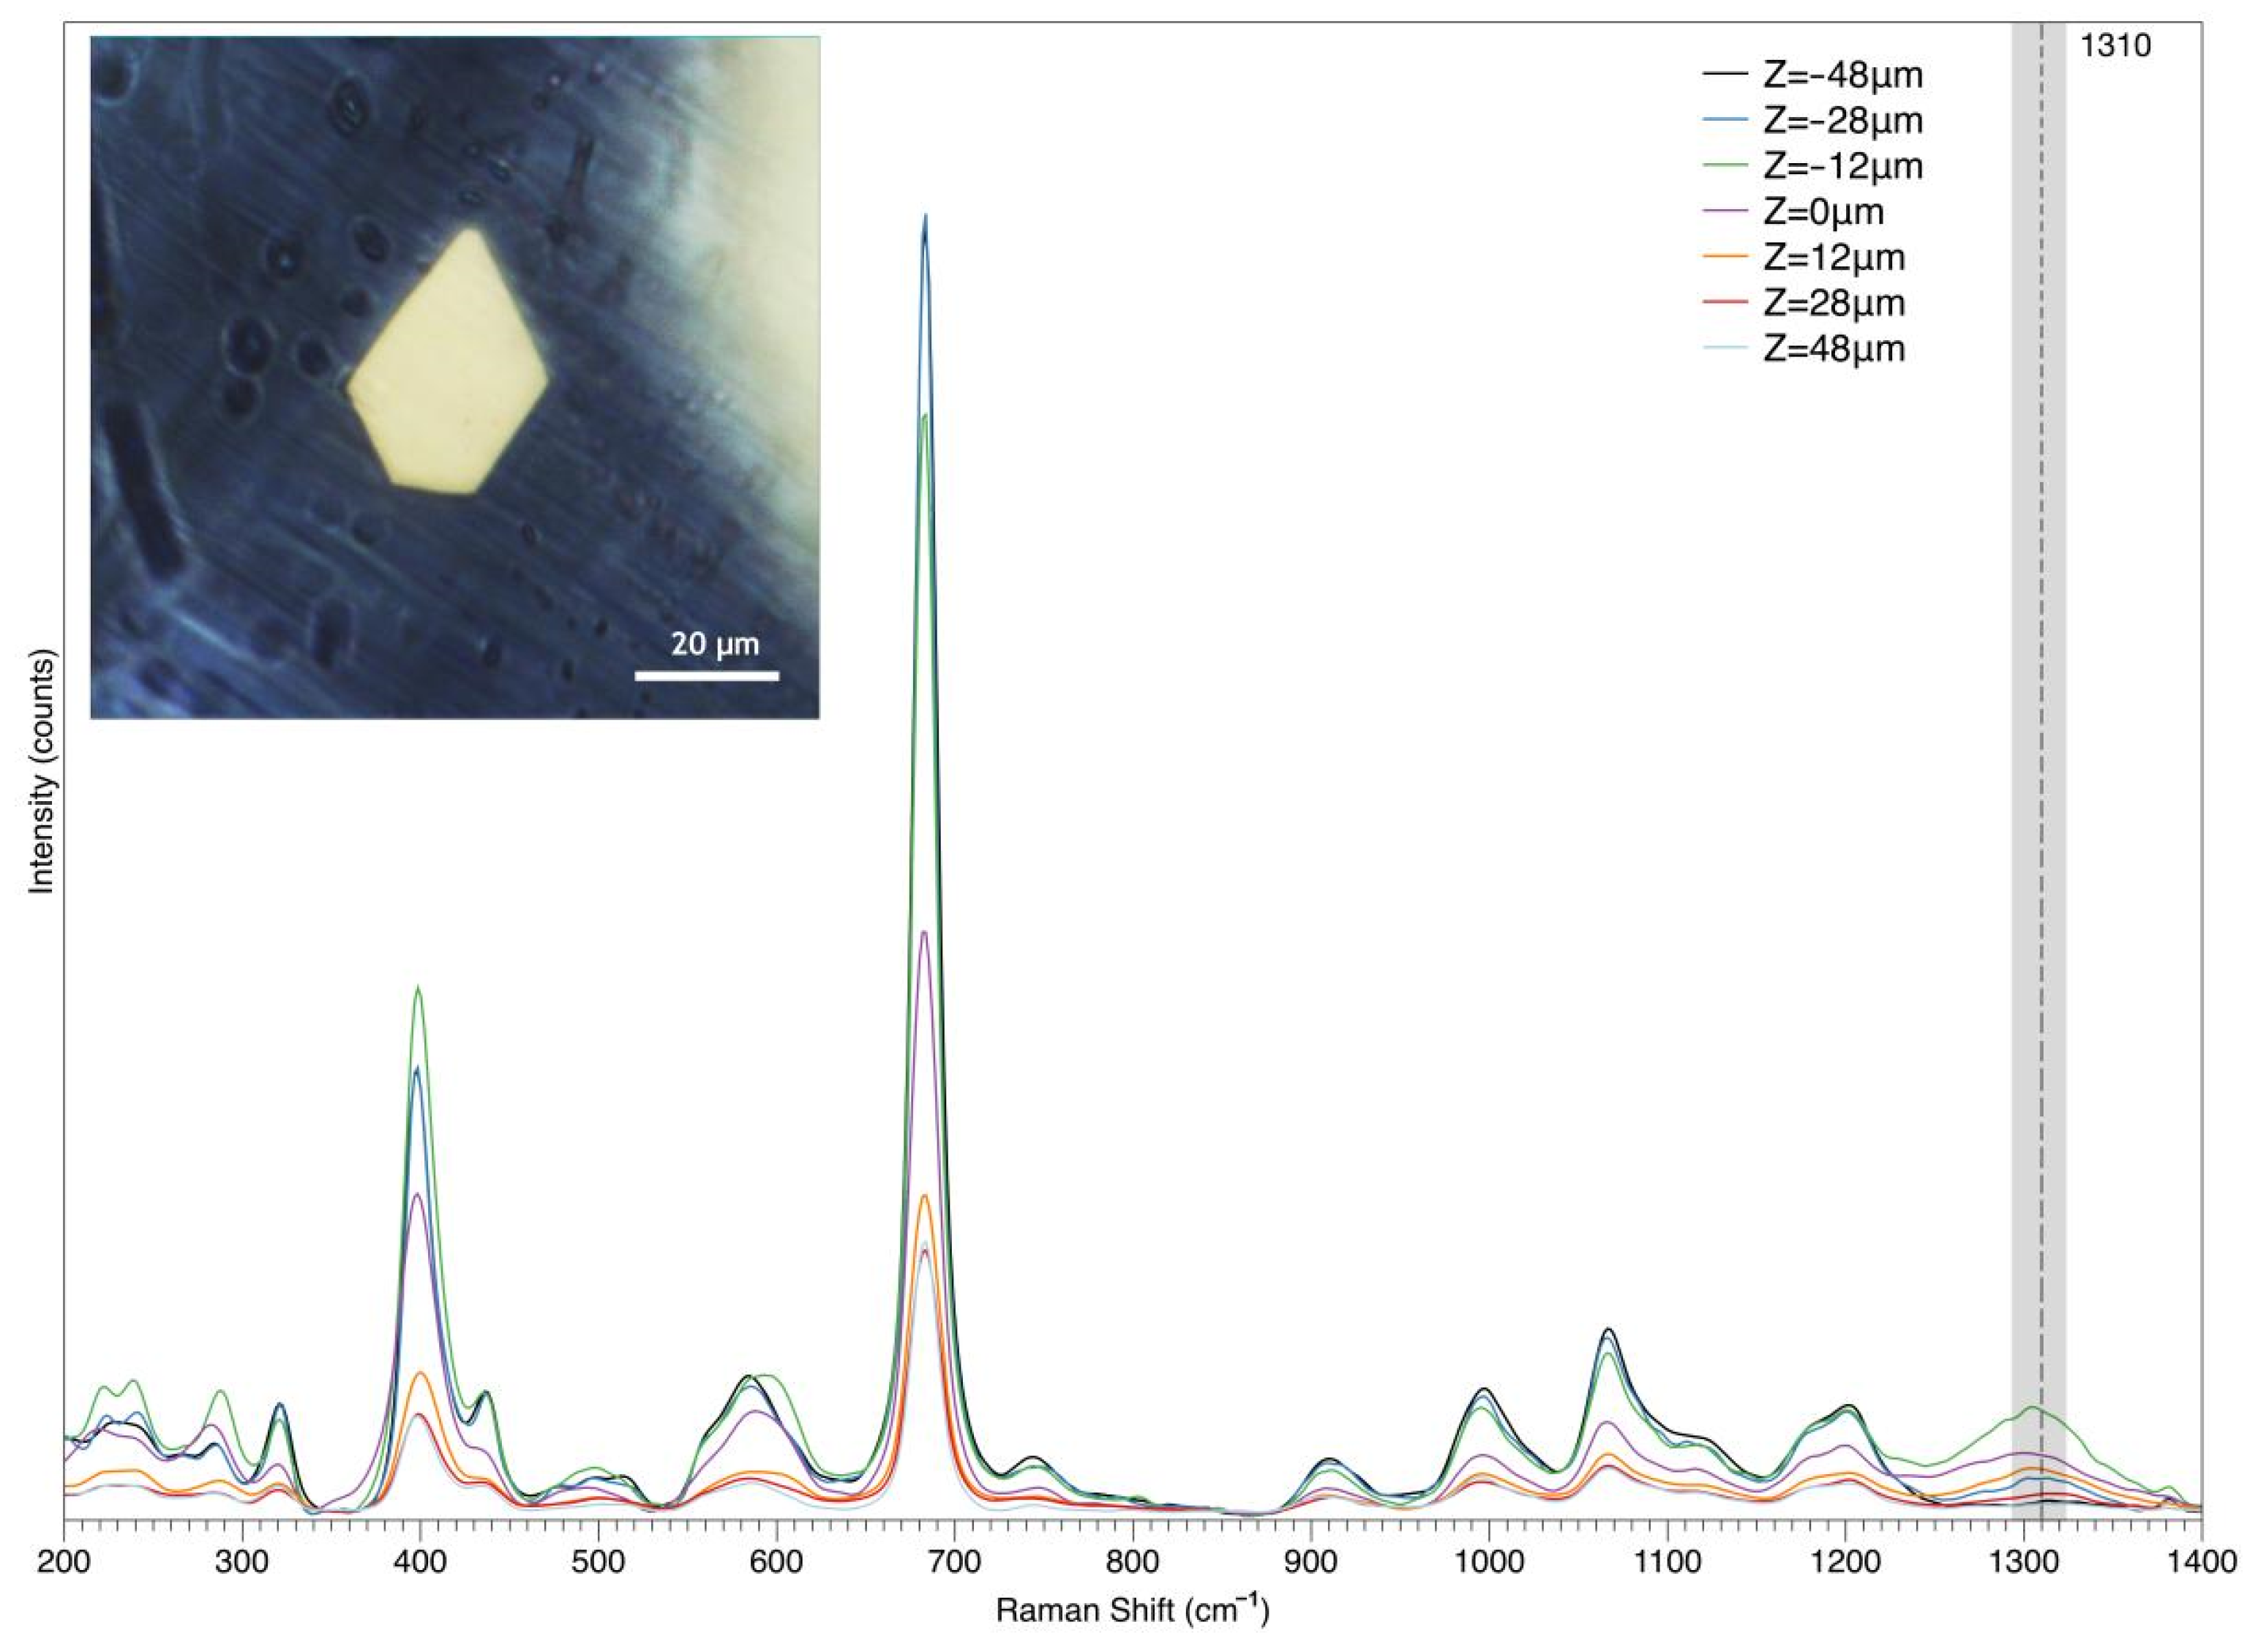
3.1.1. Magnetite
3.1.2. Hematite
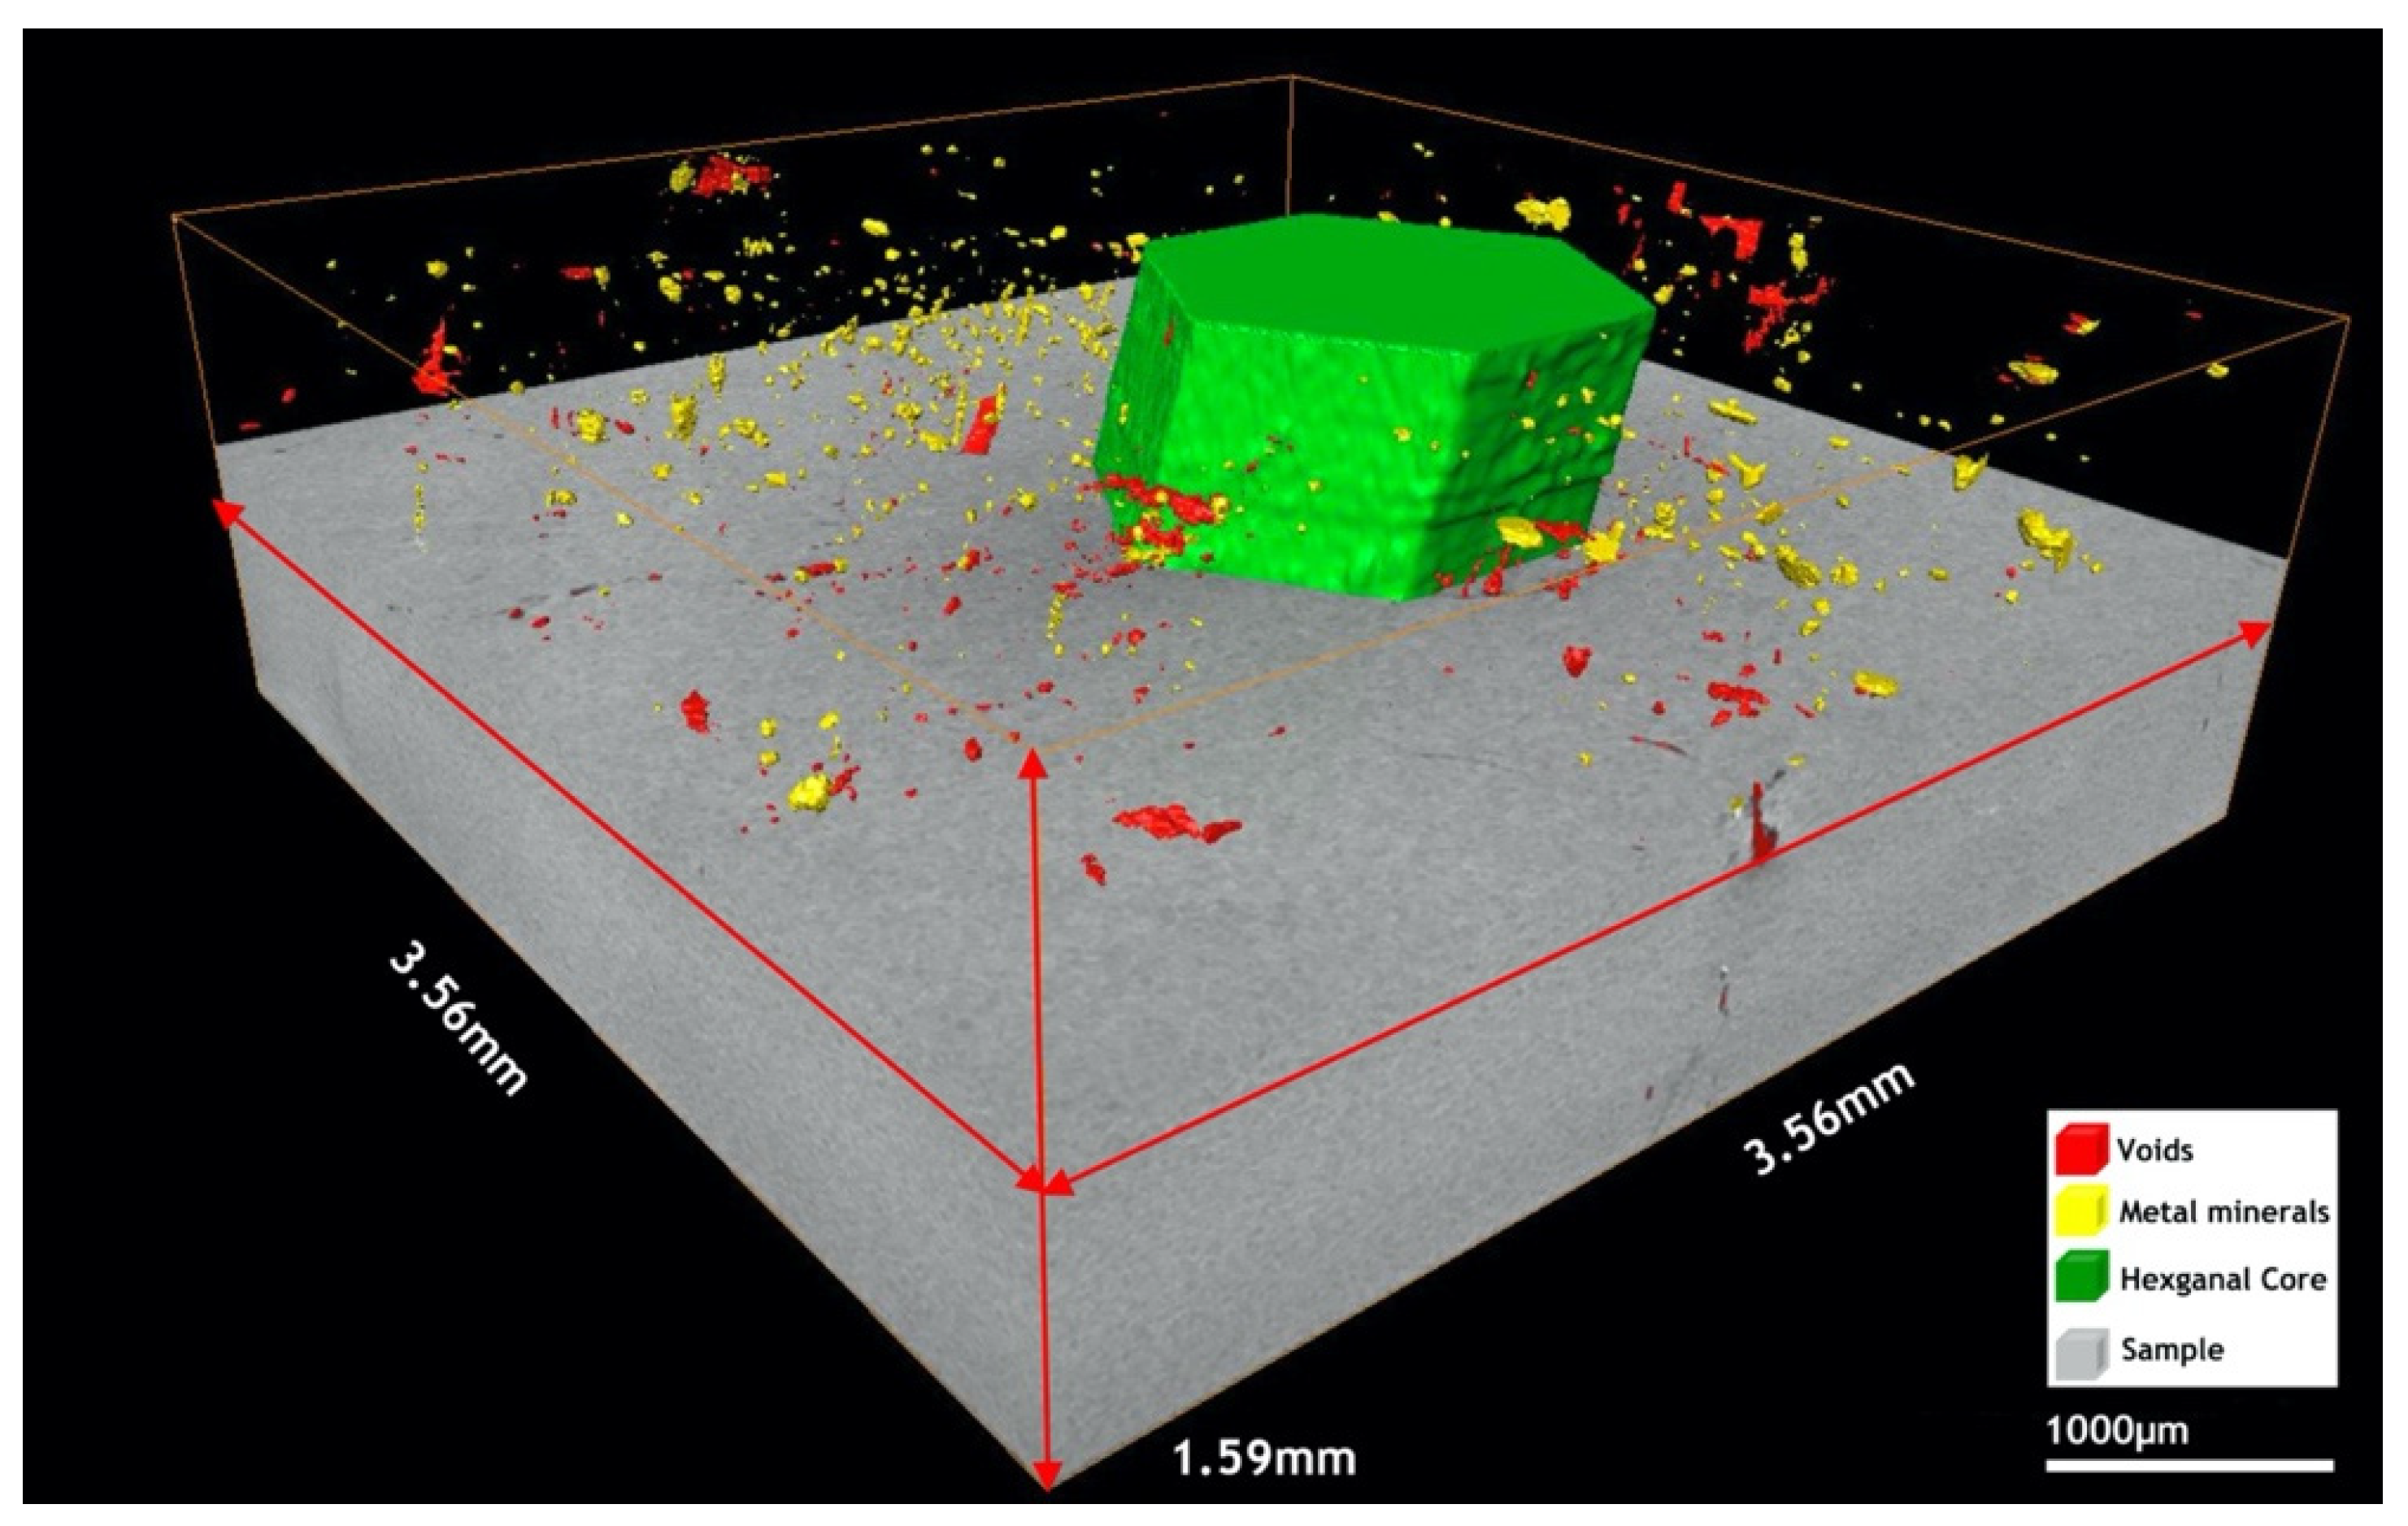
3.2. The Voids
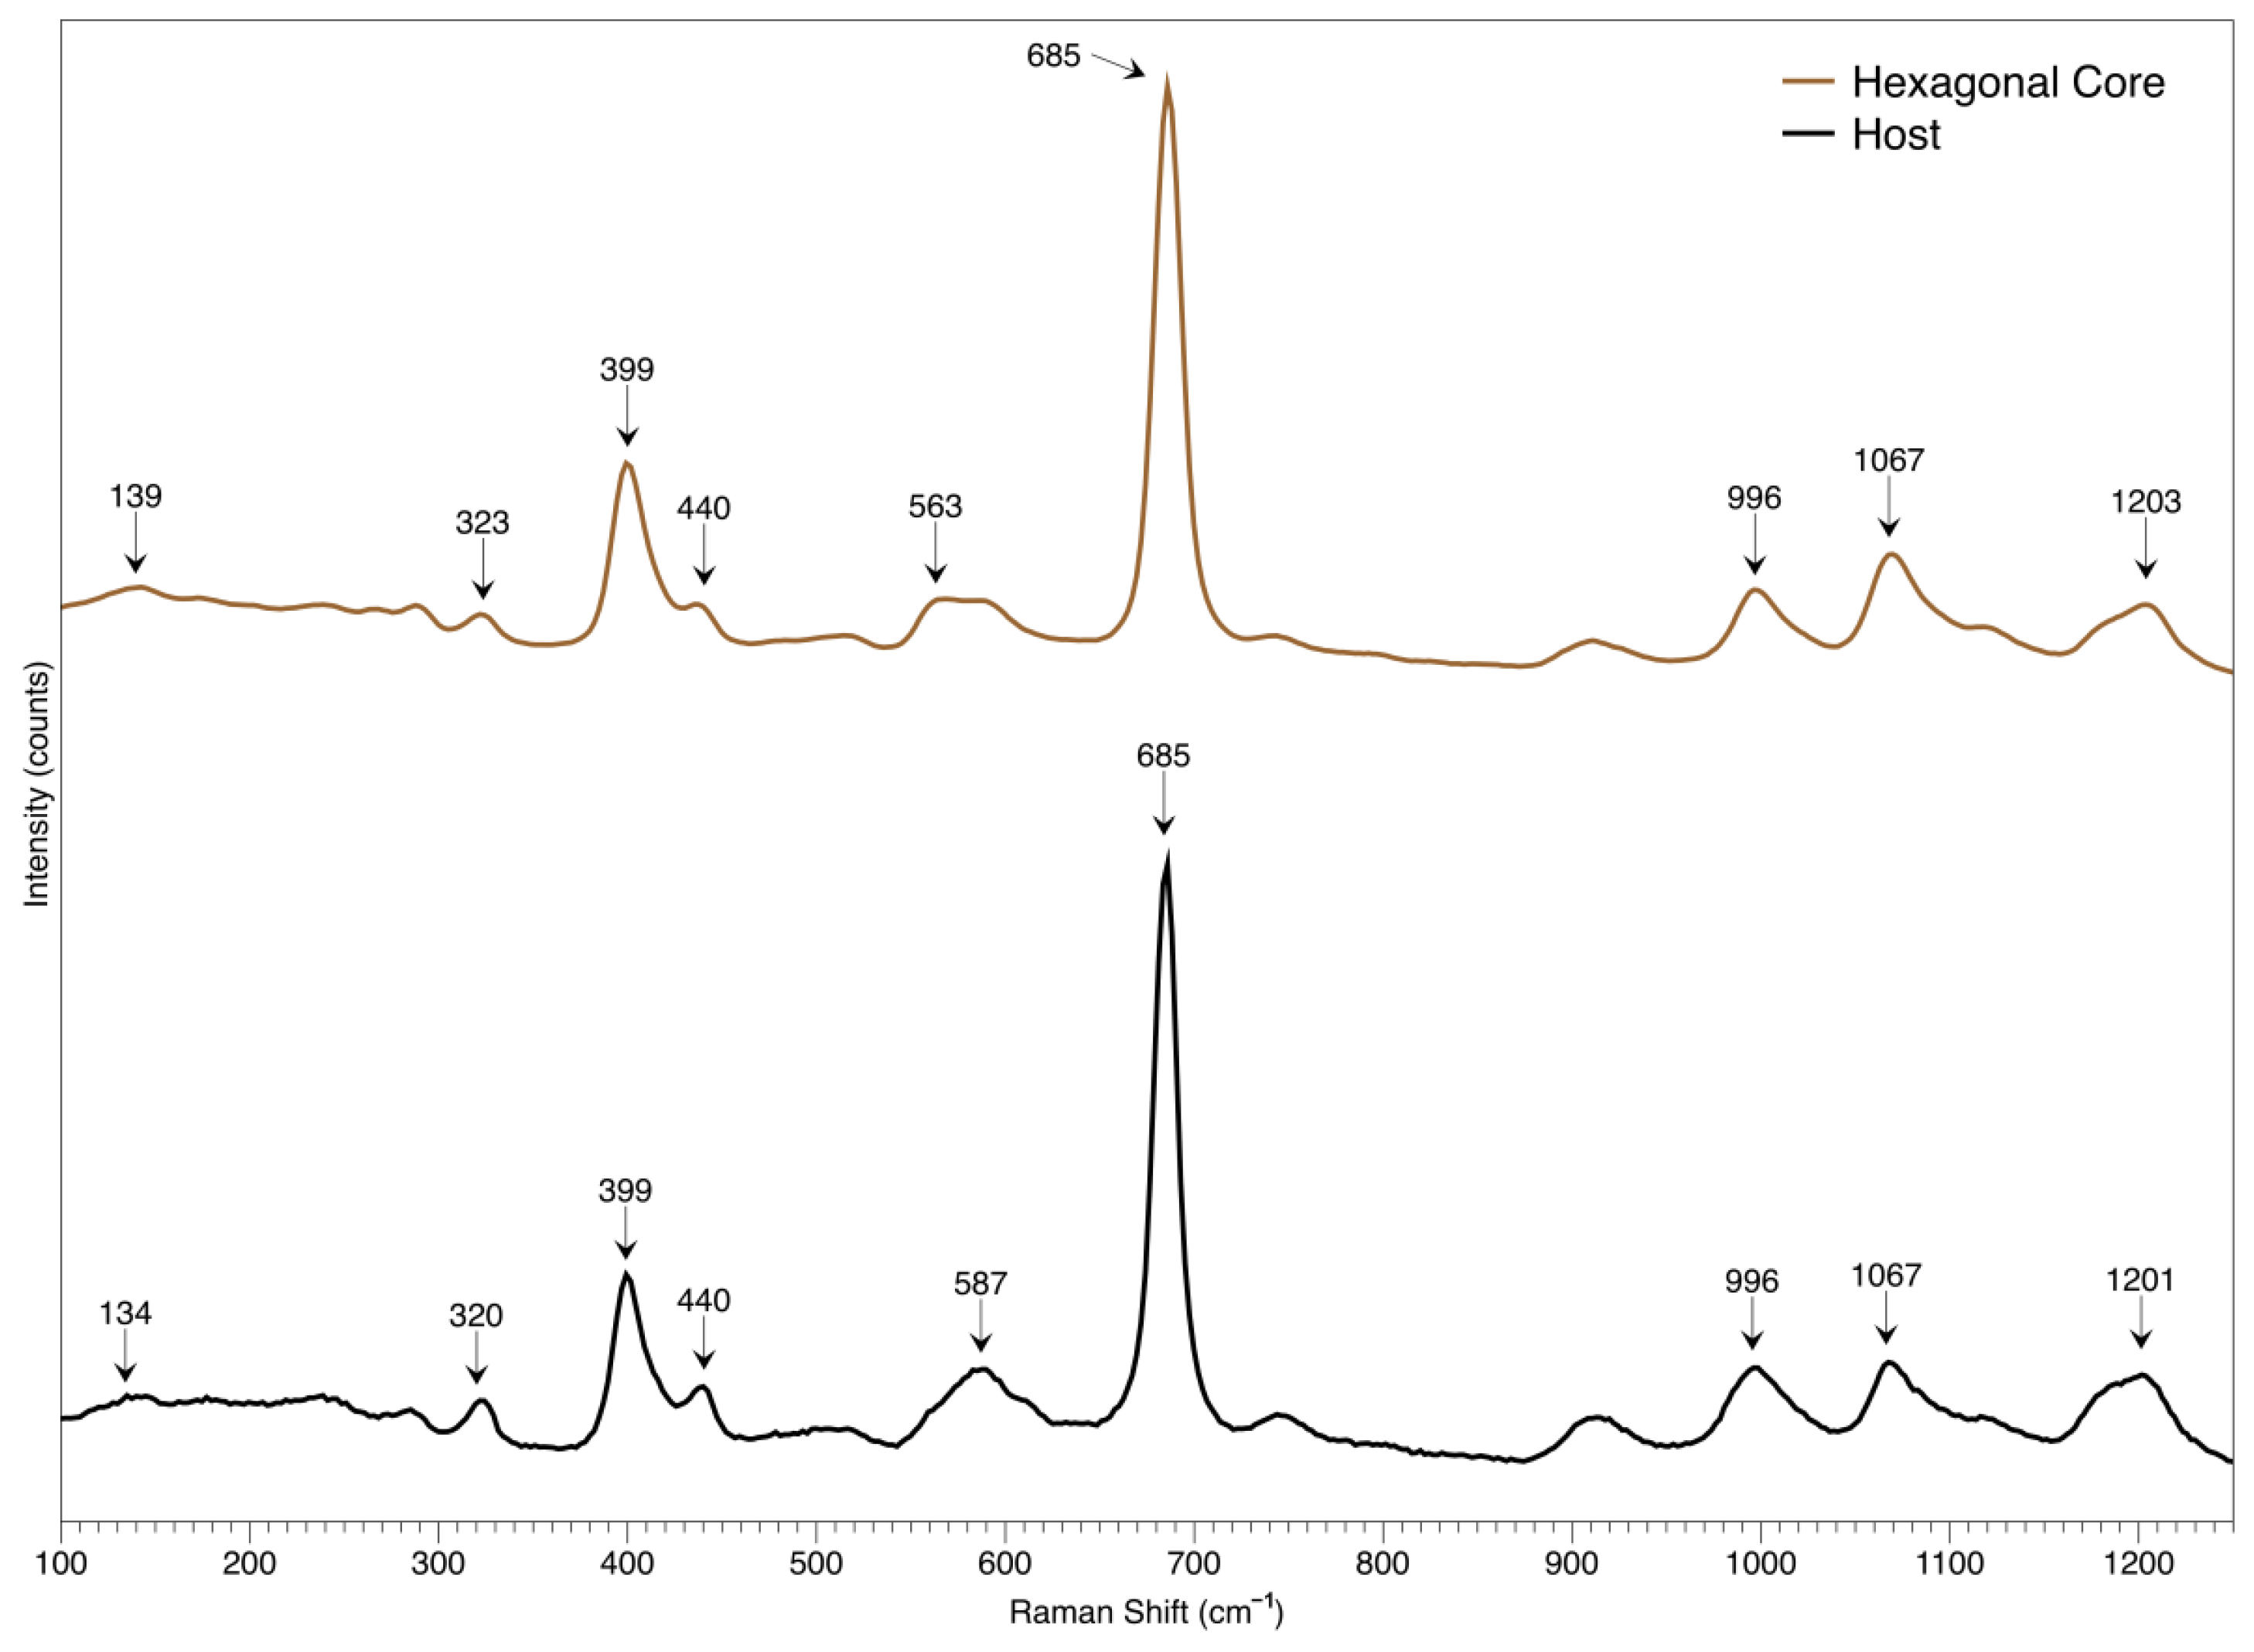
3.3. The Hexagonal Core
4. Conclusions
Author Contributions
Funding
Acknowledgments
Conflicts of Interest
References
- Gao, Y.; Sun, X. Uncover the Internal World of Gemstones Part II: Formation and Classification. Gemol. Front. 2020, 1, 211–226. [Google Scholar]
- Palke, A.C.; Saeseaw, S.; Renfro, N.D.; Sun, Z.; McClure, S.F. Geographic Origin Determination of Ruby. Gems Gemol. 2019, 55, 580. [Google Scholar] [CrossRef]
- Zwaan, J.C. Emeralds from the Kafubu area, Zambia. Gems Gemol. 2005, 41, 116–148. [Google Scholar] [CrossRef] [Green Version]
- Saeseaw, S.; Renfro, N.D.; Palke, A.C.; Sun, Z.; McClure, S.F. Geographic Origin Determination of Emerald. Gems Gemol. 2019, 55, 614. [Google Scholar] [CrossRef] [Green Version]
- Kaminsky, F.V.; Wirth, R.; Morales, L. Internal texture and syngenetic inclusions in carbonado. Can. Miner. 2013, 51, 39–56. [Google Scholar] [CrossRef]
- Koivula, J.I. Useful Visual Clue Indicating Corundum Heat Treatment. Gems Gemol. 2013, 49, 39. [Google Scholar] [CrossRef]
- Raman, C.V.; Krishnan, K.S. Polarisation of Scattered Light-quanta. Nature 1928, 122, 169. [Google Scholar] [CrossRef]
- Bersani, D.; Lottici, P.P. Applications of Raman spectroscopy to gemology. Anal. Bioanal. Chem. 2010, 397, 2631–2646. [Google Scholar] [CrossRef]
- Palanza, V.; Di Martino, D.; Paleari, A.; Spinolo, G.; Prosperi, L. Micro-Raman spectroscopy applied to the study of inclusions within sapphire. J. Raman Spectrosc. 2008, 39, 1007–1011. [Google Scholar] [CrossRef]
- Fritsch, E.; Gaillou, E.; Ostrooumov, M.; Rondeau, B.; Devouard, B.; Fritsch, E.; Gaillou, E.; Ostrooumov, M.; Rondeau, B.; Devouard, B. Relationship between nanostructure and optical absorption in fibrous pink opals from Mexico and Peru. Eur. J. Mineral. 2004, 16, 743–752. [Google Scholar] [CrossRef]
- Krzemnicki, M.S. Diopside Needles as Inclusions in Demantoid Garnet From Russia: A Raman Microspectrometric Study. Gems Gemol. 1999, 35, 192–195. [Google Scholar] [CrossRef]
- Kiefert, L.; Karampelas, S. Use of the Raman spectrometer in gemmological laboratories: Review. Spectrochim. Acta Part A Mol. Biomol. Spectrosc. 2011, 80, 119–124. [Google Scholar] [CrossRef]
- Eaton-Magaña, S.; Breeding, C.; Palke, A.; Homkrajae, A.; Sun, Z.; McElhenny, G. Raman and Photoluminescence Mapping of Gem Materials. Minerals 2021, 11, 177. [Google Scholar] [CrossRef]
- Johnson, M.L. Technological developments in the 1990s: Their impact on gemology. Gems. Gemol. 2000, 36, 380–397. [Google Scholar] [CrossRef] [Green Version]
- Sunagawa, I.; Yasuda, T.; Fukushima, H. Fingerprinting of two diamonds cut from the same rough. Gems. Gemol. 1998, 34, 270–280. [Google Scholar] [CrossRef]
- Diehl, R.; Herres, N. X-ray Fingerprinting Routine for Cut Diamonds. Gems Gemol. 2004, 40, 40–57. [Google Scholar] [CrossRef]
- Karampelas, S.; Michel, J.; Zheng-Cui, M.; Schwarz, J.-O.; Enzmann, F.; Fritsch, E.; Leu, L.; Krzemnicki, M.S. X-ray Computed Microtomography Applied to Pearls: Methodology, Advantages, and Limitations. Gems Gemol. 2010, 46, 122–127. [Google Scholar] [CrossRef] [Green Version]
- Krzemnicki, M.S.; Friess, S.D.; Chalus, P.; Hänni, H.A.; Karampelas, S. X-ray Computed Microtomography: Distinguishing Natural Pearls from Beaded and Non-Beaded Cultured Pearls. Gems Gemol. 2010, 46, 128–134. [Google Scholar] [CrossRef]
- Cnudde, V.; Boone, M.N. High-resolution X-ray computed tomography in geosciences: A review of the current technology and applications. Earth-Sci. Rev. 2013, 123, 1–17. [Google Scholar] [CrossRef] [Green Version]
- da Costa, M.F.; Kyle, J.R.; Lobato, L.M.; Ketcham, R.A.; e Silva, R.C.F.; Fernandes, R.C. Orogenic gold ores in three-dimensions: A case study of distinct mineralization styles at the world-class Cuiabá deposit, Brazil, using high-resolution X-ray computed tomography on gold particles. Ore Geol. Rev. 2021, 140, 104584. [Google Scholar] [CrossRef]
- Giuliani, G.; Boiron, M.C.; Morlot, C.; Raoul, J.; Chatagnier, P.Y. Demantoid garnet with giant fluid inclusion. Gems. Gemology. 2015, 51, 4. [Google Scholar]
- Richard, A.; Morlot, C.; Créon, L.; Beaudoin, N.; Balistky, V.S.; Pentelei, S.; Dyja-Person, V.; Giuliani, G.; Pignatelli, I.; Legros, H.; et al. Advances in 3D imaging and volumetric reconstruction of fluid and melt inclusions by high resolution X-ray computed tomography. Chem. Geol. 2019, 508, 3–14. [Google Scholar] [CrossRef]
- Heyn, R.; Rozendaal, A.; Du Plessis, A.; Mouton, C. Characterization of Coloured Gemstones by X-ray Micro Computed Tomography. Minerals 2021, 11, 178. [Google Scholar] [CrossRef]
- Bertrand, E. Compterendu de la séance du 13 Février 1879 Report of the meeting of February 13, 1879. Bull. Soc. Minéral. Fr. 1879, 2, 31. [Google Scholar]
- Pogue, J.E. The emerald deposits of Muzo, Colombia. Trans. Am. Inst. Min. Eng. 1916, 55, 383–406. [Google Scholar]
- Pignatelli, I.; Giuliani, G.; Ohnestetter, D.; Agrosì, G.; Mathieu, S.; Morlot, C.; Branquet, Y. Colombian Trapiche Emeralds: Recent Advances in Understanding Their Formation. Gems. Gemol. 2015, 51, 222–259. [Google Scholar] [CrossRef]
- Gao, Y.; Sun, X.; Shan, M. Trapiche emerald from Swat Valley, Pakistan. Gems Gemol. 2019, 55, 441–442. [Google Scholar]


| Parameters | Mag-02 | Hem-02 | |
|---|---|---|---|
| X | Range/μm | (−15, 15.9) | (−17.5, 17.5) |
| Step/μm | 0.8 | 3.9 | |
| Size | 40 | 10 | |
| Y | Range/μm | (−9.7, 7) | (−23.1, 19.9) |
| Step/μm | 0.8 | 3.9 | |
| Size | 22 | 12 | |
| Z | Range/μm | (−5, 7) | (−100, 100) |
| Step/μm | 0.5 | 4 | |
| Size | 25 | 51 | |
| Total Volume/μm3 | 6212.4 | 301,000 | |
| Total Time | 36 h 30 min | 14 h 21 min | |
| Total Spectrum | 22,000 | 6120 | |
Publisher’s Note: MDPI stays neutral with regard to jurisdictional claims in published maps and institutional affiliations. |
© 2022 by the authors. Licensee MDPI, Basel, Switzerland. This article is an open access article distributed under the terms and conditions of the Creative Commons Attribution (CC BY) license (https://creativecommons.org/licenses/by/4.0/).
Share and Cite
Gao, Y.; He, M.; Li, X.; Lin, M.; Sun, X.; Zhang, Y. Gemstone Inclusion Study by 3D Raman-Mapping and High-Resolution X-ray Computed Tomography: The Case of Trapiche Emerald from Swat, Pakistan. Crystals 2022, 12, 1829. https://doi.org/10.3390/cryst12121829
Gao Y, He M, Li X, Lin M, Sun X, Zhang Y. Gemstone Inclusion Study by 3D Raman-Mapping and High-Resolution X-ray Computed Tomography: The Case of Trapiche Emerald from Swat, Pakistan. Crystals. 2022; 12(12):1829. https://doi.org/10.3390/cryst12121829
Chicago/Turabian StyleGao, Yujie, Mingyue He, Xu Li, Moqing Lin, Xueying Sun, and Yanfang Zhang. 2022. "Gemstone Inclusion Study by 3D Raman-Mapping and High-Resolution X-ray Computed Tomography: The Case of Trapiche Emerald from Swat, Pakistan" Crystals 12, no. 12: 1829. https://doi.org/10.3390/cryst12121829
APA StyleGao, Y., He, M., Li, X., Lin, M., Sun, X., & Zhang, Y. (2022). Gemstone Inclusion Study by 3D Raman-Mapping and High-Resolution X-ray Computed Tomography: The Case of Trapiche Emerald from Swat, Pakistan. Crystals, 12(12), 1829. https://doi.org/10.3390/cryst12121829