Article

Development and Testing of Zinc Oxide Embedded Sulfonated Poly (Vinyl Alcohol) Nanocomposite Membranes for Fuel Cells

by
Ahmed Al Otaibi
1,
Mallikarjunagouda B. Patil
2,*,
Shwetarani B. Rajamani
2,
Shridhar N. Mathad
3,
Arun Y. Patil
4,
M. K. Amshumali
5,
Jilani Purusottapatnam Shaik
6,
Abdullah M. Asiri
7,8 and
Anish Khan
7,*
1
Chemistry Department, Faculty of Science, University of Hi’al, P.O. Box 2440, Ha’il 81451, Saudi Arabia
2
Bharat Ratna Prof. CNR Rao Research Centre, P. G. Department of Chemistry, Basaveshwar Science College, Bagalkot 587101, India
3
Department of Engineering Physics, K.L.E Institute of Technology, Hubballi 580030, India
4
School of Mechanical Engineering, KLE Technological University, Vidya Nagar, Hubballi 580031, India
5
Department of Industrial Chemistry, Vijayanagara Sri Krishnadevaraya University, Ballari 583105, India
6
Department of Biochemistry, College of Science, King Saud University, Riyadh 11451, Saudi Arabia
7
Center of Excellence for Advanced Materials Research, King Abdulaziz University, Jeddah 21589, Saudi Arabia
8
Chemistry Department, Faculty of Science, King Abdulaziz University, Jeddah 21589, Saudi Arabia
*
Authors to whom correspondence should be addressed.
Crystals 2022, 12(12), 1739; https://doi.org/10.3390/cryst12121739
Submission received: 27 September 2022 / Revised: 4 November 2022 / Accepted: 18 November 2022 / Published: 1 December 2022

Abstract

:
The sol-gel technique was adopted to synthesize the zinc oxide (ZnO) nanoparticles. Nano-sized ZnO particles are embedded in-situ to the poly(vinyl alcohol) (PVA) matrix to form the nanocomposite polymeric membranes. The nanocomposite membranes were fabricated by varying concentration of ZnO nanoparticles of 2.5, 5, and 10 wt.% in the base PVA membrane matrix. The membranes were crosslinked using tetraethyl orthosilicate (TEOS) followed by hydrolysis and co-condensation. Immersion in a 2 molar sulphuric acid (H2SO4) bath produced sulfonated membranes. The membranes were characterized using Fourier transform infrared (FTIR) and scanning electron microscopy (SEM). The fabricated nano-composite membranes are being evaluated for proton exchange membrane fuel cell research (PEMFC). The computed test results demonstrate that increasing the concentration of ZnO in the membrane increased the ionic exchange capacity and proton conductivity efficiency of the nano-composite membranes. The incorporation of a quantum quantity of ZnO particles in the membrane improved the presentation in terms of proton conductivity characteristics. Membranes demonstrated excellent proton conductivity (10−2 S cm−1 range) while consuming less hydrogen gas. The highest measured proton conductivity is observed for 10 wt.% ZnO embedded PVA membrane and the value is 15.321 × 10⁻² S cm−1 for 100% RH. The combination of ZnO and PVA nanocomposite membrane is a novel, next-generation eco-friendly method that is economical and convenient for large-scale commercial production in fuel cell applications.

1. Introduction

The consumption of energy for domestic and industrial utility across the globe has been elevated dramatically. It has been estimated that the energy consumption will be raised up to 56% in the year 2040 and the reason behind this rise is modernization factors such as huge quantity of urbanization and uncontrolled population growth. This ends up with an overburden of the energy demand. To address this severe difficulty, alternative energy generation technologies have emerged in recent years. Among the newer technologies that have emerged in recent years, fuel cell (FC) is found to be most promising [1]. FC technology is believed to be as efficient in current generating and it provides clean energy for domestic applications, automobiles and portable power generator tools in the 21st century [2,3,4,5]. On a basic level, an FC is an electrochemical power generating instrument that instantly turns the chemical energy fuel (such as hydrogen, natural gas, methanol, ethanol, etc.) into electric energy with water and heat as byproducts as long as fuel and oxidizing agents are provided [6]. Using liquid fuels such as methanol and ethanol in FCs reduces the need to build entirely new substructures, since it is required when using hydrogen as a fuel source [7]. It is worth quoting that, currently, bioethanol dominates the global biofuel production capacity and can be produced in bulk from biomass feedstocks via a fermentation process [8,9]. Despite global reforms to decrease greenhouse gas (GHG) discharges in several sectors, emissions from the transportation sector, in particular, have increased dramatically in recent years. The share of total carbon dioxide emissions attributed to road transportation in the European Union (EU) increased from 16% in 1990 to 26% in 2018, with road transportation emissions increasing by 24% while net emission decreased by 23% [10]. As a countermeasure, many states have adopted strategies for total zero-emission public vehicle sales goals [11]. Working towards the zero emission target, from the beginning of 2035, the EU has projected a ban on new hydrocarbon fuel origins such as petrol and diesel cars to accelerate the transition [12]. Furthermore, automobile manufacturers in the EU, particularly truck manufacturers, need to reduce emitted CO2 from new trucks by 30% by 2030 compared to levels in 2019–2020 [13,14]. In this regard, fuel cell technology is regarded as an alternative energy source. This generates clean and environmentally friendly fuel.
The resources employed in synthesizing the polymer electrolyte membranes, also known as PEMs, can be categorized into five different groups, namely, (1) partially-fluorinated polymers, (2) perfluorinated ionomers, (3) non-fluorinated polymeric membranes with aromatic backbones (4) non-fluorinated hydrocarbons, and, (5) acid-base complexes [15,16,17]. Several inorganic species have been used as fillers in various polymeric membranes developed to use proton exchange membrane fuel cells (PEMFC). Among various approaches applied to blending, incorporating inorganic fillers into polymer matrix, an in situ method and sol-gel synthesis route [18,19], have gained more attention due to their extensive accessibility.
The amalgamation of inorganic particles/fillers in organic polymeric membranes (inorganic-organic hybrid membranes) has exploited a noteworthy arrangement of awareness over the last few years. The reason behind it is that the induced persuasion of the inorganic and organic phases towards proton conductivity and stability of the membrane, apart from this cost effectiveness, posesses better water retention by means of crosslinking and also hindering fuel crossover by enhancing the transport pathway tortuousness. By considering the above points, the authors developed nanocomposite membranes and tested for PEMFC.
Several researchers [20,21,22] have investigated the tunable characteristics of PVA nanofiber membranes and enhanced their capability to filter gaseous substance and aqueous substances. Most studies, however, have focused on increasing the hydrophilicity of PVA electrospun membranes rather than their lipophilicity. Increasing the lipophilic properties of PVA membranes can aid in the removal of harmful substances from oil or the separation of oil and water [23]. The combination of ZnO with crosslinked sulfonated PVA in the evaluation of fuel cell application is a novel approach and is not reported elsewhere. In the current study, the performance of nano-sized ZnO was evaluated by embedding in the base PVA membrane matrix with varying ZnO nanoparticles concentration and measuring fuel cell performance. The fuel cell tests were carried out on the prepared hybrid membranes. This article will discuss fillers and their effects on proton conductivity, mechanical and thermal properties, and fuel cell performance, resulting in modified nanocomposite membranes.

2. Experimental

2.1. Materials

Polyvinyl alcohol (PVA) of viscosity: 54.0–66.0 mPa s−1 and Tetraethoxysilane (TEOS, >98%) were supplied by Sigma-Aldrich. Zinc acetate dihydrate (Zn(CH3COO)2.2H2O), HCL, and ammonia (NH4OH) were purchased from s.d. Fine Chemicals, India. All the chemicals taken for the experiment were of reagent grade. Two stage distilled water has been used during the course of experiment.

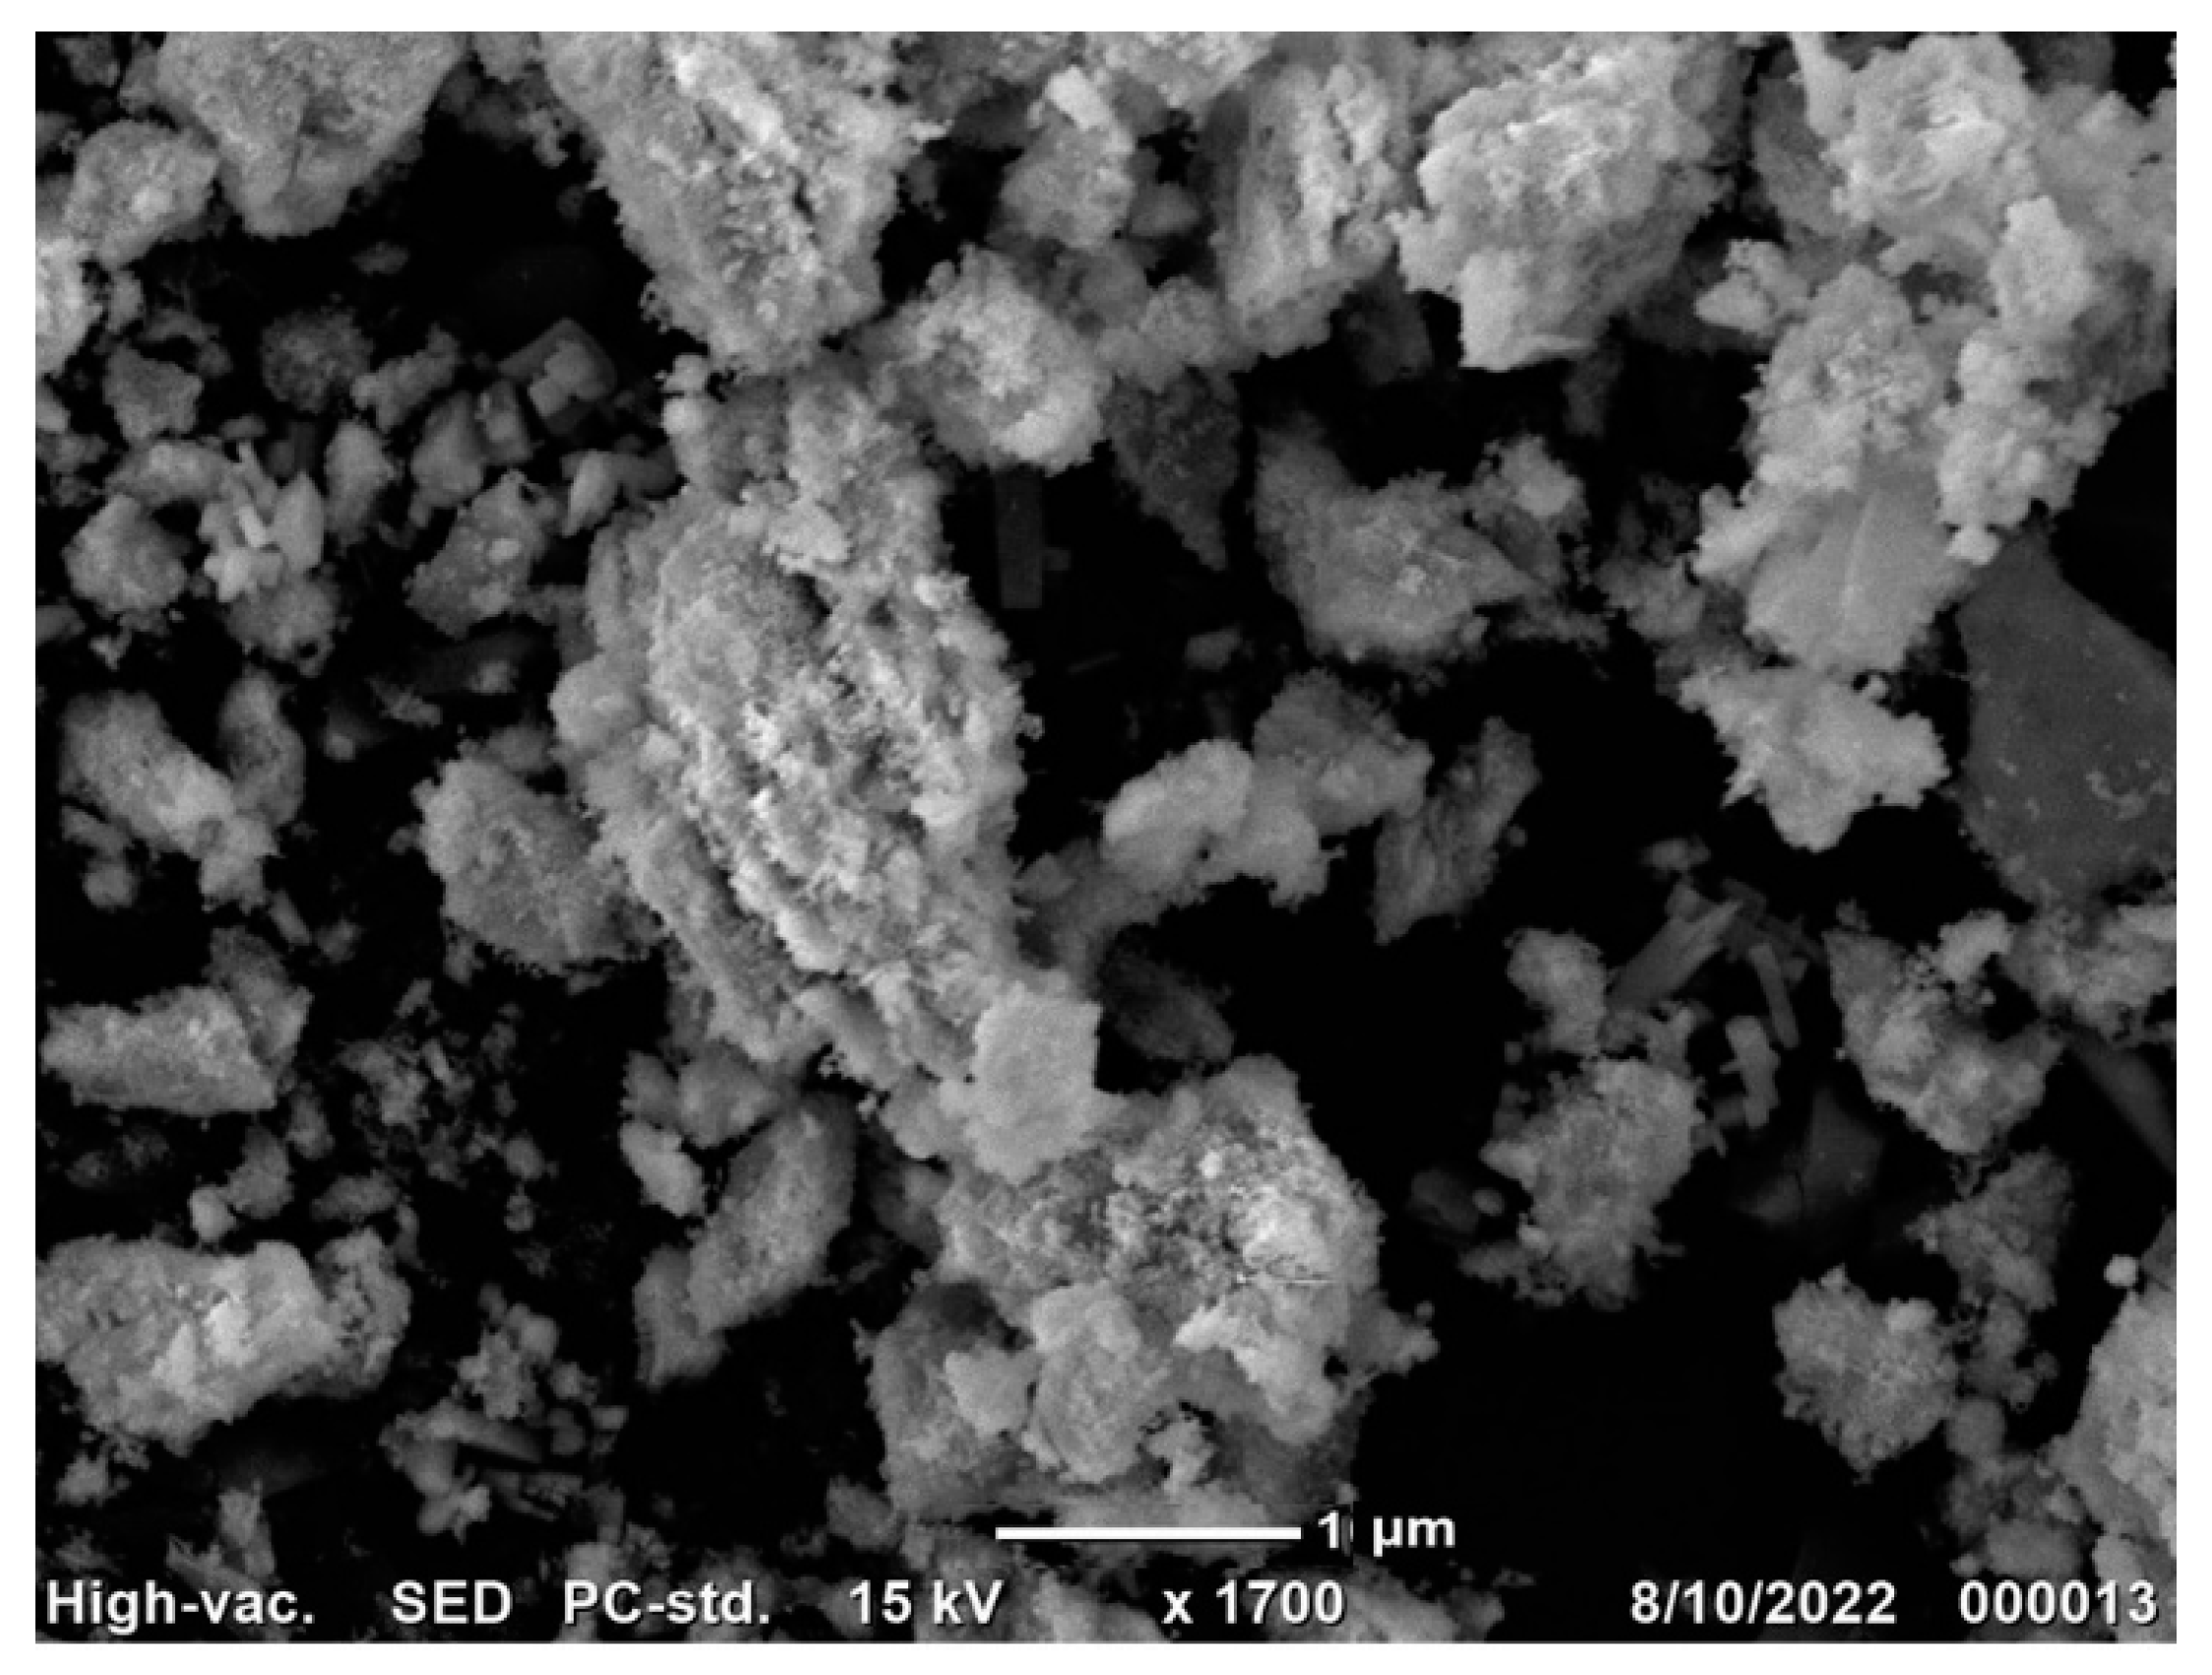
2.2. Synthesis of ZnO NP’s by Sol-Gel Method

A 0.6 M Zn(CH3COO)2·2H2O solution was prepared by mixing 13 gm of zinc acetate in methanol and stirring constantly at room temperature to obtain homogeneity. To obtain a transparent sol, the solution was stirred at 600 rpm for 2 h at 80 °C. The pH of the sol was adjusted by adding NH4OH between 9 and 11. After fine-tuning the pH, the sol was dried out at 100 °C for 2 h. Following this step, the temperature was raised to 200 °C until gelatin formation occured. The precipitate was curdy white in color, and the sol was filtered off, washed with methanol several times, and finally dried at 250 °C. Once dried, the sol was calcined in a muffler furnace at 500 °C for 4 h. The temperature in the furnace was increased with a ramp rate of 2 °C. The resultant white colored powder was zinc oxide nanoparticles. The obtained product was weighed and found to be 3.75 g.
The desertion of water followed by the respective disintegration of zinc acetate was carried out in the reaction. According to the literature, ZnO crystallization occurs at around 250 °C via the following reaction [24,25]:
Z n ( C H 3 C O O ) 2 · 2 H 2 O Z n ( C H 3 C O O ) 2 + 2 H 2 O Z n ( C H 3 C O O ) 2 + 2 R O H Z n O + 2 C H 3 C O R + H 2 O

2.3. Preparation of Crosslinked Nanocomposite Membranes

PVA (6 g) was made soluble in 95 mL of water by stirring continuously at a temperature of 70 °C until the solution became clear and homogeneous. Known weights of synthesized ZnO nanoparticles (2.5, 5, and 10 wt.% with gravimetric ratio to PVA) were suspended in 5 mL of water, sonicated for 90 min (Make: Aczet, Model: CUB), and then added to the prepared PVA solution. The solution was stirred for approximately 2 h to achieve a homogeneous solution; a light white-colored solution was obtained. In the reaction vessel, 0.5 g of TEOS and 4–5 drops of HCl were added as a catalyst, and the solution was vigorously stirred at 70 °C for 6 h. The resulting mixture was then slowly dropped onto a dry and clean glass surface using a membrane applicator (Elcometer, Model: 3580) to obtain nanocomposite membranes with uniform thickness. The casted membranes were dried in a dust-free environment at room temperature before being peeled off the glass surface and properly stored. Figure 1 depicts a schematic diagram of the nanocomposite membrane.

2.4. Sulfonation of the Membranes

The prepared membranes were soaked in to the 2 N H2SO4 solvent bath overnight. During this period, the ion exchange took place by SO−4 exchange onto the surface of the nanocomposite membrane. This facilitated the subsequent ion transfer in proton exchange. The hybrid composite membranes are named as M_1, M_2 and M_3, containing 2.5, 5, and 10 wt.% of ZnO, respectively. Table 1 shown the naming of the nanocomposite membranes with their varying ZnO concentration.

2.5. Membrane Characterization

2.5.1. Fourier Transmission Infrared (FTIR) Spectroscopic Studies

FTIR spectra were taken for pristine PVA membrane and ZnO nanoparticle-incorporated PVA membrane. The membranes were scanned to verify that the incorporated ZnO was impregnated in the molecular level using an FTIR spectrometer (Make: Shimadzu Model: IR Affinity-I). The membrane sample was thoroughly mixed with KBr until the mixture was homogeneous, and pellets were formed under the influence of a hydraulic pressure of 450 kg/cm2. The prepared pellets were scanned between 400 and 4000 cm−1.

2.5.2. X-ray Diffraction Studies

The powder X-ray diffractometer was used to investigate the solid-state morphology of synthesized ZnO. (Make: Siemens Model: D 5000). The Cu Kα source generated X-rays with a wavelength of 1.5406 Å. The angle of diffraction, 2θ was varied from 0° to 65° to identify ZnO nanoparticles and any changes in the crystal structure and intermolecular distances between the inter-segmental chains. To achieve a good result, the step-size for the 2θ scan was 0.02°.

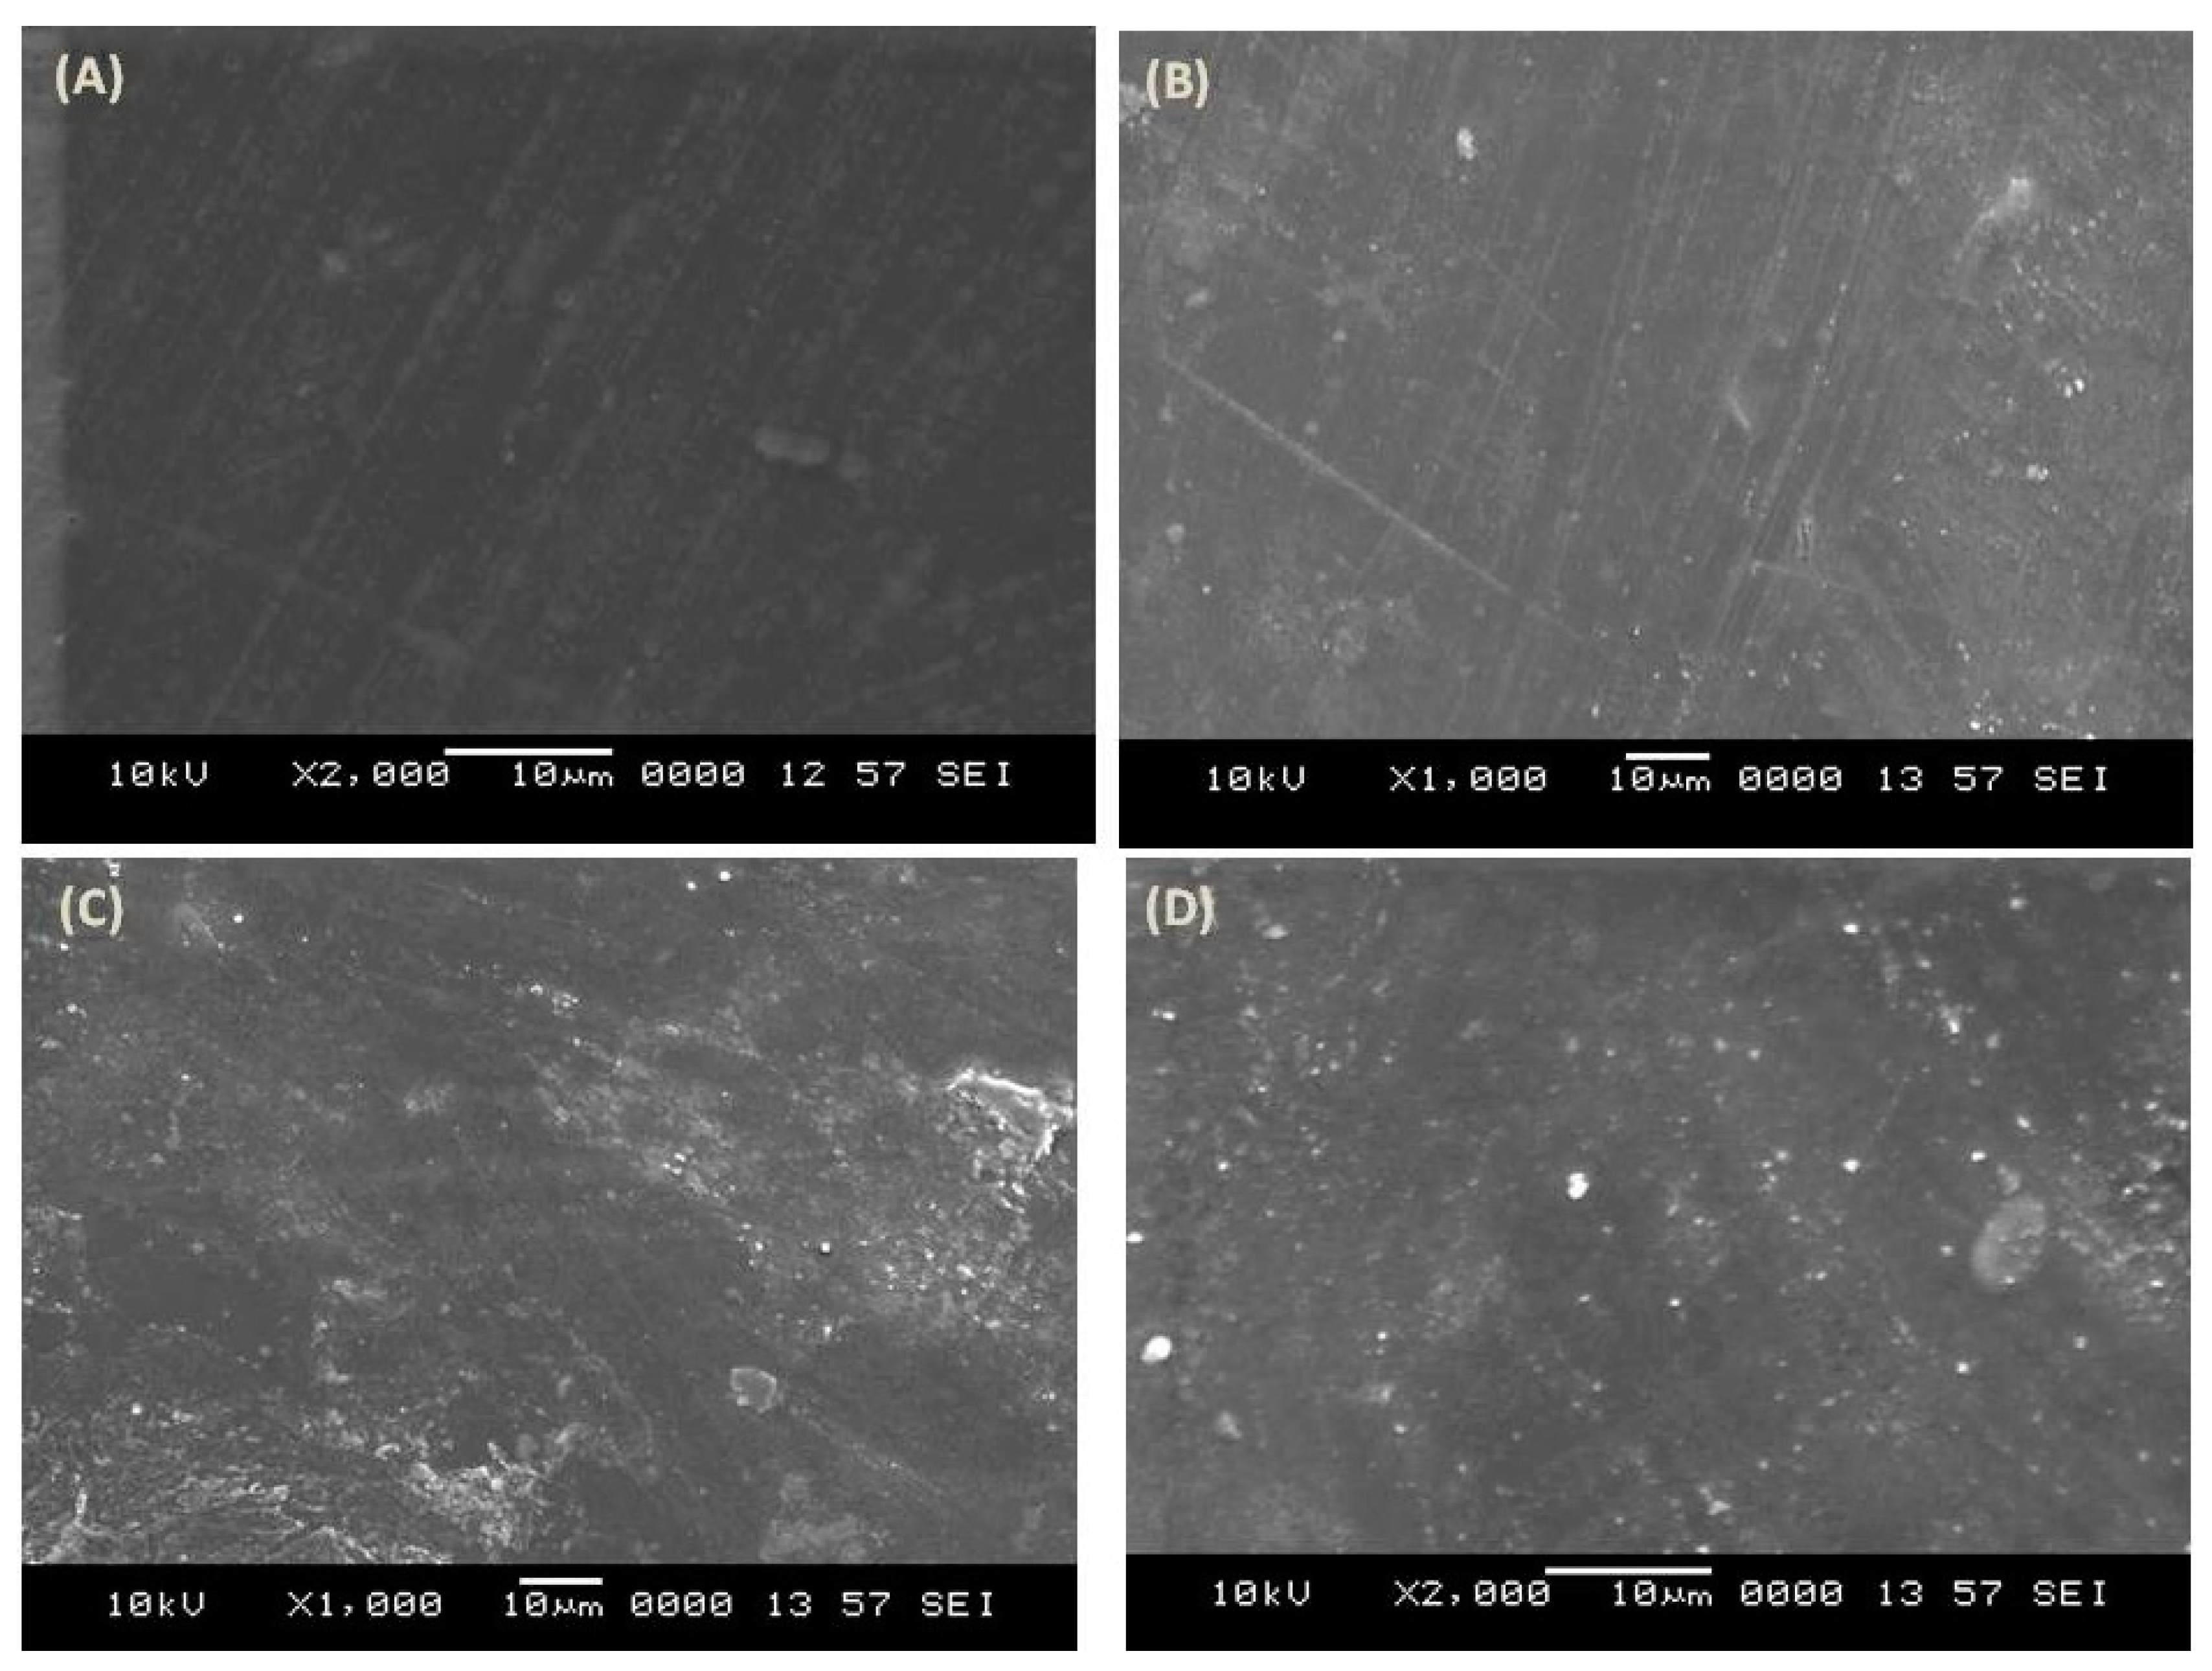
2.5.3. Scanning Electron Microscopy (SEM) Studies

SEM images of ZnO NPs were incorporated with PVA membrane and were taken crosslinked with TEOS. Before taking the images, the membranes were sputtered by gold to formulate the membrane becoming conductive and positioned on copper stub. Images were taken by using a scanning electron microscope (SEM) analyzer (Make: JOEL, MODEL: JSM 840A) at high resolution of Mag. 300X 5 kV. The operating voltage applied was 10–15 kV. At this applied voltage, the secondary electrons are generated near the surface of the sample and provide topographic information. The energy-dispersive analysis of X-ray (EDAX) embedded with FESEM at 15 kV was used to examine the surface morphology and chemical composition of the structures to examine the individual structure morphology and comprehend the growth dynamics.

2.5.4. Measurement of Particle Size

The particle size of completely dried ZnO was measured on a Zetasizer with a sample adapter (Model 3000HS, Malvern, UK). Before placing the particles on a cuvette holder, they were dispersed in distilled water and the zeta average diameter of the ZnO particles wasre measured. To avoid contamination, the sample cuvette was thoroughly washed shortly after the measurement. The average particle size was calculated after measuring the particle size three times.

2.5.5. UV–Visible Analysis

A Shimadzu UV spectrophotometer was employed in the measurement of the interaction of the polymer and nanoparticles to confirm the formation of nanocomposite. The UV-visible spectrum in a quartz cuvette was measured using a UV 1800 UV-Vis spectrophotometer (Japan). Between 200 and 800 nm, the PVA solution and ZnO-embedded PVA samples were examined.

2.5.6. Mechanical Properties

Plain PVA and sulfonated ZnO-loaded PVA membrane were tested for mechanical properties by means of universal testing machine (UTM) (Make: Hounsfield, Model H 25 KS, UK) containing operational load head with capacity of 5 kN; the test method is followed as per the protocol of ASTM D-638. Cross sectional area of the membrane of fixed thickness and width was computed. The strips of membrane were fixed between holders of the measuring device. The measuring length was fixed exactly at 5 cm, while the testing speed was set at 5 mm/min. Tensile strength of the membranes was computed by the (1) [26]:
T e n s i l e S t r e n g t h = M a x   L o a d C r o s s   S e c t i o n a l   A r e a

2.5.7. Ion Exchange Capacity (IEC)

The ion exchange capacity of the prepared membranes was measured using acid-base titration. The extent of crosslinking and the ion exchange capacity (IEC) of the polymer were calculated. The overall number of functional groups in the polymer prior to and after the crosslinking reaction is represented by the IEC value. This gives a clear picture of the extent of crosslinking. In fact, IEC denotes the number of mill equivalents of ions contained in 1 g of dried-up polymer [27]. The ion exchange capacity was calculated using the Formula (2):
I E C = ( ( B P ) × 0.1 × 5 m )
where: The normality of H2SO4 is indicated by 0.1, B indicates H2SO4 for blank sample neutralization, while P also denotes H2SO4, but for copolymeric membrane neutralization.
-Number 5 indicates the factor corresponding to the ratio of the amount of NaOH consumed to dissolve the polymer to the amount used for titration and
-m is the weight of the polymeric sample in g.

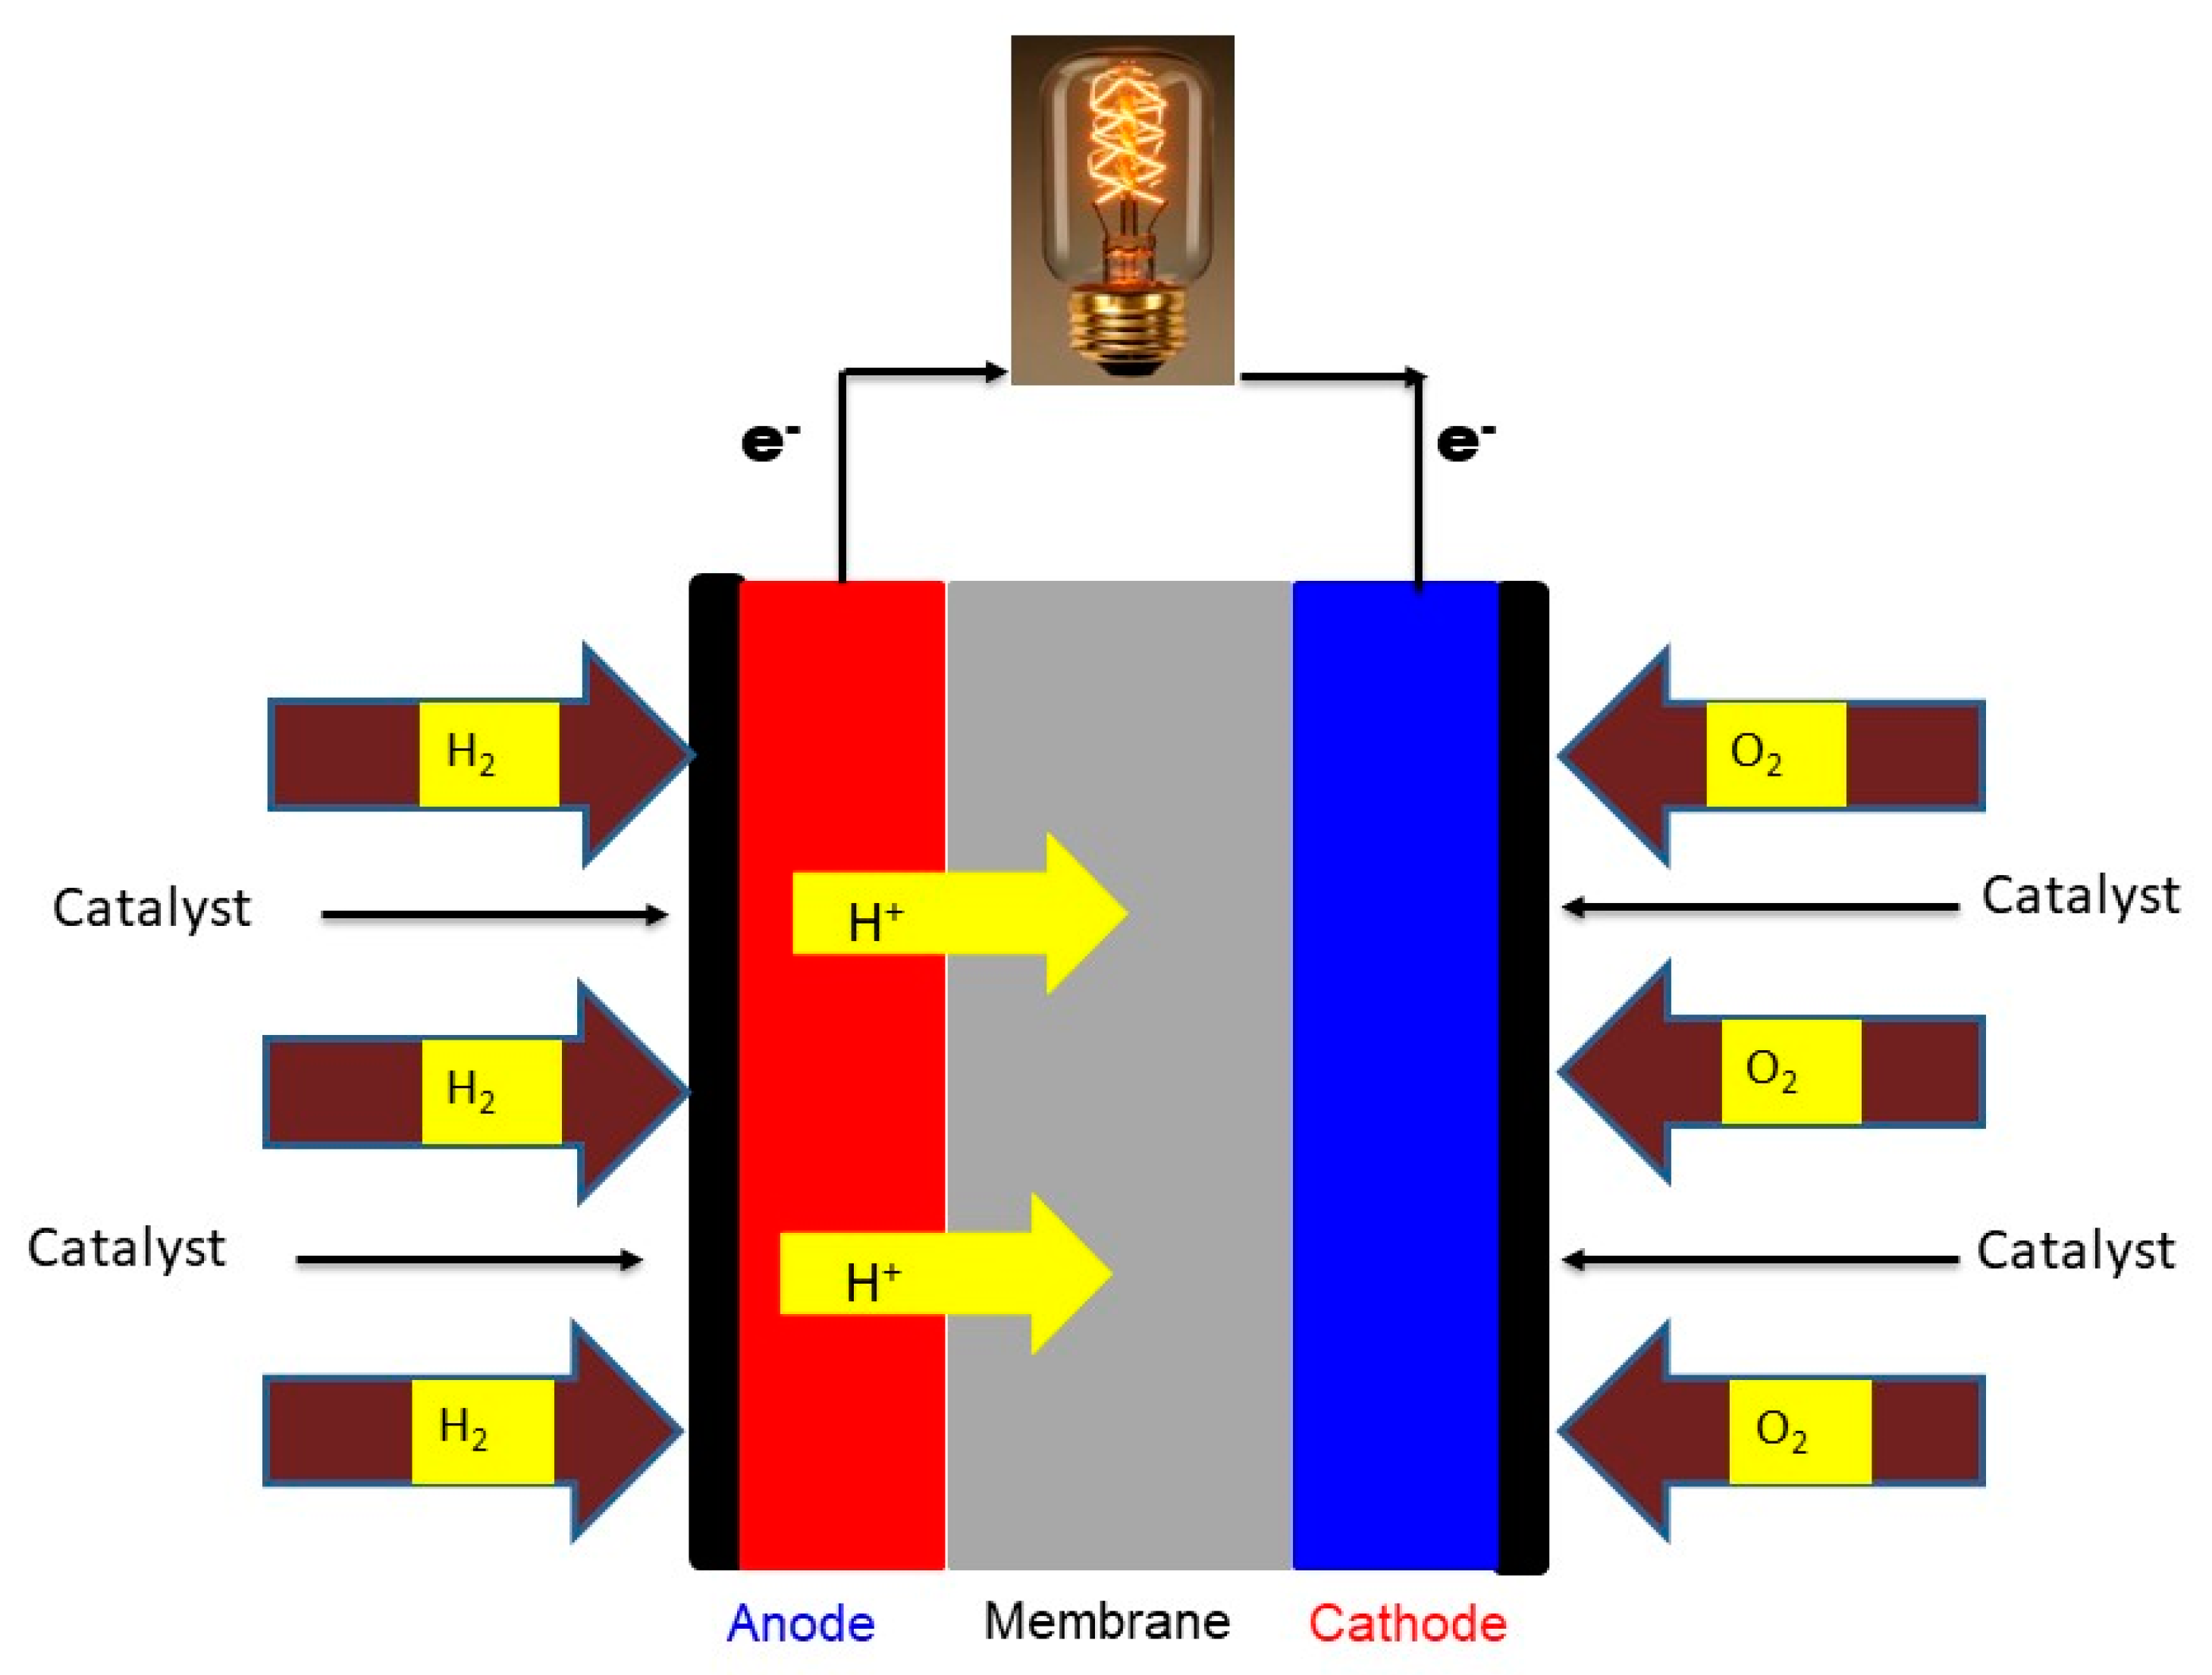
2.5.8. Fuel Cell Measurements

On the anode and cathode sides, the nanocomposite membranes were mounted between Toray carbon sheets charged with platinum (Pt) as catalyst and containing 0.5 mg Pt cm−2 of loading ((10 wt. percent Pt)/Vulcan®), Electro Chem SA). The active membrane area measured is 4.8 cm2. The PEMFC operates at 50 °C with a hydrogen flow rate of 0.15 L/min and a gas pressure of 98.066 kPa on one side and 0.3 L/min of air with a pressure of 98.066 kPa on the other. The relative humidity was kept at 75 percent, 90 percent, and 100 percent throughout the experiment. The values of proton conductivity (s) were calculated using the Formula (3) shown below.
σ = l R × A
where s is the proton conductivity (S/cm); l is membrane thickness (the distance between the electrodes) (cm); A is the active membrane area or surface area to conduct the proton across the membrane (cm2); R is the resistivity shown by the membrane (W).
The fuel cell assembly set-up is illustrated in Figure 2.
The reaction scheme of the fuel cell is given as below. The hydrogen gas was passed through the anode side and at cathode oxygen in the fuel cell, containing acidic electrolyte sandwiched between the cathode and anodic ends, the reaction occurred individually and the overall reaction is shown below,
A n o d e :   H 2 2 H + + 2 e C a t h o d e :   1 2 O 2 + 2 H + + 2 e H 2 O O v e r a l l :   H 2 + 1 2 O 2 H 2 O

3. Results and Discussion

3.1. Fourier Transform Infrared Spectroscopy Study

To understand the changes in modified membrane, FTIR analysis was performed. The FTIR spectra of PVA and ZnO-loaded PVA ranged from 4000 cm−1 to 400 cm−1. The FTIR curves were shown in the Figure 3. In Figure 3(A), the peak 3400 cm−1 corresponds to the stretching of O-H, and the peak at 2937 cm−1 represents the asymmetric stretching of CH2 bonds. The peak shown appeared at 1437 cm−1, 1093 cm−1, and 850 cm−1, represents the stretching of C-C, and C-O groups present in the PVA moiety, respectively [28]. Figure 3(B) shows the ZnO-loaded PVA membrane. The peak appearing at 476 cm−1 represents characteristic absorption of metal-oxygen Zn-O stretching vibration band. This will confirm the typical impregnation of the ZnO in the base PVA matrix. The findings are consistent with those reported in the literature [29].

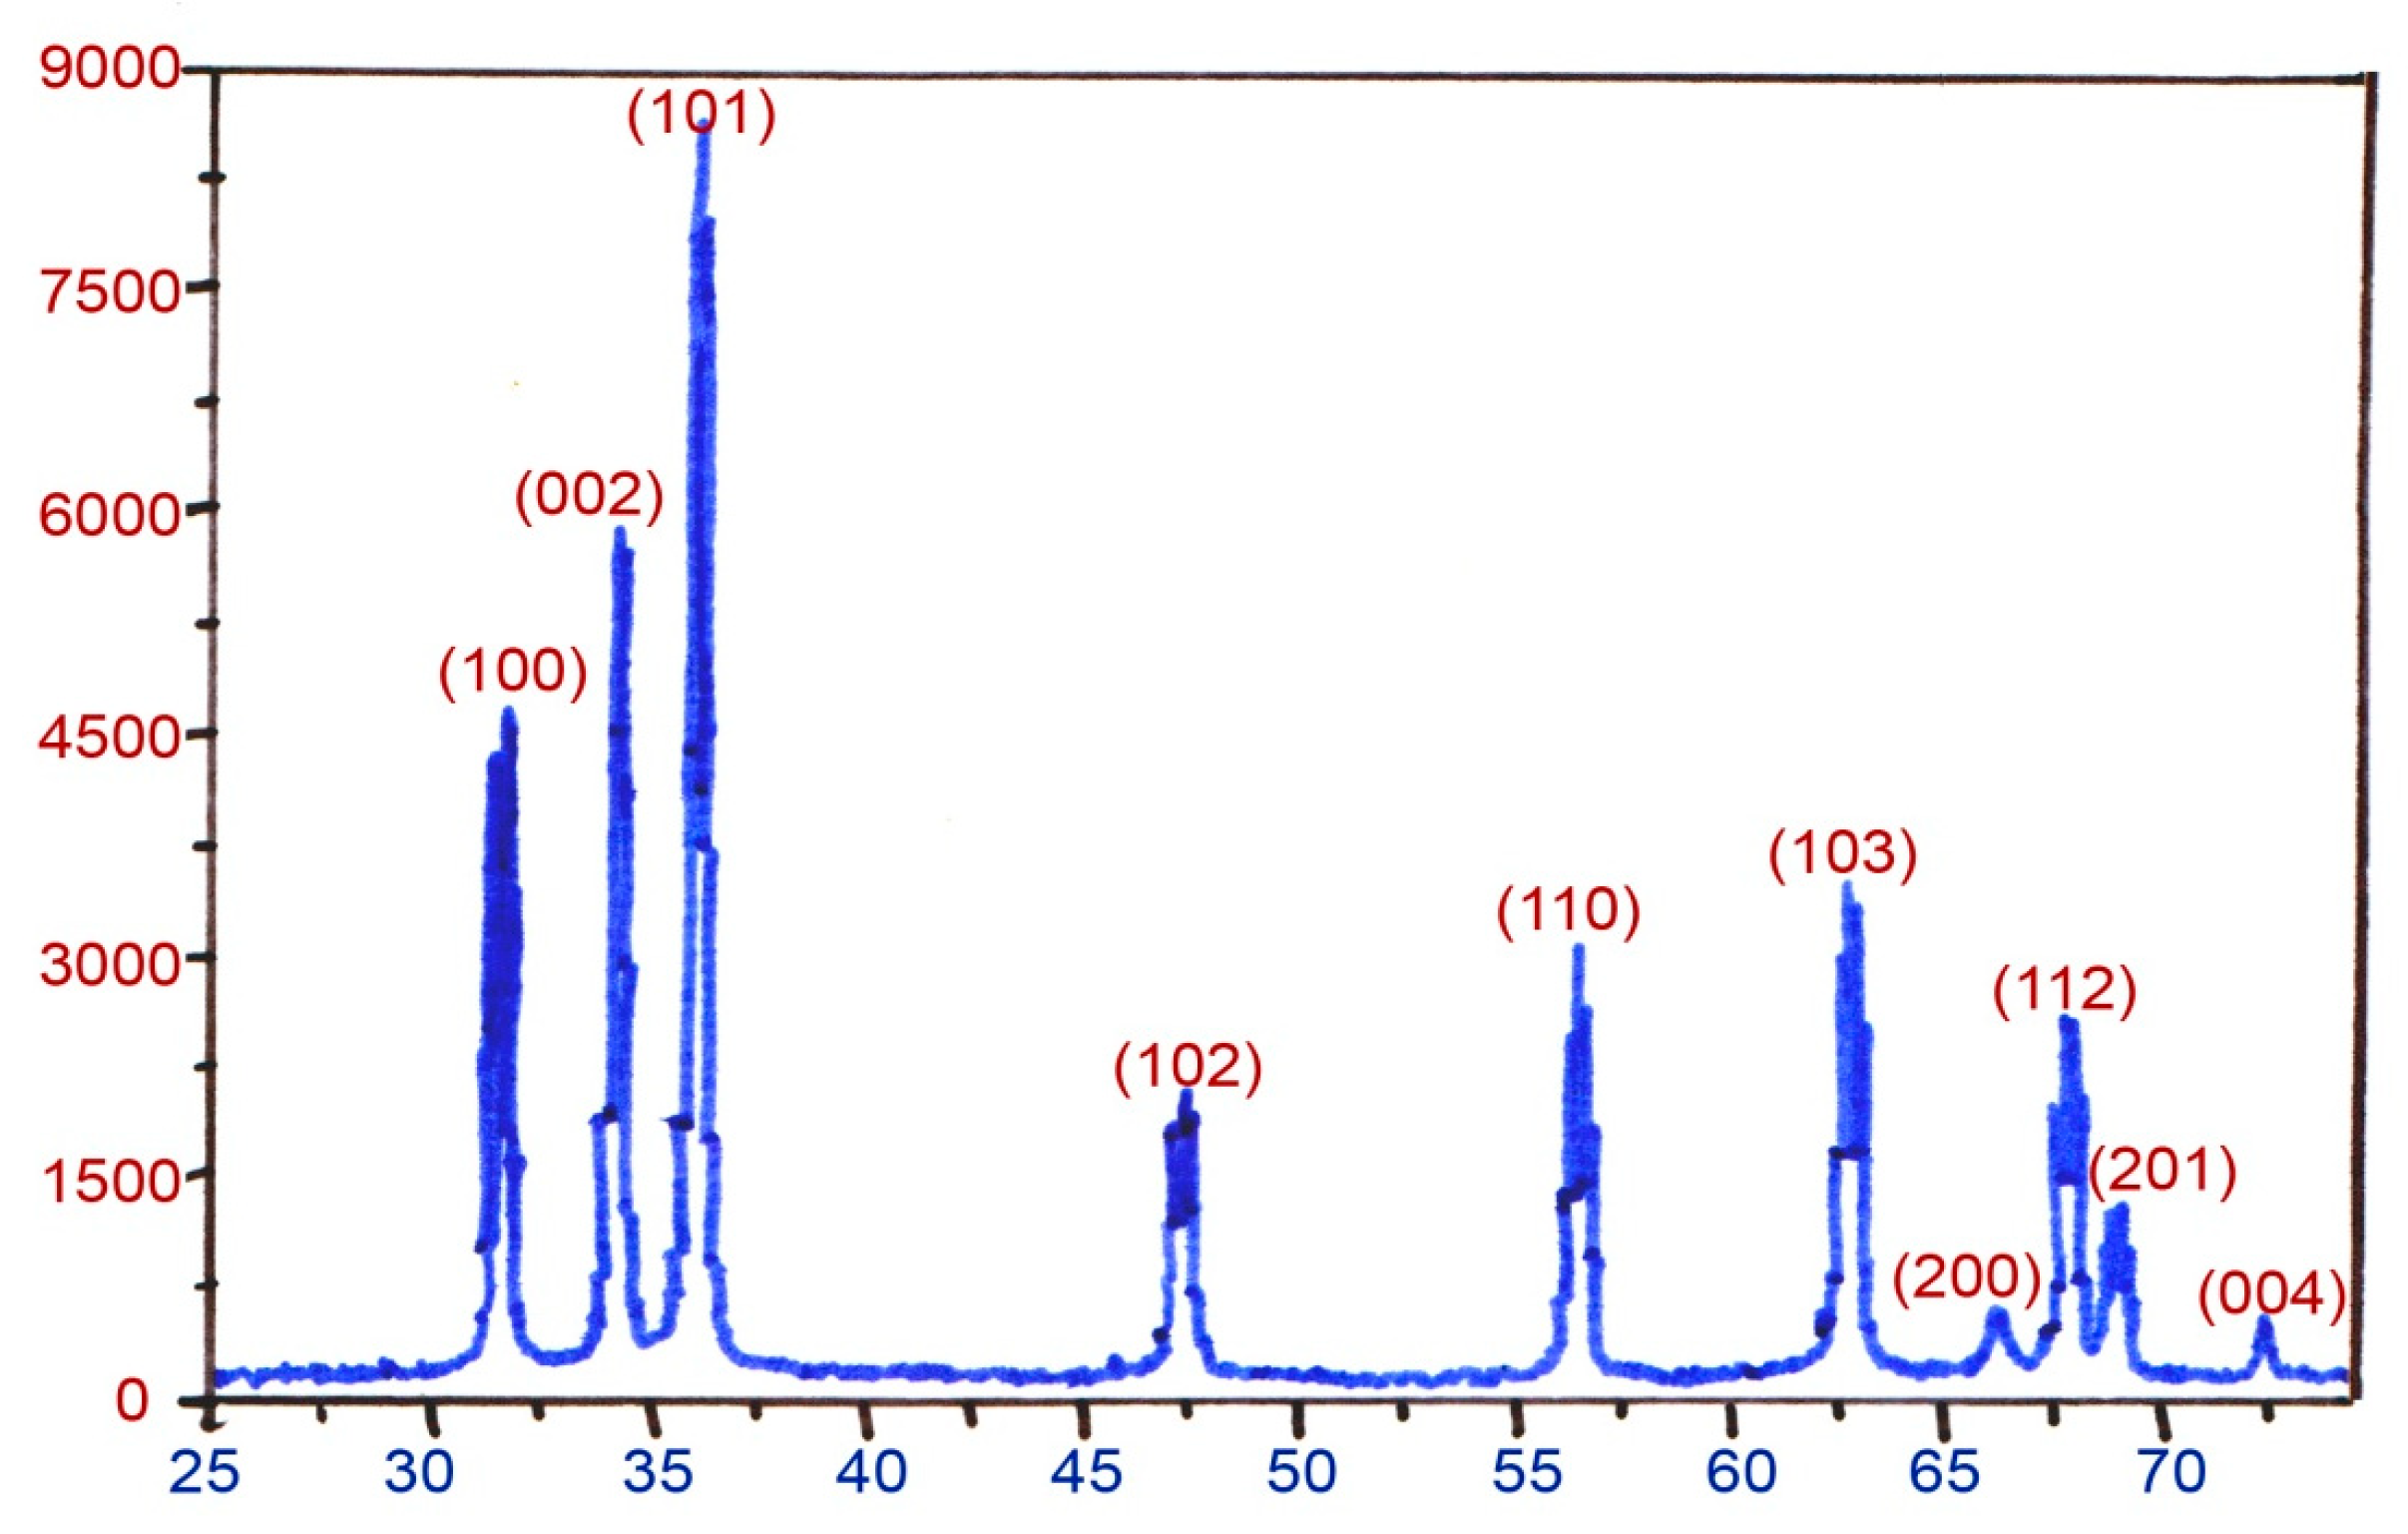
3.2. X-ray Diffraction Studies

An X-ray diffractometer (Make: Siemens, Model: D, 5000 powder) was used to investigate the solid-state morphology of synthesized ZnO. The XRD pattern for synthesized ZnO nanoparticles was shown in Figure 4. The wavelength of 1.5406 Å X-rays produced by a Cu Kα source was shown. The diffraction angle, 2θ was changed from 0° to 65° to better understand the crystal structure and intermolecular distances between the inter-segmental blocks. The prominent typical peak at 2θ = 32°–37° represents the ZnO mixed planes (1 0 0) and (1 0 1) [30,31]. The peak intensity of the ZnO diffraction patterns decreased by about 2θ = 47°. The Zinc oxide wurtzite structure could be assigned to all visible peaks (JCPDS Data Card No: 36-1451). Zinc oxide crystallizes into two distinct phases: hexagonal wurtzite and cubic zincblende. At ambient temperatures, the wurtzite structure is the most stable available structure and common. It similarly confirms that the synthesized white powder was free from impurities because no XRD peaks other than zinc oxide peaks are visible [32].

3.3. Scanning Electron Microscopy (SEM) Studies
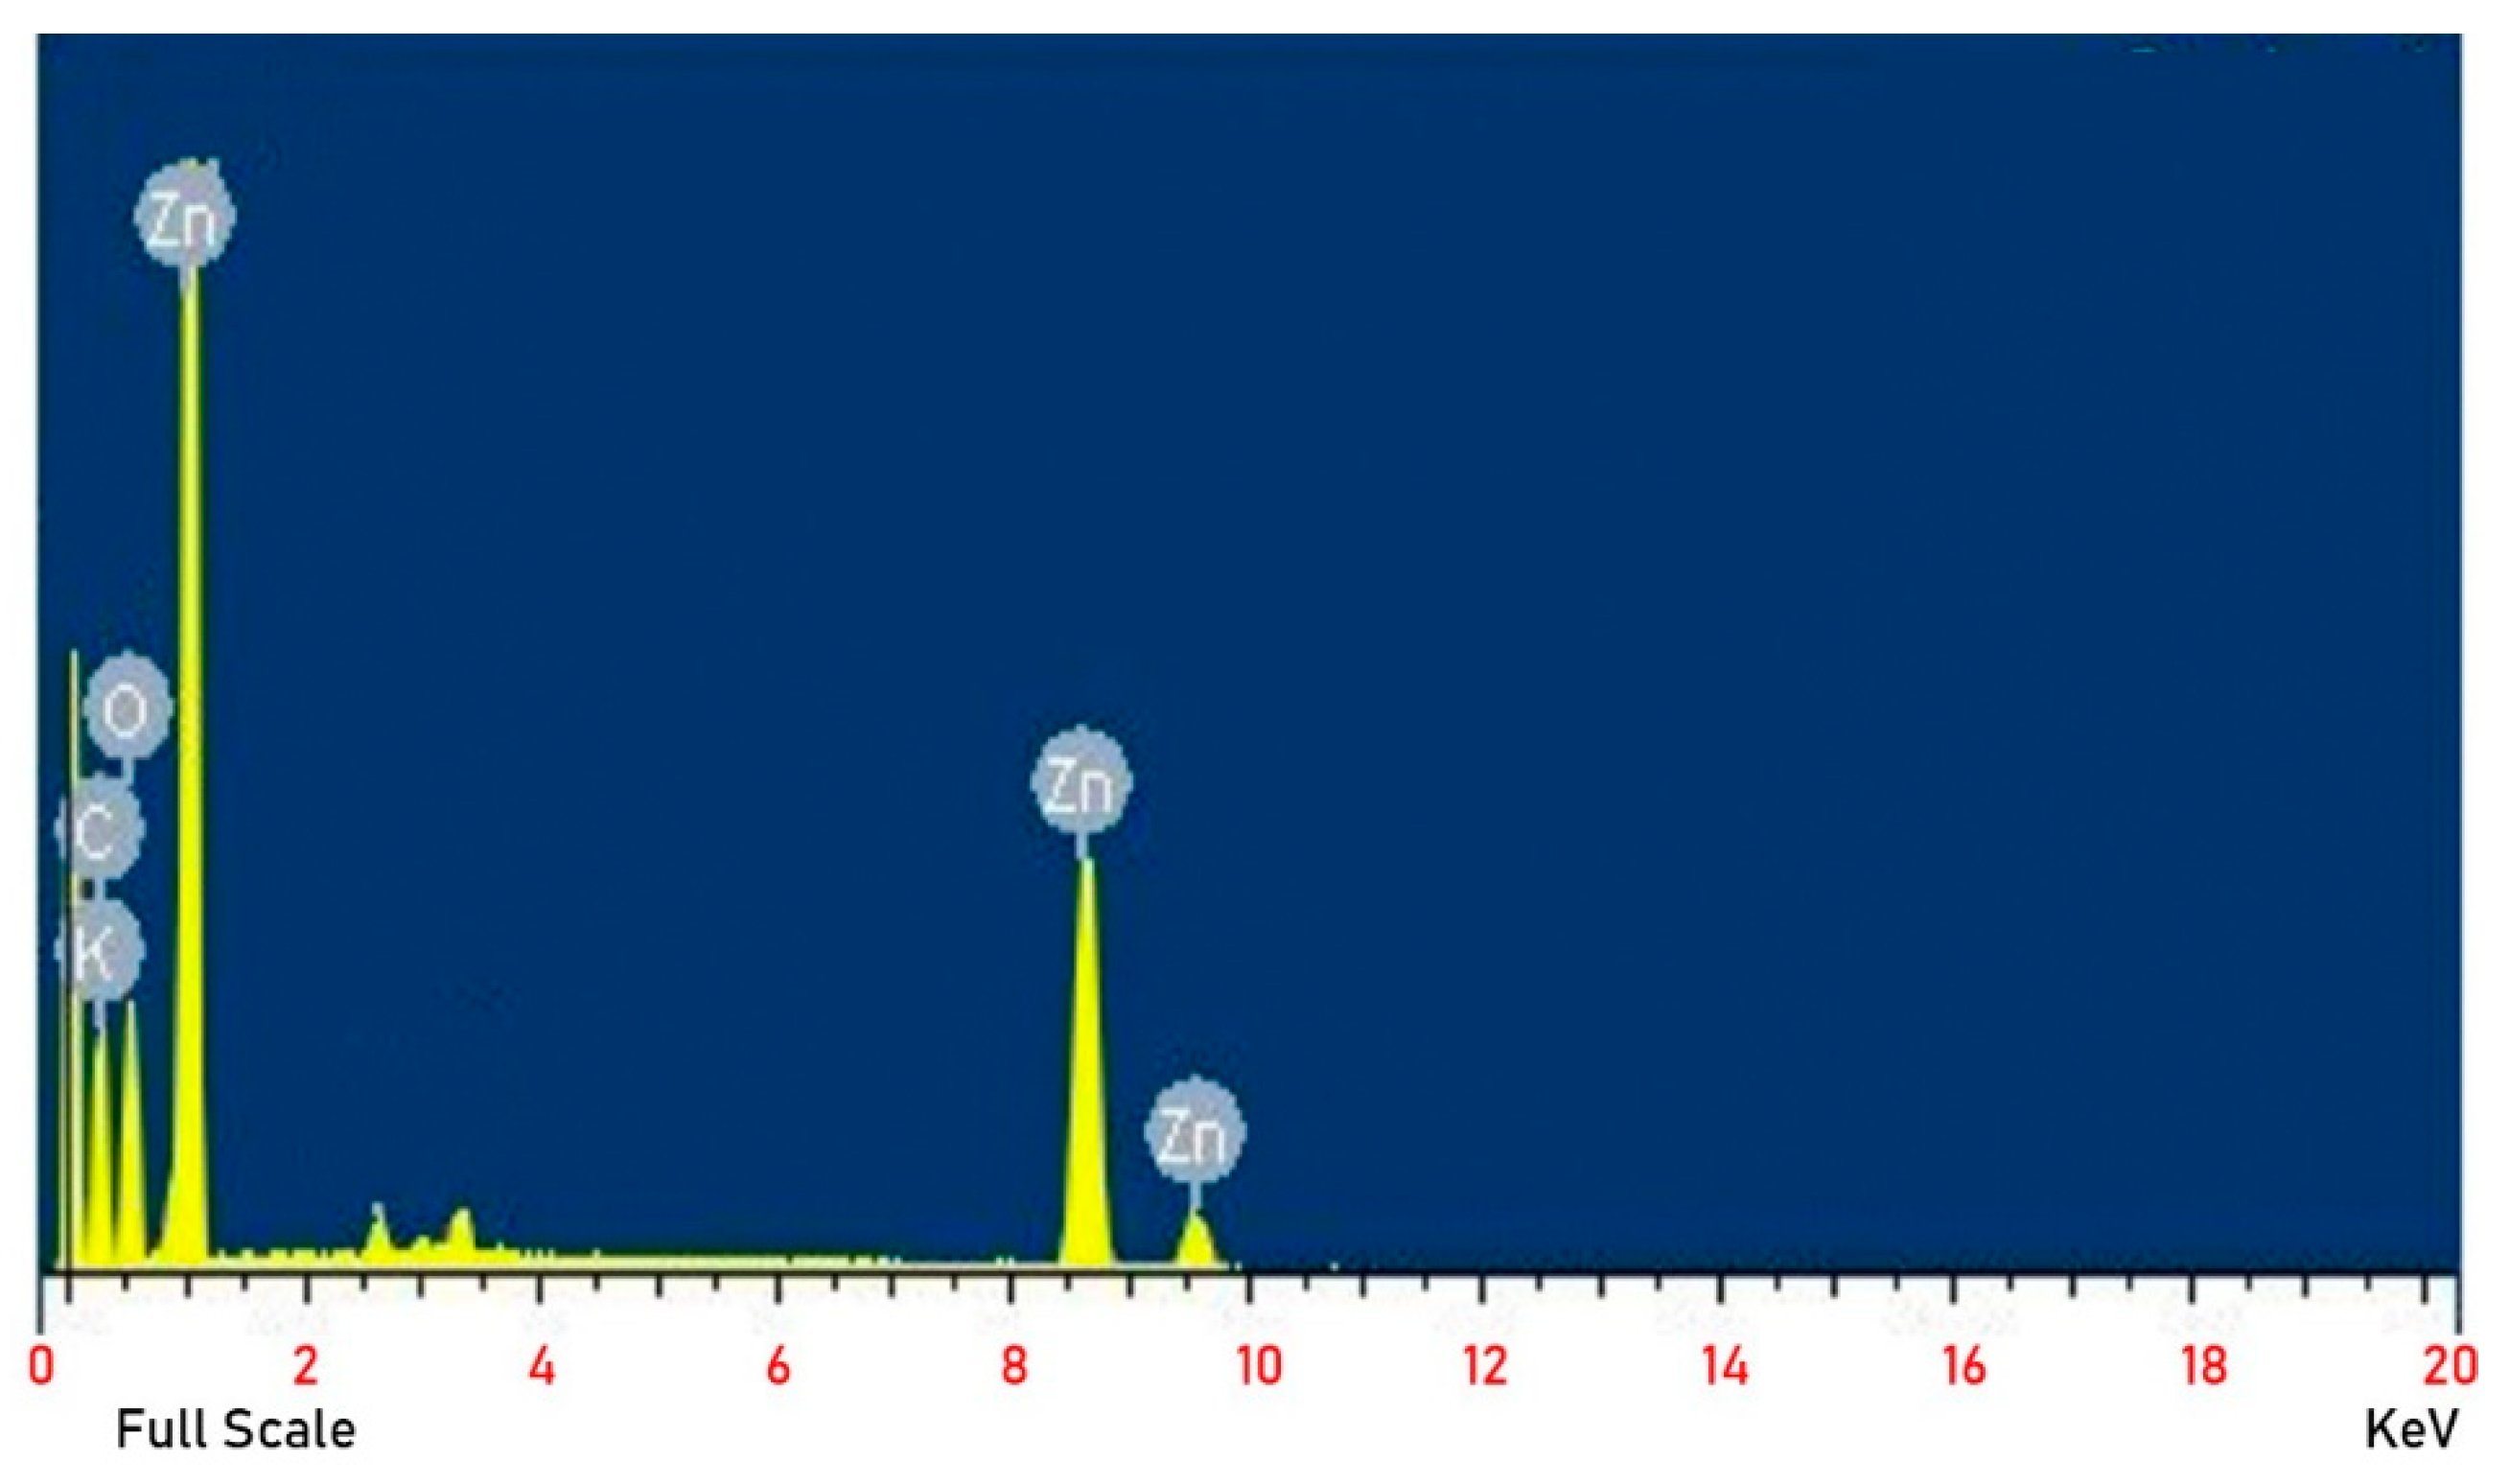
To understand the surface morphology of the pristine and modified membrane and to confirm the nanoparticles, SEM analysis was carried out. SEM micrographs of the pristine and nanocomposite PVA are shown in the Figure 5. SEM images of sulfonated crosslinked plain PVA and sulfonated ZnO nanocomposite membranes were taken. The films were nonconductive in nature; hence, gold sputtering (thickness of 15 nm) was performed on the samples. Figure 5A shows the pristine PVA membrane, it is observed uniform and Figure 5B depicts a hybrid membrane of PVA-ZnO nanoparticles, and it was discovered that the ZnO nanoparticles were dispersed across the membrane segments [33,34].
Figure 6 depicts the SEM image of ZnO NPs. The SEM image clearly shows that the synthesized ZnO is on the nanoscale and uniform in size. The SEM image revealed that the majority of the nanoparticles are spherical and nearly uniform in shape.

3.4. Composition

Figure 7 depicts the EDAX profile of ZnO NPs structures grown under optimized substrate temperature and solution quantity. The obtained atomic percentage ratio of Zn and O is about 0.6, indicating that the as-deposited ZnO NPs structures have an oxygen-rich chemical composition. The structures, however, do not show any element other than Zn and O, revealing the chemical purity of as-deposited structures. As a result, the as-deposited ZnO NPs structures are pure ZnO in composition, but they are oxygen-rich in nature. The purity of the synthesized ZnO NPs was demonstrated by XRD studies and confirmed by composition analysis.

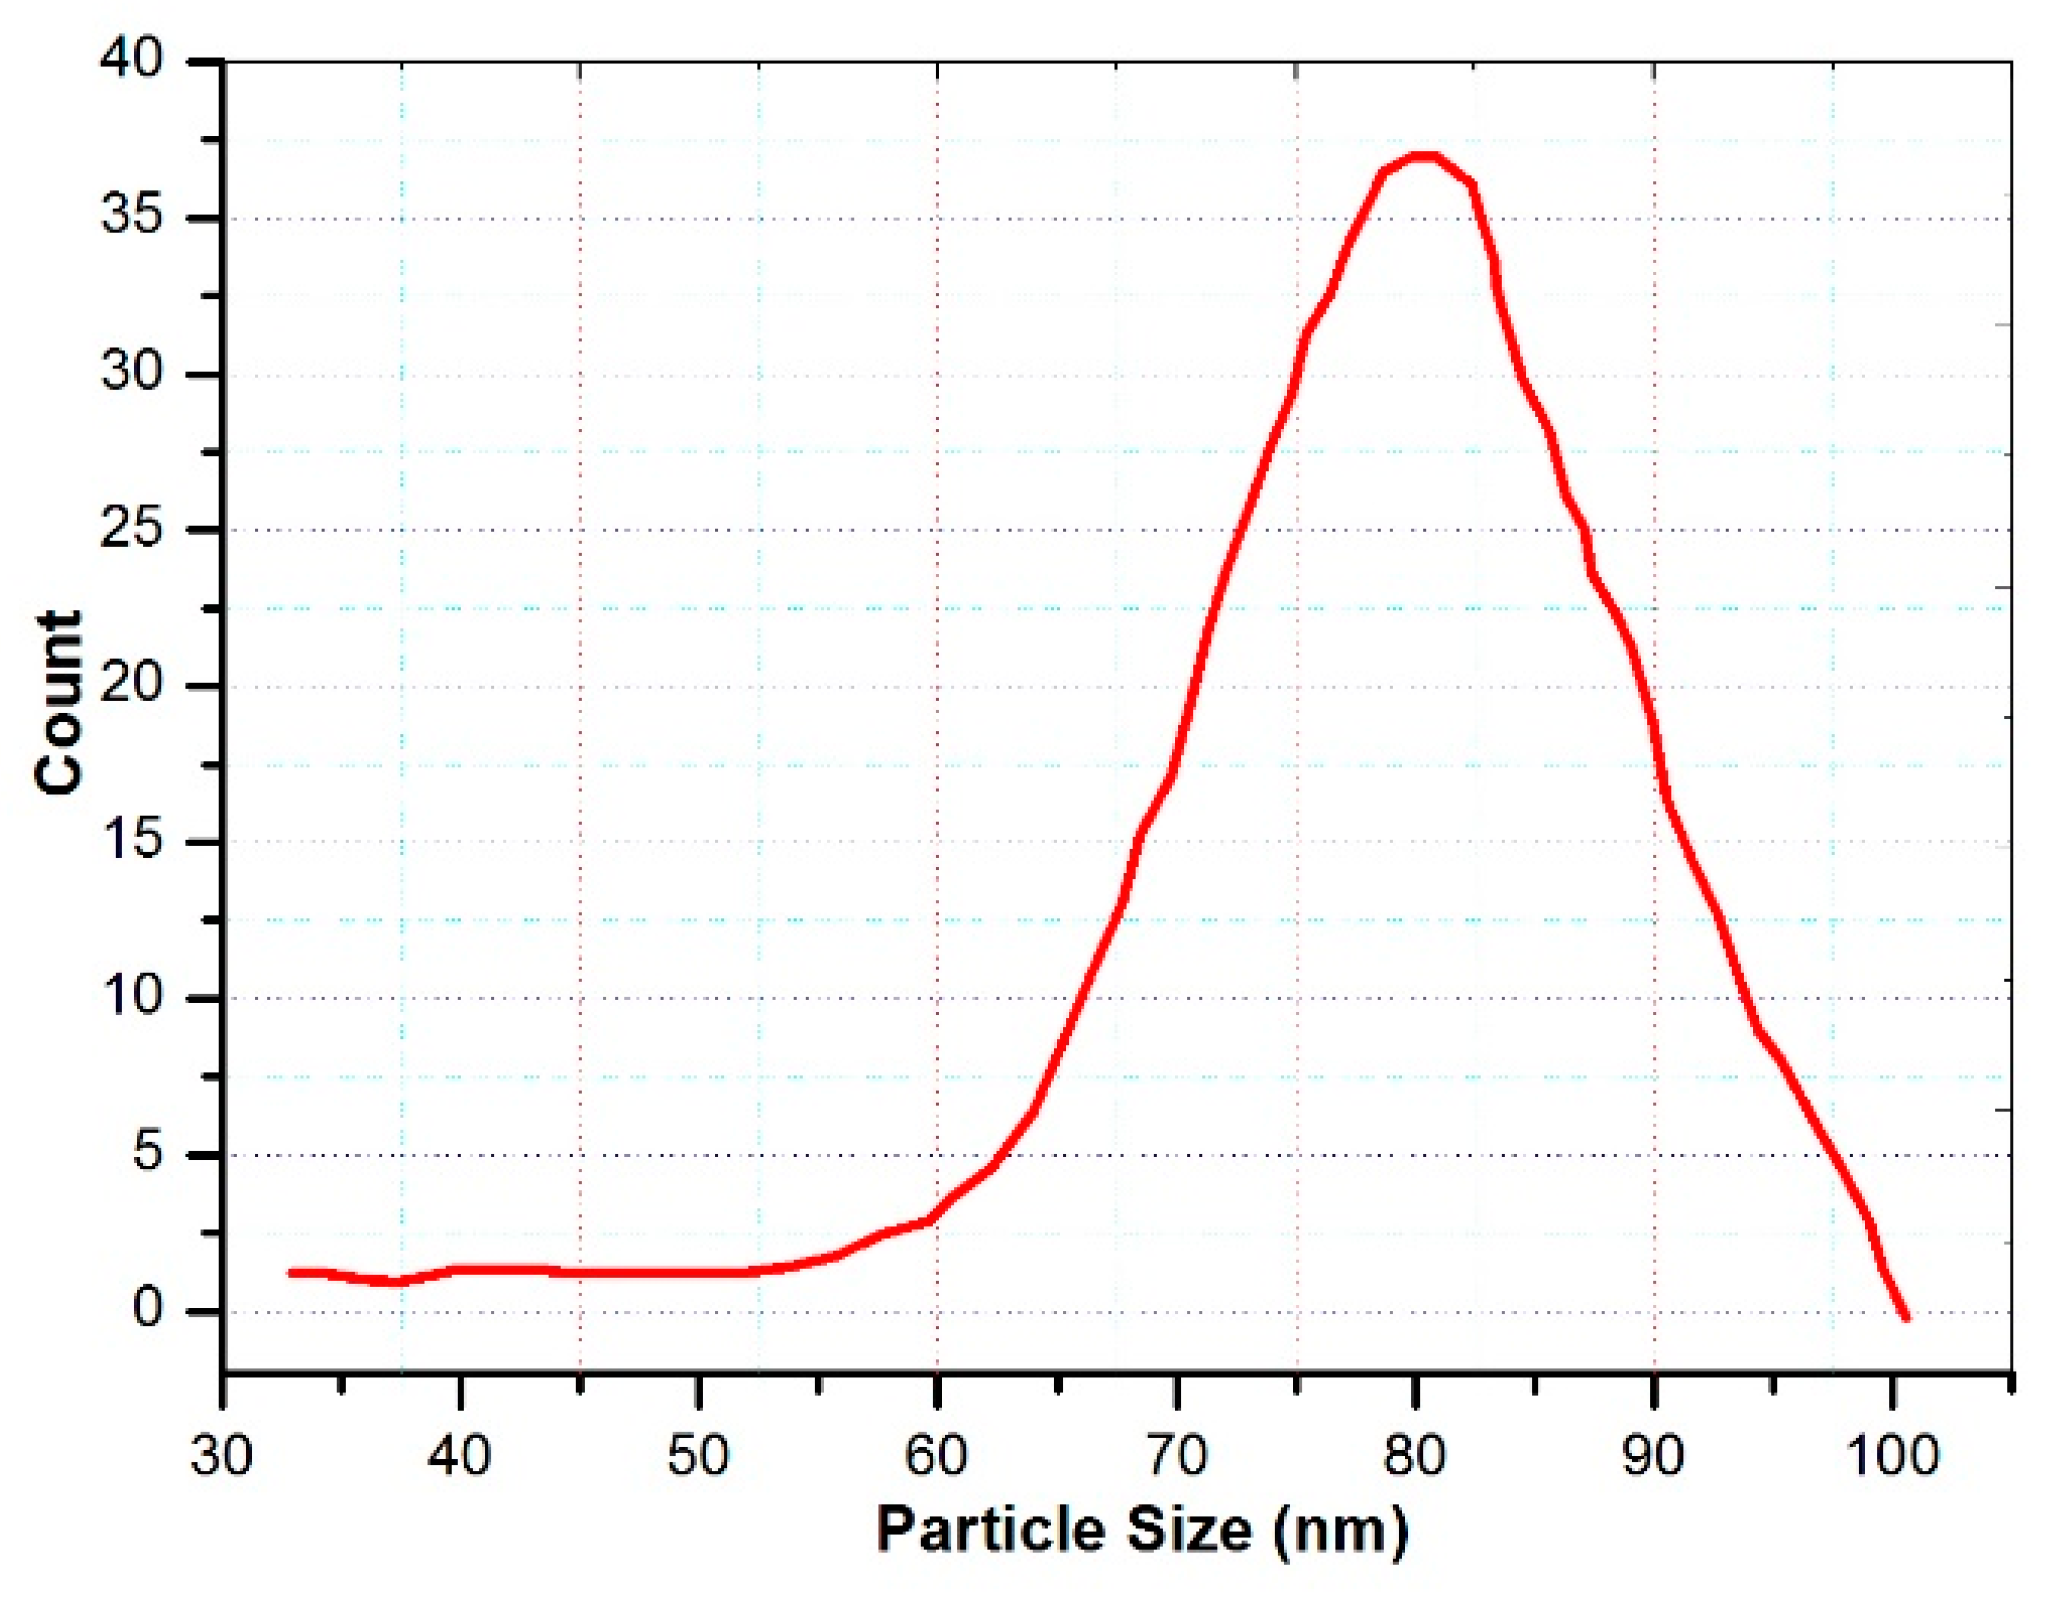
3.5. Particle Size and Distribution Analysis

The Particle Size Distribution (PSD) analysis calculates and reports on the size and range of ZnO particles. The particle size distribution histogram is shown in Figure 8. The ZnO particles ranged in size from 55 to 90 nm. The average particle size was calculated to be 80 nm.

3.6. UV–Visible Analysis

Because of surface plasmon resonance, the absorbance pattern of nanoparticles differs from that of their bulk counterpart, and the synthesis of nanoparticles is confirmed by UV-visible analysis. The UV-visible absorption spectrum of ZnO-NPs is depicted in Figure 9. The band changes are caused by zinc oxide nanoparticles exciting surface plasmon vibrations. The absorbance peak was located at 380 nm, indicating that zinc nitrate hexahydrate was reduced into ZnO-NPs [35,36,37].

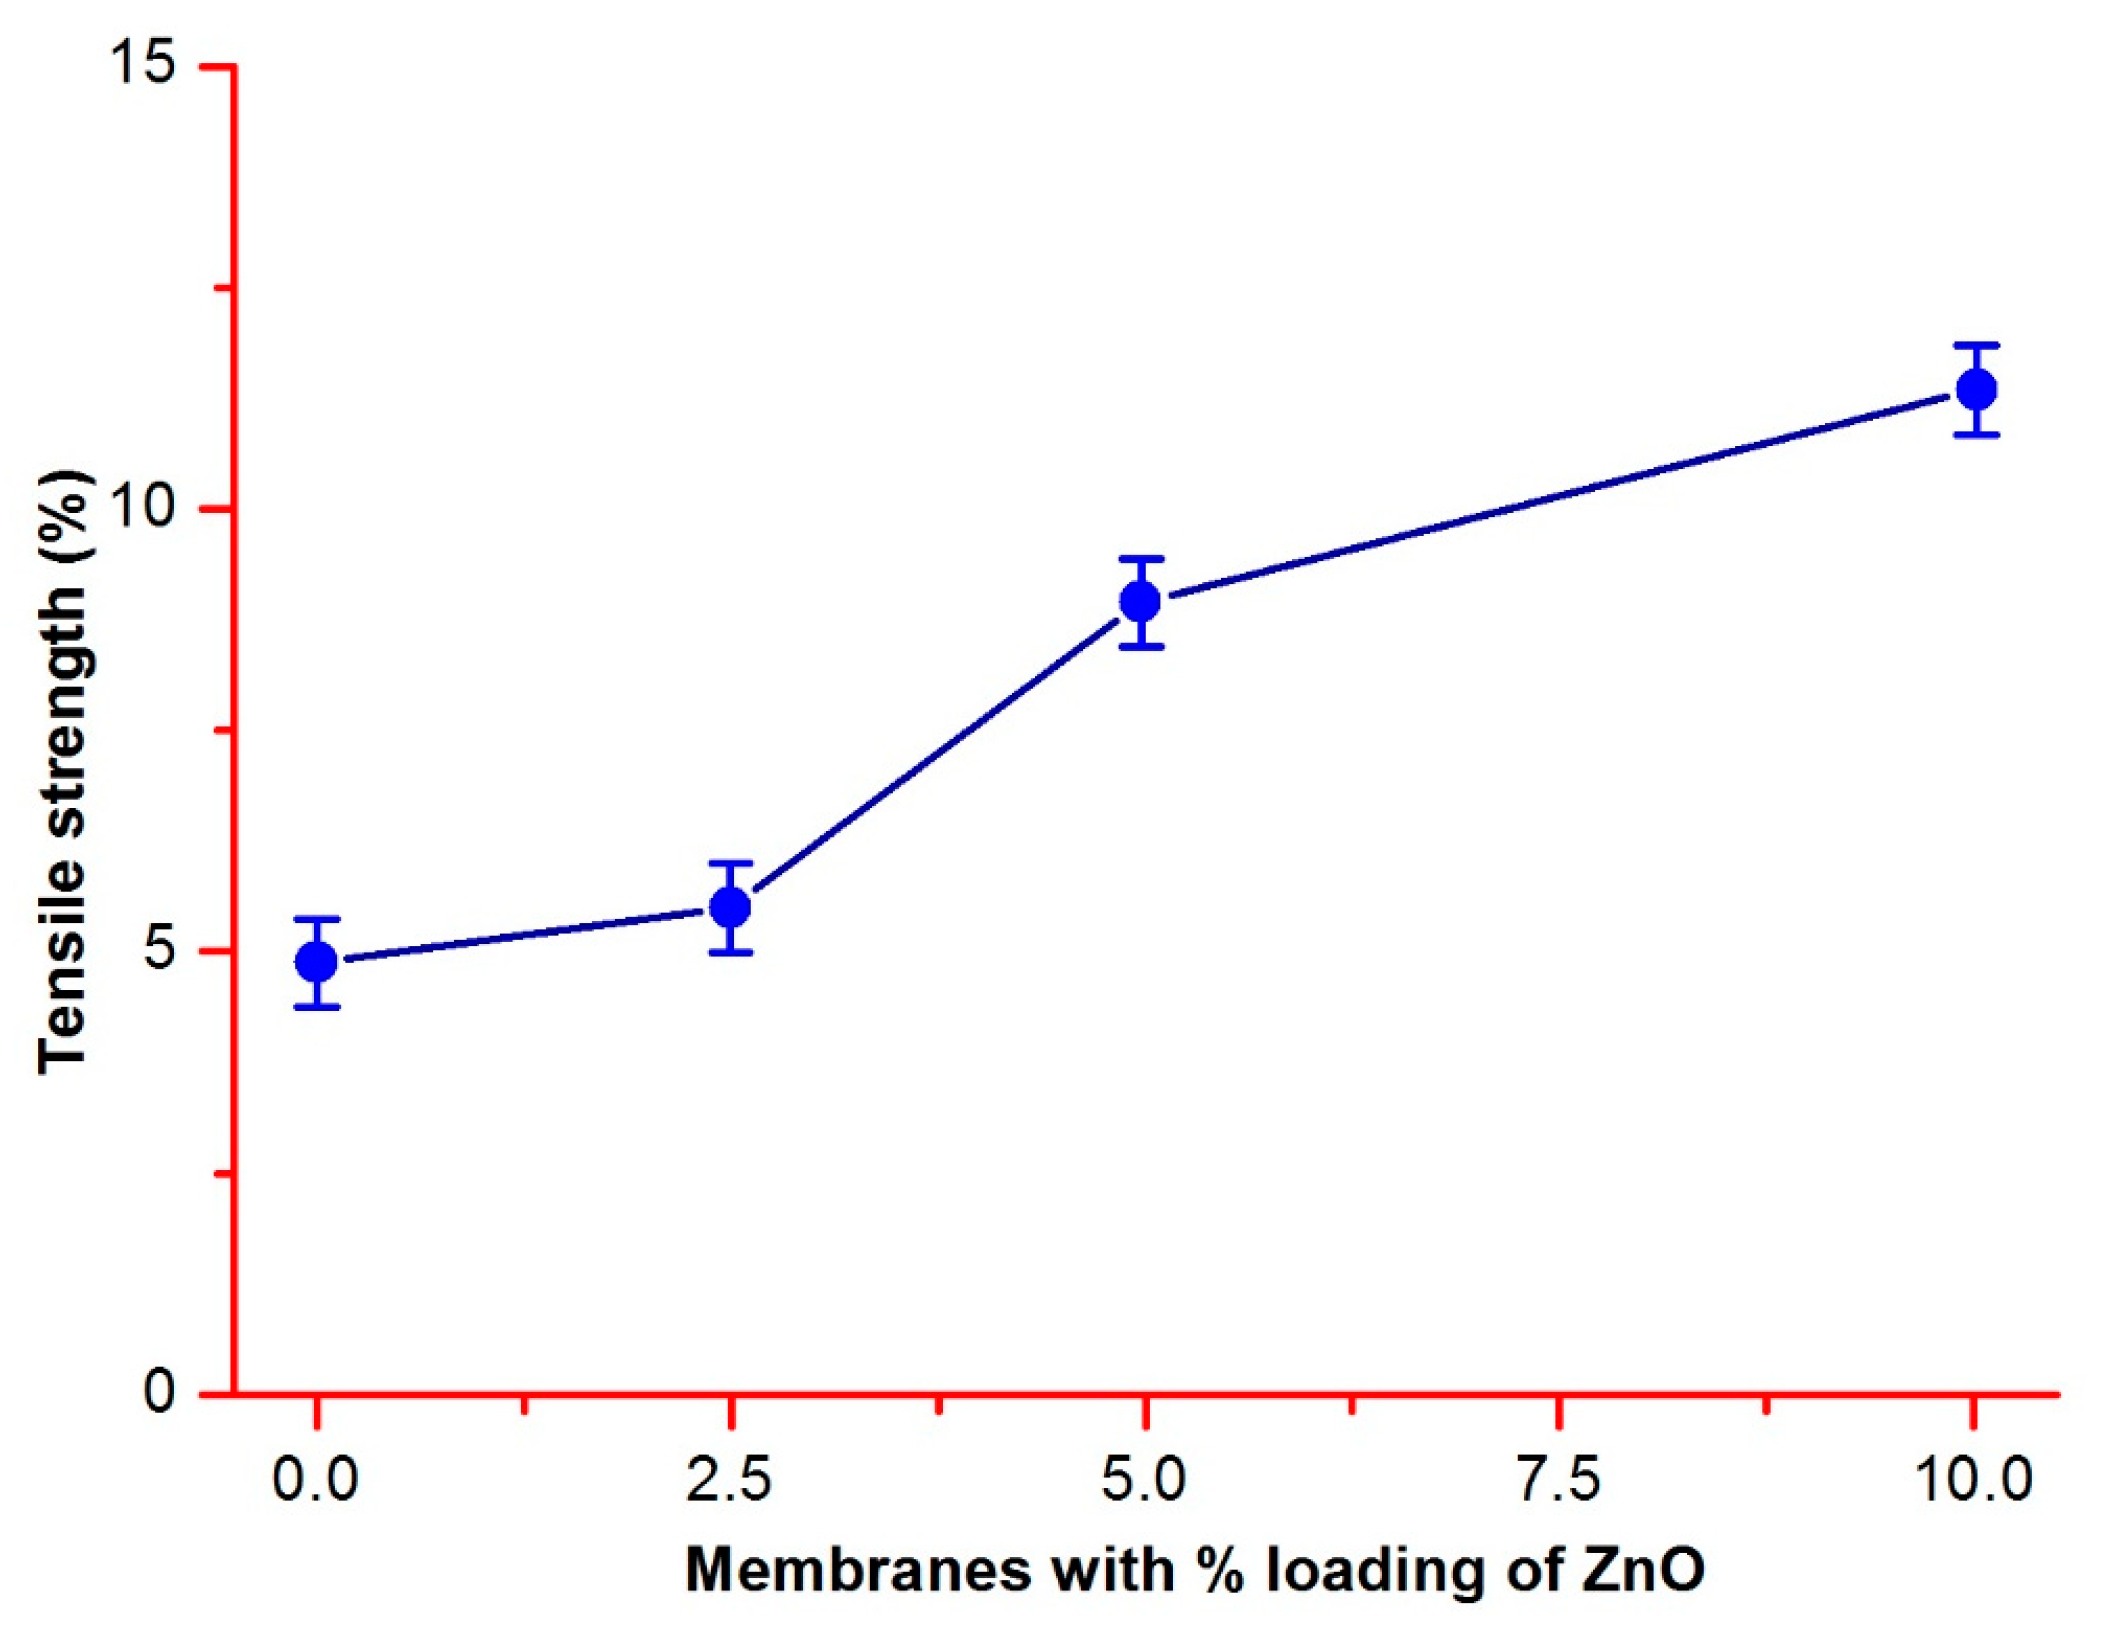
3.7. Mechanical Properties
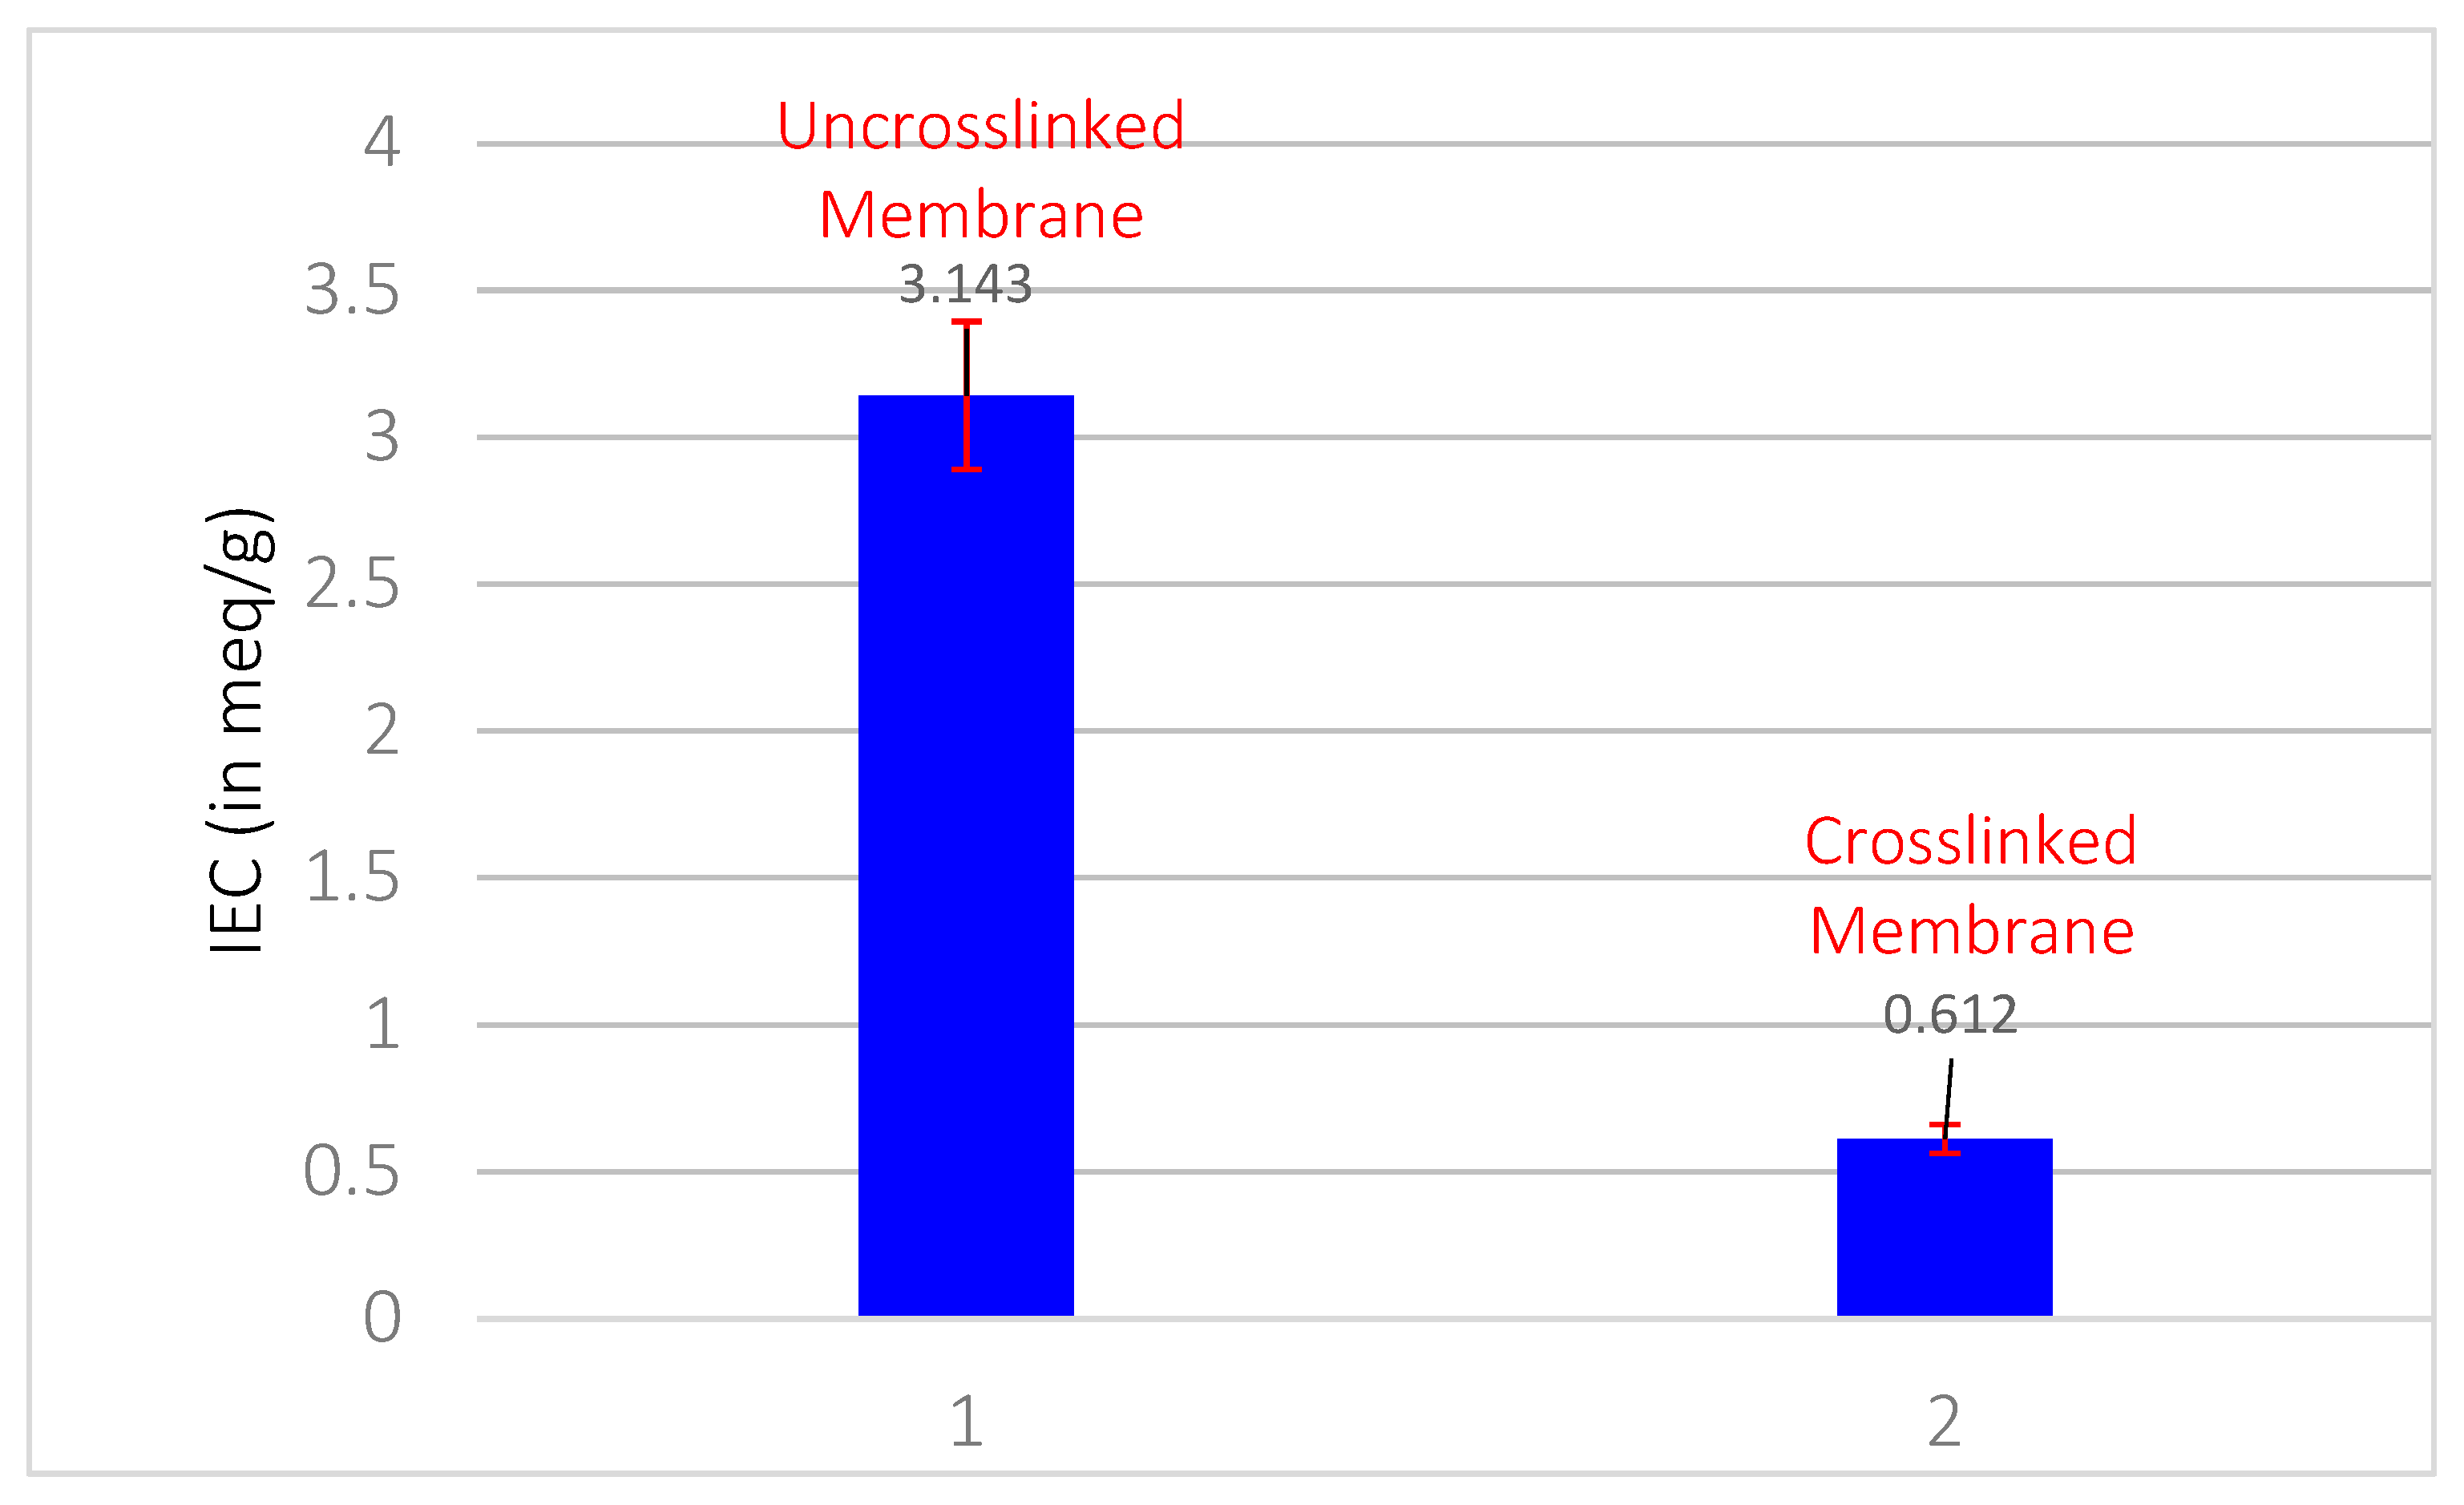
The primary goal of this research is to evaluate the mechanical stability of the prepared membranes because mechanical stability is one of the most important parameters to consider when performing a fuel cell analysis. Figure 10 depicts the mechanical strength of the membrane (pristine PVA, M_1, M_2, and M_3) in terms of tensile strength. As compared to the membranes tested for the tensile strength, M_3 performed the highest tensile strength value, i.e., 11.44 ± 5% MPa. While at the other side, the tensile strength of M-2 is found to be less than M_3, but the plain PVA membrane performed the slightest tensile strength with the value 4.93 ± 5% MPa. The obtained data reveal that with the incorporation of ZnO nanoparticles onto the PVA matrix, mechanical properties of PVA membranes are enhanced. The mechanical properties of the membranes were as follows: M 3 > M 2 > M 1 > plain PVA membrane. The enhanced tensile strength of ZnO-incorporated PVA is the result of pleasing physicochemical interactions between ZnO NPs and PVA matrix [38,39].

3.8. IEC Results

Figure 11 depicts the results of testing the ion exchange capacity of plain PVA and crosslinked PVA membranes. Using IEC measurements, the amount of residual hydroxyl groups in the membrane before and after crosslinking was calculated. For IEC, the uncrosslinked PVA membrane yielded 3.143 meq/g, while the crosslinked PVA membrane yielded 0.612 meq/g [39]. The IEC is similar to the sum of free hydroxyl groups present, and its value decreases after PVA crosslinking with TEOS. The results show that approximately 72 percent of the hydroxyl groups in the uncrosslinked PVA matrix were involved in the crosslinking with TEOS. Despite the presence of a few immobile hydroxyl groups, they cause ion diffusion across the crosslinked membrane.

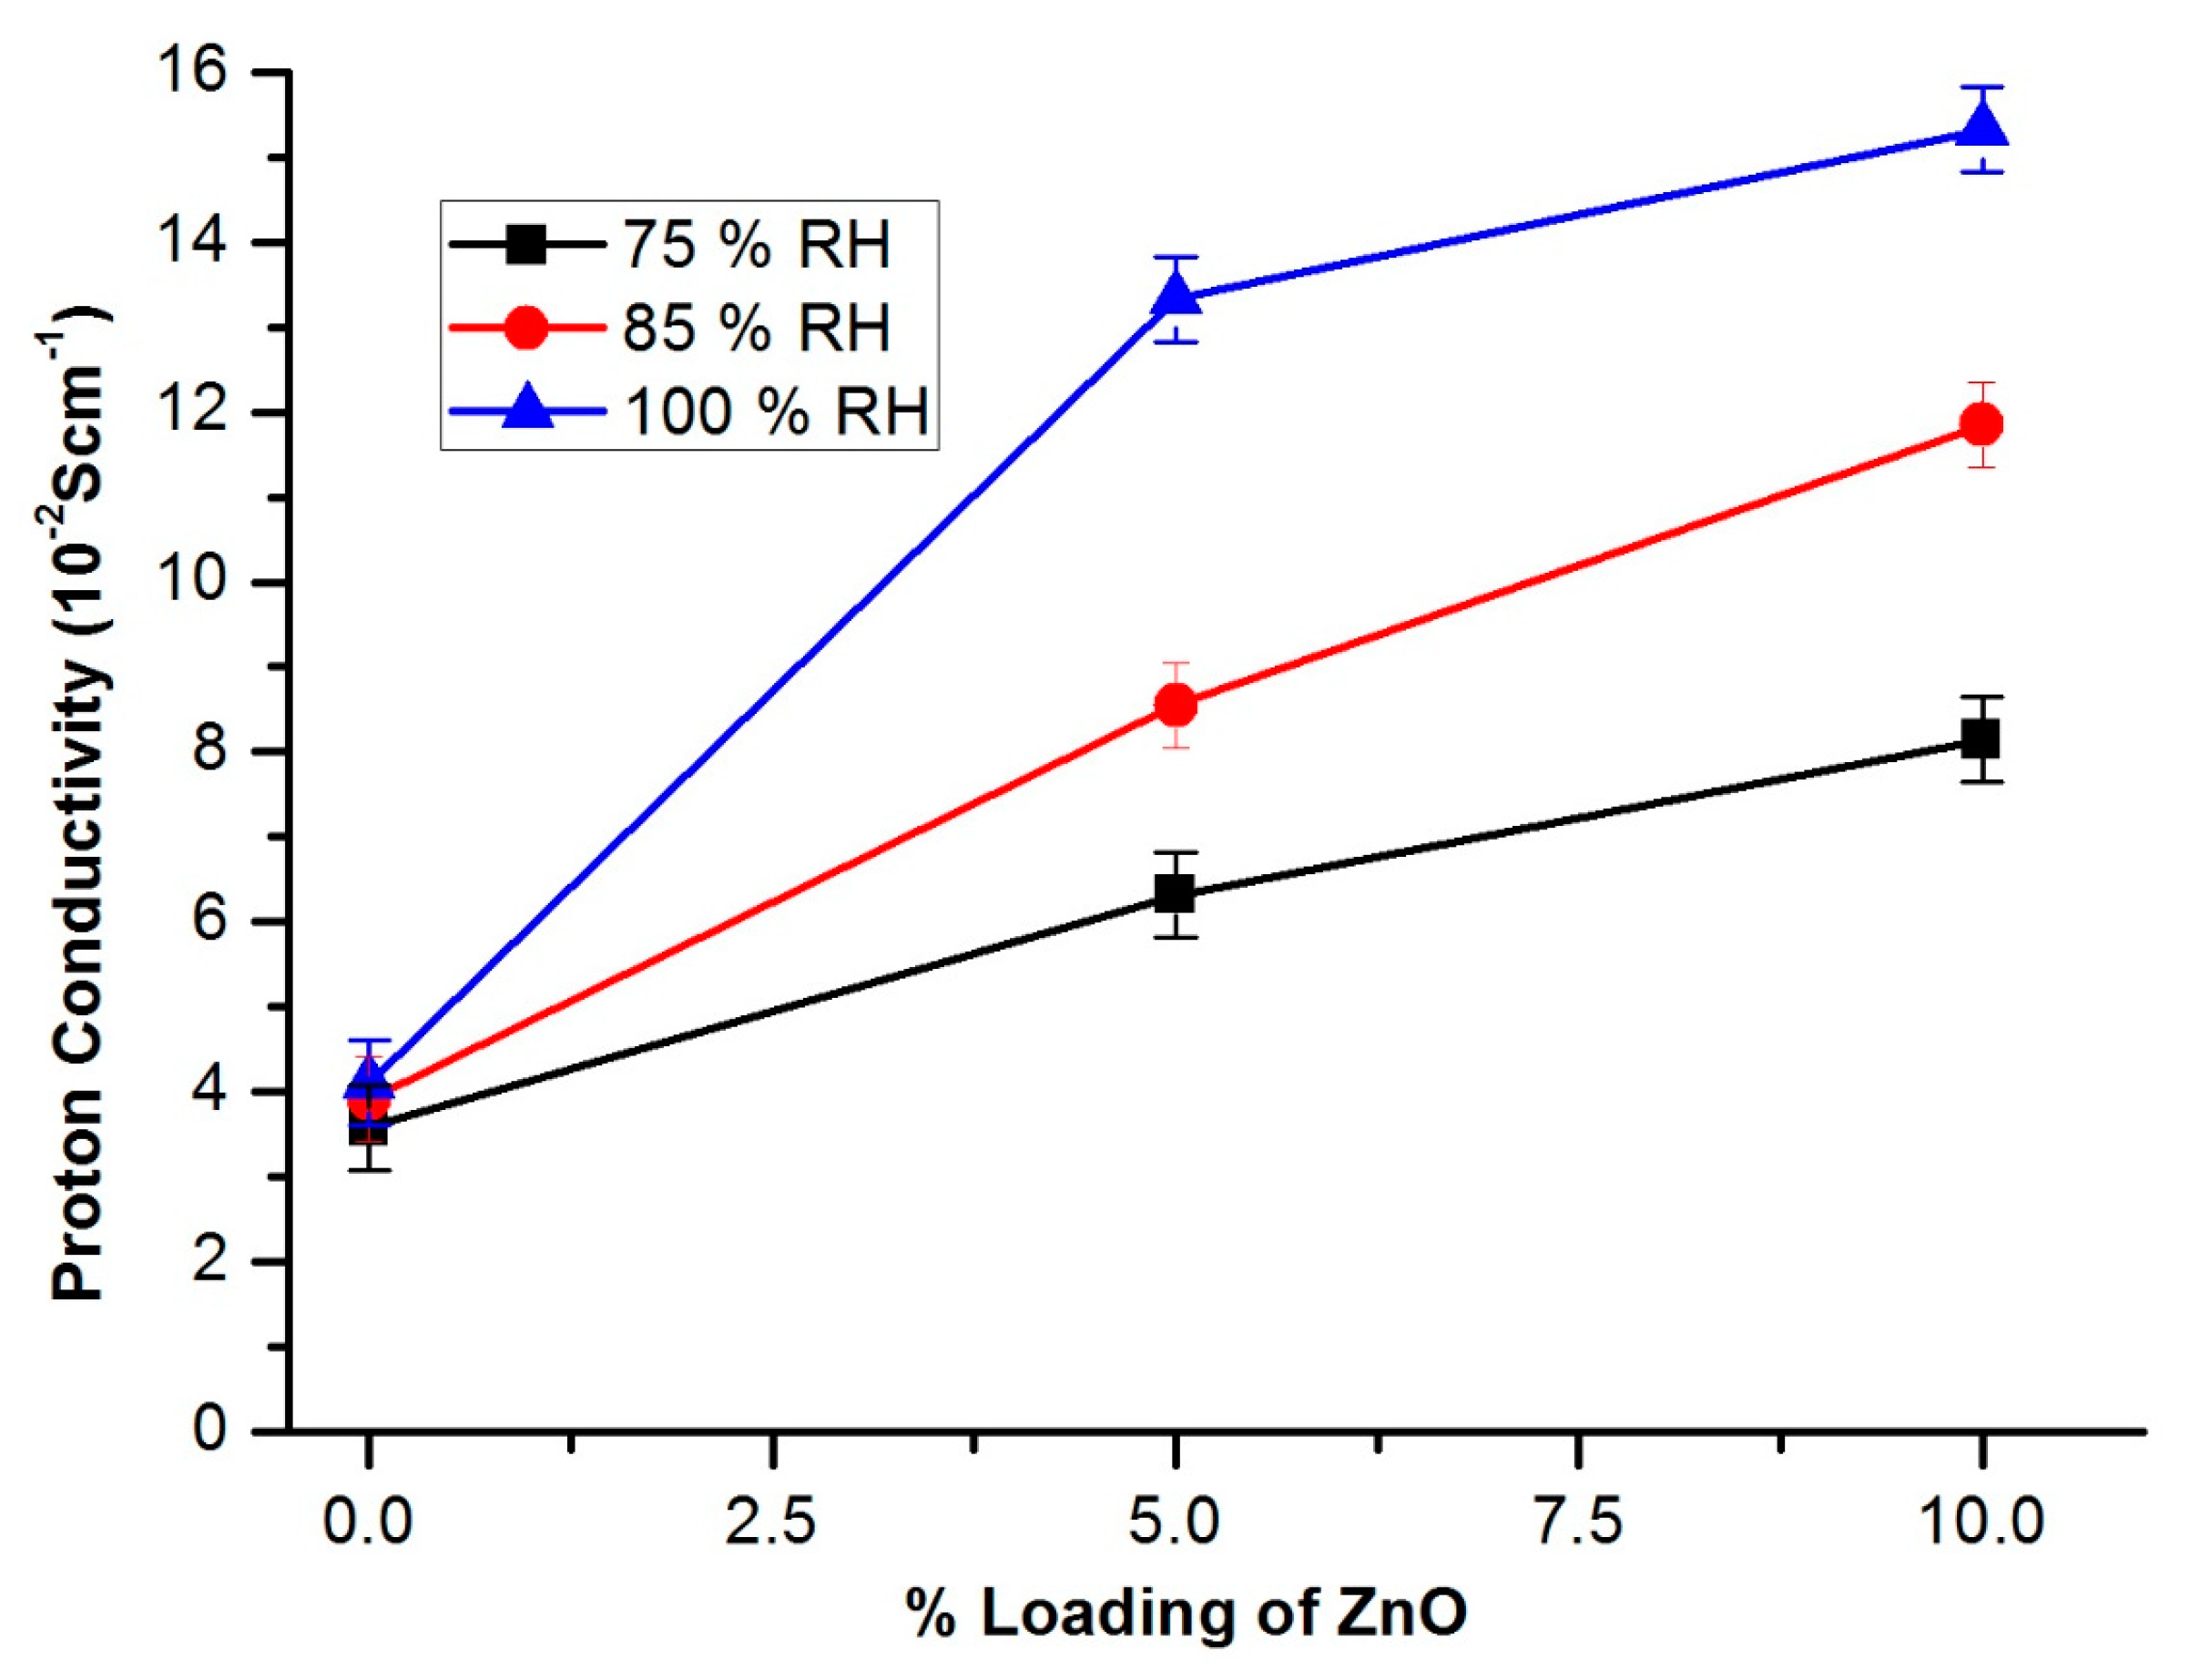
3.9. Fuel Cell Measurements

The prepared sulfonated ZnO-loaded PVA membranes, i.e., M_1, M_2 and M_3 were measured for fuel cell by employing hydrogen and oxygen gases. Proton conductivity curves are plotted and shown in Figure 12. The results after measuring the proton conductivity show that the nanocomposite membranes performed better as compared to its pristine membrane. The M_1 membrane showed 3.581 × 10⁻² S cm−1 for 75% RH to 4.10 × 10⁻² S cm−1. Whereas, M_2 showed 6.315 to 13.333 × 10⁻² S cm−1 for 75% to 100% RH. M_3 showed the 8.143 × 10⁻² S cm−1, 11.845 × 10⁻² S cm−1 and 15.321 × 10⁻² S cm−1 for 75%, 85% and 100% RH conditions, respectively. The results obtained say that the increase in humidity level and % incorporation of ZnO enhanced the conductivity of proton. As the % loading of the nanosized ZnO increased the proton conductivity of the membrane increased, and as a result the power generation maximized. The increased proton conductivity is attributed to the incorporation of the little amount of ZnO onto the PVA polymeric membrane. The reason behind this is the increased surface area due to the incorporation of nanosized ZnO in the PVA matrix, which resulted in the absorption of a greater number of H2 and O2 gas molecules at the anode and cathodic side of the surface of the membrane, resulting in the increased proton conductive activity.
Van der Waals force of attraction at the molecular level in the case of physisorption and residual chemical bonding in chemisorption are the primary causes of gas adsorption to a solid. In general, physisorption is assumed to occur due to van der Waals force of attraction, resulting in multilayer adsorption. The minimum energy principle states that molecular adsorption within the smallest energy range is always preferred, and molecular adsorption of the next energy level is possible. Adsorption can occur at any solid surface that can rapidly reach saturation without requiring any activation energy, and different gases can be adsorbed, though the content of the adsorbed gas varies greatly. This could explain the improved gas adsorption and proton conductivity of the membrane.

4. Conclusions

In this study, we investigated ZnO-filled PVA nanocomposite membranes and tested them for fuel cell measurement. This study’s set of nanocomposite membranes had not previously been reported in the literature for fuel cell measurement. The prepared mixed matrix nanocomposite membranes studies demonstrated a factor of 2.5 to 10 effectiveness in fuel cell applications; even a small amount of ZnO can have a significant impact. The particle size analysis showed that the average ZnO particle size was 80 nm. The UV-Visible spectrophotometric study showed that the perfect nanocomposite has been formed between ZnO and PVA. FTIR study confirmed the incorporation of synthesized ZnO was embedded in the polymer matrix, and XRD study showed the typical nature of ZnO. SEM images revealed the surface morphology of the prepared films. The ion exchange capacity for the crosslinked membrane showed that 0.612 meq/g is less than the uncrosslinked membrane confirming that the crosslinking was successful. The mechanical properties of the ZnO-embedded nanocomposite membrane shown especially at 10 wt.% ZnO-embedded PVA matrix showed the highest tensile strength. The fuel cell measurement for the prepared membranes reached 15.321 × 10⁻² S cm−1 at 100% RH. It was discovered that the prepared membranes were best suited for the fuel cell.

Author Contributions

Conceptualization, A.A.O. and M.B.P.; methodology, S.B.R. and S.N.M.; software, A.K.; validation, A.Y.P., M.K.A. and J.P.S.; formal analysis, A.M.A. and A.K.; investigation, A.A.O.; resources, M.B.P.; data curation, A.K.; writing—original draft preparation, A.A.O. and M.B.P. All authors have read and agreed to the published version of the manuscript.

Funding

This research work was funded by Institutional Fund Projects under grant no. (IFPIP:468-961-1443). The authors gratefully acknowledge technical and financial support provided by the Ministry of Education and King Abdulaziz University, DSR, Jeddah, Saudi Arabia.

Institutional Review Board Statement

Not applicable.

Informed Consent Statement

Not applicable.

Data Availability Statement

Not applicable.

Acknowledgments

This research work was funded by Institutional Fund Projects under grant no. (IFPIP:468-961-1443). The authors gratefully acknowledge technical and financial support provided by the Ministry of Education and King Abdulaziz University, DSR, Jeddah, Saudi Arabia. The authors take this opportunity to thank Vision Group for Science and Technology (VGST), Govt. of Karnataka, Bengaluru, India.

Conflicts of Interest

The authors herewith declare that there is no conflict of interests regarding the publication of this research article.

References

  1. Ramaswamy, P.; Wong, N.E.; Shimizu, G.K. MOFs as proton conductors-challenges and opportunities. Chem. Soc. Rev. 2014, 43, 5913–5932. [Google Scholar] [CrossRef] [PubMed]
  2. Carrette, L.; Friedrich, K.L.; Stimming, U. Fuel cells-fundamentals and applications. Fuel Cells 2001, 1, 5–39. [Google Scholar] [CrossRef]
  3. Mahreni, A.; Mohamad, A.B.; Kadhum, A.A.H.; Daud, W.R.W.; Iyuke, S.E. Nafion/silicon oxide/phosphotungstic acid nanocomposite membrane with enhanced proton conductivity. J. Membr. Sci. 2009, 327, 32–40. [Google Scholar] [CrossRef]
  4. Steele, B.C.; Heinzel, A. Materials for fuel-cell technologies. Nature 2001, 414, 345–352. [Google Scholar] [CrossRef] [PubMed]
  5. Jacobson, M.Z.; Colella, W.G.; Golden, D.M. Cleaning the air and improving health with hydrogen fuel-cell vehicles. Science 2005, 308, 1901–1905. [Google Scholar] [CrossRef] [Green Version]
  6. Liang, X.; Zhang, F.; Feng, W.; Zou, X.; Zhao, C.; Na, H.; Liu, C.; Sun, F.; Zhu, G. From metal-organic framework (MOF) to MOF-polymer composite membrane: Enhancement of low-humidity proton conductivity. Chem. Sci. 2013, 4, 983–992. [Google Scholar] [CrossRef]
  7. Zakaria, Z.; Kamarudin, S.K.; Timmiati, S.N. Membranes for direct ethanol fuel cells: An overview. Appl. Energy 2016, 163, 334–342. [Google Scholar] [CrossRef]
  8. Badwal, S.P.S.; Giddey, S.; Kulkarni, A.; Goel, J.; Basu, S. Direct ethanol fuel cells for transport and stationary applications—A comprehensive review. Appl. Energy 2015, 145, 80–103. [Google Scholar] [CrossRef]
  9. Zarrin, H.; Higgins, D.; Jun, Y.; Chen, Z.; Fowler, M. Functionalized graphene oxide nanocomposite membrane for low humidity and high temperature proton exchange membrane fuel cells. J. Phys. Chem. C 2011, 115, 20774–20781. [Google Scholar] [CrossRef]
  10. Road Transport: EU-Wide Carbon Dioxide Emissions Have Increased by 24% Since 1990, Statistisches Bundesamt (Destatis). Available online: https://www.destatis.de/Europa/EN/Topic/Environment-energy/CarbonDioxideRoadTransport.html (accessed on 2 November 2022).
  11. Slowik, P.; Hall, D.; Lutsey, N.; Nicholas, M.; Wappelhorst, S. Funding the Transition to All Zero-Emission Vehicles. ICCT White Paper. Available online: https://theicct.org/wp-content/uploads/2021/06/Funding_transition_ZEV_20191014.pdf (accessed on 2 November 2022).
  12. Carey, N.; Steitz, C. EU Proposes Effective Ban for New Fossil-Fuel Cars from 2035. Available online: https://www.reuters.com/business/retail-consumer/eu-proposes-effective-ban-new-fossil-fuel-car-sales-2035-2021-07-14/ (accessed on 2 November 2022).
  13. Breed, A.K.; Speth, D.; Plötz, P. CO2 fleet regulation and the future market diffusion of zero-emission trucks in Europe. Energy Policy 2021, 159, 112640. [Google Scholar] [CrossRef]
  14. Samsun, R.C.; Rex, M.; Antoni, L.; Stolten, D. Deployment of Fuel Cell Vehicles and Hydrogen Refueling Station Infrastructure: A Global Overview and Perspectives. Energies 2022, 15, 4975. [Google Scholar] [CrossRef]
  15. Ge, J.C.; Wu, G.; Yoon, S.K.; Kim, M.S.; Choi, N.J. Study on the Preparation and Lipophilic Properties of Polyvinyl Alcohol (PVA) Nanofiber Membranes via Green Electrospinning. Nanomaterials 2021, 11, 2514. [Google Scholar] [CrossRef]
  16. Safi, M.A.; Mantzaras, J.; Prasianakis, N.I.; Lamibrac, A.; Büchi, F.N. A Pore-Level Direct Numerical Investigation of Water Evaporation Characteristics under Air and Hydrogen in the Gas Diffusion Layers of Polymer Electrolyte Fuel Cells. Int. J. Heat Mass Transf. 2019, 129, 1250–1262. [Google Scholar] [CrossRef]
  17. van Rooij, S.; Magnini, M.; Matar, O.K.; Haussener, S. Numerical Optimization of Evaporative Cooling in Artificial Gas Diffusion Layers. Appl. Therm. Eng. 2021, 186, 116460. [Google Scholar] [CrossRef]
  18. Qin, C.; Wang, J.; Yang, D.; Li, B.; Zhang, C. Proton Exchange Membrane Fuel Cell Reversal: A Review. Catalysts 2016, 6, 197. [Google Scholar] [CrossRef] [Green Version]
  19. Herrendörfer, R.; Cochet, M.; Schumacher, J.O. Simulation of Mass and Heat Transfer in an Evaporatively Cooled PEM Fuel Cell. Energies 2022, 15, 2734. [Google Scholar] [CrossRef]
  20. Ji, X.; Guo, J.; Guan, F.; Liu, Y.; Yang, Q.; Zhang, X.; Xu, Y. Preparation of Electrospun Polyvinyl Alcohol/Nanocellulose Composite Film and Evaluation of Its Biomedical Performance. Gels 2021, 7, 223. [Google Scholar] [CrossRef] [PubMed]
  21. Zhang, S.; Shi, Q.; Christodoulatos, C.; Korfiatis, G.; Meng, X. Adsorptive filtration of lead by electrospun PVA/PAA nanofiber membranes in a fixed-bed column. Chem. Eng. J. 2019, 370, 1262–1273. [Google Scholar] [CrossRef]
  22. Zhu, M.; Hua, D.; Pan, H.; Wang, F.; Manshian, B.; Soenen, S.J.; Xiong, R.; Huang, C. Green electrospun and crosslinked poly (vinyl alcohol)/poly (acrylic acid) composite membranes for antibacterial effective air filtration. J. Colloid Interface Sci. 2018, 511, 411–423. [Google Scholar] [CrossRef] [PubMed]
  23. Zhang, D.; Jin, X.-Z.; Huang, T.; Zhang, N.; Qi, X.-D.; Yang, J.-H.; Zhou, Z.-W.; Wang, Y. Electrospun fibrous membranes with dual-scaled porous structure: Super hydrophobicity, super lipophilicity, excellent water adhesion, and anti-icing for highly efficient oil adsorption/separation. ACS Appl. Mater. Interfaces 2019, 11, 5073–5083. [Google Scholar] [CrossRef]
  24. Bazargan, A.M.; Fateminia, S.M.A.; Ganji, M.E.; Bahrevar, M.A. Electrospinning preparation and characterization of cadmium oxide nanofibers. Chem. Eng. J. 2009, 155, 523e7. [Google Scholar] [CrossRef]
  25. Patil, M. Synthesis and Characterization of Zinc Oxide based Poly Vinylalcohol nanocomposite Membranes and their Fuel Cell Measurement. Rev. Roum. Chim. 2021, 66, 391–397. [Google Scholar]
  26. Patil, M.; Mathad, S.N.; Patil, A.Y.; Arshad, M.N.; Alorfi, H.S.; Puttegowda, M.; Asiri, A.M.; Khan, A.; Azum, N. Synthesis and Characterization of Microwave-Assisted Copolymer Membranes of Poly(vinyl alcohol)-g-starchmethacrylate and Their Evaluation for Gas Transport Properties. Polymers 2022, 14, 350. [Google Scholar] [CrossRef]
  27. Patil, M.B. Synthesis and Characterization of heteropolyacid (H3PW12O40) embedded Poly (vinyl alcohol)-g-Acrylamide Copolymeric Membranes and their Evaluation for Proton Exchange Membrane Fuel Cells. Mater. Sci. Energy Technol. 2020, 3, 846–852. [Google Scholar] [CrossRef]
  28. Yedurkar, S.; Maurya, C.; Mahanwar, P. Biosynthesis of Zinc Oxide Nanoparticles Using Ixora Coccinea Leaf Extract—A Green Approach. Open J. Synth. Theory Appl. 2016, 5, 1–14. [Google Scholar] [CrossRef] [Green Version]
  29. Srinivasa Rao, S.N.; Basaveswara Rao, M.V. Structural and Optical Investigation of ZnO Nanopowders Synthesized from Zinc Chloride and Zinc Nitrate. Am. J. Mater. Sci. 2015, 5, 66–68. [Google Scholar]
  30. Tominov, R.V.; Vakulov, Z.E.; Avilov, V.I.; Khakhulin, D.A.; Fedotov, A.A.; Zamburg, E.G.; Smirnov, V.A.; Ageev, O.A. Synthesis and Memristor Effect of a Forming-Free ZnO Nanocrystalline Films. Nanomaterials 2020, 10, 1007. [Google Scholar] [CrossRef]
  31. Tymoszuk, A.; Wojnarowicz, J. Zinc Oxide and Zinc Oxide Nanoparticles Impact on In Vitro Germination and Seedling Growth in Allium cepa L. Materials 2020, 13, 2784. [Google Scholar] [CrossRef]
  32. Bigdeli, F.; Morsali, A.; Retalleau, P. Synthesis and Characterization of Different zinc (II) Oxide Nano-Structures from Direct Thermal Decomposition of ID Coordination Polymers. Polyhedron 2010, 29, 801–806. [Google Scholar] [CrossRef]
  33. Beams, R.; Woodcock, J.W.; Gilman, J.W.; Stranick, S.J. Phase Mask-Based Multimodal Superresolution Microscopy. Photonics 2017, 4, 39. [Google Scholar] [CrossRef] [Green Version]
  34. Usawattanakul, N.; Torgbo, S.; Sukyai, P.; Khantayanuwong, S.; Puangsin, B.; Srichola, P. Development of Nanocomposite Film Comprising of Polyvinyl Alcohol (PVA) Incorporated with Bacterial Cellulose Nanocrystals and Magnetite Nanoparticles. Polymers 2021, 13, 1778. [Google Scholar] [CrossRef] [PubMed]
  35. Fuku, X.; Diallo, A.; Maaza, M. Nanoscaled electrocatalytic optically modulated ZnO nanoparticles through green process of Punica granatum L. and their antibacterial activities. Int. J. Electrochem. 2016, 2016, 4682967. [Google Scholar] [CrossRef]
  36. Fuku, X.; Kaviyarasu, K.; Matinise, N.; Maaza, M. Punicalagin green functionalized Cu/Cu2O/ZnO/CuO nanocomposite for potential electrochemical transducer and catalyst. Nanoscale Res. Lett. 2016, 11, 386. [Google Scholar] [CrossRef] [PubMed] [Green Version]
  37. Matinise, N.; Fuku, X.G.; Kaviyarasu, K. ZnO nanoparticles via Moringa oleifera green synthesis: Physical properties & mechanism of formation. Appl. Surf. Sci. 2017, 406, 339–347. [Google Scholar] [CrossRef]
  38. Patil, M.B.; Rajamani, S.B.; Mathad, S.N.; Patil, A.Y.; Hussain, M.A.; Alorfii, H.S.; Khan, A.; Asiri, A.M.; Khan, I.; Puttegowda, M. Microwave-assisted synthesis of poly (acrylamide-co-2-hydroxyethyl methacrylate)/chitosan semi-IPN ZnO nanocomposite membranes for food packaging applications. J. Mater. Res. Technol. 2022, 20, 3537–3548. [Google Scholar] [CrossRef]
  39. Pismenskaya, N.; Mareev, S. Ion-Exchange Membranes and Processes (Volume II). Membranes 2021, 11, 816. [Google Scholar] [CrossRef] [PubMed]
Figure 1. Schematic diagram of nanocomposite polymeric membranes.
Crystals 12 01739 g001
Figure 2. Fuel cell assembly illustration.
Crystals 12 01739 g002
Figure 3. FTIR tracings of (A) Plain PVA and (B) PVA-ZnO membranes.
Crystals 12 01739 g003
Figure 4. X-RD patterns of ZnO Nanoparticles.
Crystals 12 01739 g004
Figure 5. SEM images of (A) Plain PVA, (B) PVA-ZnO-2.5%, (C) PVA-ZnO-5 and (D) PVA-ZnO-7.5% membranes.
Crystals 12 01739 g005
Figure 6. SEM images of ZnO nanoparticles.
Crystals 12 01739 g006
Figure 7. EDAX profile of ZnO nanoparticles.
Crystals 12 01739 g007
Figure 8. Histogram of the particle size distribution of ZnO nanoparticles.
Crystals 12 01739 g008
Figure 9. UV–visible spectrum of plain PVA solution and ZnO NPs embedded PVA solution.
Crystals 12 01739 g009
Figure 10. Mechanical Strength of the various prepared membranes.
Crystals 12 01739 g010
Figure 11. Ion exchange capacity of the plain and crosslinked membranes.
Crystals 12 01739 g011
Figure 12. Proton conductivity curves for the various ZnO NP loaded membranes.
Crystals 12 01739 g012
Table 1. Naming of the PVA nanocomposite membranes with varying ZnO concentration.
Sl. No.ZnO (gm)ZnO (%)Name
10.152.5M_1
20.35M_2
30.610M_3
Publisher’s Note: MDPI stays neutral with regard to jurisdictional claims in published maps and institutional affiliations.

