Article

Structural Characterization of Alzheimer DNA Promoter Sequences from the Amyloid Precursor Gene in the Presence of Thioflavin T and Analogs

1
Institute of Mineralogy and Crystallography “Acad. Ivan Kostov”, Bulgarian Academy of Sciences, Acad. G. Bonchev str., bl. 107, 1113 Sofia, Bulgaria
2
XRD2 Beamline, Elettra—Sincrotrone Trieste S.C.p.A., 34149 Basovizza, TS, Italy
3
Macromolecular Crystallographic Group, Stanford Synchrotron Radiation Lightsource, National Accelerator Laboratory, Stanford University, Stanford, CA 94309, USA
*
Authors to whom correspondence should be addressed.
Crystals 2022, 12(12), 1717; https://doi.org/10.3390/cryst12121717
Submission received: 1 November 2022 / Revised: 21 November 2022 / Accepted: 23 November 2022 / Published: 26 November 2022
(This article belongs to the Special Issue Nucleic Acid Crystallography Volume II)

Abstract

:
Understanding DNA–ligand binding interactions requires ligand screening, crystallization, and structure determination. In order to obtain insights into the amyloid peptide precursor (APP) gene–Thioflavin T (ThT) interaction, single crystals of two DNA sequences 5′-GCCCACCACGGC-3′ (PDB 8ASK) and d(CCGGGGTACCCCGG)2 (PDB 8ASH) were grown in the presence of ThT or its analogue 2-((4-(dimethylamino)benzylidene)amino)-3,6-dimethylbenzo[d]thiazol-3-ium iodide (XRB). Both structures were solved by molecular replacement. In the case of 8ASK, the space group was H3 with unit cell dimensions of a = b = 64.49 Å, c = 46.19 Å. Phases were obtained using a model generated by X3DNA. The novel 12-base-pair B-DNA structure did not have extra density for the ThT ligand. The 14-base-pair A-DNA structure with bound ThT analog XRB was isomorphous with previously the obtained apo-DNA structure 5WV7 (space group was P41212 with unit cell dimensions a = b = 41.76 Å, c = 88.96 Å). Binding of XRB to DNA slightly changes the DNA’s buckle parameters at the CpG regions. Comparison of the two conformations of the XRB molecule: alone and bound to DNA indicates that the binding results from the freedom of rotation of the two aromatic rings.

1. Introduction

The incidence of Alzheimer’s disease (AD), the most common form of dementia affecting millions of people worldwide, is increasing at an alarming rate due to the aging population. The exact causes for the development of AD have been intensively studied but still not clearly understood [1,2,3]. The two commonly accepted pathological features of AD require both the aggregation of extracellular amyloid plaques and intracellular neurofibrillary tangles in the brain [4,5]. The progressive long-term aggregation results in disruption of neural conduction, leading to noticeable negative cognitive and behavioral changes. The treatments used, give limited symptomatic improvements but cannot stop progression in the pathogenesis of the disease. It is known that the amyloid β (Aβ) peptide modulates normal brain activity and has a major contribution to the development of AD. Thus, a lot of research has been focused on Aβ peptide expression, accumulation, pathways and interactions.
The neurodegenerative phase of AD is found to begin at least ten years before the onset of clinical symptoms of mild cognitive deficits [4,5,6]. Diagnosis of dementia is based on a complex of cognitive and behavioral symptoms [7]. Exploration of the biological markers increases the safety of AD dementia diagnosis; further research is needed to capture the relevance of markers as diagnostic criteria or biological markers of Alzheimer’s disease [8,9]. Few compounds have been used extensively for the detection of AD [10]. In the last decade, some fluorescence molecular probes have been developed for the detection of amyloid fibrils, the most common is thioflavin T (ThT) [11,12]. The binding of ThT to Aβ aggregates is characterized by increased fluorescence and bathochromic shift. In addition to Aβ aggregates, ThT binding to DNA-specific sequences produces an increase in fluorescence [13,14,15]. This binding to the DNA may result in conformational changes which could be induced by non-covalent bonds, hydrophobic interactions, hydrogen bonds, weak van der Waals forces, etc. [16].
ThT molecules consist of two aromatic moieties—N,N-dimethylaniline and a 3,6-dimethylbenzo[d]thiazol-3-ium—connected by a single C–C bond. The single C–C bond allows the free rotation of the rings in solution, which quenches ThT fluorescence. On the other hand, when ThT is bound to Aβ or DNA the free rotation around the C–C bond is hampered and thus the fluorescence is enhanced [11,17,18]. ThT molecule can be excited at 450 nm and produces a strong fluorescence peak at 482 nm.
The focus of the present work was the co-crystallization of Alzheimer’s DNA promoter sequences of the amyloid precursor (APP) gene with thioflavin T and other fluorescent markers and ligands. The base pair (bp) sequence, of a specific DNA region of the amyloid precursor gene, identified as a promoter consists of no less than 695 bp [19], from which we selected several sequences and managed to crystallize a 12 bp and 14 bp sequence. The aim was to create a selection of suitable complexes for crystallization and co-crystallization of DNA oligonucleotide sequences from the promoter region of the APP gene, as well as sequences affecting the expression of the APP gene [20,21,22,23].

2. Materials and Methods

2.1. Materials

The dry oligonucleotide sequences were purchased from Eurofins MWG Genomics (Table S1). Thioflavin T and all starting reagents and solvents for the synthesis of new analogues of ThT derivatives were purchased from Sigma Aldrich (Merck) and Alfa Aesar and were used without further purification. TLC aluminum sheets (Silicagel 60 F254, Merck) were used for the determination of reaction progression and Rf (retention factor) values.

2.2. Synthesis of New Analogues of Thioflavin T Derivatives

The benzothiazole derivatives 2 and 3 were synthesized by a 2-step synthetic route involving azomethine compound formation followed by quaternization of the benzothiazole cyclic nitrogen atom (Scheme 1).
Initially, the standard procedure involving absolute ethanol as the reaction media and catalytic amount of glacial acetic acid (2–3 drops) was conducted for the preparation of the azomethine derivative 2. The resulting unsatisfactory yields (~45–50%) led to the modification of the reaction conditions with the addition of a molecular sieve 4 Å and replacing the ethanol with the water-immiscible dichloromethane. Moreover, according to the procedure described by Morales et al. [24], the catalytic amount of pyrrolidine (10 mol %) was also added in the reaction mixture. Previous authors [24] have suggested that pyrrolidine forms an intermediate product with the aldehyde that has increased reactivity towards the amine. Indeed, this modification led to an increase in the yield of compound 2 by up to 80%. The reaction for the preparation of 2 was carried at a 1.1:1 molar ratio (excess aldehyde) for 6 h at 25 °C (r.t.). The reaction completion was confirmed with thin-layer chromatography using an ethylacetate:hexane (3:1 v/v) solvent system. The crude reaction mixture was then filtered three times over a short pad of Celite® 545 in order to remove the 4 Å molecular sieve and the pyrrolidine catalyst. The filtrate was vacuum-evaporated, washed with ethanol (3 × 10 mL) and recrystallized from methanol. Azomethine formation was followed by quaternization of the nitrogen atom in the benzothiazole moiety of 2 with a 6-fold excess of methyl iodide (CH3I) for 12 h at 60 °C in acetonitrile. The resulting quaternary product 3 formed directly from the mother liquid as a dark violet crystalline precipitate that was filtered and washed with ethanol (3 × 10 mL).
The purity and the molecular structure of the products was assessed with 1H- and 13C-NMR techniques and also the degree of purity was evaluated by observing the melting point endothermic effects with differential scanning calorimetry. The crystalline state of the materials was investigated with powder and single-crystal X-ray diffraction analysis.

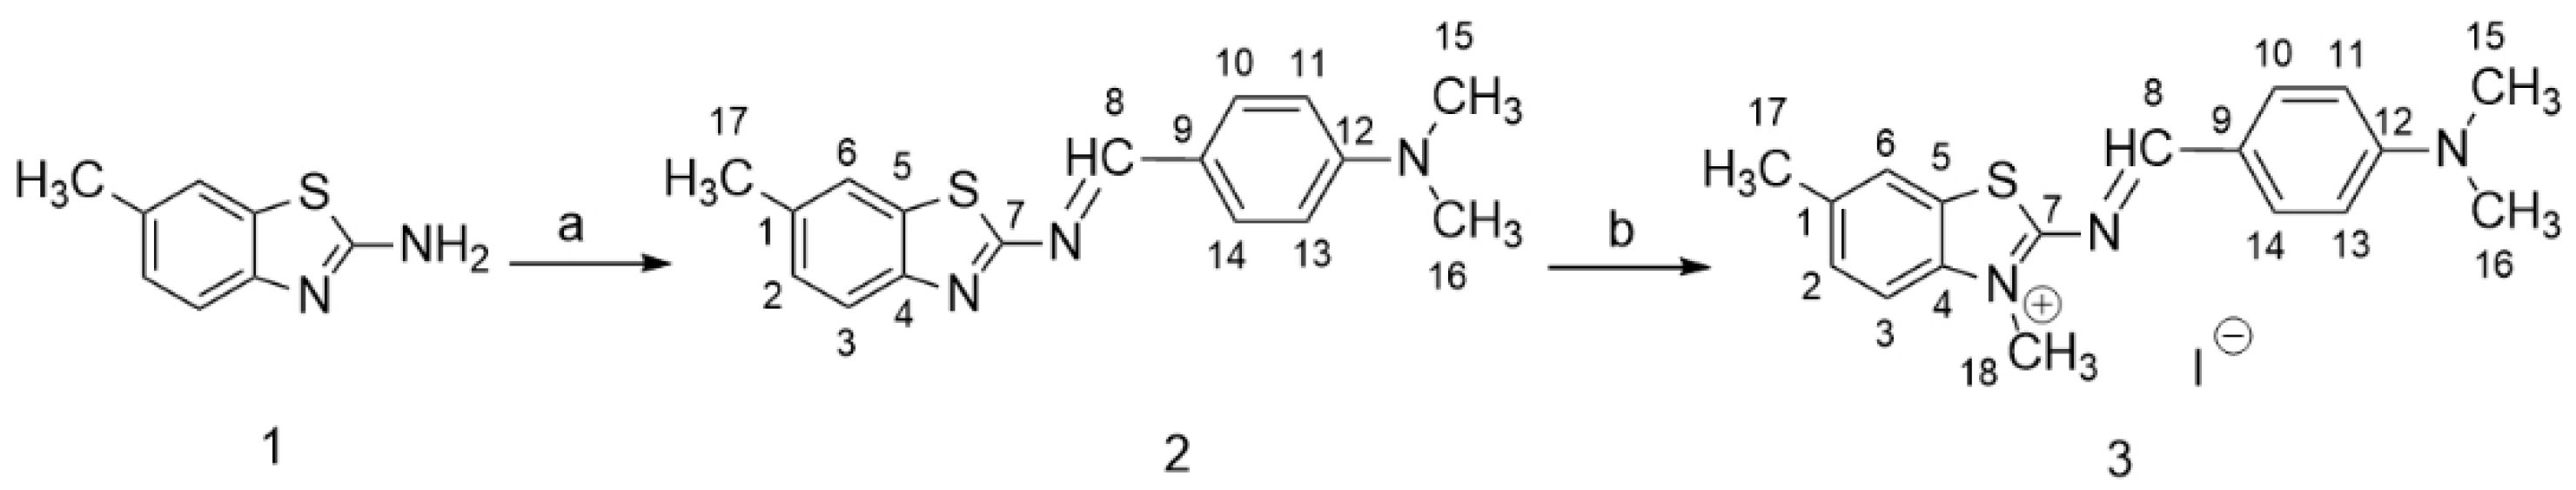
2.2.1. N,N-Dimethyl-4-(((6-methylbenzo[d]thiazol-2-yl)imino)methyl)aniline (2)

4-(dimethylamino)benzaldehyde (330 mg, 2.2 mmol), 2-amino-6-methylbenzothiazole (329 mg, 2 mmol), 15 mL DCM, 0.5 g 4Å MS and 10 mol % pyrrolidine, 6 h, 25 °C. Compound 2: yield 80%, Rf—ethylacetate: hexane (3:1 v/v) 0.82; yellow plates (Methanol); mp 193–195 °C; 1H NMR (DMSO-d6, 600 MHz) δ 2.42 (3H, s, CH3-17), 3.07 (6H, s, CH3-15 and CH3-16), 6.82 (2H, d, J = 9.1 Hz, CH-11 and CH-13), 7.27 (1H, ddd, J = 8.2, 1.9, 0.8 Hz, CH-2), 7.72 (1H, d, J = 8.2 Hz, CH-3), 7.77 (1H, dt, J = 1.7, 0.8 Hz, CH-6), 7.88 (2H, m, CH-10 and CH-14), 8.89 (1H, s, CH-8); 13C NMR (DMSO-d6, 151 MHz) δ 21.54 (C-17), 40.20 (C-15 and C-16), 112.13 (C-11 and C-13), 122.06 (C-3), 122.23 (C-6), 128.22 (C-2), 132.85 (C-10 and C-14), 133.62 (Cq-1), 134.17 (Cq-5), 149.66 (Cq-4), 153.80 (Cq-12) 166.07 (C-8), 171.53 (Cq-7), Cq-9 not observed.

2.2.2. 2-((4-(Dimethylamino)benzylidene)amino)-3,6-dimethylbenzo[d]thiazol-3-ium iodide (3)

Compound 2 (89 mg, 0.3 mmol), methyliodide (1.8 mmol, 261 mg, 116 µL), 5 mL Acetonitrile, 12 h, 60 °C. Compound 3: yield 60%, violet plates (Acetonitrile); mp 229–233 °C; 1H NMR (DMSO-d6, 600 MHz) δ 2.39 (3H, s, CH3-17), 3.04 (6H, s, CH3-15 and CH3-16), 3.69 (3H, s, CH3-18), 6.79 (2H, m, CH-11 and CH-13), 7.38 (1H, ddd, J = 8.4, 1.7, 0.8 Hz, CH-2), 7.56 (1H, d, J = 8.3 Hz, CH-3), 7.68 (2H, m, CH-10 and CH-14), 7.78 (1H, dd, CH-6) 9.66 (1H, s, CH-8); 13C NMR (DMSO-d6, 151 MHz) δ 14.64 (C-8), 20.55 (C-17), 31.86 (C-18), 39.56 (C-15 and C-16), 110.80 (C-11 and C-13), 112.86 (C-3), 122.23 (Cq–1), 123.13 (C-6), 124.41 (Cq-9), 128.44 (C-2), 131.62 (C-10 and C-14), 134.94 (Cq-5), 137.07 (Cq-4), 154.24 (Cq-12), 167.63 (Cq-7).

2.2.3. Nuclear Magnetic Resonance Spectroscopy (NMR Spectroscopy)

The NMR spectra were recorded on a Bruker Avance II+ 600 spectrometer (Rheinstetten, Germany), 1H at 600 MHz and 13C at 151 MHz, in DMSO-d6; the chemical shifts were quoted in ppm in δ-values against the solvent peak and the coupling constants were calculated in Hz. The spectra were processed with Topspin 3.6.5 program (Bruker, Biospin, Germany). The carbon resonances of the compounds were extracted from 2D heterocorrelations HSQC and HMBC. The 1H- and 13C-1D-NMR spectra of compounds 2 and 3 are given in Supplementary Materials as Figures S1 and S2.

2.3. Powder X-ray Diffraction (PXRD)

Powder XRD patterns were determined for the physical powder of the ThT analogues to establish the crystalline properties, purity, and eventual presence of polymorphs. Powder samples of the synthesized quaternary ammonium compounds were analyzed on an Empyrean Powder X-ray diffractometer (Malvern Panalytical, Netherlands) in the 2–50° 2θ range using Cu radiation (λ = 1.5406 Å) and a PIXcel3D detector. The diffraction patterns of the precipitates were compared with those of the starting compounds to confirm the presence or absence of additional phases (Figure S3).

2.4. Single Crystal X-ray Diffraction (SCXRD)

Single crystals of synthesized derivatives of suitable size and diffracting quality were mounted on nylon loops. Diffraction data were collected on a Bruker D8 Venture diffractometer equipped with a IµS micro-focus sealed X-ray source (MoKα radiation, λ = 0.71073 Å) and a PHOTON II CPAD detector. The collected data were processed with APEX4 software [25]. The structures were solved with intrinsic methods and refined by the full-matrix least-squares method on F2 ShelxT and ShelxL [26,27] program packages using OLEX2-ver. 1.5 software [28]. All non-hydrogen atoms were located successfully from Fourier map and were refined anisotropically. Hydrogen atoms were placed on calculated positions riding on the parent carbon atoms (Ueq = 1.2 for C-Haromatic = 0.93 Å and C-Hmethylenic = 0.97 Å) while those riding on heteroatoms were refined from the electron density maps. Ortep-3v2 software [29] was used to prepare the figures. Complete crystallographic data for the structure of compounds 2 and 3 reported in this paper have been deposited in the CIF format with the Cambridge Crystallographic Data Center as 2211388 and 2198995, respectively. These data can be obtained free of charge via http://www.ccdc.cam.ac.uk/conts/retrieving.html, deposited on 15 June 2022, (or from the CCDC, 12 Union Road, Cambridge CB2 1EZ, UK; Fax: +44-1223336033; E-mail: [email protected]). Compound 3 has been deposited as a XRB monomer in the PDB.

2.5. Thermal Analysis (DSC)

Differential scanning calorimetry was conducted to estimate desolvation, polymorphism, thermotropic properties, and thermal behaviors of the new analogues of ThT. DSC analyses were performed on Discovery DSC250 (TA instruments, New Castle DE, USA). Samples weighing between 1 and 5 mg were heated in aluminum pans from 20 to 300 °C (10 °C·min−1) in argon (flow rate 10 mL·min−1). Endo/Exothermic effects of solvent evaporation, melting point, and decomposition of the synthesized compounds were determined from the DSC experiments.

2.6. Fluorescent Intercalator Displacement (FID) Assay

For the fluorescence emission spectrum analysis of DNA intercalation, ethidium bromide (EtBr), ThT, and XRB were dissolved in water. The FID required the addition of EtBr to the pre-formed dsDNA followed by the addition of ThT or XRB, measuring the subsequent displacement (change in intensity) signal. The excitation wavelength of the non-specific fluorescent intercalator EtBr, was 310 nm while the emission detection was set to 610 nm. The fluorescence was measured using 1 cm path length quartz minicells (0.35 mL). The dark counts (background) were subtracted, and the spectra were corrected for wavelength-dependent instrument sensitivity. Intensity spectra were collected using a Perkin Elmer LS50 (excitation and receiving slits set to 5 nm and an integration time of 2.0 s). The fluorescent experiments also included two specific fluorescent dyes: DAPI (excitation at 358 nm and emission at 461 nm) and Berenil (excitation at 520 nm and emission at 600 nm)—both interact with A–T domains.

2.7. Samples Crystallization

The crystallization screen for the macromolecules was based on: PEG 400, KCl, Na/K cacodylate, spermine tetrachloride, MPD, H2O, vapor diffusion, and hanging drop [30], at RT (293 K). The successful crystallization conditions contained sodium cacodylate (NaCaCo) (pH 6.9), alcohol (2-propanol or methylpentanediol (MPD), cations (Mg2+, Ba2+) and polyamines (spermine). Finding the right conditions for obtaining high-quality single crystals of the particular DNA sequences require a lot of careful tinkering. For example, the tested DNA sequences, the optimization of the crystallization conditions produced crystal growth only for the conditions featuring spermine. Dry (lyophilized) oligonucleotide sequences were dissolved to 2 mM concentration and were annealed for 1 min at 75 °C before use in order to obtain double-stranded DNA (dsDNA). The crystallization conditions for the 12 bp DNA sequence (8ASK), related to adenosine triphosphate binding cassette subfamily C member 1 (ABCC1) that modulates APP clearance [31,32,33], comprised 30 mM NaCaCo (pH 6.9), 60 mM MgCl2, 10% MPD, 1 mM spermine. Ligands were dissolved in the same solution to 2 mM concentration. The crystallization conditions for 5WV7 [34] were also used for the same 14 bp DNA but with the addition of XRB (8ASH). It comprised 50 mM NaCaCo (pH 6.9), 1 mM BaCl2, 8% MPD, 5 mM spermine. Ligand 3, XRB was dissolved in the same solution to 2 mM concentration. Crystals were grown by the “hanging drop” method by mixing 1.5 μL (2 mM) ligand and 1.5 μL DNA (2 mM) (3 μL total drop volume) at room temperature, equilibrated against a 50% MPD reservoir. Crystallization plates were stored in controlled temperature rooms (16–20 °C). Large crystals (0.4 × 0.3 × 0.3 mm3) suitable for single crystal X-ray analysis formed within a month.

2.8. Macromolecules Data Collection and Processing

Crystals were mounted on loops, cooled in liquid nitrogen and subsequently stored and transported in a cryogenic dewar. All data were collected on 3 August 2022 at the Elettra Synchrotron Trieste, XRD2 structural biology beamline using a MD2s microdiffractometer and a Pilatus 6M detector. The light source used by the beamline is a superconducting wiggler. Wavelength (0.99Å) was selected using a cryogenically cooled dual-crystal Si monochromator. The beam was defined using a 100 μm aperture and further cleaned using a 200 μm capillary, while sample cooling was performed using an open flow nitrogen cryostat at 100 K. Data processing was carried out using XDS [35] and XSCALE [36].

2.9. Macromolecules Structure Solution and Refinement

The phases were obtained by molecular replacement (MR) with Phaser [37,38]. Refinement of the structures involved several cycles of refinement using REFMAC5 [39] and Coot [40]. The ligand (XRB) was positioned from the FoFc difference map using the Coot interface. Visual analyses of the model and the electron-density maps were carried out using Coot. X3DNA [41] was used to carry out structural analysis and geometrical calculations of DNA parameters. USFC Chimera [42] and LigPlot+ [43] were used to prepare the figures. The coordinates and structural factors have been deposited in the Protein Data Bank (PDB) as entries 8ASH for the 14 bp A-DNA and XRB ligand structure and 8ASK for the novel 12 bp B-DNA structure.

3. Results

The newly synthesized ThT analogs were fully characterized with 1H- and 13C-NMR in solution, by single crystal analysis, powder XRD and DSC. Orange single crystals of compound 2 were obtained by slow evaporation from hot methanol solution, while dark violet crystals of the quaternary ammonium product 3 were obtained directly from the reaction mixture (acetonitrile). Compounds 2 and 3 crystallized in the monoclinic P21/c and orthorhombic P212121 space groups, respectively with one molecule in the asymmetric unit (ASU) and four molecules in the unit cell (Table 1). In addition, compound 3 was a crystal solvate having an acetonitrile molecule in the crystal structure. ORTEP view of the molecules in the ASU of compounds 2 and 3 with the appropriate labeling scheme are shown in Figure 1. Selected bond lengths and angles from the single crystal X-ray diffraction experiment are given in Table S2 and they are comparable with other similar structures in the Cambridge structural database (CCDC, ref. FASQEZ [44], ATISIH [45], MUVQEC [46] and XEZFEP [47]).
The molecules of compounds 2 and 3 (Figure 1) were nearly planar with rmsd values of the respective benzothiazole and N,N—dimethylaniline moieties of 0.008/0.028 and 0.021/0.20 Å, respectively. In addition, the angle between the mean planes and the twist and fold angles of the two moieties in 2 and 3 were almost identical, 6.44 (6)°/5.80 (6)°/2.82 (4)° and 7.3 (4)°/6.6 (4)°/3.2 (2)°, respectively. However, it was clearly seen from the overlay of molecules 2 and 3 (Figure 2) that a different orientation of the benzothiazole and N,N-dimethylaniline moieties in respect to the N=CH double bond was present. This difference, together with the quaternization of the heterocyclic nitrogen atom, could be the reason to the drastic color shift from orange (2) to dark violet (3).
The molecules of compounds 2 and 3 had only weak proton donating groups (-CH3) and lacked proton acceptor groups (such as C=O, NO2) therefore hydrogen bonding interactions were not expected. The crystal structures were stabilized by a network of short contacts (for 2) or a combination of short contacts and halogen bonding interactions (for 3). The combination of such contacts contributed to the specific three-dimensional arrangement of the molecules in the crystal structure of 2 and 3. (Figure 3) disclosing the formation of pseudo-layers.
To test the newly synthesized ligands for stability and suitability for protein crystallization we used DSC analysis. Compounds 2 and 3 were heated up to 300 °C and their DSC thermograms are shown on Figure 4. The DSC thermogram of compound 2 (Figure 4a) revealed a weak endo effect with a maximum at 158. 76 °C (∆H = 5.3515 J/g) probably due to phase transition, followed by a strong and narrow endo effect (maxima at 194.42 °C, ∆H = 82.440 J/g) corresponding to the melting of the crystals of compound 2. As proven from the SCXRD experiment, compound 3 is a crystal solvate with acetonitrile in the crystal structure. This structure peculiarity was reaffirmed by the strong and wide endo effect with a maximum at 111.42 °C (∆H = 49.708 J/g, Figure 4b) corresponding to acetonitrile leaving the crystal structure. The melting of the crystals of 3 occurred at 233.35 °C (∆H = 20.864 J/g) followed by an exo effect of rapid decomposition at 237.00 °C (∆H = 55.472 J/g). Based on the results from the DSC analysis, prior to the crystallization experiments, compound 3 was heated for 2 h at 105–110 °C to remove acetonitrile. The characterization of compound 3, a thioflavin T homologue, revealed high purity and stability. These results indicated that compounds 2 and 3 were stable below 100 °C (no decomposition or phase transitions), which made them suitable for crystallization with DNA, and FID analysis.

4. Discussion

For the verification of DNA–ligand interaction, the fluorescent intercalator displacement method was used. Fluorescence spectroscopy [48] is an effective nano-methodology (requiring nM quantities of DNA) and is suitable for the analysis of anticipated interactions. Thus, to assess DNA–ligand interactions, an FID assay was performed. The FID measurements involved a non-specific binder such as EtBr and a specific DNA ligand. The results of the fluorescence experiments (Figure 5a) showed that as an unspecific binder, EtBr produced a very strong increase in fluorescence intensity [49] compared to the DNA alone for all the tested sequences (refer to Table S1 for any lettered abbreviated sequences). When adding ThT into the solutions of 1QV4-EtBr, 8ASH-EtBr, PAD102-EtBr, and PADL1-EtBr the emission intensity value decreased. Similarly, emission intensity variations due to a different degree of prominence of the interaction, were also observed for the rest of the tested ligands XRB, DAPI and Berenil. Seemingly, ThT, XRB, DAPI and Berenil interacted with the DNA, weakening the effect of the unspecific interaction of EtBr, described fluorescent intercalator displacement. In comparison, when adding ThT, XRB, DAPI and Berenil into the solutions of ABCC1-EtBr, PAD1FR-EtBr, PADS-EtBr and PADM-EtBr the intensity values practically did not change or even increase. In fact, ABCC1, PAD1FR, PADS and PADM constructs were not as self-complementary compared to the rest of the sequences. This probably affected the experimental conditions and also suggests that the tested ligands did not bind in the same manner as ethidium bromide [50]. Hydrogen bonding, van der Waals forces, hydrophobic interactions and electrostatic interactions are the four major non-covalent interactions that play an important role in DNA–ligand interaction [51]. In the cases where intensity values increased, the explanation may be related to the presence of ssDNA in the solutions or a groove manner of interaction [52,53,54,55].
Additional information that can be assessed from the FID experiment is the behavior of the two homologous derivatives, ThT and XRB. It can be seen from the intensity values (Figure 5b), that ThT and XRB interacted in an analogous way with the different tested DNA sequences. It is evident that the interaction of thioflavin T appeared to be stronger than that of XRB. Although, we obtained colored crystals of the corresponding sequences with thioflavin T, our attempts to collect experiments from these crystals, suitable for structural analysis, were unsuccessful. Thus, at this stage the insights of the interaction and mode of ThT binding remains elusive.
The asymmetric unit of PDB entry 8ASH consists of two chemically equivalent self-complementary strands (each of 14 bases in length) forming an antiparallel A-type helix (Figure 6a). Table 2 gives the crystallographic data-collection and refinement statistics parameters for 8ASH and 8ASK.
The sequence d(CCCCGGTACCGGGG)2 which was used as a model in the molecular-replacement calculations for the solution of the present structure is also a tetradecamer that crystallizes as A-type DNA and is deposited as 5WV7 in PDB [34]. Both crystal structures belong to P41212 space group. The minor groove of 8ASH double-stranded oligonucleotide features a central TpA step (AT) surrounded by C/G-rich regions. Its overall secondary structure is comparable to 5WV7. The base-pair morphology values for shear, stretch, stagger, buckle, opening and propeller twist obtained using w3DNA [56] are shown in Table 3.
The interaction of XRB slightly changed the conformation of the DNA when they formed a complex. The variation in the buckle for 8ASH decreased at CpG regions and at the end of the sequence, while buckle, opening and propeller twist values increased at the TpA. The most pronounced differences in the core TpA region were the values of buckle 1.44 and 10.37 for T–A pairs 0.88–11.26 in 8ASH and 5WV7, respectively; propeller twists were −6.34 and −5.41 and those of opening were 0.16 and 1.0, respectively, for A–T pairs 7–8. The most pronounced differences in the CpG regions were the values of buckle −0.7 and −3.55 for G–C pairs (13–14) −1.13 and −2.36 in 8ASH and 5WV7, respectively. The interaction of XRB destabilized the CpG conformation, while in contrast the minor groove at the core of the sequence showed stabilization. Consequently, owing to this compensatory behavior, although the DNA conformation was slightly altered the hydrogen bonds were kept unchanged. The intrastrand interactions in PDB entry of 8ASH produced one and the same motif that was in agreement with the tetradecamer A-DNA duplex structural features of 5WV7 [34]. XRB interacts at the G-C regions located at the ends of the DNA strands (Figure 7). The XRB positioning does not spread to the AT region of the DNA. Indeed, this is to be expected as XRB is longer than ThT and requiring more space. The location of XRB in the G–C region was of hydrophobic character, displacing water molecules. This hydrophobic interaction was also favored by the hydrophobic nature of the upper and lower surface of the purine and pyrimidine rings. As XRB is positively charged, compensating for the negative charge of the DNA could also be a factor. Considering that slightly higher B-factors of the XRB ligand (average value of 177 Å2) we attempted to refine the occupancy. The occupancy was set to 0.75 for XRB as lowering it below 0.75 did not further improve the refinement parameters and B-factors. Based on the experimental results and analysis a working hypothesis can be stated: that thioflavin T and its analogue XRB show an unstable (reversible) interaction with the DNA molecule.
The structure of the sequence 5′-GCCCACCACGGC-3′, PDB entry 8ASK is shown in Figure 6b as a B-DNA helix. The structure of the 8ASK with the listed sequence is completely new, reported for the first time in the PDB. In order to form the double helix, the sequences 5′-GCCCACCACGGC-3′ and 5′-GCCGTGGTGGGC-3′ were annealed at 75 °C and later crystallized in presence of thioflavin T, but ThT was not present in the structure of 8ASK. Initially, a uniform B-DNA model for this sequence was constructed using w3DNA [56] and was used in the molecular replacement structure solution. The asymmetric unit of PDB entry 8ASK consisted of two complementary DNA strands (each of 12 bases in length) forming an antiparallel right-handed DNA helix. The B-type DNA duplex was formed by classical Watson–Crick (W-C) hydrogen-bonding base-pairing interactions between the two strands. Table 4 gives the average helical parameters which are very close to the ideal ones for 8ASK. The average value of the twist for this structure is 36.3° and the average rise is 3.36 Å compared to the commonly B-DNA fiber models of 36.0° and 3.375 Å. This implies a helical pitch of about 33.7 Å, with nearly 10.5 base pairs per turn. An interesting observation was the lack of surrounding water molecules in 8ASK (although at 3.0 Å, resolution density for the water molecules may not have been detected). A similar hydrophobic effect was also observed in the structure of 8ASH, featuring the XRB (a structural analogue of ThT). Our assumption is that ThT and its analogues bind dynamically to DNA, thus the electron density for the water is smeared. A search in the database revealed that the RNA structure 2RRC [57] has a partial sequence similarity in the 5′-GGACCCACCACGGCGAGGUCCA-3′ underlined region. One should note that 2RRC is reported as an RNA aptamer that mimics DNA architecture [57].

5. Conclusions

The synthesized 2-((4-(dimethylamino)benzylidene)amino)-3,6-dimethylbenzo[d]-thiazol-3-ium iodide (compound 3 or XRB in PDB) is a homologue of thioflavin T. The interaction of 3 with DNA was confirmed by FID and single crystal analysis. The structure of the tetradecamer oligonucleotide sequence d(CCGGGGTACCCCGG)2 with XRB was solved at a resolution of 1.84 Å (PDB 8ASH). The XRB interaction with A-DNA form is driven by hydrophobic interactions. The crystal structure of the sequence 5′-GCCCACCACGGC-3′, was reported for the first time in the PDB as 8ASK at 2.96 Å resolution. The DNA exhibited a conformation that is typical for B-DNA with structural parameters that closely match the theoretical values. The research represents an improvement on the optimal conditions for crystallization and co-crystallization of selected DNA sequences, e.g., from the promoter region of the APP gene as well as their subsequent co-crystallization with thioflavin T and other fluorescent markers and ligands.

Supplementary Materials

The following supporting information can be downloaded at: https://www.mdpi.com/article/10.3390/cryst12121717/s1, Figure S1: 1H- and 13C-NMRs of compound 2; Figure S2: 1H- and 13C-NMRs of compound 3; Figure S3: Comparison of the X-ray powder diffraction patterns of the starting and synthesized compounds 2 and 3; Table S1: Main characteristics of some of the selected and tested oligonucleotide sequences; Table S2: Selected bond lengths and angles for 2 and 3.

Author Contributions

Conceptualization, H.S.-D., R.R. and B.L.S.; formal analysis, H.S.-D., T.D. and A.H.; visualization, H.S.-D., R.R. and B.L.S.; investigation (PXRD), R.R.; investigation (single crystal), H.S.-D., T.D., A.H., R.R. and B.L.S.; investigation (FID), H.S.-D. and N.K.; (DSC), R.R. and N.K.; methodology, H.S.-D., N.K., B.L.S. and R.R.; software, B.L.S. and T.D.; writing—original draft, H.S.-D., T.D., B.L.S. and R.R.; funding acquisition, H.S.-D. All authors have read and agreed to the published version of the manuscript.

Funding

This research was funded by the Bulgarian National Science Fund (BNSF), grant number KP-06-M31/1.

Data Availability Statement

Complete crystallographic data for the structures of 8ASK and 8ASH reported in this paper have been deposited in the mmCIF format. The complete crystallographic data for the structure of XRB reported in this paper have been deposited in the CIF format with the Cambridge Crystallographic Data Center as 2198995. These data can be obtained free of charge via http://www.ccdc.cam.ac.uk/conts/retrieving.html, deposited on 15 June 2022 (or from the CCDC, 12 Union Road, Cambridge CB2 1EZ, UK; Fax: +44-1223336033; E-mail: [email protected]). Complete crystallographic data for the structure of 8ASH and 8ASK reported in this paper have been deposited in the mmCIF format on the RCSB Protein Data Bank https://www.rcsb.org/.

Acknowledgments

We acknowledge Elettra Sincrotrone Trieste for providing access to its synchrotron radiation facilities under proposals 20195613, 20210594, and we thank Nicola Demitri for assistance in using beamline XRD2. The authors acknowledge the technical support from the project BG05M2OP001-1.002-0005, Perimed (2018–2023).

Conflicts of Interest

The authors declare no conflict of interest.

References

  1. Zhang, X.; Fu, Z.; Meng, L.; He, M.; Zhang, Z. The early events that initiate β-amyloid aggregation in Alzheimer’s disease. Front. Aging Neurosci. 2018, 10, 359. [Google Scholar] [CrossRef]
  2. Stanciu, G.; Luca, A.; Rusu, R.; Bild, V.; Beschea Chiriac, S.; Solcan, C.; Bild, W.; Ababei, D. Alzheimer’s disease pharmacotherapy in relation to cholinergic system involvement. Biomolecules 2019, 10, 40. [Google Scholar] [CrossRef] [PubMed] [Green Version]
  3. Ryan, P.; Patel, B.; Makwana, V.; Jadhav, H.R.; Kiefel, M.; Davey, A.; Reekie, T.A.; Rudrawar, S.; Kassiou, M. Peptides, peptidomimetics, and carbohydrate–peptide conjugates as amyloidogenic aggregation inhibitors for Alzheimer’s disease. ACS Chem. Neurosci. 2018, 9, 1530–1551. [Google Scholar] [CrossRef]
  4. McKhann, G.M.; Knopman, D.S.; Chertkow, H.; Hyman, B.T.; Jack, C.R., Jr.; Kawas, C.H.; Klunk, W.E.; Koroshetz, W.J.; Manly, J.J.; Mayeux, R. The diagnosis of dementia due to Alzheimer’s disease: Recommendations from the National Institute on Aging-Alzheimer’s Association workgroups on diagnostic guidelines for Alzheimer’s disease. Alzheimer’s Dement. 2011, 7, 263–269. [Google Scholar] [CrossRef] [PubMed] [Green Version]
  5. Bondareff, W.; Mountjoy, C.; Roth, M.; Hauser, D. Neurofibrillary degeneration and neuronal loss in Alzheimer’s disease. Neurobiol. Aging 1989, 10, 709–715. [Google Scholar] [CrossRef] [PubMed]
  6. Liu, P.-P.; Xie, Y.; Meng, X.-Y.; Kang, J.-S. History and progress of hypotheses and clinical trials for Alzheimer’s disease. Signal Transduct. Target. Ther. 2019, 4, 1–22. [Google Scholar] [CrossRef] [PubMed] [Green Version]
  7. Association, A. Early signs and symptoms of Alzheimer’s. Alzheimer’s Dement. 2019, 1–88. [Google Scholar]
  8. Souza, L.C.d.; Sarazin, M.; Teixeira Júnior, A.L.; Caramelli, P.; Santos, A.E.d.; Dubois, B. Biomarcadores da doença de Alzheimer. Arq. Neuro-Psiquiatr. 2014, 72, 227–231. [Google Scholar] [CrossRef] [Green Version]
  9. Maezawa, I.; Hong, H.S.; Liu, R.; Wu, C.Y.; Cheng, R.H.; Kung, M.P.; Kung, H.F.; Lam, K.S.; Oddo, S.; LaFerla, F.M. Congo red and thioflavin-T analogs detect Aβ oligomers. J. Neurochem. 2008, 104, 457–468. [Google Scholar] [CrossRef]
  10. Frisoni, G.B.; Bocchetta, M.; Chételat, G.; Rabinovici, G.D.; De Leon, M.J.; Kaye, J.; Reiman, E.M.; Scheltens, P.; Barkhof, F.; Black, S.E. Imaging markers for Alzheimer disease: Which vs how. Neurology 2013, 81, 487–500. [Google Scholar] [CrossRef]
  11. Groenning, M. Binding mode of Thioflavin T and other molecular probes in the context of amyloid fibrils—Current status. J. Chem. Biol. 2010, 3, 1–18. [Google Scholar] [CrossRef]
  12. Jamali, M.; Mohajer, S.; Sheikhlary, S.; Ara, M.H.M. Z-scan optical method complements the Thioflavin T assay for investigation of anti-Alzheimer’s impact of polyphenols. Photodiagnosis Photodyn. Ther. 2022, 39, 102914. [Google Scholar] [CrossRef]
  13. Biancardi, A.; Biver, T.; Mennucci, B. Fluorescent dyes in the context of DNA-binding: The case of Thioflavin T. Int. J. Quantum Chem. 2017, 117, e25349. [Google Scholar] [CrossRef]
  14. Wang, H.; Peng, P.; Liu, S.; Li, T. Thioflavin T behaves as an efficient fluorescent ligand for label-free ATP aptasensor. Anal. Bioanal. Chem. 2016, 408, 7927–7934. [Google Scholar] [CrossRef]
  15. Gu, P.; Lu, Y.; Li, S.; Ma, C. A Label-Free Fluorescence Aptasensor Based on G-Quadruplex/Thioflavin T Complex for the Detection of Trypsin. Molecules 2022, 27, 6093. [Google Scholar] [CrossRef]
  16. Liu, L.; Shao, Y.; Peng, J.; Liu, H.; Zhang, L. Selective recognition of ds-DNA cavities by a molecular rotor: Switched fluorescence of thioflavin T. Mol. BioSystems 2013, 9, 2512–2519. [Google Scholar] [CrossRef] [PubMed]
  17. Biancalana, M.; Koide, S. Molecular mechanism of Thioflavin-T binding to amyloid fibrils. Biochim. Biophys. Acta Proteins Proteom. 2010, 1804, 1405–1412. [Google Scholar] [CrossRef] [PubMed] [Green Version]
  18. Levine III, H. Thioflavine T interaction with synthetic Alzheimer’s disease β-amyloid peptides: Detection of amyloid aggregation in solution. Protein Sci. 1993, 2, 404–410. [Google Scholar] [CrossRef] [PubMed]
  19. Salbaum, J.M.; Weidemann, A.; Lemaire, H.; Masters, C.; Beyreuther, K. The promoter of Alzheimer’s disease amyloid A4 precursor gene. EMBO J. 1988, 7, 2807–2813. [Google Scholar] [CrossRef]
  20. Chernak, J.M. Structural features of the 5′ upstream regulatory region of the gene encoding rat amyloid precursor protein. Gene 1993, 133, 255–260. [Google Scholar] [CrossRef]
  21. Brohede, J.; Rinde, M.; Winblad, B.; Graff, C. A DNA methylation study of the amyloid precursor protein gene in several brain regions from patients with familial Alzheimer disease. J. Neurogenet. 2010, 24, 179–181. [Google Scholar] [CrossRef] [PubMed]
  22. Jepsen, W. Adenosine Triphosphate Binding Cassette Subfamily C Member 1 (ABCC1) Modulates Amyloid Precursor Protein (APP) Processing: A Potential Therapeutic Target for the Treatment of Alzheimer’s Disease. Ph.D. Thesis, Arizona State University, Tempe, AZ, USA, 2021. [Google Scholar]
  23. Rebecchi, I.M.M.; Rodrigues, A.C.; Arazi, S.S.; Genvigir, F.D.V.; Willrich, M.A.V.; Hirata, M.H.; Soares, S.A.; Bertolami, M.C.; Faludi, A.A.; Bernik, M.M.S. ABCB1 and ABCC1 expression in peripheral mononuclear cells is influenced by gene polymorphisms and atorvastatin treatment. Biochem. Pharmacol. 2009, 77, 66–75. [Google Scholar] [CrossRef] [PubMed]
  24. Morales, S.; Guijarro, F.G.; Garcia Ruano, J.L.; Cid, M.B. A general aminocatalytic method for the synthesis of aldimines. J. Am. Chem. Soc. 2014, 136, 1082–1089. [Google Scholar] [CrossRef]
  25. Bruker AXS. APEX3, SAINT-Plus, XPREP; Bruker AXS Inc.: Madison, WI, USA, 2016. [Google Scholar]
  26. Sheldrick, G. A short history of SHELX. Acta Crystallogr. Sect. A 2008, 64, 112–122. [Google Scholar] [CrossRef] [PubMed] [Green Version]
  27. Sheldrick, G.M. SHELXT–Integrated space-group and crystal-structure determination. Acta Crystallogr. Sect. A Found. Adv. 2015, 71, 3–8. [Google Scholar] [CrossRef] [Green Version]
  28. Dolomanov, O.V.; Bourhis, L.J.; Gildea, R.J.; Howard, J.A.; Puschmann, H. OLEX2: A complete structure solution, refinement and analysis program. J. Appl. Crystallogr. 2009, 42, 339–341. [Google Scholar] [CrossRef]
  29. Faruggia, L. ORTEP-3 V2. 02 for Windows; University of Glasgow: Glasgow, Scotland, 2008. [Google Scholar]
  30. Luft, J.R.; Detitta, G.T. HANGMAN: A macromolecular hanging-drop vapor-diffusion technique. J. Appl. Crystallogr. 1992, 25, 324–325. [Google Scholar] [CrossRef]
  31. Krohn, M.; Bracke, A.; Avchalumov, Y.; Schumacher, T.; Hofrichter, J.; Paarmann, K.; Fröhlich, C.; Lange, C.; Brüning, T.; von Bohlen und Halbach, O. Accumulation of murine amyloid-β mimics early Alzheimer’s disease. Brain 2015, 138, 2370–2382. [Google Scholar] [CrossRef]
  32. Krohn, M.; Lange, C.; Hofrichter, J.; Scheffler, K.; Stenzel, J.; Steffen, J.; Schumacher, T.; Brüning, T.; Plath, A.-S.; Alfen, F. Cerebral amyloid-β proteostasis is regulated by the membrane transport protein ABCC1 in mice. J. Clin. Investig. 2011, 121, 3924–3931. [Google Scholar] [CrossRef]
  33. Jepsen, W.M.; De Both, M.; Siniard, A.L.; Ramsey, K.; Piras, I.S.; Naymik, M.; Henderson, A.; Huentelman, M.J. Adenosine triphosphate binding cassette subfamily C member 1 (ABCC1) overexpression reduces APP processing and increases alpha-versus beta-secretase activity, in vitro. Biol. Open 2021, 10, bio054627. [Google Scholar] [CrossRef]
  34. Karthik, S.; Thirugnanasambandam, A.; Mandal, P.K.; Gautham, N. Crystal structure of d (CCGGGGTACCCCGG) 2 at 1.4 Å resolution. Acta Crystallogr. Sect. F Struct. Biol. Commun. 2017, 73, 259–265. [Google Scholar] [CrossRef] [PubMed]
  35. Kabsch, W. xds. Acta Crystallogr. Sect. D Biol. Crystallogr. 2010, 66, 125–132. [Google Scholar] [CrossRef] [PubMed] [Green Version]
  36. Kabsch, W. Automatic processing of rotation diffraction data from crystals of initially unknown symmetry and cell constants. J. Appl. Crystallogr. 1993, 26, 795–800. [Google Scholar] [CrossRef]
  37. McCoy, A.J. Solving structures of protein complexes by molecular replacement with Phaser. Acta Crystallogr. Sect. D Biol. Crystallogr. 2007, 63, 32–41. [Google Scholar] [CrossRef] [Green Version]
  38. McCoy, A.J.; Grosse-Kunstleve, R.W.; Adams, P.D.; Winn, M.D.; Storoni, L.C.; Read, R.J. Phaser crystallographic software. J. Appl. Crystallogr. 2007, 40, 658–674. [Google Scholar] [CrossRef] [Green Version]
  39. Murshudov, G.N.; Skubák, P.; Lebedev, A.A.; Pannu, N.S.; Steiner, R.A.; Nicholls, R.A.; Winn, M.D.; Long, F.; Vagin, A.A. REFMAC5 for the refinement of macromolecular crystal structures. Acta Crystallogr. Sect. D Biol. Crystallogr. 2011, 67, 355–367. [Google Scholar] [CrossRef] [Green Version]
  40. Emsley, P.; Lohkamp, B.; Scott, W.G.; Cowtan, K. Features and development of Coot. Acta Crystallogr. Sect. D Biol. Crystallogr. 2010, 66, 486–501. [Google Scholar] [CrossRef] [Green Version]
  41. Zheng, G.; Lu, X.-J.; Olson, W.K. Web 3DNA—A web server for the analysis, reconstruction, and visualization of three-dimensional nucleic-acid structures. Nucleic Acids Res. 2009, 37, W240–W246. [Google Scholar] [CrossRef] [Green Version]
  42. Pettersen, E.F.; Goddard, T.D.; Huang, C.C.; Couch, G.S.; Greenblatt, D.M.; Meng, E.C.; Ferrin, T.E. UCSF Chimera—A visualization system for exploratory research and analysis. J. Comput. Chem. 2004, 25, 1605–1612. [Google Scholar] [CrossRef] [Green Version]
  43. Wallace, A.C.; Laskowski, R.A.; Thornton, J.M. LIGPLOT: A program to generate schematic diagrams of protein-ligand interactions. Protein Eng. Des. Sel. 1995, 8, 127–134. [Google Scholar] [CrossRef]
  44. Lin, N.; Wu, X.; Cai, Z.; Shi, J.; Tong, B.; Dong, Y. The fluorescence properties of 4′-Methoxychalcone derivates modified by substituents and investigation of lysosomal imaging. Dye. Pigment. 2022, 199, 110091. [Google Scholar] [CrossRef]
  45. Azum, N.; Taib, L.A.; Al Angari, Y.M.; Asiri, A.M.; Denti, M.; Zhao, W.; Usta, H.; Facchetti, A. π-Conjugated donor-acceptor small molecule thin-films on gold electrodes for reducing the metal work-function. Thin Solid Films 2016, 616, 320–327. [Google Scholar] [CrossRef]
  46. Suyambulingam, J.K.; Karvembu, R.; Bhuvanesh, N.S.; Enoch, I.V.M.V.; Selvakumar, P.M.; Premnath, D.; Subramanian, C.; Mayakrishnan, P.; Kim, S.-H.; Chung, I.-M. Synthesis, structure, biological/chemosensor evaluation and molecular docking studies of aminobenzothiazole Schiff bases. J. Adhes. Sci. Technol. 2020, 34, 2590–2612. [Google Scholar] [CrossRef]
  47. Hazra, D.K.; Mukherjee, M.; Mukherjee, A.K. Ab initio powder structure analysis and theoretical study of two thiazole derivatives. J. Mol. Struct. 2013, 1039, 153–159. [Google Scholar] [CrossRef]
  48. Russell, W.; Newman, C.; Williamson, D. A simple cytochemical technique for demonstration of DNA in cells infected with mycoplasmas and viruses. Nature 1975, 253, 461–462. [Google Scholar] [CrossRef]
  49. Waring, M. Complex formation between ethidium bromide and nucleic acids. J. Mol. Biol. 1965, 13, 269–282. [Google Scholar] [CrossRef]
  50. Rahman, Y.; Afrin, S.; Husain, M.A.; Sarwar, T.; Ali, A.; Tabish, M. Unravelling the interaction of pirenzepine, a gastrointestinal disorder drug, with calf thymus DNA: An in vitro and molecular modelling study. Arch. Biochem. Biophys. 2017, 625, 1–12. [Google Scholar] [CrossRef] [PubMed]
  51. Rehman, S.U.; Sarwar, T.; Husain, M.A.; Ishqi, H.M.; Tabish, M. Studying non-covalent drug–DNA interactions. Arch. Biochem. Biophys. 2015, 576, 49–60. [Google Scholar] [CrossRef]
  52. Malicka, J.; Gryczynski, I.; Lakowicz, J.R. DNA hybridization assays using metal-enhanced fluorescence. Biochem. Biophys. Res. Commun. 2003, 306, 213–218. [Google Scholar] [CrossRef] [Green Version]
  53. Afrin, S.; Rahman, Y.; Sarwar, T.; Husain, M.A.; Ali, A.; Tabish, M. Molecular spectroscopic and thermodynamic studies on the interaction of anti-platelet drug ticlopidine with calf thymus DNA. Spectrochim. Acta Part A Mol. Biomol. Spectrosc. 2017, 186, 66–75. [Google Scholar] [CrossRef] [PubMed]
  54. González-Ruiz, V.; Olives, A.I.; Martín, M.A.; Ribelles, P.; Ramos, M.T.; Menéndez, J.C. An overview of analytical techniques employed to evidence drug-DNA interactions. Applications to the design of genosensors. Biomed. Eng. Trends Res. Technol. 2011, 32, 215–219. [Google Scholar]
  55. Cao, Y.; He, X.-w. Studies of interaction between safranine T and double helix DNA by spectral methods. Spectrochim. Acta Part A Mol. Biomol. Spectrosc. 1998, 54, 883–892. [Google Scholar] [CrossRef] [PubMed]
  56. Li, S.; Olson, W.K.; Lu, X.-J. Web 3DNA 2.0 for the analysis, visualization, and modeling of 3D nucleic acid structures. Nucleic Acids Res. 2019, 47, W26–W34. [Google Scholar] [CrossRef] [Green Version]
  57. Nomura, Y.; Tanaka, Y.; Fukunaga, J.-i.; Fujiwara, K.; Chiba, M.; Iibuchi, H.; Tanaka, T.; Nakamura, Y.; Kawai, G.; Kozu, T. Solution structure of a DNA mimicking motif of an RNA aptamer against transcription factor AML1 Runt domain. J. Biochem. 2013, 154, 513–519. [Google Scholar] [CrossRef] [PubMed]
Scheme 1. General scheme for the synthesis of ThT analogues: (a) 2-amino-6-methyl benzothiazole, 4-(dimethylamino)benzaldehyde (1.1 eq.:1 eq.), 15 mL dichloromethane, 10 mol % pyrrolidine, 4Å molecular sieve, 5–10 h, r.t, reflux; (b) acetonitrile, CH3I (6-fold excess), 12 h, 60 °C, reflux; the numbering used corresponds to NMR assignment.
Crystals 12 01717 sch001
Figure 1. ORTEP view of the molecules in the asymmetric unit (ASU) in the crystal structures of 2 (a) and 3 (b) with the appropriate labeling scheme. The ASU reveals the presence of one molecule of acetonitrile and the iodine (I1) as an anion part of the quaternary ammonium compound 3. The thermal ellipsoids are given with 50% probability level.
Crystals 12 01717 g001
Figure 2. Overlay of the molecules in the crystal structure of 2 (red) and 3 (green) by the common benzothiazole fragment. One can notice the different orientations of the N,N-dimethyl aniline fragment in respect to the N=CH double bond.
Crystals 12 01717 g002
Figure 3. Representation of (a) detected close contacts with values given in Å and shorter than the sum of vdW radii between the moieties (XRB, acetonitrile and I) included in the crystal structure of 3, (b) view of the molecular packing along a axis (c) view of the molecular packing along c axis and (d) view of the molecular packing along b axis depicting the pseudo-layered structure.
Crystals 12 01717 g003
Figure 4. DSC thermograms of compound 2 (a) and 3 (b) showing the endo effects of melting and solvent evaporation or the exo effect of decomposition.
Crystals 12 01717 g004
Figure 5. Fluorescent intercalator displacement data relevant for (a) ThT (green), XRB (purple/violet), DAPI (light blue), Berenil (orange), added to mixtures containing EtBr pre-complexed with different DNA sequences (dark red-brown), in the dark blue color are the intensity values of water-diluted DNA sequences tested alone, before the addition of EtBr and (b) FID data emphasizing on the intensity variances produced by XRB (purple/violet) and ThT (green) added to EtBr-DNA mixtures (dark red-brown); the DNA-water signal is shown in dark blue color.
Crystals 12 01717 g005
Figure 6. View of the asymmetric unit generated with UCSF Chimera [42], of (a) 8ASH including XRB molecule and (b) view of the asymmetric unit of 8ASK.
Crystals 12 01717 g006
Figure 7. Observed interactions generated with Ligplot+ [43] of (a) XRB with the deoxyguanosine part (Dg) of the DNA, compensating for the negative charge, the hydrophobic contacts are shown as Crystals 12 01717 i001 for DNA nucleosides and with Crystals 12 01717 i002 for ligand XRB, (b) detailed visualization of XRB density generated with UCSF Chimera [42] and (c) positive omit electron density (green) of the XRB using Coot [40] and Refmac [39].
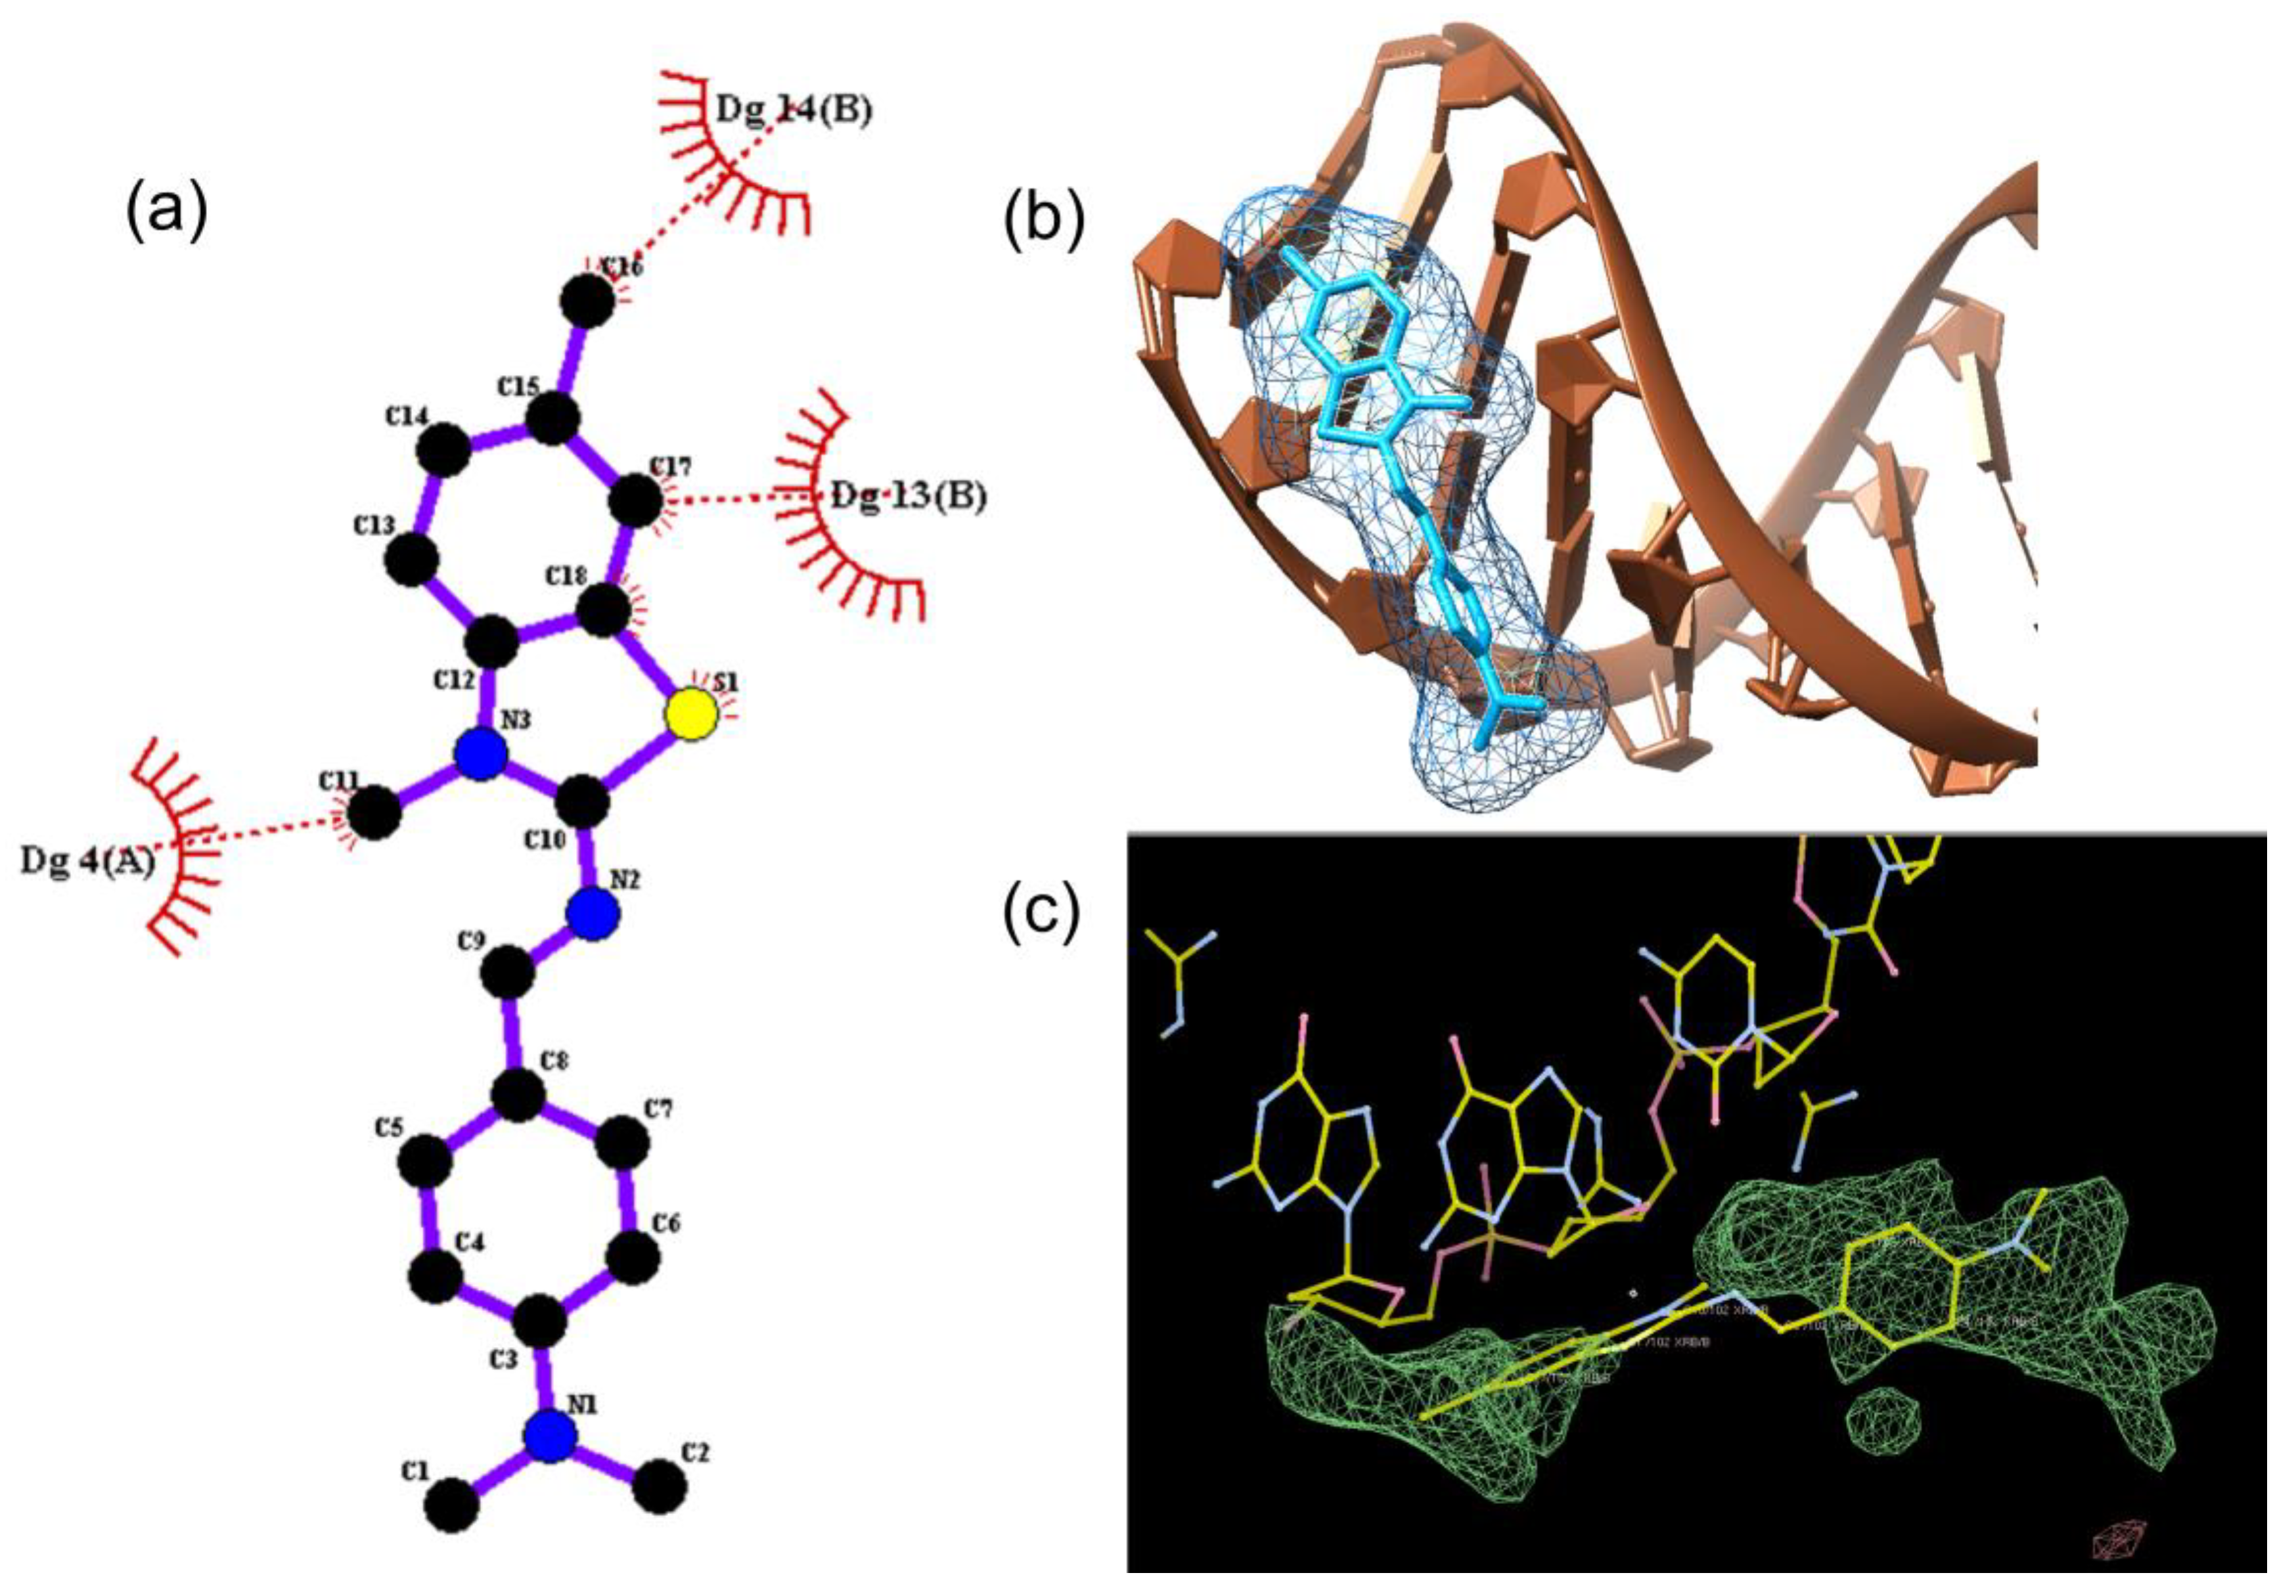
Crystals 12 01717 g007
Table 1. Most important crystallographic parameters for the crystal structures of compounds 2 and 3; estimated standard deviations are provided in round ordinary brackets.
Compound23
Empirical formulaC17H17N3SC20H23IN4S
Formula weight295.39478.38
Temperature290 K290 K
Crystal systemMonoclinicOrthorhombic
Space groupP21/cP212121
a/Å16.1220 (7)7.0148 (9)
b/Å6.1860 (3)16.778 (2)
c/Å16.5215 (7)18.144 (2)
α/°9090
β/°114.5490 (10)90
γ/°9090
Volume/Å31498.76 (12)2135.5 (5)
Z44
ρcalcg/cm31.3091.488
μ/mm−10.2131.608
F(000)624.0960.0
Crystal size/mm30.25 × 0.25 × 0.20.3 × 0.05 × 0.05
RadiationMoKα
λ = 0.71073
MoKα
λ = 0.71073
2Θ range for data collection/°5.556 to 52.7424.49 to 52.736
Reflections collected/independent40281/302876891/4377
Rint/Rsigma0.0372/0.01600.1356/0.0459
Data/restraints/parameters3028/0/2254377/0/240
Goodness-of-fit on F21.1041.071
Final R indexes [I ≥ 2σ (I)]R1 = 0.0490
wR2 = 0.1375
R1 = 0.0391
wR2 = 0.0748
Final R indexes [all data]R1 = 0.0529
wR2 = 0.1401
R1 = 0.0753
wR2 = 0.0885
Largest diff. peak/hole/e Å−30.30/−0.210.28/−0.59
CCDC number22113882198995
Table 2. Data collection and refinement statistics for 8ASK and 8ASH structures. Values in brackets are for the highest-resolution shell.
PDB Code8ASK8ASH
space groupH3P41212
cell dimensions
a, b, c, Å64.49, 64.49, 46.1941.76, 41.76, 88.96
α, β, γ, º90, 90, 12090, 90, 90
independent molecules22
diffraction data
wavelength, Å0.990.99
resolution, Å2.961.84
reflections20577383
completeness, %96.9598.8
I/σ(I)50.4350.8
redundancy10.4 (8.5)9.2 (8.9)
Rmerge %4.24 (23)4.9 (29)
Refinement
reflections used13996934
resolution, Å2.9551.84
R (Rfree) %12.5 (23.0)14.1 (19.3)
no. of atoms492590
DNA492568
XRBn/a22
average B fatcor, Å29143
r.m.s.d.
bond lengths, Å0.0060.014
bond angles, ∘ 1.1961.730
Table 3. X3DNA results for Base-Pair morphology: shear, stretch, stagger, buckle, opening and propeller twist values in 8ASH and 5WV7 DNA crystal structures.
PairShearStretchStaggerBucklePropellerOpening
8ASH5WV78ASH5WV78ASH5WV78ASH5WV78ASH5WV78ASH5WV7
1C-G0.210.24−0.03−0.07−0.22−0.13−8.32−8.496.575.971.091.72
2C-G0.110.12−0.13−0.140.040.071.41.251.381.01−1.18−0.87
3G_C−0.24−0.25−0.14−0.12−0.16−0.171.781.60.411.01−2.18−1.65
4G_C−0.25−0.24−0.13−0.14−0.18−0.15−4.85−4.95−2.39−2.63−0.8−1.46
5G_C−0.17−0.17−0.17−0.17−0.23−0.25−6.03−6.5−11.59−11.09−1.8−1.73
6G_C−0.14−0.19−0.07−0.07−0.2−0.18−11.16−11.92−14.34−13.993.32.95
7T-A0.050−0.07−0.090.130.151.440.880.21.034.154.47
8A-T0.10.16−0.1−0.110.040.0310.3711.26−6.34−5.410.161
9C-G0.270.3−0.12−0.08−0.37−0.3914.3514.94−11.38−11.712.272.33
10C-G0.220.21−0.19−0.190.110.1−5.08−4.85−8.15−7.95−3.12−3.46
11C-G0.140.17−0.26−0.25−0.08−0.082.753.25−2.54−2.38−2−2.14
12C-G0.110.09−0.08−0.09−0.11−0.144.134.63−1.66−1.23−0.34−0.18
13G-C−0.15−0.15−0.17−0.150−0.01−0.7−1.13−1.32−1.58−0.86−0.57
14G-C−0.24−0.24−0.12−0.13−0.2−0.15−3.55−2.36−0.94−0.590.33−0.03
Table 4. X3DNA results for base pair morphology: shear, stretch, stagger, buckle, opening and propeller twist values in 8ASK DNA crystal structure.
PairShearStretchStaggerBucklePropellerOpening
1G-C0.22−0.110.060.29−18.04−3.79
2C-G0.070.050.131.64−6.193.2
3C-G0.140.130.32−9.14−15.534.9
4C-G−0.33−0.20.52−7.57−12.390.76
5A-T0.01−0.380.175.51−13.33−3.51
6C-G0.25−0.120.05−0.79−15.92−2.19
7C-G0.32−0.04−0.152.16−10.891.66
8A-T−0.15−0.12−0.080.21−11.770.75
9C-G0.11−0.1306.54−14.521.39
10G-C−0.02−0.050.318.07−8.331.25
11G-C0.01−0.280.433.41−7.86−3.06
12C-G−0.040.040.7−9.52−12.050.2
Publisher’s Note: MDPI stays neutral with regard to jurisdictional claims in published maps and institutional affiliations.

