1. Introduction
The incorporation of hydrogen is a well-known tool for influencing the structural, electric, magnetic and optic properties of intermetallic compounds [
1,
2]. The interplay between hydrogen uptake and magnetism is often quite complex. Upon hydrogen uptake, intermetallic compounds may lose ferro-(LaCo
5) or ferrimagnetism (Y
6Mn
23) or become ferromagnets (CeNi
3, Hf
2Fe and Th
7Fe
3) [
1]. The influence of hydrogen incorporation on the atomic order in crystal structures of intermetallics is also widely studied. In an extreme case, it may lead to amorphous hydrides in a process known as hydrogen-induced amorphization (HIA) [
2]. The process involves short-range diffusion of metallic atoms, and the driving force seems to be the different hydrogen occupation sites in crystalline and amorphous states of the alloy. In some cases, such as Laves phases, the latter can be predicted by geometric factors, such as the atomic size ratio of constituting atoms [
2]. Obviously, hydrogen uptake, atomic order (crystal structure) and magnetic order (cooperative phenomena) influence each other. In most studies, however, only the interaction between two of these factors is investigated and the third neglected or assumed not to play a role, which might be an oversimplification in some cases. Clearly, more in-depth investigations are needed to reveal the complex interplay between hydrogen uptake, atomic order and magnetic order in intermetallics. In this respect, we studied the crystal and magnetic structure of FePd
3 and its solid solution with hydrogen (also called hydride throughout this text) in detail in order to thoroughly characterize the interesting system FePd
3-H
2 and to reveal the potential cross-links between these factors. In order to obtain a high depth of knowledge, the hydrogenation of FePd
3 was analyzed by time-resolved
in situ neutron diffraction, mapping the crystal structure, including hydrogen atom positions and magnetic moments.
FePd
3 has attracted interest as a functional material due to its diverse physical properties. It has a characteristic pressure-induced invar behavior by means of an anomalously low thermal expansion at high applied pressures [
3,
4,
5], and it is ferromagnetic with a Curie temperature of 499 K [
6]. A soft ferromagnetic behavior was found in carbon-based materials by encapsulation of FePd
3 [
7,
8,
9]. FePd
3 can be used in electrocatalysis to enhance the cycle stability of hybrid Li–air batteries [
10] or as an electrocatalyst to oxidize formic acid [
11]. In addition, a higher attraction between 2-methylfuran and hydrogen compared to palladium was found in hydrogenation catalysis [
12]. The use of bimetallic catalysts changes the electronic structure at the surface [
13] and decreases the Pd-Pd coordination number; this can hinder the formation of unfavorable surface species, thus avoiding unwanted side reactions, e.g., decarbonylation, in the solvent-free hydrodeoxygenation of furan compounds for a Pd-FeO
x/SiO
2 catalyst [
14]. Knowledge of the crystal structure is of great importance for catalytic applications, since it has a distinct influence on catalytic properties. The phase diagram of the Fe-Pd system shows a solid solution with a large phase width of about ±10% around an Fe:Pd atomic ratio of 1:3 [
15]. In addition to the disordered phase Fe
0.25Pd
0.75 (Cu type,
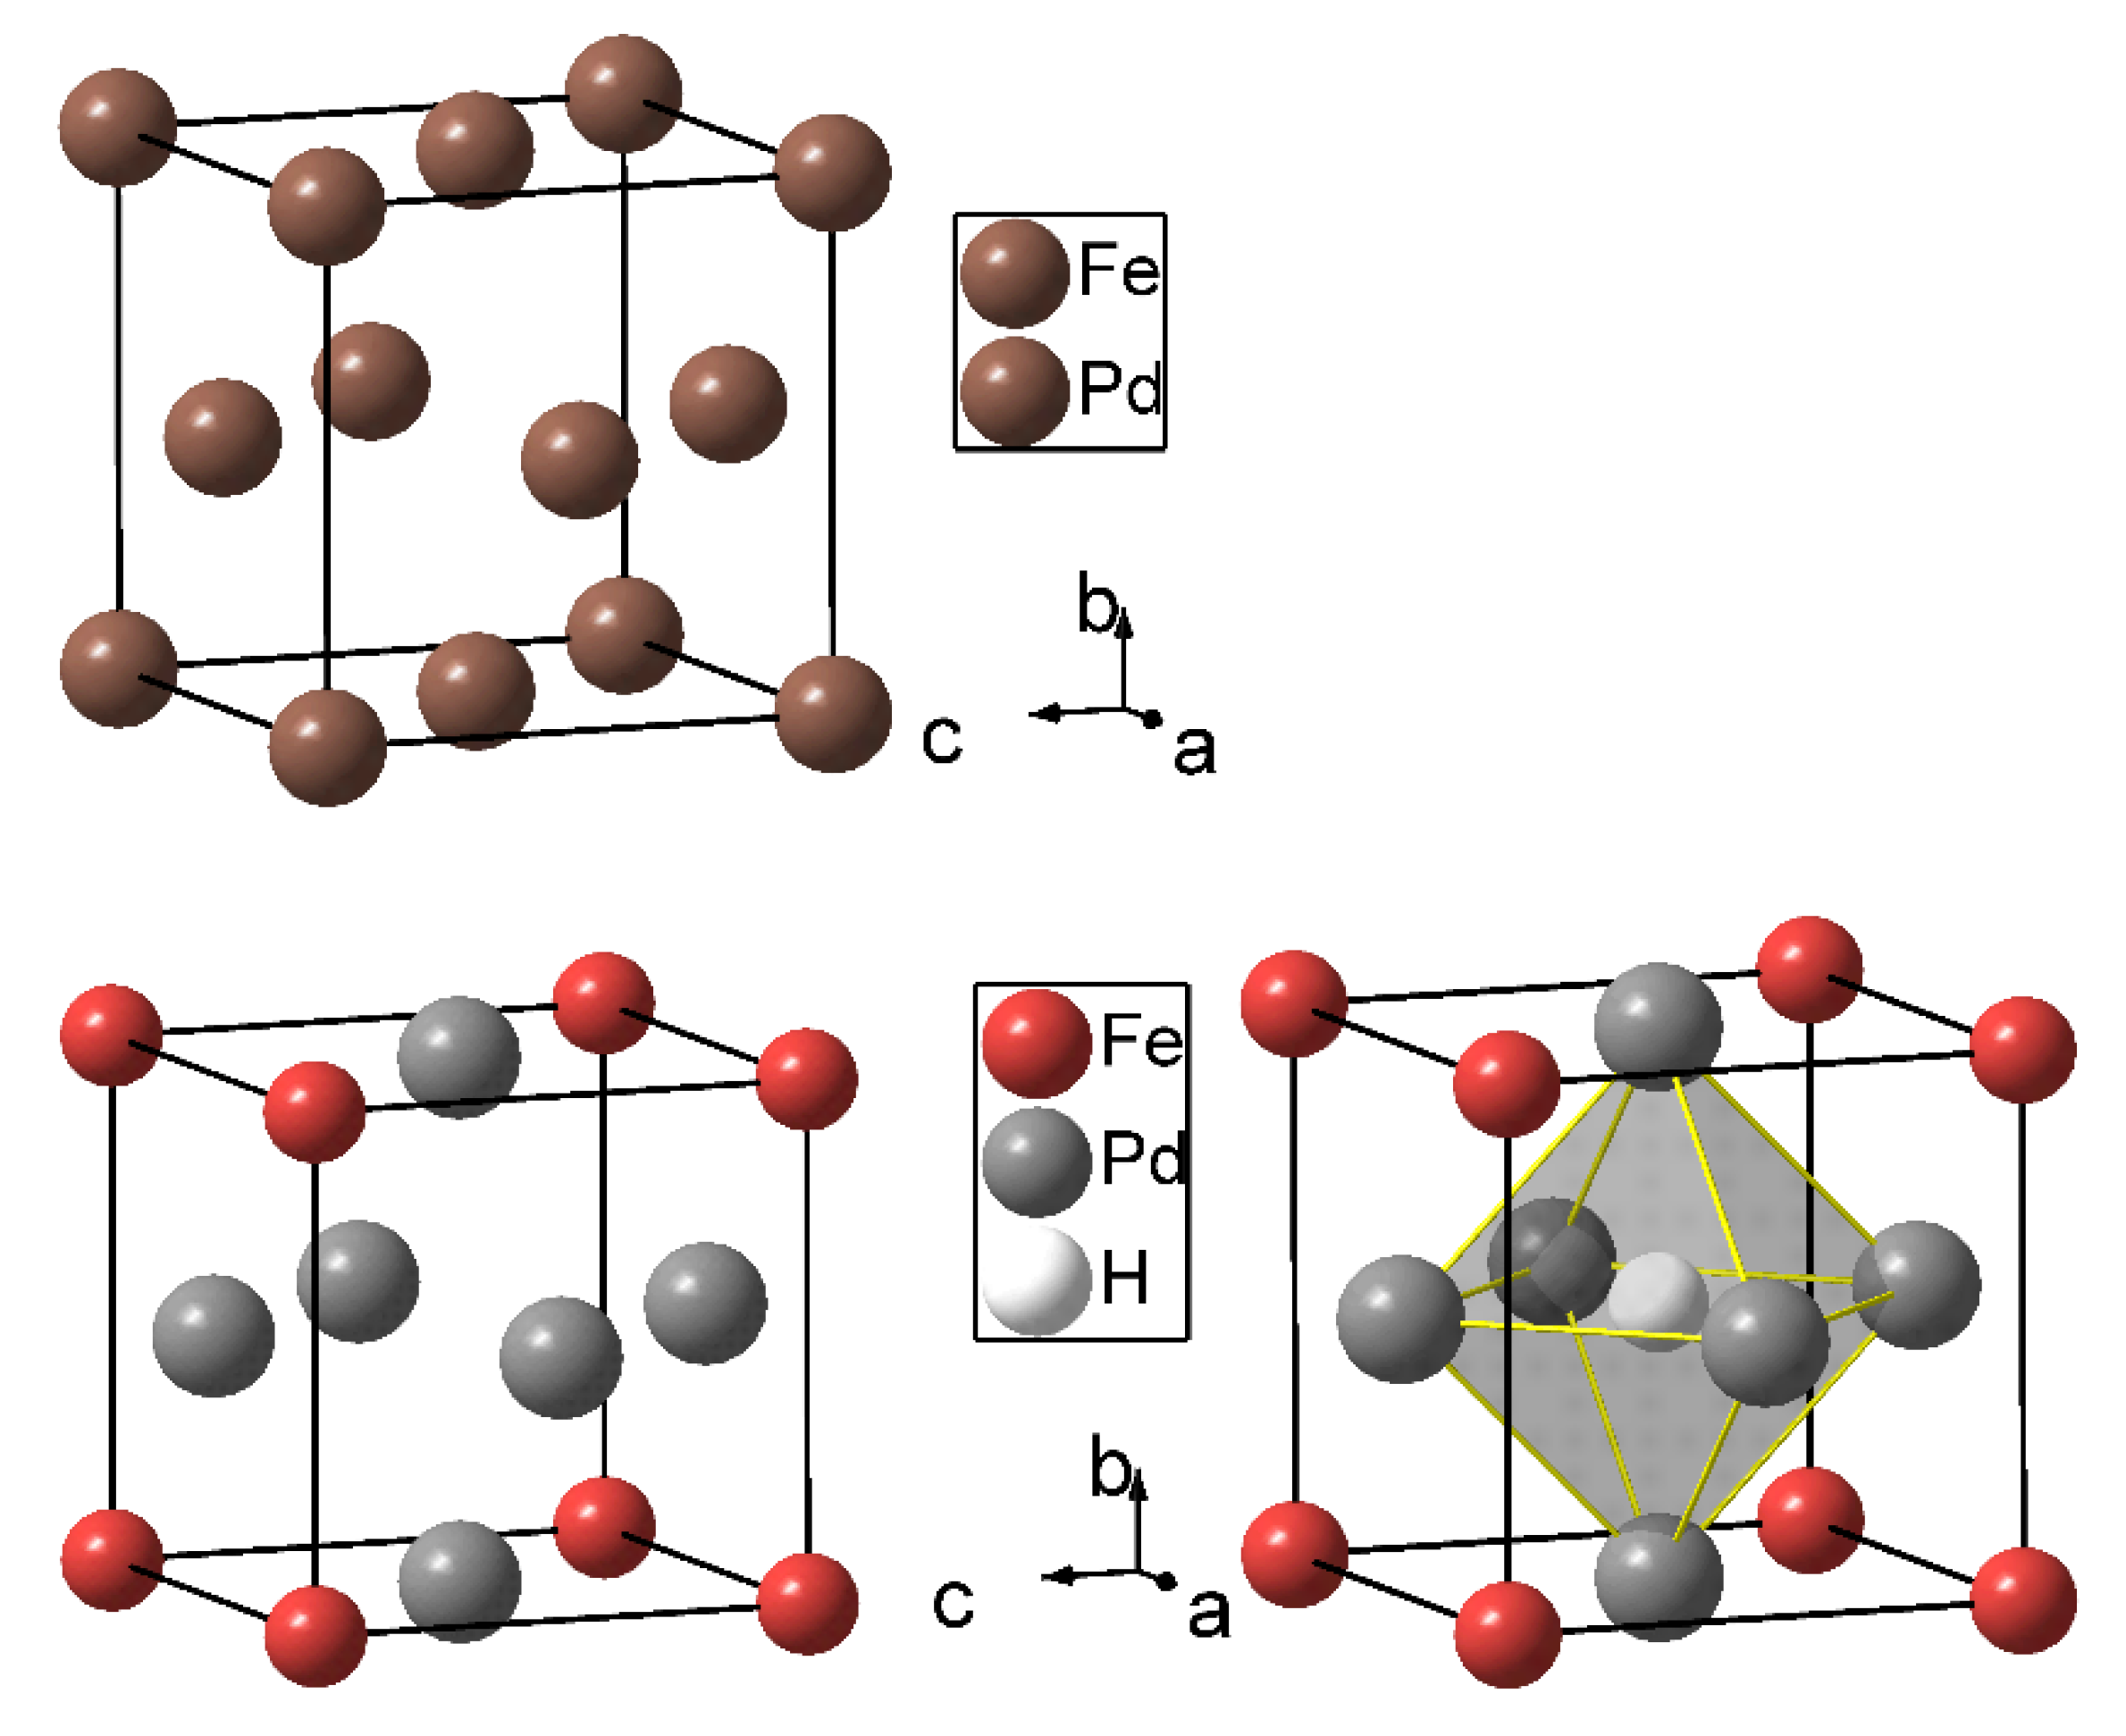
Fmm), an ordered phase is known. FePd
3 crystallizes in an ordered variant of a cubic close packing (AuCu
3 type,
Pmm,
Figure 1). The annealing times for the ordering process are long due to similar electronic and geometric properties of the constituting atoms [
16]. FePd
3, with a high degree of crystallographic order, shows a higher hydrogen incorporation at high hydrogen pressures compared to (partially) disordered samples [
17]. Disordered Fe
0.25Pd
0.75 needs more than two orders of magnitude higher hydrogen pressure to obtain the same electrical resistivity as found in ordered FePd
3 [
18]. The position of hydrogen atoms in FePd
3H
x is not known yet.
In this work, we employ
in situ studies to show the influence of moderate hydrogen pressures on the order–disorder transition in FePd
3, thus complementing studies of hydrogen absorption of FePd
3 at high hydrogen pressures [
17].
In situ neutron powder diffraction, as an established method [
19,
20], was used to determine the level of atomic disorder, the magnetic moment and the amount of incorporated hydrogen.
2. Materials and Methods
Synthesis and Chemical Analysis: Due to air sensitivity, iron was handled in an argon-filled glove box. Disordered Fe0.25Pd0.75 was synthesized from stoichiometric amounts of palladium powder (99.95%, ≤150 μm, Goodfellow) and iron granules (99.98%, 1–2 mm, abcr) in sealed silica glass ampoules under argon atmosphere. The mixture was heated to 1423 K (100 K h−1 heating rate) for 48 h and afterward quenched in air. The ordered compound was synthesized analogously; however, one small crystal of iodine (resublimed, Merck) was added as a mineralizing agent. This mixture was heated to 923 K (100 K h−1 heating rate) for 7 d in a sealed silica ampoule. A further sample was afterward annealed for one month at 773 K. The products were ground in a mortar after cooling.
Iodine was removed by sublimation to the opposite side of the ampoule. Chemical analyses were performed by an EDX INCA SYSTEM from Oxford Instruments, mounted on a Zeiss LEO 1530 scanning electron microscope, with an acceleration voltage of 20 kV and a working distance of 15 mm.
Thermal Analysis: Differential scanning calorimetry (DSC) was performed under hydrogen pressure on a DSC HP 2+ (Mettler Toledo) equipped with a gas pressure chamber. An amount of 20 mg of the powdered sample was put in an aluminum crucible, which was closed with an aluminum lid. This was placed inside the pressure chamber, which was then purged several times with hydrogen gas, before filling to the final hydrogen gas pressure of 5.0 MPa. The sample was heated to 723 K with 10 K min−1, held at this temperature for a minimum of 1 h and cooled to 300 K. Two runs were performed; afterward, the hydrogen pressure was released, the sample removed and structural characterization undertaken by XRPD.
Ex situ X-ray Powder Diffraction (XRPD): X-ray powder diffraction data from flat transmission samples were collected on a G670 diffractometer (Huber, Rimsting, Germany) with Mo-Kα1 radiation (70.926 pm) and from flat reflection samples on a SmartLab powder high-resolution X-ray powder diffractometer (Rigaku, Tokyo, Japan) with a HyPix-3000 two-dimensional semiconductor detector using Co-Kα radiation with parallel beam. The instrumental resolution function and the wavelength distribution were determined using a measurement on an external silicon NIST640d standard sample. The wavelengths were found to be 178.9789(4) pm and 179.3625(4) pm, close to the usual values for Co-Kα1 and Co-Kα2; the difference was caused by optical components of the diffractometer affecting the wavelength distribution.
In situ X-ray Powder Diffraction: In situ X-ray powder diffraction was performed on a SmartLab powder high-resolution X-ray powder diffractometer (Rigaku, Tokyo, Japan) in an Anton Paar XRK 900 reaction chamber (Graz, Austria) with 0.5 MPa hydrogen pressure (H2, Air Liquide, 99.9%) and Co-Kα radiation with parallel beam on a flat FePd3 specimen on top of an Al2O3 layer.
Ex situ Neutron Powder Diffraction (NPD): Neutron powder diffraction was carried out at the Institute Laue-Langevin in Grenoble, France, with a high-flux diffractometer D20 in high-resolution mode. Powdered samples (≈1 cm−3) were held in air-tight vanadium containers with 6 mm inner diameter and were each measured for 15 min. The wavelength λ = 186.80(2) pm was calibrated using an external silicon NIST640b standard sample in a 5 mm vanadium container. Deuterides rather than hydrides were used to avoid the high incoherent scattering of 1H.
In situ Neutron Powder Diffraction:In situ neutron powder diffraction (NPD) was performed on a high-intensity two-axis diffractometer D20 at the Institute Laue-Langevin (ILL), Grenoble, France. Time-resolved neutron diffraction data were collected under deuterium pressure and heating by two lasers. These
in situ experiments were carried out in (leuco-)sapphire single-crystal cells with 6 mm inner diameter connected to a gas supply system. The details are given elsewhere [
19,
20]. The sample cell was filled with FePd
3 and attached to the gas supply system, which was subsequently evacuated. The reactions were performed under various deuterium pressures (D
2, Air Liquide, 99.8% isotope purity). Data sets were obtained with 2 min time resolution. They are presented with an additional internal raw label (NUMOR), referring to proposal 5-24-613 [
21]. For the
in situ studies, NUMORs 131613–131859 were used.
Rietveld Refinement: Rietveld refinements [
22,
23] were performed using FullProf [
24] and Topas [
25]. Deuterium atoms were located by difference Fourier analysis. Simultaneous refinements of FePd
3 based on XRPD data and neutron powder diffraction data were performed with constrained mixed occupation parameters to reduce correlation with the ordered magnetic moment of the iron atoms. Further details of the crystal structure investigations may be obtained from FIZ Karlsruhe, 76344 Eggenstein-Leopoldshafen, Germany (fax: (+49)7247-808-666; e-mail:
crysdata@fiz-karlsruhe.de), on quoting the deposition number CSD-2163436.
4. Discussion
The atomic order in FePd
3 can be controlled via the synthesis protocol, most easily by using iodine as a mineralizing agent. Its use allows full atomic order in one month as compared to 91% order in two months [
16]. This method is well known for its potential to promote single-crystal growth [
31,
32], the synthesis of metastable compounds [
32] or single-phase ordered compounds with shorter annealing times [
31].
The magnetic moment of 2.3(2)
μB of FePd
3 determined by refinement of neutron diffraction data differs somewhat from the literature values (
μFe = 2.73(13)
μB [
28]); however, the difference is less than two combined standard uncertainties. The difference may also be caused by varying disorder in FePd
3, which was not taken into account in early studies [
28,
33]. The Curie temperature of 495(8) K, determined by a second-order transition fit (
Figure 5), is in accordance with the literature (
Tc = 499 K [
6]). The determined critical exponent of this fit (
β = 0.28(5)) is close (less than two standard uncertainties apart) to the expected values of a 3D Ising model (
β = 0.325) and a 3D Heisenberg model (
β = 0.365) but far from the mean-field model (
β = 0.5) [
34]. This is in perfect agreement with a short-range interaction as typical for a magnetic exchange. The disparity between this and previous investigations reporting on a Heisenberg magnet with a critical exponent of 0.371 [
6] may be explained by the method of determination. The ordered magnetic moment in this study is only refined in the 001 direction, resulting in a bias toward the 3D Ising model. Furthermore, the uncertainties are relatively high due to the correlation of the hydrogen occupation, the mixed occupation and the ordered magnetic moment.
Deuterium occupies exclusively [Pd
6] octahedral voids in a statistical manner with small occupation parameters. The small deuterium contents are in accordance with studies at high gas pressures [
17] (
Figure 6, left). The Pd-D distances are between 192.644(2) pm and 192.686(2) pm for FePd
3D
0.013(8) and FePd
3D
0.047(9), respectively, and comparable to known hydrides of
MPd
3 compounds, such as MnPd
3H
0.61 (190.0 pm ≤
d(Pd-H) ≤ 197.6 pm) [
35].
FePd
3 takes up much less hydrogen than, i.e., MgPd
3 [
20], MnPd
3 [
35,
37] or InPd
3 [
38]. This is in accordance with a proposed structure map correlating electronegativity and atomic radius of the metal
M with the hydrogen content of
MPd
3H
x [
39]. Iron, with quite a small atomic radius and an electronegativity of 1.6, is predicted to take up small amounts of hydrogen, which is confirmed in this study. Furthermore, the density of states at the Fermi level of FePd
3 (6.2 [
40] or 11.1 states eV
−1 atom
−1 [
41]) is remarkably high compared to other
MPd
3 compounds crystallizing in the AuCu
3 type, such as MgPd
3 (1.13 states eV
−1 atom
−1 [
42]), MnPd
3 (2.18 [
43] or 2.84 states eV
−1 atom
−1 [
44]) and InPd
3 (3.3 states eV
−1 atom
−1 [
45]), which might also have an impact on the hydrogen uptake capacity. At room temperature, the hydrogenation follows Sieverts’ law [
36] (
Figure 6, right), with low pressure (this work) and high pressure data [
17] differing somewhat (
Figure 6). The moderate fit and higher error in fit parameters for the high pressure data may be caused by increasing hydrogen–hydrogen interaction in the solid solution and larger differences between fugacity and pressure, the latter of which was used here as an approximation.
To compare the possible hydrogenation of ordered and disordered FePd
3, it is useful to look at the maximum hydrogen content of both structure types. The unit cell of
MPd
3 compounds in the AuCu
3 type contains one [Pd
6] and three [
M2Pd
4] octahedral voids. Therefore, the probability of a [Pd
6] octahedral void is 0.25, yielding the formula
MPd
3H for a maximum occupation of hydrogen in [Pd
6] sites. For disordered
MPd
3 compounds crystallizing in the Cu type, the probability of a [Pd
6] octahedral void is 0.178 (=0.75
6), assuming a 75% probability of finding a palladium atom at any position in the crystal structure. A maximum hydrogen occupation using only [Pd
6] sites yields the formula
MPd
3H
0.712. According to this consideration, the ordered compound may absorb more hydrogen if only [Pd
6] sites are involved. It is well known that hydrogen uptake in disordered FePd
3 is indeed less than that for ordered FePd
3 [
17]. In this regard, it is remarkable that the disorder in FePd
3H
x increases with hydrogen uptake despite the statistical decrease in [Pd
6] octahedral sites. Furthermore, the disorder reversibly increases with temperature, with near constant hydrogen content. The preference of [Pd
6] sites for hydrogen atoms can be inferred from many examples of hydrogenation reactions of
MPd
3 compounds structurally related to cubic close packing. The thermodynamic driving force for hydrogen-induced rearrangements (from TiAl
3 type or ZrAl
3 type to AuCu
3 type) arises from the preference for Pd-H bonding and, consequently, an increase in the number of [Pd
6] octahedral voids [
46]. Furthermore, other interstitial FePd
3 compounds, such as FePd
3B
x, also prefer [Pd
6] octahedral sites for the interstitial atoms [
30]. The immediate environment of absorbed hydrogen is responsible for the hydrogen solubility in metals and intermetallic compounds [
47]. Under the assumption of a preference of hydrogen atoms for [Pd
6] octahedra, the unexpected increasing disorder upon hydrogenation may be understood in terms of local short-range order of formed HPd
6 octahedra and a lack of long-range crystallographic order.
The findings on the magnetic and structural details of FePd3 and its hydrides show the complex interplay between hydrogen uptake, atomic and magnetic order in intermetallics. This raises questions on the validity of the assumption of constant atomic order, which is often made for investigations on the effects of hydrogen incorporation on magnetic properties, and calls for further investigations on this fascinating subject.


