1. Introduction
Dental caries is currently considered one of the most common oral diseases affecting humankind. The evolution of a dynamic carious lesion comprises successive episodes of demineralization and remineralization of the hard tissues of the tooth [
1]. According to Marsh and Martin, dental caries is an endogenous biofilm-mediated disease, which, due to the ecological niche advantage of aciduric cariogenic microflora over other microflora, results in a homeostatic imbalance of plaque biofilm, and this is the initiation of dental caries [
2].
Various modalities have been explored, and each has varying results. New insights into the disease process and various modes of modifying the biofilm have been under investigation [
3,
4]. Fluoride, as an anti-cariogenic, has been the most popular inclusion in caries prevention protocols for over a century [
5]. However, despite its overzealous use, recent epidemiological studies of developed countries have shown an increase in caries incidence after an initial decline. Recent studies have shown that, irrespective of the concentration or mode of fluoride application, there is an increase in the acidogenicity of biofilms [
6]. Further, it has been reviewed that there is a development of fluoride-resistant strains of streptococci mutans [
7]. Thus, new strategies that increase tooth resistance have been at the center of the research on the ionic aspects of the caries process [
8].
Lasers have been used for caries inhibition since 1960, when the first laser was developed by Maiman. The lasers that have been investigated in the past for caries inhibition are CO
2, Nd: YAG, Er: YAG and Er Cr: YSGG. Lasers, such as CO
2, Nd: YAG and Erbium: YAG have all been said to play a role in caries inhibition [
9,
10,
11,
12,
13,
14,
15,
16]. These lasers have the disadvantages of having high costs and being bulky, and the results obtained using them are debatable. Further, most of the studies evaluating high-power lasers are in vitro studies.
Challenges arise in evaluating the effectiveness of caries preventive strategies. Fourier transform infrared spectroscopy is a reliable technique that can be used to analyze the demineralization and remineralization of samples. In contrast to the transmission technique, where light must transverse the sample, in Fourier transform infrared spectrometry coupled with attenuated total reflectance (FTIR-ATR), the sample thickness is not relevant [
17,
18,
19,
20].
FTIR spectroscopy is widely used to analyze the compositional changes in a sample. Infrared radiation irradiates the sample surface, and some of the radiation is absorbed or transmitted through it. The resultant spectrum arising from the interaction between the sample and the infrared radiation serves as a molecular fingerprint of the studied sample. As all fingerprints are unique to each individual, similarly, an irradiated sample also has a unique molecular orientation, which provides a characteristic, unique, well-defined, infrared spectrum [
17,
18].
The armamentarium consists of the following:
- (a)
The source of infrared energy: a beam is passed through an aperture that controls the amount of beam that will eventually be incident on the selected sample.
- (b)
The interferometer: the beam is spectrally encoded in the interferometer and then exits.
- (c)
Sample: the beam is then incident on the selected sample, where its spectral interaction with the sample takes place.
- (d)
Detector: the beam then passes to the detector, where the spectral interaction is measured. The measurements are typified, digitalized and coded to a computer, where the Fourier transform is analyzed, manipulated, or interpreted by the user.
In this study, FTIR spectroscopy was used to analyze the compositional changes in enamel after surface treatments with an aluminum–gallium–arsenide laser and remineralizing paste used alone or in combination.
2. Materials and Methods
IRPrestige-21 FTIR spectrometer (Shimadzu, Kyoto, Japan); aluminum–gallium–arsenide laser (WhitestarTM, Creation, Verona, Italy); casein phosphopeptide–amorphous calcium phosphate fluoride (CPP-ACPF) paste; calcium sucrose phosphate (Enafix) paste; MI paste; demineralizing solution (acetate 0.1 Mol/L, calcium 0.1 Mol/L, phosphate 0.1 Mol/L, fluoride 0.1 mg/L pH 5.0).
Procedure:
Waiver informed consent was taken. Six extracted intact posterior teeth were selected, with no signs of caries, infraction or fracture. They were sectioned mesiodistally to achieve 2 halves. Each half was further divided into six equal sizes to achieve 12 samples per tooth. Except for one sample, which served as the control for that particular tooth, the remaining samples were placed in a demineralizing solution (acetate 0.1 Mol/L, calcium 0.1 Mol/L, phosphate 0.1 Mol/L, fluoride 0.1 mg/L pH 5.0) for 24 h. The samples are grouped as follows so as to subject each sample to the following different surface treatments:
Group 1: Control,
Group 2: Demineralized,
Group 3: Laser 1 Watt,
Group 4: Laser 2 Watts,
Group 5: Laser 3. Watts,
Group 6: Laser 3.5 Watts,
Group 7: CPP-ACPF,
Group 8: CPP-ACPF & Laser 3.5 Watts,
Group 9: Enafix,
Group 10: Enafix & Laser 3.5 Watts,
Group 11: MI Paste,
Group 12: MI Paste & Laser 3.5 Watts.
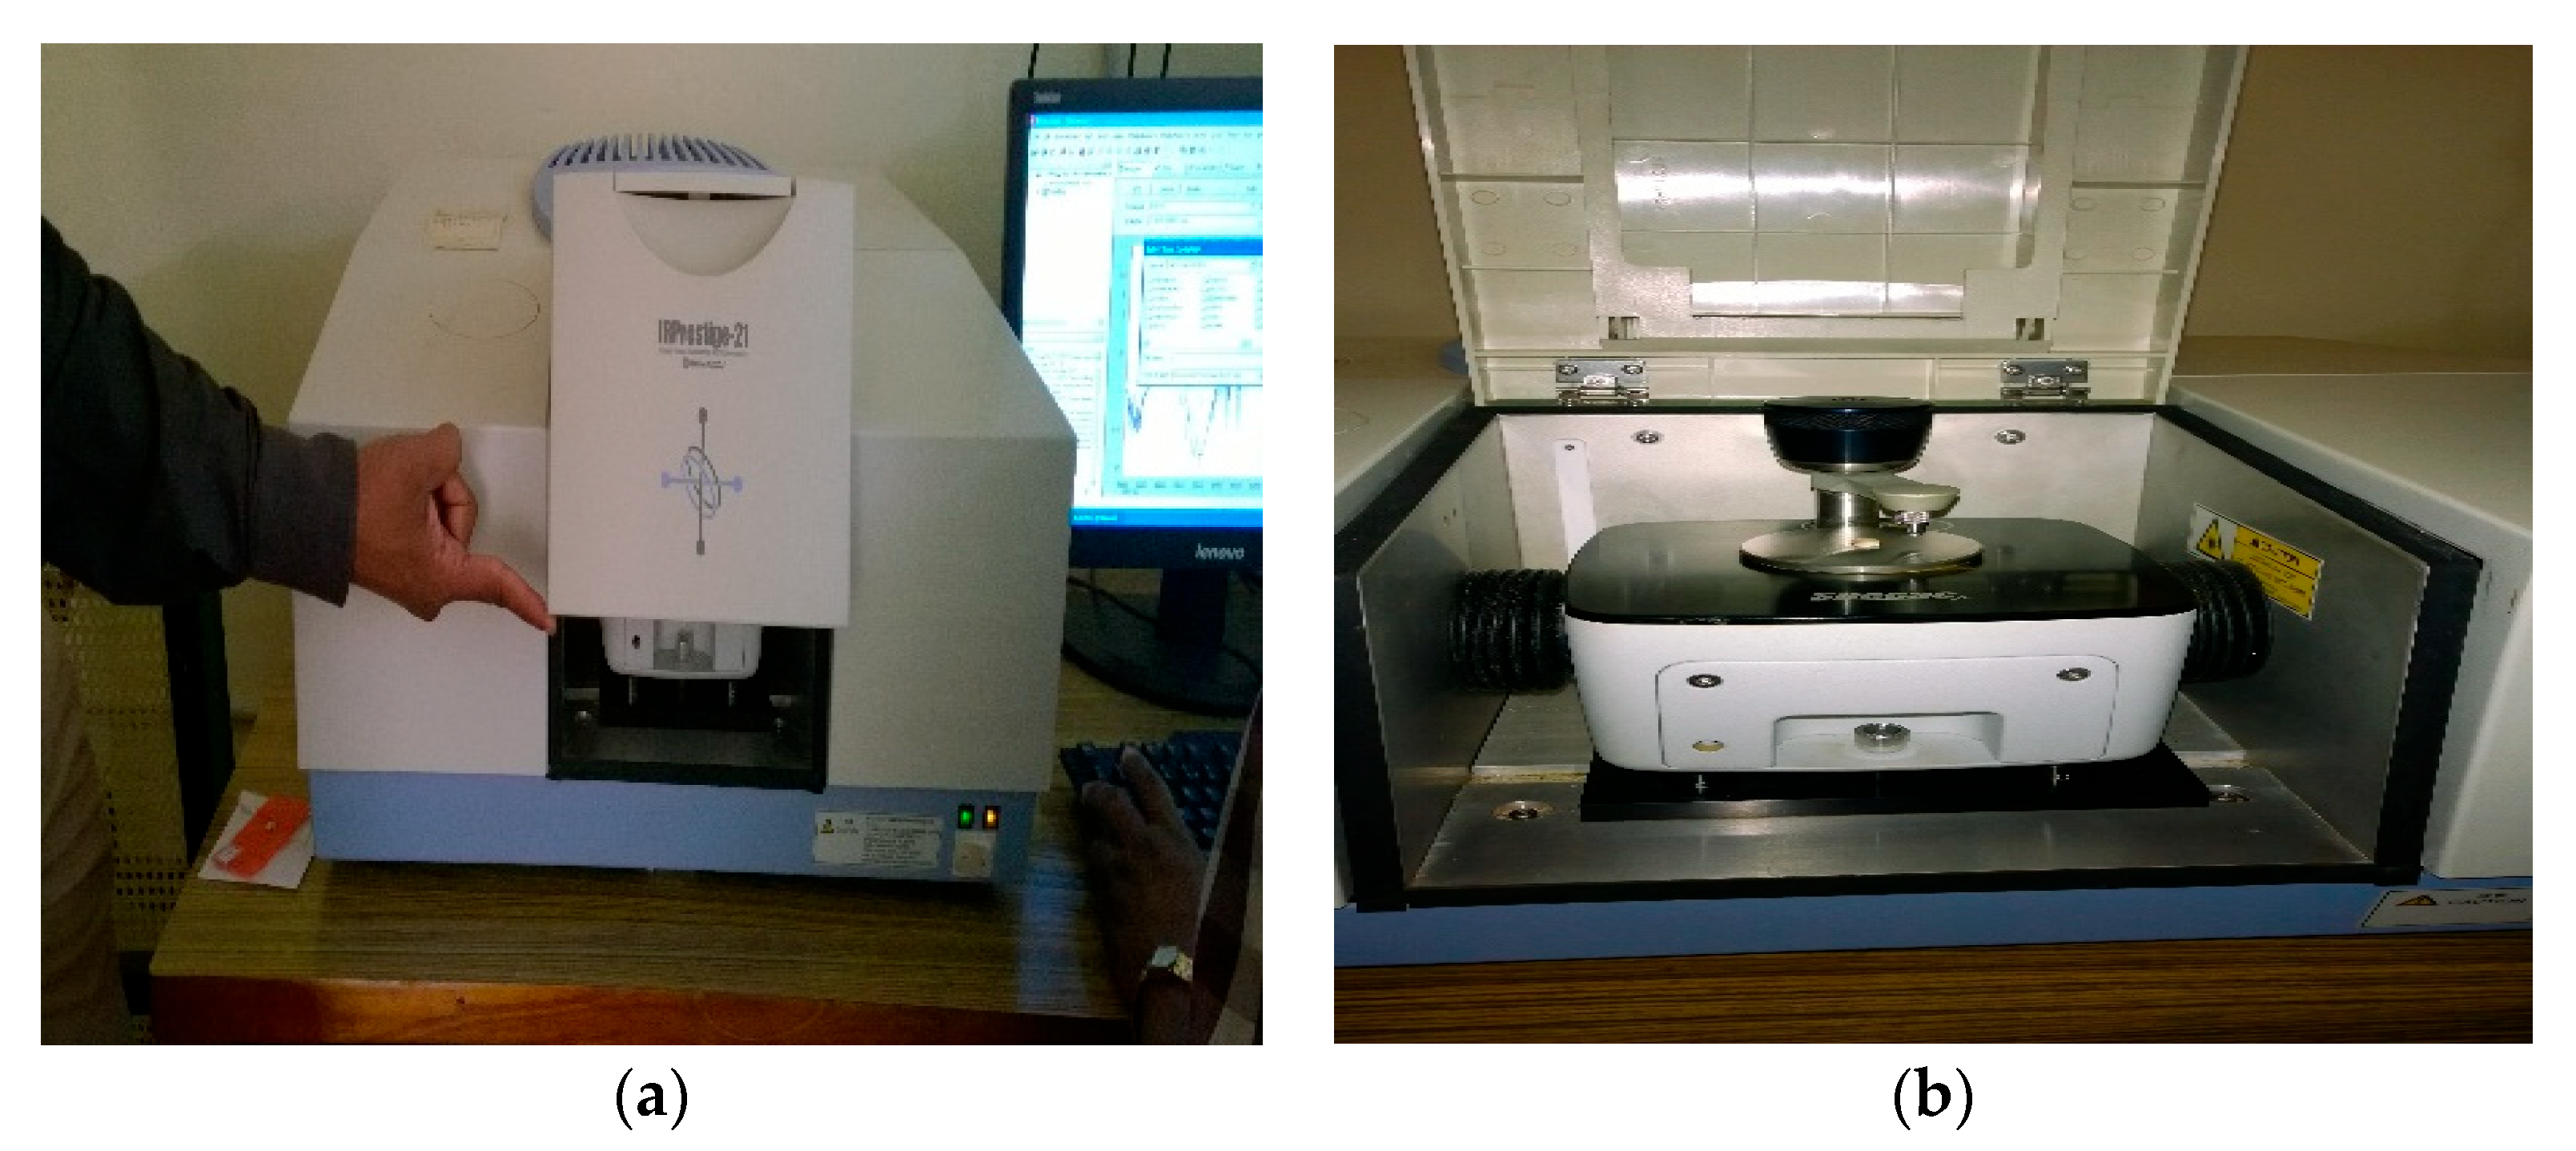
The laser used for irradiating the samples in the respective laser groups was a 3.5 watts 810 nm aluminum–gallium–arsenide laser for 30 s. The samples were analyzed using Fourier transform infrared spectrometry coupled with attenuated total reflectance (FTIR-ATR) (
Figure 1a,b). A qualitative analysis was carried out (
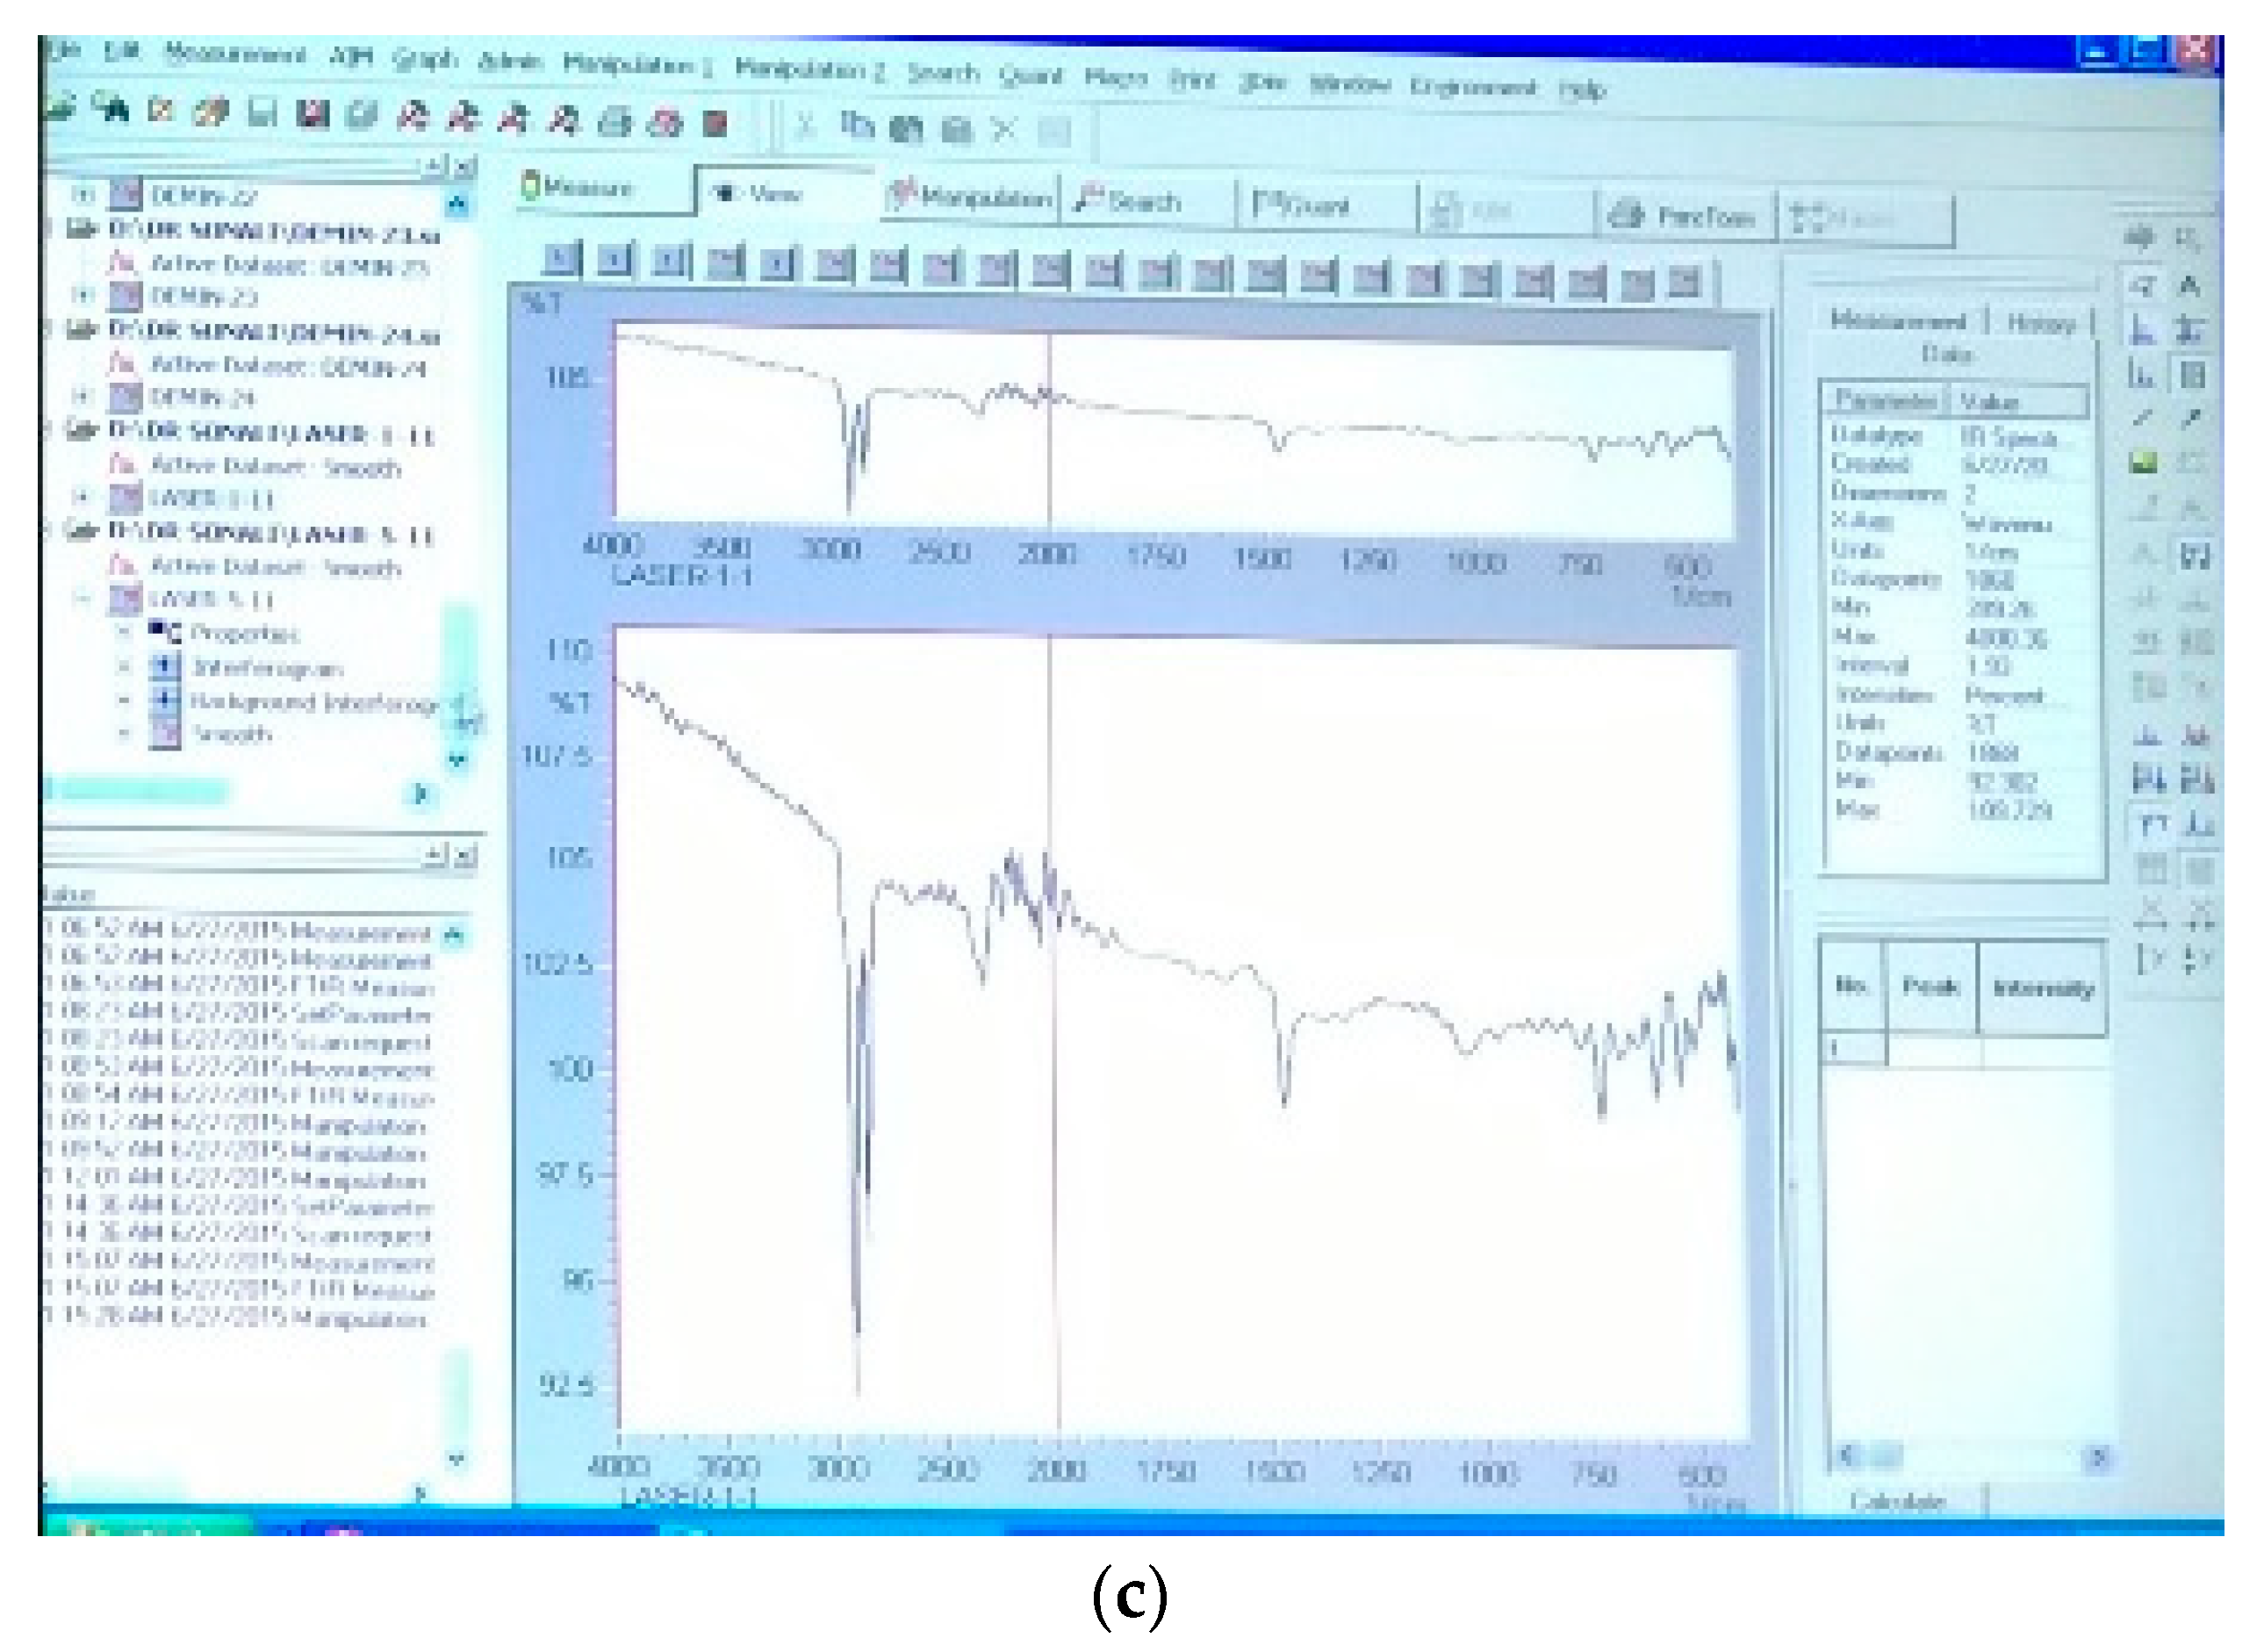
Figure 1c).
3. Results
In this study, FTIR spectra were captured to identify the conformational modulations, constituent shifts and variations in the functional groups derived from organic carbonyl bands, carbonate, hydroxyl, fluoride and phosphate. The IR Prestige-21 (Shimadzu) is an FTIR spectrometer with a patented “Autodryer” mechanism, and it has an S/N ratio of 40.000/1 and a maximal resolution of 0.5 cm
−1. The flexibility of being able to add NIR and FIR to the measurement range makes the instrument versatile. The spectral peaks of the composition of both the inorganic and organic components of the enamel were observed. The horizontal x-axis typifies and plots the intensity of the infrared spectra. The peaks designated as absorbance bands correlate with the corresponding vibrations of the molecules and atoms of the test samples due to the irradiation of the infrared wavelengths of the electromagnetic spectrum. The average spectra in the 4000–400 cm
−1 wavenumber region of the control and treated samples are presented in
Figure 2a–l.
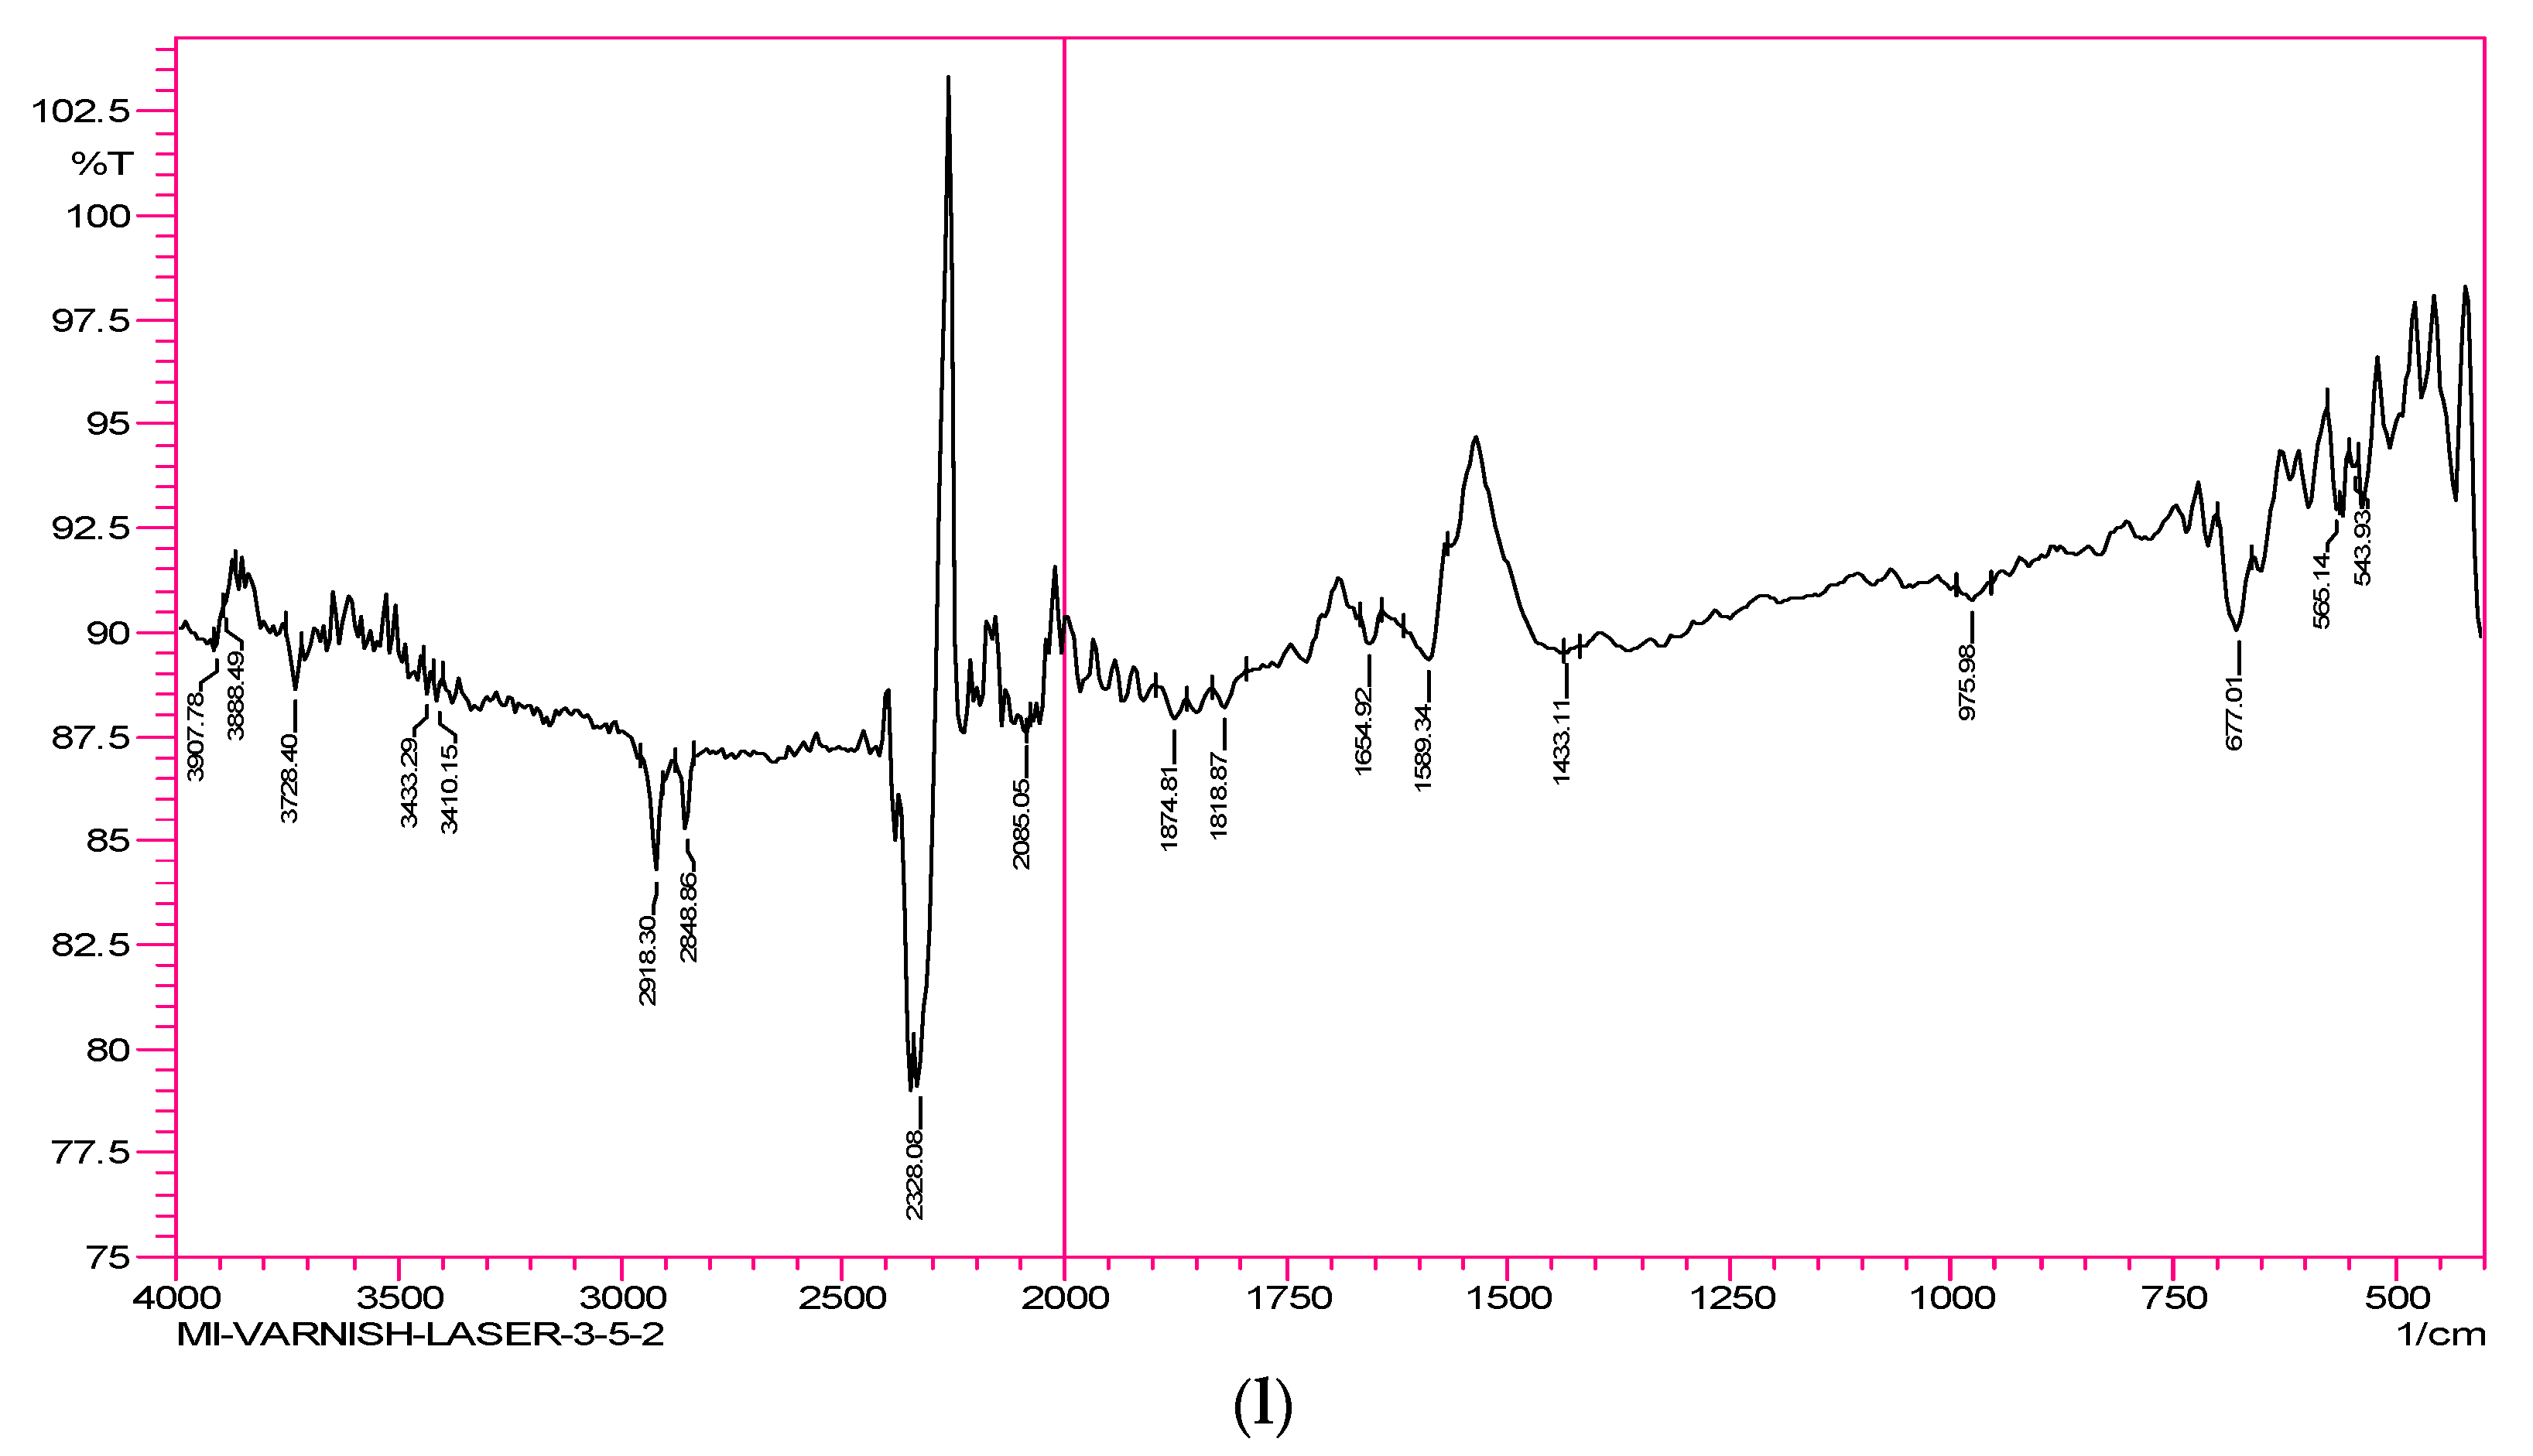
Group 1- Control samples: The strong peak observed at 1001 cm
−1 corresponds to carbonate. The peak/band at 960 and 871 cm
−1 represents phosphate. The peaks for organic matter appeared in the region of 2848 and 2918 cm
−1. The broad band observed at around 3317 cm
−1 represents the hydroxyl group, which is due to moisture content, and 1641 cm
−1 represents the carbonyl stretching band (
Figure 2a).
Group 2—Demineralized samples: The weak peak observed at 1051 cm
−1 corresponds to carbonate. The peak/band representing phosphate disappeared. The peaks for organic matter appeared in the region of 2848 and 2916 cm
−1. The broad band representing the hydroxyl group that is due to moisture content also disappeared. The carbonyl stretching band has disappeared (
Figure 2b).
Group 3—Laser 1 Watts samples: The weak peak observed at 1037 cm
−1 corresponds to carbonate. The peak/band representing phosphate disappeared. The peaks for organic matter appeared in the region of 2848 and 2916 cm
−1. The broad band representing the hydroxyl group that is due to moisture content also disappeared. The carbonyl stretching band has disappeared (
Figure 2c).
Group 4—Laser 2 Watts samples: The weak peak observed at 1018 cm
−1 corresponds to carbonate. The weak peak/band representing phosphate is at 871 cm
−1. The peaks for organic matter appeared in the region of 2848 and 2916 cm
−1. The broad band representing the hydroxyl group that is due to moisture content has disappeared. The carbonyl stretching band intensity is greatly reduced (
Figure 2d).
Group 5—Laser 3 Watts samples: The weak peak observed at 1022 cm
−1 corresponds to carbonate. The weak peak/band at 871 cm
−1 represents phosphate. The peaks for organic matter appeared in the region of 2848 and 2916 cm
−1. The broad band representing the hydroxyl group that is due to moisture content is extremely weak. At 1649 cm
−1, the carbonyl stretching band is a very weak band (
Figure 2e).
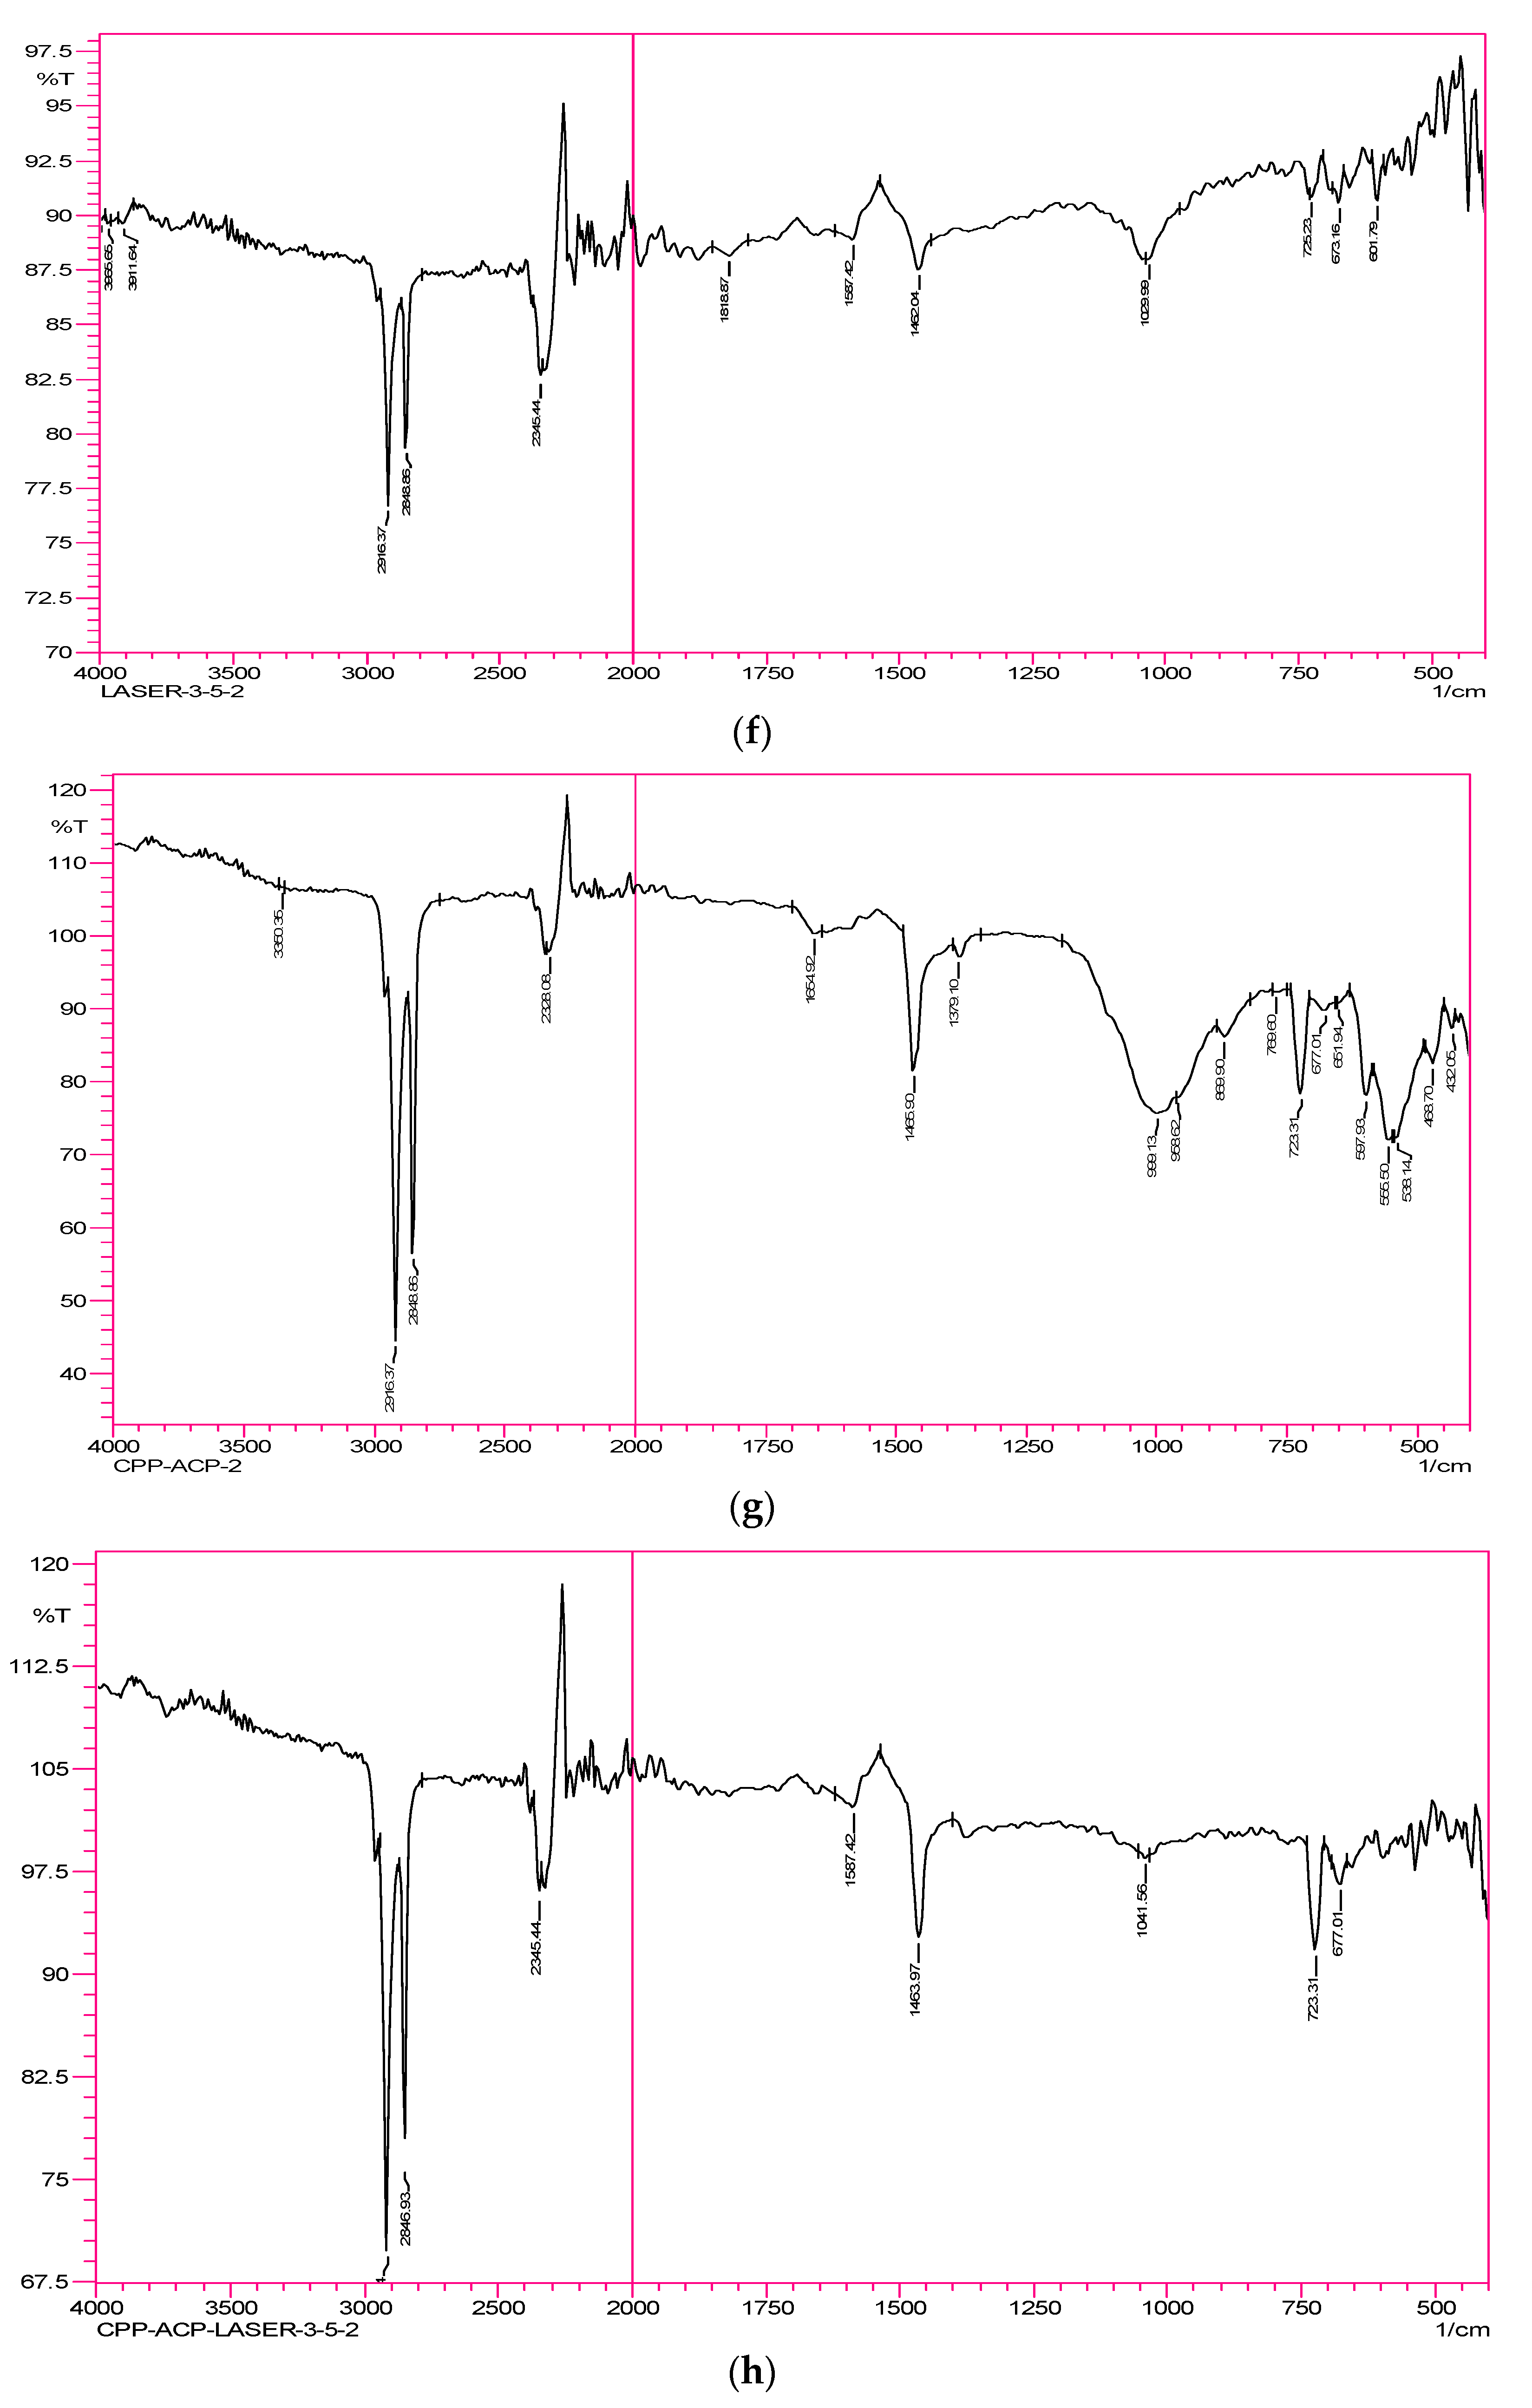
Group 6—Laser 3.5 Watts samples: The weak peak observed at 1029 cm
−1 corresponds to carbonate. The peak/band representing phosphate disappeared. The peaks for organic matter appeared in the region of 2848 and 2916 cm
−1. The broad band representing the hydroxyl group that is due to moisture content has disappeared. The carbonyl stretching band also disappeared (
Figure 2f).
Group 7—CPP-ACPF samples: The weak peak observed at 999 cm
−1 corresponds to carbonate, and a shift to the right was observed. The 869 cm
−1 weak peak/band representing phosphate disappeared. The peaks for organic matter appeared in the region of 2848 and 2916 cm
−1. The broad band representing the hydroxyl group that is due to moisture content disappeared, and 1654 cm
−1 corresponds to the weak carbonyl stretching band (
Figure 2g).
Group 8—CPP-ACPF & Laser 3.5 Watts samples: The very weak peak observed at 1041 cm
−1 corresponds to carbonate. The peak/band representing phosphate disappeared. The peaks for the organic matter appeared in the region of 2848 and 2916 cm
−1. The broad band representing the hydroxyl group that is due to moisture content disappeared. The carbonyl stretching band disappeared. At 1159 cm
−1, a small band representing fluoride was observed (
Figure 2h).
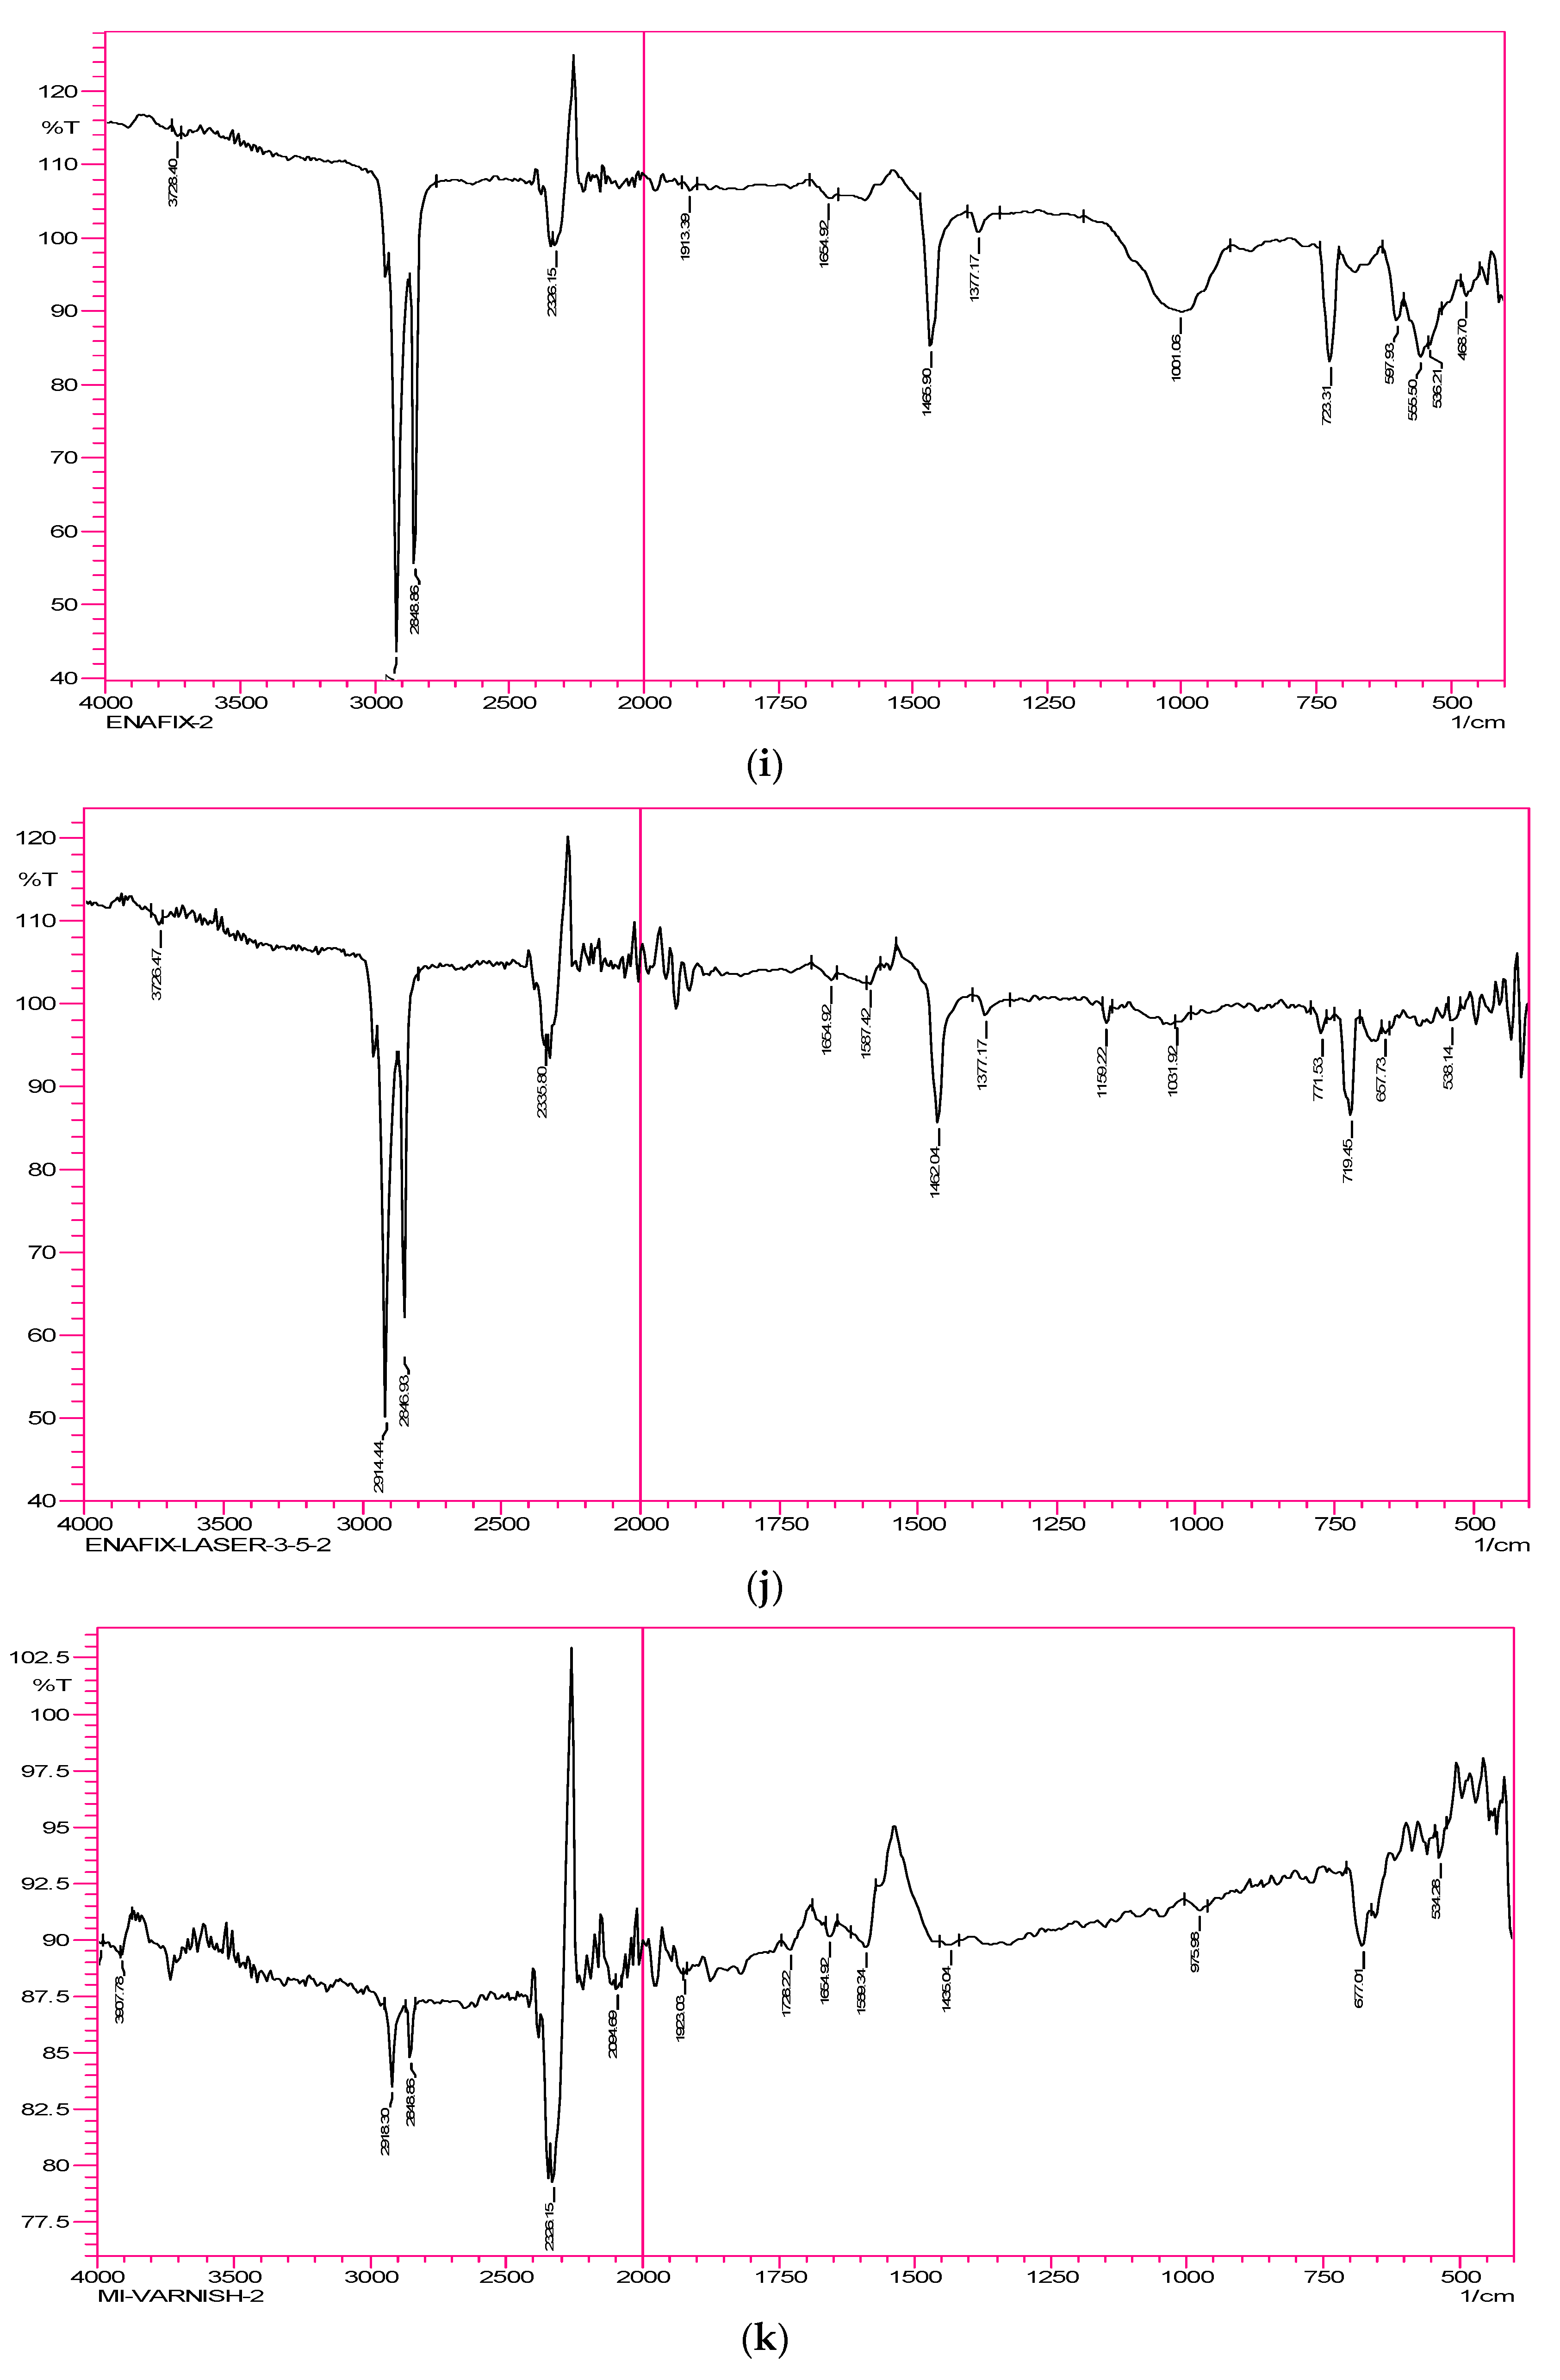
Group 9—Enafix samples: The very weak peak observed at 1001 cm
−1 corresponds to carbonate. The peak/band representing phosphate disappeared. The peaks for organic matter appeared in the region of 2848 and 2916 cm
−1. The broad band representing the hydroxyl group that is due to moisture content disappeared. The carbonyl stretching band disappeared (
Figure 2i).
Group 10—Enafix & Laser 3.5 Watts samples: The weak peak observed at 1031 cm
−1 corresponds to carbonate. The peak/band representing phosphate disappeared. The peaks for the organic matter appeared in the region of 2848 and 2916 cm
−1. The broad band representing the hydroxyl group that is due to moisture content disappeared. The carbonyl stretching band disappeared. At 1159 cm
−1, a small band representing fluoride was observed (
Figure 2j).
Group 11—MI Paste samples: Carbonate disappeared. The peak/band representing phosphate disappeared. The peaks for the organic matter appeared in the region of 2848 and 2916 cm
−1. The broad band representing the hydroxyl group that is due to moisture content disappeared. The carbonyl stretching band disappeared (
Figure 2k).
Group 12—MI Paste & Laser 3.5 Watts samples: The weak peak observed at 1002 cm
−1 corresponds to carbonate. The weak band at 869 cm
−1 represents phosphate. The peaks for organic matter appeared in the region of 2848 and 2916 cm
−1. The broad band representing the hydroxyl group that is due to moisture content disappeared. The carbonyl stretching band at 1654 cm
−1 is a weak band (
Figure 2l).
A statistical analysis was carried out using SPSS software. The mean values between groups were computed. It was observed that there was significant deviations of all groups from that of the control, except for when using 3.5 watts of the laser followed by CPP-ACPF (
Table 1 (A) and
Figure 3).
Table 1 (A): Comparison of means, with
p-value < 0.001 signifying that there is a significant difference between at least two groups. With the application of the post hoc test, we can conclude that there are significant differences between Group 1 and all other groups, except for Group 8. The difference between Group 1 and Group 8 is non-significant. All other groups have non-significant differences from each other.
Figure 3: The control was compared to the other surface treatment modalities. The surface treatment of Group 8—Laser irradiation followed by the application of CPP-ACPF—had results comparable to those of the control samples, i.e., natural teeth.
A post hoc test for multiple comparisons of groups was carried out, and it was observed that the surface treatment of 3.5 watts followed by CPP-ACPF resulted in values similar to those of the control. The other groups had significant deviations from that of the control (
Table 1 (B)).
Table 1 (B): With the application of the post hoc test, we concluded that there were significant differences between Group 1 and all other groups, except for Group 8. The difference between Group 1 and Group 8 was non-significant. All other groups had non-significant differences from each other.
4. Discussion
There are various investigative techniques that can be used to analyze the chemical composition of enamel, dentin and bone, such as energy-dispersive X-ray (EDAX), Fourier transform infrared (FTIR) spectroscopy and Raman spectroscopy [
19].
Energy-dispersive X-ray (EDX) spectroscopy is an X-ray technique used for surface analyses to identify and carry out semi-quantitative chemical analyses of any given sample. EDX is based on bombarding the surface of a sample with high-energy electrons and then observing it with the emission of X-rays. The pattern of the emitted X-ray photonic energy is different for each element owing to its unique and distinctive atomic configuration. The limitation of this technique is that only surface analyses can be carried out, and in many cases, this leads to destructive analyses. Further quantitative analyses of heterogeneous materials may give rise to inaccurate data, and there could be a relatively weak spectral resolution [
19].
Both Raman spectroscopy and FTIR are comparable vibrational spectroscopic techniques. In Raman spectroscopy, the photons in either the visible or ultraviolet region interact with the vibrating molecular bonds, and due to a gain or loss of incident energy, the polarization of molecules thus generates a spectrum. Raman spectroscopy has an advantage in that the spectral analysis can be conducted in reflection mode; hence, the samples can be analyzed in toto, and there is no requirement of sample preparation or destruction. FTIR spectroscopy is widely used for biological samples, as the inorganic and organic components have dipole moments and are thus active in the infrared spectrum. FTIR spectra can be obtained using a multitude of various techniques, such as reflectance, either specular or diffuse reflectance, or attenuated total reflectance (ATR), by transmission and photoacoustic infrared spectroscopy. For biological samples, the transmission technique has been used to acquire FTIR spectra. The limitation of this is that that a pulverized sample has to be prepared and homogeneously mixed with potassium bromide under high pressure until transparency is achieved. The prepared sample pellet is placed on transparent infrared windows, such as potassium bromide, barium fluoride and calcium fluoride. The challenge is compounded by the determination of exacting proportions of the sample material so as to attain an optimal peak absorbance of 0.2 to 0.7 absorbance units. To circumvent these inherent issues with transmission techniques, newer methodologies have been developed based on attenuated total reflectance, photoacoustic infrared spectroscopy and diffuse reflectance, which require the minimal preparation of samples or no preparation. The FTIR spectroscopic technique encompasses infrared spectrum absorption, which demonstrates that, by the absorption of incident photonic energy, the photon moves from a lower-energy orbit to a higher-energy orbit and reaches an exalted state. The resultant excited states cause the vibration of the molecular bonds that occur at various frequencies in the infrared region of the electromagnetic spectrum. The wavelength of the peak of the absorbance is dependent on the inherent rheological properties of the said molecule. Hence, this technique is known as the molecular fingerprint of the functional group. The vibration may be exhibited in various forms, such as twisting, rocking deformation, bending or stretching. In this study, carbonyl stretching was observed in all specimens. The carbonyl or C=O group is the ideal functional group for detection by infrared spectroscopy because its stretching vibration peak is intense and is located in a unique wavenumber range [
19].
Enamel has a mineral content of 96%, an organic content of 1%, 3% water by weight and an 87 inorganic mineralized content by volume. Hydroxyapatite (HA) crystals constitute a major part of the inorganic structure. Thus, as a corollary, it follows that, in enamel, approximately 13% of the space is filled with insoluble and soluble proteins, lipid carbohydrates and water in the interprismatic region [
16,
17]. It has been observed that carbonate, water, collagen and phosphate have high propensities for infrared spectrum absorption [
19].
For caries prevention and caries inhibition, the laser photonic energy interacts with the dental tissues to cause compositional changes. The absorption coefficient of the aluminum–gallium–arsenide laser is in the order of 1.0.19. To bring about radical compositional changes in enamel, the laser energy must be absorbed by the hard tissues without any heat build-up or deleterious effects on the adjacent tissues [
16,
19]. Thus, the present study investigated the compositional changes in enamel after surface treatments with an aluminum–gallium–arsenide laser and remineralizing paste used alone or in combination, and the different surface treatments were applied to demineralized enamel surfaces. It was observed that, in the control (
Figure 2a), there was a strong peak at 1001 cm
−1 corresponding to the carbonate group. The peak/band at 960 and 871 cm
−1 represents phosphate. The peaks for the organic matter appeared in the region of 2848 and 2918 cm
−1. The broad band observed around 3317 cm
−1 represents the hydroxyl group, which is due to moisture content. Carbonyl stretching was observed at 1641 cm
−1. During demineralization (
Figure 2b), the peak/band representing phosphate disappeared. The broad band representing the hydroxyl group, which is due to moisture content, also disappeared, along with the carbonyl stretching band. With the laser irradiation, the carbonyl band became weak and disappeared with an increase in the wattage (
Figure 2c–f). With the CPP-ACPF surface treatment, at 1654 cm
−1, a weak carbonyl stretching band was observed. With the other pastes or combinations of laser irradiation and remineralizing paste, the carbonyl band disappeared.
The enamel surface has a rich layer of fluoride and is thus resistant to acidic dissolution. However, it has been observed that a 25–50 micron subsurface layer has a higher content of carbonate; though it is a precursor of hydroxyapatite, it is the weakest link owing to its poor lattice fit and propensity for acid dissolution [
20]. The carbonate of dental tissues is primarily 90% type B carbonate and 10% type A [
21]. Deciduous teeth are more prone to demineralization than permanent teeth owing to the high carbonate content of 2.23% in deciduous dentition as opposed to the 2.15% content in permanent teeth [
21]. Multiple studies have observed that laser irradiation causes carbonate loss, be it argon lasers, Er: YAG lasers or CO
2 lasers [
21,
22,
23,
24]. A decrease in type B carbonate was observed by Liu et al. during irradiation with Er: YAG [
25]. In the current study, it was observed that, in the control group, the strong peak observed at 1001 cm
−1 corresponded to carbonate; in the demineralized group, a weak peak of carbonate was observed at 1051 cm
−1; in the CPP-ACPF group, there was a shift to the right, and a weak carbonate peak was observed at 999 cm
−1; for the Enafix group, a very weak peak of carbonate was observed at 1001 cm
−1; in the MI paste group, the carbonate group completely disappeared; and the laser irradiation with an increasing wattage had a weak carbonate band that shifted to the left with 3.5 watt irradiation, exhibiting a weak carbonate peak at 1029 cm
−1 (
Figure 2a–l).
Lasers, such as argon lasers, CO
2 lasers and Nd: YAG lasers, have all been experimented with for caries prevention. Hicks used scanning electron microscopy to assess surface changes when surface treatment was carried out with argon alone or with fluoride—both combinations played a role in caries inhibition [
13]. Nammour et al. and Passos et al. showed that laser irradiation causes an increase in fluoride uptake by using high-power lasers [
26,
27]. Studies by De Sant’anna et al. [
16] and Sharma et al. [
28,
29] demonstrated that low-power lasers can cause caries inhibition. In the current study, it was observed that the irradiation of a 3.5 watt aluminum–gallium–arsenide laser along with the inclusion of a fluoride-containing remineralizing paste resulted in a small band corresponding to fluoride at 1159 cm
−1 (
Figure 2h,j).
Enamel has a very low proportion of organic content, i.e., 1%. It is present in the form of amino acids and peptides and historically represents the original developmental organic matrix, which provides the template framework for mineralization to occur [
16,
30]. Despite the low organic quantum present in enamel, its role in cariogenicity correlates to its presence in caries-affected enamel. The initiation and progression of enamel caries lead to increased pore sizes, and remineralization leads to reduced pore sizes. Ferreira et al. observed that groups with higher amounts of organic matter available during caries formation had decreased remineralization [
30]. Organic matter also provides a channel or diffusion pathway for transportation within the enamel and to dentin, and this is hypothesized as being a pathway for the spread of caries and laser-induced caries inhibition. The quantification of the minuscule amount of organic matter is a challenge, and FTIR is a method that can be used to quantify the organic phase. In Raman studies, the band that quantifies change is the 2940 cm
−1 band. In the present study, the peaks for the organic matter appeared in the region of 2848 and 2918 cm
−1. As with other studies [
16], there was a decrease in the intensity of this band with laser treatment in the current study (
Figure 2a–l).
The increase in acid resistance after laser irradiation is attributed to changes in the enamel lattice and reductions in water and carbonate content [
16,
22,
23,
24,
29]. In the present study, in the control, the broad band observed around 3317 cm
−1 represents the hydroxyl group, which is due to moisture content, and the peak/band at 960 and 871 cm
−1 represents phosphate ions. However, on demineralization, the water and phosphate groups disappeared. After all surface treatments, the hydroxyl ions disappeared. The low-wattage laser group demonstrated a weak phosphate band. de Sant’anna GR [
16] suggested the use of photo-absorbing cream for the absorption of low-level lasers; in this study, no photo-absorbing cream was used, and, thus, there was no temperature build-up. In the current study, it was observed that, after demineralization, i.e., in Group 2, there was a total disarray and deviation of the organic and inorganic components of the enamel. There was an increased deviation between Group 1 and all other groups, except for Group 8. It was also observed that Group 8, i.e., 3.5 watts of laser followed by a remineralizing paste of CPP-ACPF, had compositional changes in the inorganic and organic components of enamel, and these changes were similar to those of natural teeth, i.e., the control (
Table 1 (A,B) and
Figure 3). The results were statistically significant. The authors [
29] hypothesize that 3.5 watts of an aluminum–gallium–arsenide laser may preferentially remove carbonate and hydroxyl ions, and, thus, the uptake of fluoride in the C axis is greater than that of non-irradiated teeth. This could be the possible mechanism that explains the compositional changes in irradiated surfaces with a laser. Irradiation with 3.5 watts of laser for 30 s followed by the application of fluoridated remineralizing paste led to the presence of a fluoride at band 1159 cm
−1 (
Figure 2h,j).
In future studies, a combination of an aluminum–gallium–arsenide laser with different biomimetic pastes, including the new zinc-hydroxyapatite-based paste, can be evaluated for different clinical scenarios, such as molar incisor hypomineralization and white spot lesions, in addition to subsurface carious lesions [
30,
31].
