Article

Band Alignments of GeS and GeSe Materials

by
Miłosz Grodzicki
1,2,*,
Agata K. Tołłoczko
1,
Dominika Majchrzak
2,3,
Detlef Hommel
2,3 and
Robert Kudrawiec
1,2
1
Department of Semiconductor Materials Engineering, Faculty of Fundamental Problems of Technology, Wrocław University of Science and Technology, Wybrzeże Wyspiańskiego 27, 50-370 Wrocław, Poland
2
Łukasiewicz Research Network—PORT Polish Center for Technology Development, Stabłowicka 147, 54-066 Wrocław, Poland
3
Institute of Low Temperature and Structure Research, Polish Academy of Sciences, Okólna 2, 50-422 Wrocław, Poland
*
Author to whom correspondence should be addressed.
Crystals 2022, 12(10), 1492; https://doi.org/10.3390/cryst12101492
Submission received: 20 September 2022 / Revised: 11 October 2022 / Accepted: 17 October 2022 / Published: 20 October 2022
(This article belongs to the Special Issue Thermoelectric Semiconductor Materials and Devices)

Abstract

:
Here we present new findings of a comprehensive study of the fundamental physicochemical properties for GeS and GeSe in bulk form. UV and X-ray photoelectron spectroscopies (UPS/XPS) were employed for the experiments, which were carried out on in situ cleaned (100) surfaces free from contamination. This allowed to obtain reliable results, also unchanged by effects related to charging of the samples. The work functions, electron affinities and ionization energies as well as core level lines were found. The band gaps of the investigated materials were determined by photoreflectance and optical absorption methods. As a result, band energy diagrams relative to the vacuum level for GeS and GeSe were constructed. The diagrams provide information about the valence and conduction band offsets, crucial for the design of various electronic devices and semiconducting heterostructures.

1. Introduction

Since the discovery of the unique properties of graphene, plenty of van der Waals materials have been extensively studied. Among the rediscovered compounds are monochalcogenides which include germanium sulphide (GeS) and germanium selenide (GeSe). The crystals are made of diatomic bilayers (100)-oriented in which the Ge and S/Se atoms have covalent bonds. The bilayers are stacked on top of each other through van der Waals interactions, forming an orthorhombic structure. In this form, both GeS and GeSe are relatively narrow band gap semiconductors. They have closely placed direct and indirect band gap, the width of which is in the ranges of 1.59–1.7 eV and 1.1–1.3 eV, respectively for GeS and GeSe [1,2,3,4,5,6]. They can be utilized in a wide area of optoelectronic and electronic applications, including transistors, photovoltaics and photodetectors [7,8,9,10,11,12]. They owe it to their properties such as adequate width of band gap, high absorption coefficiency, high carrier mobility.
Although there has recently been a considerable interest in GeS and GeSe as functional materials, the knowledge on their fundamental physical quantities, such as work function (WF), electron affinity (EA) or ionization energy (IE), is unclear. Their values play a fundamental role in the characteristics and performance of potential devices. For example, in the simplest applications such as metal-semiconductor contact, these features determine whether a given junction will have rectifying or linear properties. They also influence the performance of devices based on heterojunctions, where an electron barrier may appear. In addition, they can play an important role in the design of multilayer photovoltaic structures with an appropriate absorption range, avoiding a formation of unnecessary interfacial barriers.
So far, most of photoemission results for the discussed materials concern the determination of core level lines using X-ray photoelectron spectroscopy (XPS) [13,14,15,16,17]. Some reports attempted to define IE, but divergent results were obtained, for example for GeSe the difference is up to 0.4 eV [17,18,19]. In the latter two works UV photoelectron spectroscopy (UPS), which is more surface sensitive and has better resolution than XPS, was applied for this purpose. In [20] the authors used UPS, but their analysis was limited to explaining the origin of density of states in the valence band—the WF, EA, IE were not specified. Such quantities strongly depend on the vacuum level, which in turn is extremely sensitive to the surface conditions. For instance, an adsorption of oxygen can reduce the WF due to forming of an electric dipole caused by a higher electronegativity of O than Ge. Another problem that may affect the correctness of XPS/UPS results is a sample charging during photoelectron emission experiments [21,22,23], which may lead to inaccurate values of the determined WF or energy of the valence band maximum (VBM).
In this report we determined electronic properties of clean surfaces of GeS and GeSe in bulk form. The positions of vacuum level and valence band maximum as well as core level lines were obtained during photoelectron emission experiments. Importantly, in this experiment, we are sure that the charging effect did not appear, and thus we obtain undisturbed spectra. Additionally, the widths of band gap for GeS and GeSe were determined by photoreflectance and optical absorption methods. The data obtained here allowed to draft band energy diagrams for GeS and GeSe relative to the vacuum level.

2. Materials and Methods

In the experiments GeS and GeSe bulk materials were studied. Both crystals were produced commercially (HQ graphene). They were nominally non-doped and were grown by chemical vapor deposition. The samples, freshly exfoliated, were transferred into the ultra-high vacuum (UHV). The UHV chamber was fitted with an Ar-ion source allowing to clean the surfaces by a low energy ion sputtering. Ar-ion cleaning method allows to leave trace amount of carbon before final cleaning to probe the charging state of the samples, using procedure proposed by Greczynski and Hultman [21,22]. In this study charging of the samples did not occur and no binding energy correction was applied to the spectra obtained. Example results for GeS before and after cleaning are presented in Figure 1. The curve ‘0′ corresponds to the as transferred sample, ‘1′ and ‘2′ are attributed to surfaces sputtered for 4 min and 6 min, respectively. After the first step of sputtering the O 1s peak is no longer present in the spectrum and the C 1s peak is slightly visible then disappears.
UPS spectra obtained for GeS and GeSe in the cleaning stages ‘1′ and ‘2′ do not change. Thus, we observed that such a small amount of carbon has no effect on the electronic properties of the materials. Photoelectron experiments were performed with a hemispherical electron energy analyzer (Argus CU) under UV or X-ray illumination. The sources used were He I (21.22 eV) [24] and monochromatic Al (1486.6 eV). Photoelectrons were collected with a step of 0.01 eV and a pass energy of 1 eV for UPS, and with a step of 0.05 eV and a pass energy of 20 eV for XPS measurements. An electron collection angle was 30 degrees—the angle between the analyzer entrance axis and the substrate normal. All presented spectra are relative to the Fermi level (EF) of the energy analyzer which is located at 0 eV. The energy uncertainty for the values determined by means of XPS or UPS is estimated to be ± 0.05 eV.
Widths of band gaps were determined by photoreflectance (PR) and optical absorption techniques. For the experiment GeS and GeSe flakes of thickness between 10 and 50 μm were selected, and the top layer of each sample was exfoliated to obtain a clean surface. During the experiment the samples were placed in a vacuum chamber, also allowing to monitor and adjust the material temperature. The measurements were performed using dedicated experimental setups, consisting of a 500 nm focal length grating monochromator (Zolix Omni-λ 500), a quartz tungsten halogen lamp as the white light source, and Si photodiode coupled with a lock-in amplifier (Stanford Research Systems SR8320) for signal detection. For PR measurements the dielectric function of the material was modulated by periodical excitation with a 405 nm laser diode, mechanically chopped at the frequency of ~300 Hz. Herein, all measurements were conducted at room temperature.

3. Results and Discussion

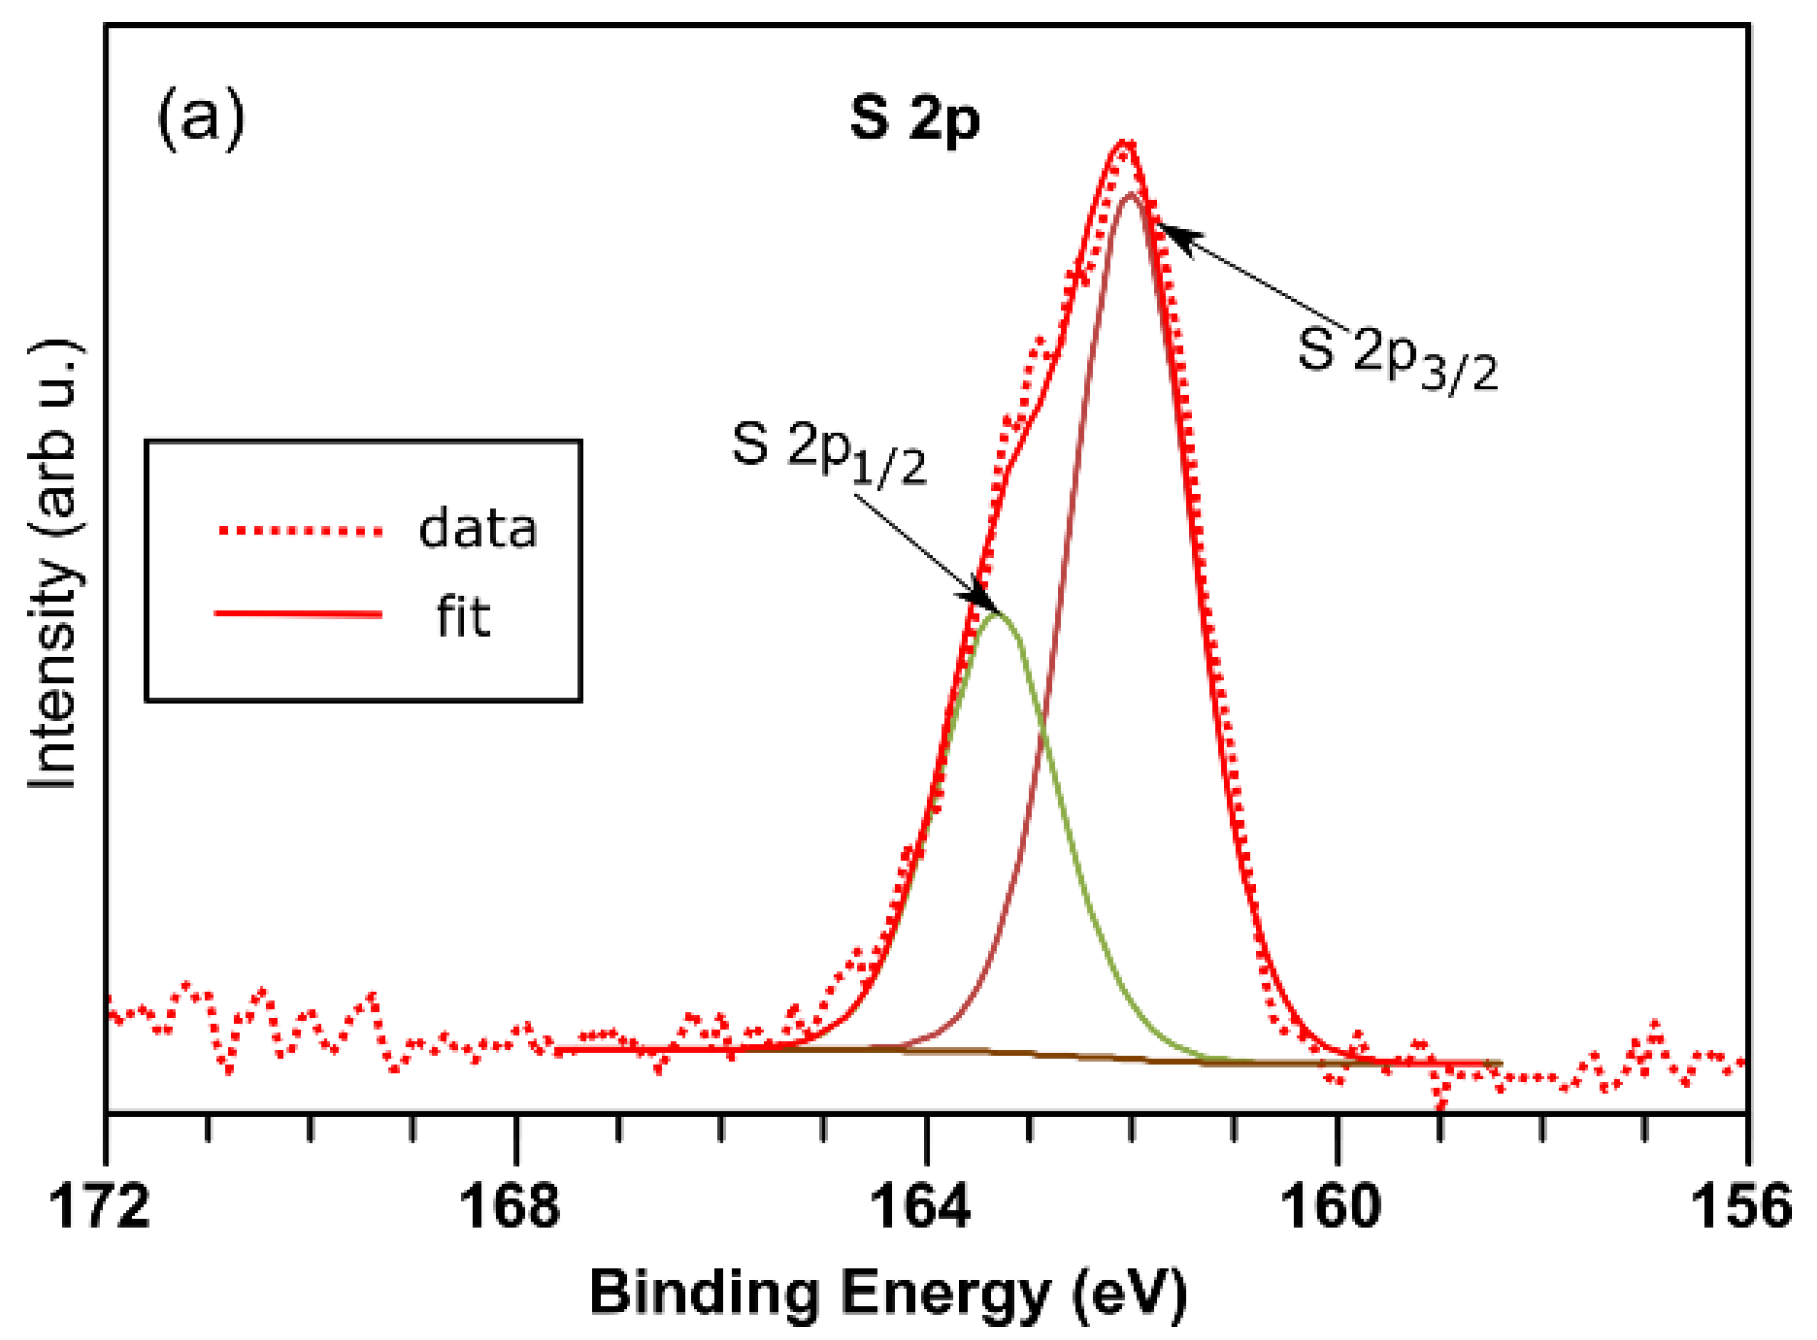
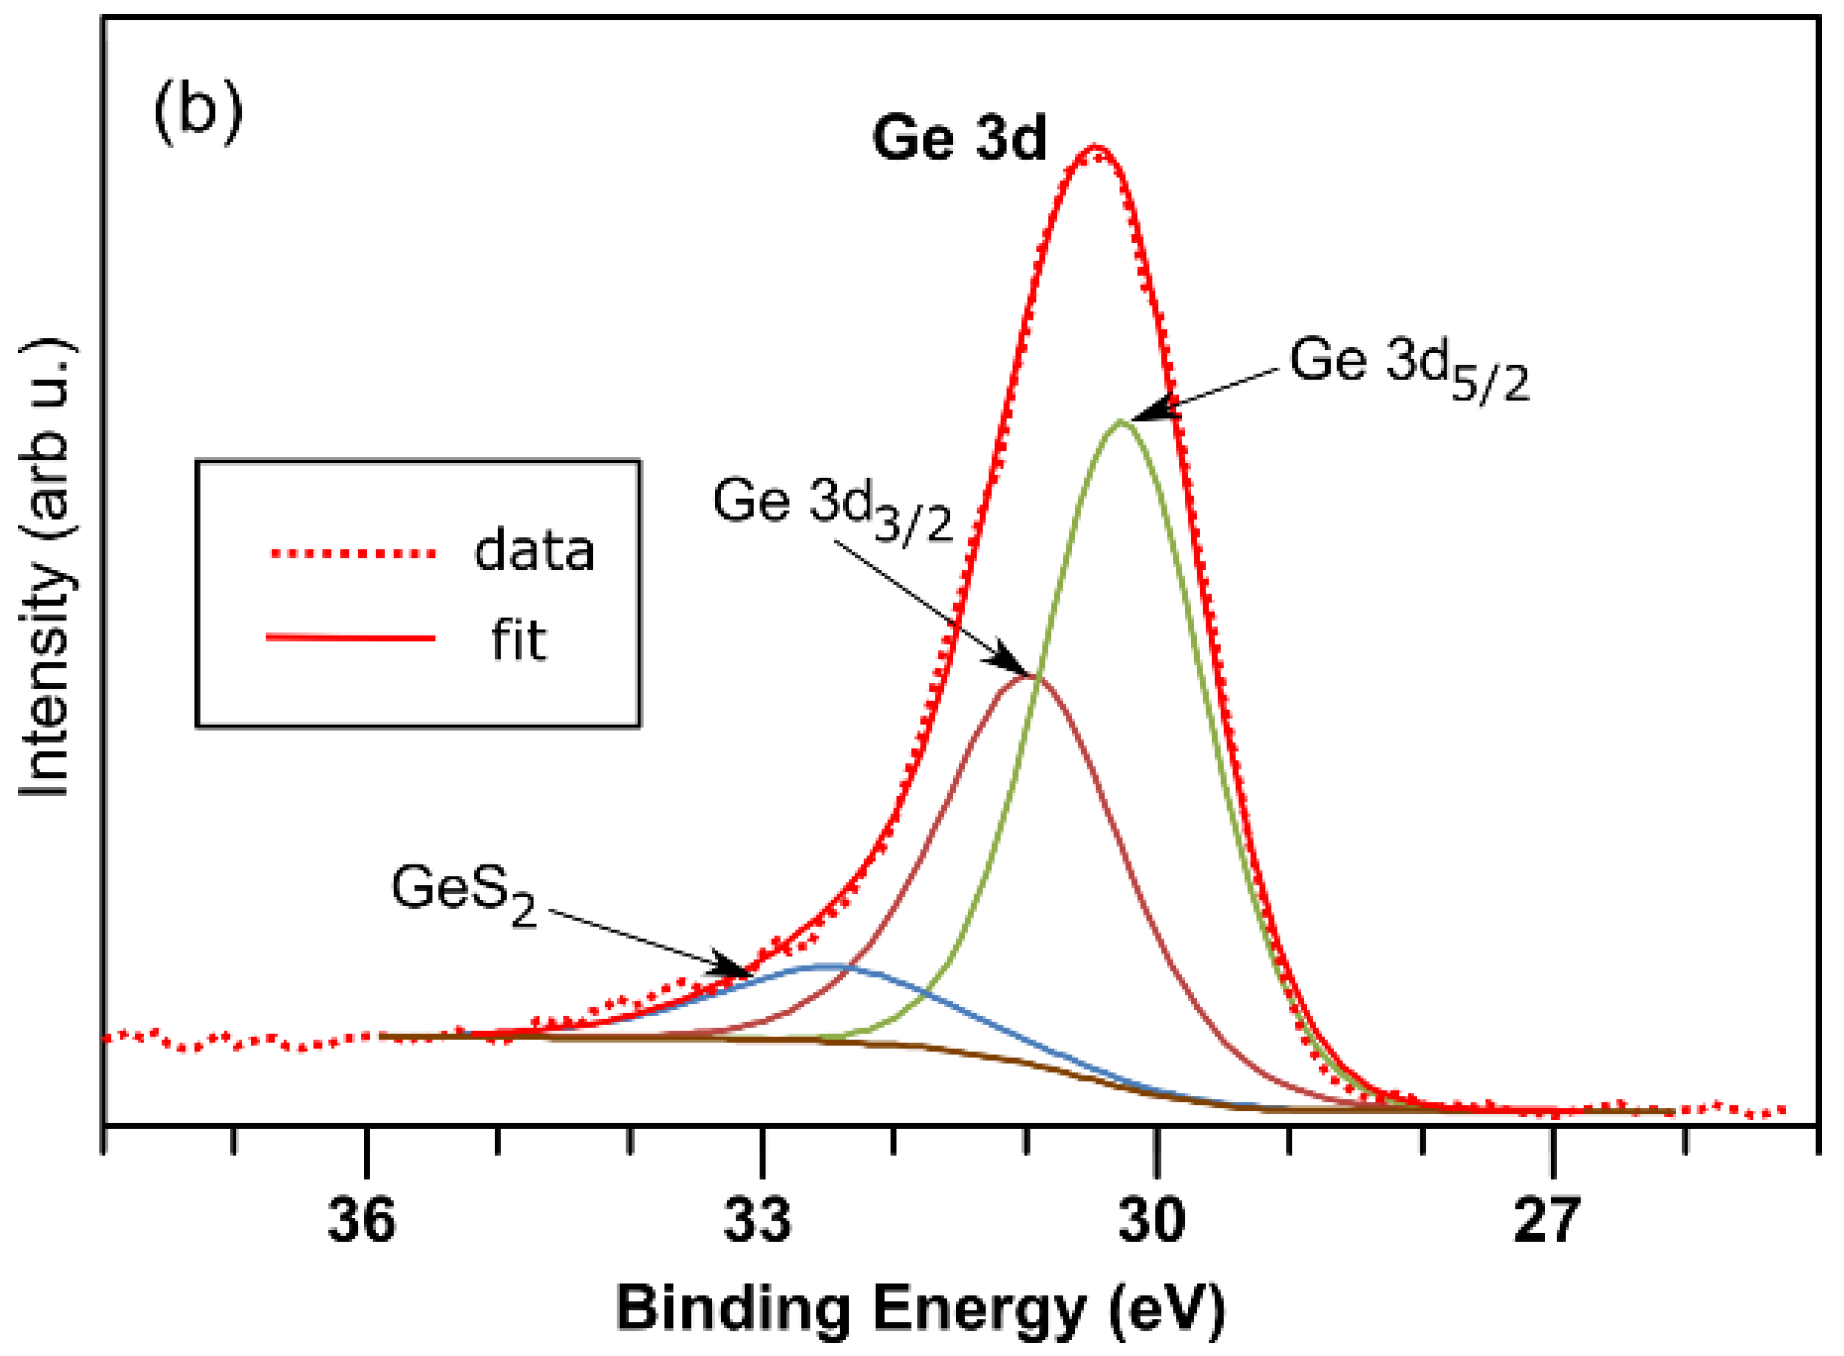
The results of the XPS investigation of GeS and GeSe are summarized in Figure 2 and Figure 3. For GeS the core level lines S 2p and Ge 3d were observed, as shown in Figure 2a,b. The S 2p peak is fitted with two components at 163.2 eV and 162.0 eV, corresponding to the S 2p1/2 and S 2p3/2 spin-orbitally split electron states, respectively. The positions indicate that S is in the +2 oxidation state, as expected [15]. The Ge 3d core level line is fitted with the Ge 3d3/2 and Ge 3d5/2 doublet with binding energies of 30.85 eV and 30.15 eV (the +2 oxidation state) and one weak component at 32.35 eV originating from the bonding of GeS2 (Ge at the +4 oxidation state). The XPS results for GeS are therefore consistent with previous reports [13,15,17].
From the XPS spectra acquired for GeSe, along with the Ge 3d core level line (Figure 3a), a peak attributed to Se 3d orbitals was detected (Figure 3b). The Se 3d3/2 and Se 3d5/2 doublet was fitted with two components at 55.5 eV and 54.15 eV, respectively, which corresponds to Se in the +2 oxidation state. No trace of Se in 0 or +4 states was observed unlike in [17], where XPS signal from the Se in an elemental form was stronger than from the GeSe compound. The analysis of the Ge 3d peak allowed to determine the energies of the Ge 3d3/2 and Ge 3d5/2 states as 30.5 eV and 29.85 eV, respectively, indicating contribution only from Ge at +2 oxidation state. The positions of Se 3d and Ge 3d doublets are in line with other works [17,25]. The energies of core level lines observed for GeS and GeSe are listed in Table 1.
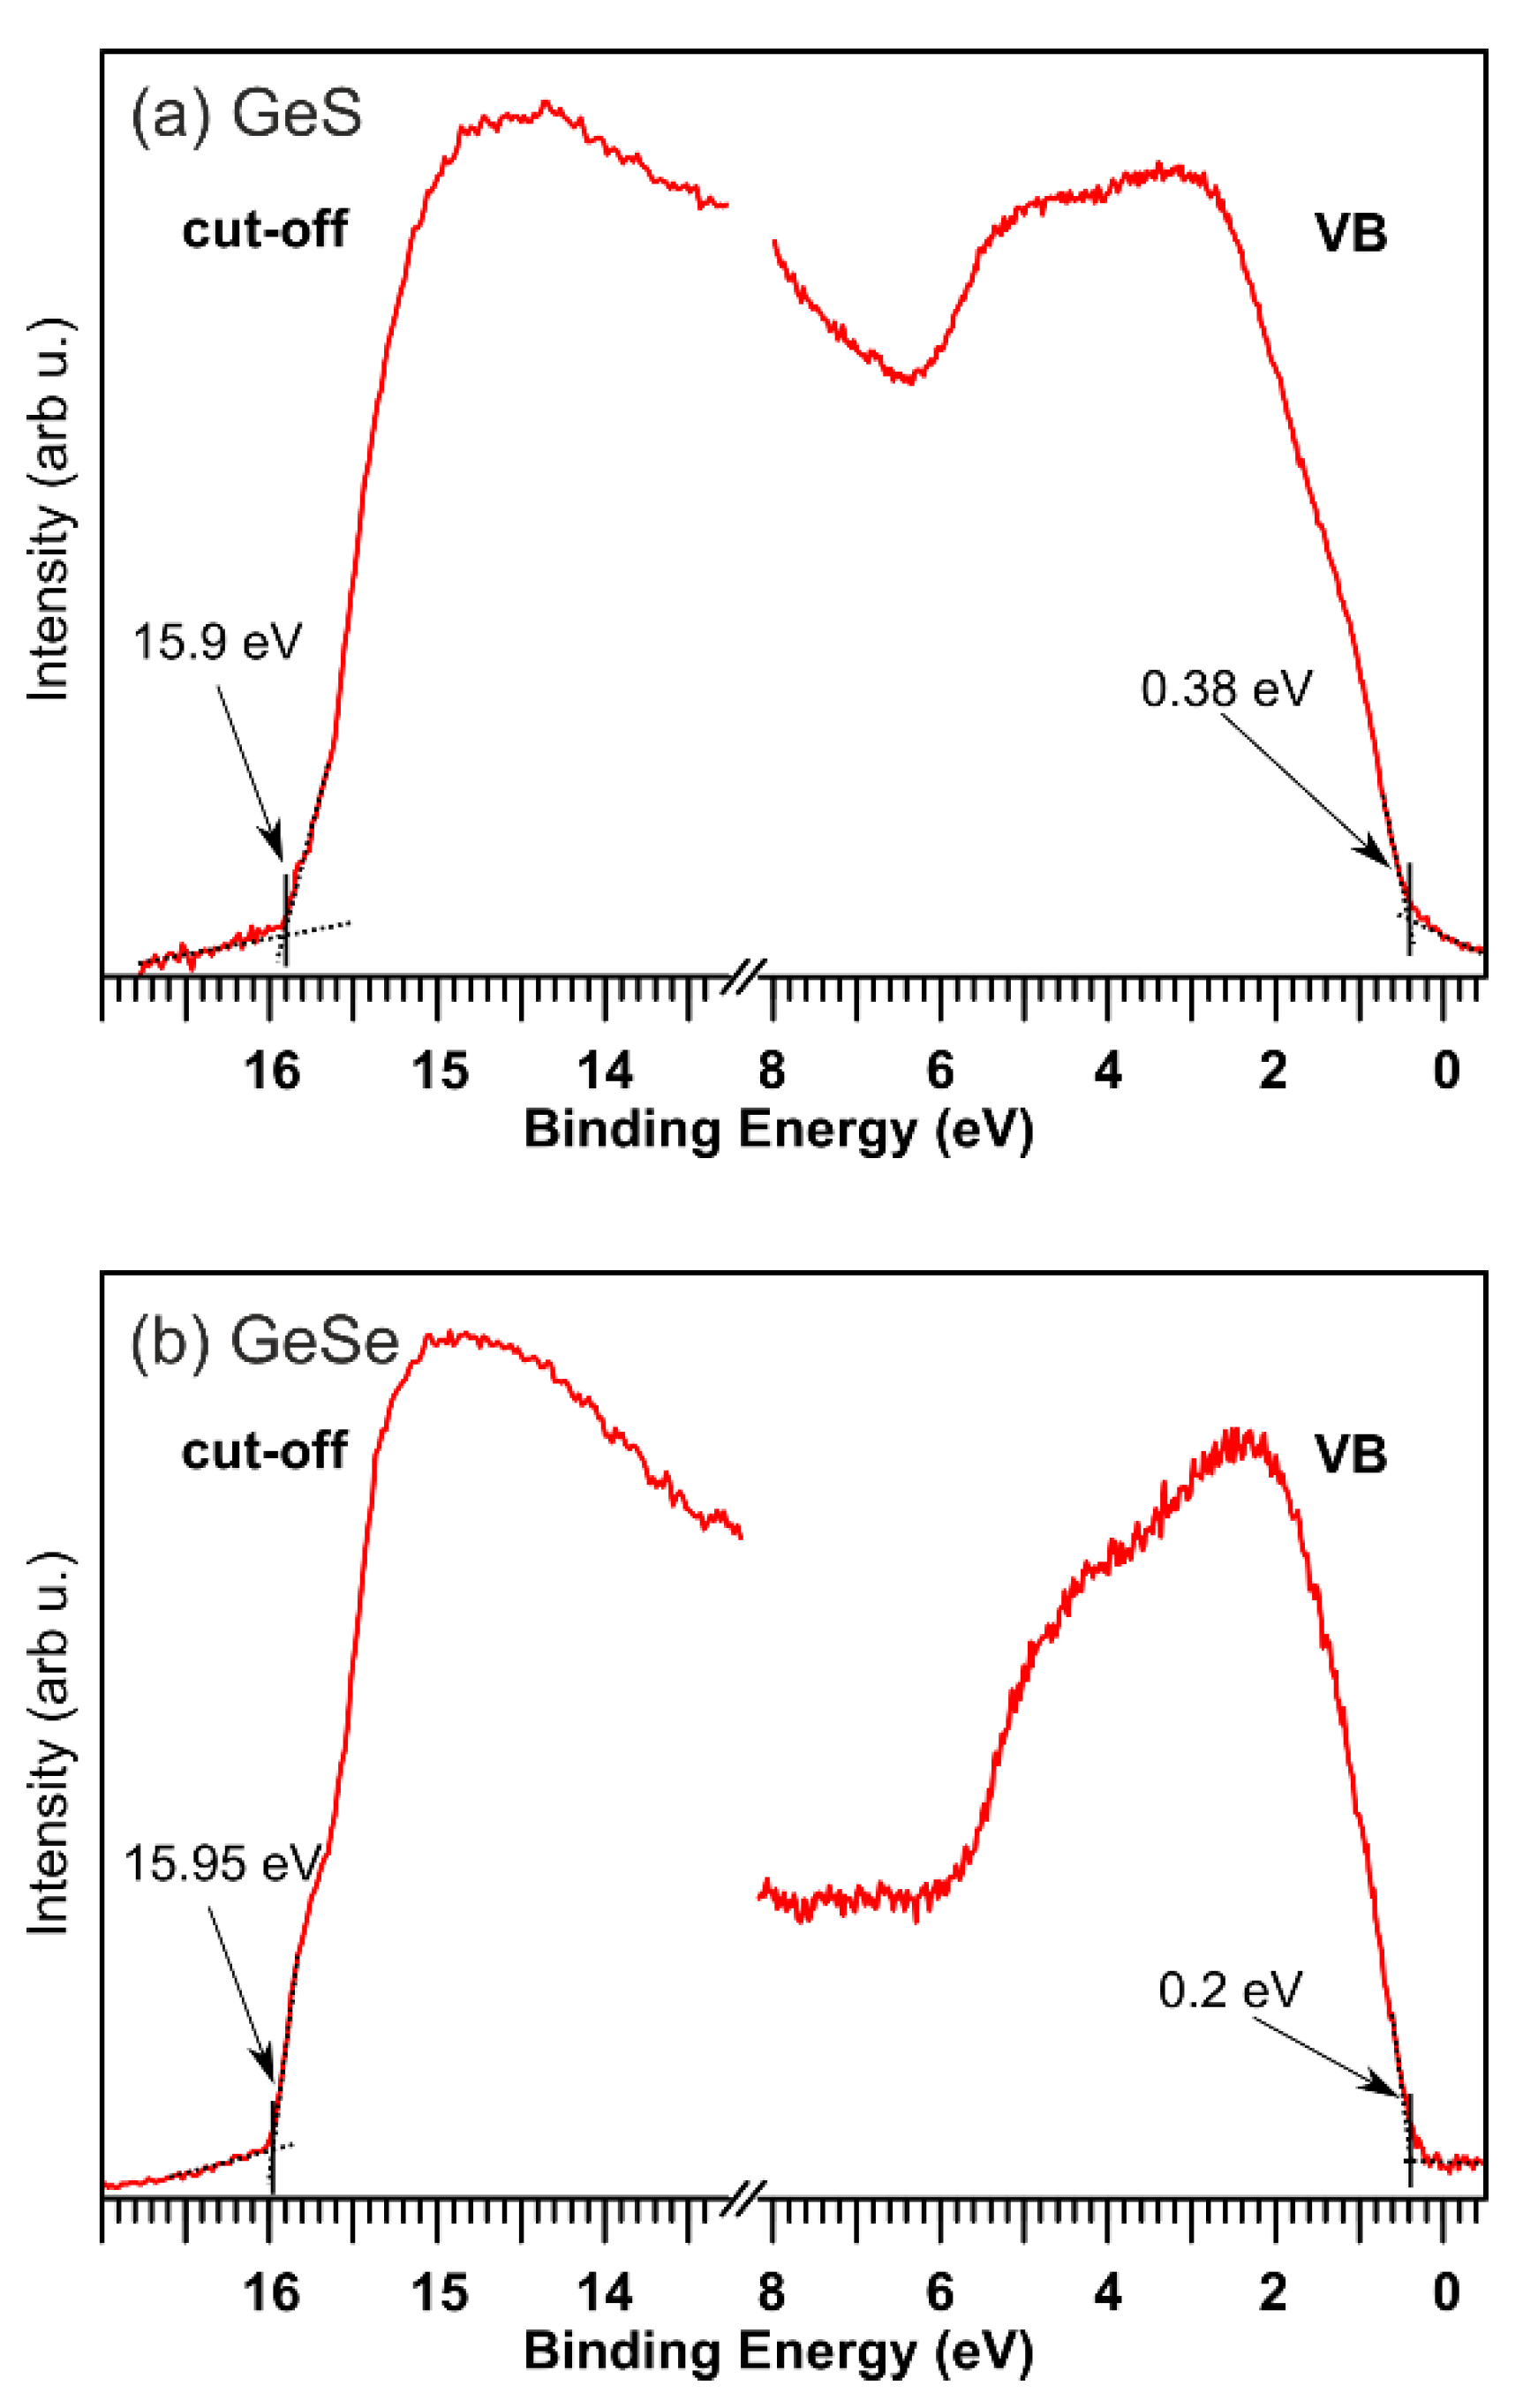
The valence bands measured by UPS for clean GeS and GeSe samples are shown in Figure 4. The shape of the valence band is typical for semiconductors, electron density of states begins below the Fermi level forming a clear valence band edge. According to hybrid DFT calculations reported in Refs. [17,25], Ge 4s and S 3p or Se 4p states have the largest contribution to the valence band. Minor contributions are from Ge 4p, Ge 3d and S 3s or Se 4s orbitals. In the case of GeS (Figure 4a), the VBM energy (EVBM) with respect to the EF is 0.38 eV, as determined from the crossing of the linear fit to the edge of the spectrum with the background. Analogously, for GeSe the VBM is located 0.2 eV below EF. The vicinity of the VBM to EF (considering band gaps of ~1.6 eV and ~1.2 eV of GeS and GeSe, respectively) indicates that both materials are intrinsically p-type semiconductors, which is consistent with Hall effect measurements reported in Ref. [26]. From the high binding energy regions of the spectra the cut-off energy (Ecutoff) can be extracted, allowing to calculate the WF (ϕ) of the sample, given by
ϕ = h v E cutoff ,
where hv = 21.22 eV is the photon energy of He I. The Ecutoff was found from the linear extrapolation of the spectrum threshold and its intersection with the background. The values obtained for GeS and GeSe are E cutoff GeS = 15.90 eV and E cutoff GeSe = 15.95 eV, resulting in the WF of ϕ GeS = 5.32 eV and ϕ GeSe = 5.27 eV. Knowing the VBM position and WF, the ionization energy (EI) can be evaluated from Equation (2),
E I = ϕ + E VBM .
For GeS the IE amounts to 5.70 eV, whereas for GeSe 5.47 eV.
The discussed results are generally in good agreement with previous works, and some minor discrepancies can be easily explained. The observed differences relate mainly the VBM position and are more significant for GeSe. The values of EVBM reported in Ref. [17] are higher (i.e., the VBM is located further from the Fermi level) by 0.08 eV and 0.13 eV for GeS and GeSe, respectively. Such variations may be accounted for by the charging of the sample during exposition to X-ray photon fluxes. The presence of oxygen contamination on the surface may favour this process. Charging of the sample during the measurement leads to spectral shift towards higher binding energies. In our experiment the absence of surface contaminations was confirmed (the contribution from Ge+4 was negligible) and no charging was observed. Although the values of quantities such as the VBM position and WF are affected by charging (when it appears). In the case of IE, which is calculated based on vacuum level relative to the VBM, the binding energy shift cancels out. Therefore, our results of IE investigation for both GeS and GeSe are very well in line with the work [17], despite differences for other parameters.
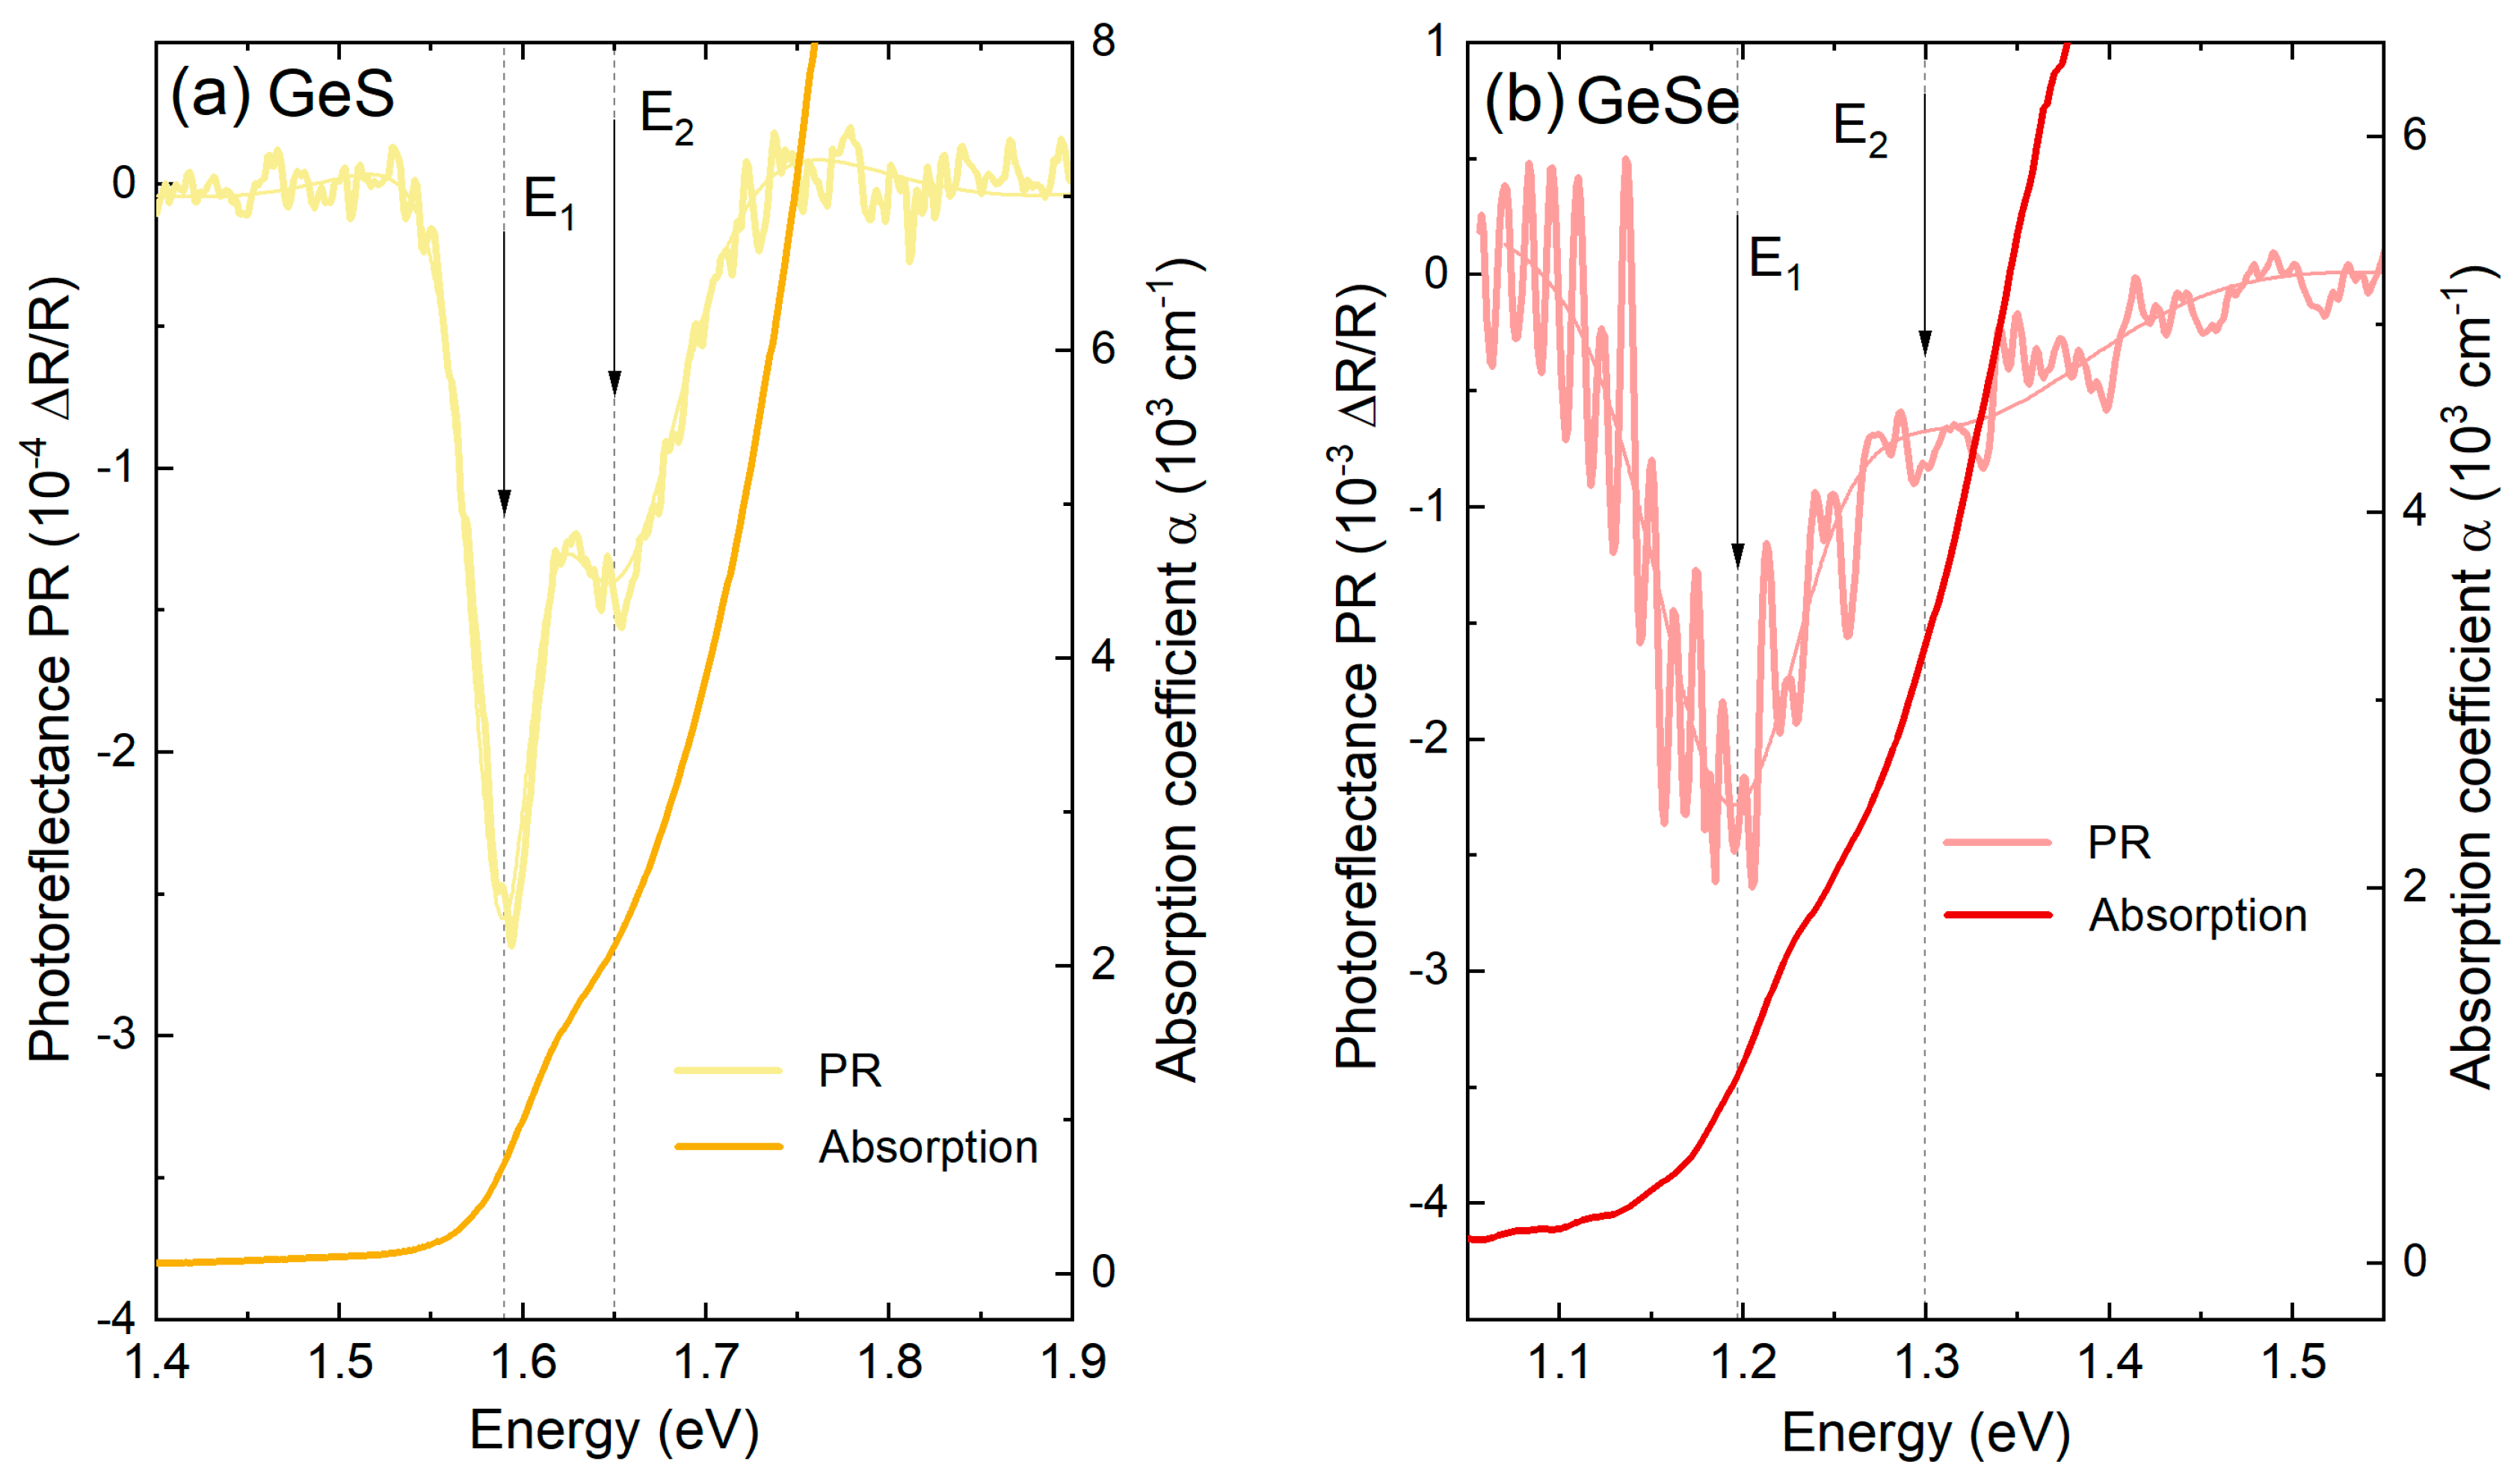
The next step of our study is the determination of EA for GeS and GeSe, for which the electronic band gap width (Eg) is required. In order to define it, two different techniques of optical spectroscopy were used: optical absorption and photoreflectance, which are considered complementary. Optical absorption reveals either direct or indirect absorption edge, corresponding to the fundamental band gap of the material, while PR is only sensitive to direct optical transitions, but aside from the fundamental one, these energetically higher ones as well. PR and absorption coefficient (α) spectra acquired for GeS and GeSe are presented in Figure 5. For both investigated crystals two PR resonances are visible, labelled ‘E1′ and ‘E2′, corresponding to two separate optical transitions (in the case of GeSe E2 is weak at room temperature, although the analysis of the temperature dependence reported previously confirms its presence [5]).
When compared with the optical absorption spectra, it is clear that the position of the absorption edge coincides perfectly with the PR resonance E1, indicating direct type of the associated optical transition. Such interpretation, however, is in disagreement with density functional theory (DFT) calculations of the electronic band structure, predicting an indirect band gap for both materials [6,27,28,29]. The explanation of this discrepancy is simple—while the fundamental band gap of the material is in fact indirect, the lowest direct transition occurs at only slightly higher energy, but is much stronger in the experiment [5,6]. Therefore, despite being the indirect type semiconductors, GeS and GeSe exhibit the optical properties dominated by direct optical transitions, and the width of the optical band gap can be estimated with a good accuracy based on PR and optical absorption measurements. In order to extract the accurate energies of the observed transitions, the Aspnes formula (Equation (3)) was fitted to the experimental data [27].
Δ R R ( ω ) = R e (   C i e i φ i ( ω E i + i Γ i ) m ) ,
where Ci is the amplitude of the i-th PR resonance, φi is the phase, Γi is the broadening and Ei is the energy. The m parameter depends on the type of the transition. The value of m = 2.5 for band-to-band transitions was assumed.
The determined values corresponding to PR resonance E1 were 1.59 ± 0.01 eV and 1.20 ± 0.03 eV for GeS and GeSe, respectively. The energies of the resonance E2 were also calculated in the fitting procedure, resulting in 1.65 ± 0.02 eV for GeS, and 1.30 ± 0.04 eV for GeSe. The uncertainties of the values obtained for GeSe are higher compared to GeS due to larger broadening of the measured PR resonances (explained in Ref. [5]) and worse signal-to-noise ratio. The absorption coefficient spectra were analyzed using the Tauc plot for direct allowed transitions ((αhν)2 vs. hν), yielding the absorption edge energy of 1.58 ± 0.02 eV and 1.19 ± 0.02 eV for GeS and GeSe, respectively.
The electron affinity can be calculated from the equation:
χ = EIEg.
Applying EgGeS = 1.59 eV the electron affinity for the GeS is χGeS = 4.11 eV. Putting EgGeSe = 1.20 eV to Equation (4) the EA for GeSe is χGeSe = 4.27 eV.
The UPS/XPS data along with band gap widths are summarized in Table 1. The determined parameters allow to construct band diagrams for GeS and GeSe crystals as presented in Figure 6, where the electron affinities for both materials refer to the same position of vacuum level.
The conduction and valence band offsets (ΔEC, ΔEV) between the two materials can be calculated at the first approximation from formulas:
ΔEC = χGeS − χGeSe,
ΔEV = EIGeSEIGeSe.
In the case of a real GeS/GeSe structure, a slight interphase dipole may occur due to the filling of the boundary states and should be included in Equations (5) and (6) [30].
The conduction band minima are relatively closely located in both material and the ΔEC is found to be −0.16 eV. The conduction band of GeSe is below the one in GeS. Calculations performed with the indirect band gaps taken from Ref. [31] give the shift of the conduction band equal to −0.15 eV. The ΔEV is 0.23 eV, which means that the valence band of GeSe is above the one in GeS by the value.
The band gap of GeSe lies approximately in the middle of the GeS band gap. The results show that the interface created by these materials will form the heterojunction type I (straddling gap). It suggests that the GeS/GeSe structure has a photovoltaic potential.

4. Conclusions

In the presented experiment we successfully determined the fundamental electronic properties (work function, ionization energy, and electron affinity) of germanium sulfide and germanium selenide. The surface of the investigated samples was confirmed free from oxygen and carbon contaminations, which could affect the obtained results. UV photoelectron spectroscopy has been used to measure the density of states in the valence bands, allowing to determine the work functions (WFGeS = 5.31; WFGeSe = 5.26 eV), valence band maximum positions relative to Fermi level ( E VBM GeS = 0.38 eV; E VBM GeSe = 0.2 eV) and ionization energies (IEGeS = 5.70 eV; IEGeSe = 5.47 eV). Using photoreflectance and optical absorption methods the band gaps were found (EgGeS = 1.59 eV; EgGeSe = 1.20 eV). Electron affinities were defined from the values of vacuum level and positions of conduction band minima (evaluated based on the measured band gaps) and VBM (EAGeS = 4.11 eV; EAGeSe = 4.27 eV). X-ray photoelectron spectroscopy has been used to measure the Ge 3d5/2, S 2p3/2 and Se 3d5/2 core level lines, the position of which are 30.15 eV, 163.2 eV (for GeS), 29.85 eV and 54.15 eV (for GeSe). The Ge 3d5/2 states lie 29.77 eV and 29.65 eV below VBM, respectively, for the GeS and GeSe materials. The data obtained in this report allowed to construct the energy band diagrams for the GeS and GeSe in bulk form. Valence and conduction band offsets are found to be 0.23 eV and 0.16 eV.

Author Contributions

Conceptualization, M.G.; formal analysis, M.G. and A.K.T.; investigation, M.G. and A.K.T.; writing—original draft preparation, M.G.; writing—review and editing, D.M., A.K.T., D.H. and R.K.; visualization, M.G. and A.K.T.; Funding Acquisition, R.K.; Supervision, R.K. All authors have read and agreed to the published version of the manuscript.

Funding

This work was supported by the National Science Centre (NCN) in Poland through OPUS grant no. 2018/29/B/ST7/02135.

Data Availability Statement

Not applicable.

Conflicts of Interest

The authors declare no conflict of interest.

References

  1. Tołłoczko, A.; Oliva, R.; Woźniak, T.; Kopaczek, J.; Scharoch, P.; Kudrawiec, R. Anisotropic optical properties of GeS investigated by optical absorption and photoreflectance. Mater. Adv. 2020, 1, 1886–1894. [Google Scholar] [CrossRef]
  2. Feng, M.; Liu, S.-C.; Hu, L.; Wu, J.; Liu, X.; Xue, D.-J.; Hu, J.-S.; Wan, L.-J. Interfacial Strain Engineering in Wide-Bandgap GeS Thin Films for Photovoltaics. J. Am. Chem. Soc. 2021, 143, 9664–9671. [Google Scholar] [CrossRef] [PubMed]
  3. Kim, Y.; Choi, I.-H. Optical and electrical properties of GeSe and SnSe single crystals. J. Korean Phys. Soc. 2018, 72, 238–242. [Google Scholar] [CrossRef]
  4. Zhao, H.; Mao, Y.; Mao, X.; Shi, X.; Xu, C.; Wang, C.; Zhang, S.; Zhou, D. Band Structure and Photoelectric Characterization of GeSe Monolayers. Adv. Funct. Mater. 2018, 28, 1704855. [Google Scholar] [CrossRef]
  5. Tołłoczko, A.; Zelewski, S.J.; Błaszczak, M.; Woźniak, T.; Siudzińska, A.; Bachmatiuk, A.; Scharoch, P.; Kudrawiec, R. Optical properties of orthorhombic germanium selenide: An anisotropic layered semiconductor promising for optoelectronic applications. J. Mater. Chem. C 2021, 9, 14838–14847. [Google Scholar] [CrossRef]
  6. Murgatroyd, P.A.E.; Smiles, M.J.; Savory, C.N.; Shalvey, T.P.; Swallow, J.E.N.; Fleck, N.; Robertson, C.M.; Jäckel, F.; Alaria, J.; Major, J.D.; et al. GeSe: Optical Spectroscopy and Theoretical Study of a van der Waals Solar Absorber. Chem. Mater. 2022, 30, 3245–3253. [Google Scholar] [CrossRef] [PubMed]
  7. Ding, Y.; Liu, Y.-S.; Yang, G.; Gu, Y.; Fan, Q.; Lu, N.; Zhao, H.; Yu, Y.; Zhang, X.; Huo, X.; et al. High-Performance Ballistic Quantum Transport of Sub-10 nm Monolayer GeS Field-Effect Transistors. ACS Appl. Electron. Mater. 2021, 3, 1151–1161. [Google Scholar] [CrossRef]
  8. Kumar Ulaganathan, R.; Lu, Y.-Y.; Kuo, C.-J.; Reddy Tamalampudi, S.; Sankar, R.; Moorthy Boopathi, K.; Anand, A.; Yadav, K.; Jesus Mathew, R.; Liu, C.-R.; et al. High photosensitivity and broad spectral response of multi-layered germanium sulfide transistors. Nanoscale 2016, 8, 2284–2292. [Google Scholar] [CrossRef] [PubMed]
  9. Li, H.; Wang, Q.; Liu, F.; Lu, J. Lifting on-state currents for GeS-based tunneling field-effect transistors with electrode optimization. Appl. Surf. Sci. 2022, 602, 154297. [Google Scholar] [CrossRef]
  10. Liu, S.-C.; Yang, Y.; Li, Z.; Xue, D.-J.; Hu, J.-S. GeSe thin-film solar cells. Mater. Chem. Front. 2020, 4, 775–787. [Google Scholar] [CrossRef]
  11. Ramasamy, P.; Kwak, D.; Lim, D.-H.; Ra, H.-S.; Lee, J.-S. Solution synthesis of GeS and GeSe nanosheets for high-sensitivity photodetectors. J. Mater. Chem. C 2016, 4, 479–485. [Google Scholar] [CrossRef]
  12. Vaughn, D.D.; Patel, R.J.; Hickner, M.A.; Schaak, R.E. Single-Crystal Colloidal Nanosheets of GeS and GeSe. J. Am. Chem. Soc. 2010, 132, 15170–15172. [Google Scholar] [CrossRef] [PubMed]
  13. Shalvoy, R.B.; Fisher, G.B.; Stiles, P.J. Bond ionicity and structural stability of some average-valence-five materials studied by x-ray photoemission. Phys. Rev. B 1977, 15, 1680–1697. [Google Scholar] [CrossRef]
  14. Ueno, T. X-ray Photoelectron and Anger Electron Spectroscopic Studies of Chemical Shifts in Amorphous Ge–Se System. Jpn. J. Appl. Phys. 1983, 22, 1349. [Google Scholar] [CrossRef]
  15. Wei, Y.; He, J.; Zhang, Q.; Liu, C.; Wang, A.; Li, H.; Zhai, T. Synthesis and investigation of layered GeS as a promising large capacity anode with low voltage and high efficiency in full-cell Li-ion batteries. Mater. Chem. Front. 2017, 1, 1607–1614. [Google Scholar] [CrossRef]
  16. Lam, D.; Chen, K.-S.; Kang, J.; Liu, X.; Hersam, M.C. Anhydrous Liquid-Phase Exfoliation of Pristine Electrochemically Active GeS Nanosheets. Chem. Mater. 2018, 30, 2245–2250. [Google Scholar] [CrossRef]
  17. Smiles, M.J.; Skelton, J.M.; Shiel, H.; Jones, L.A.H.; Swallow, J.E.N.; Edwards, H.J.; Murgatroyd, P.A.E.; Featherstone, T.J.; Thakur, P.K.; Lee, T.-L.; et al. Ge 4s2 lone pairs and band alignments in GeS and GeSe for photovoltaics. J. Mater. Chem. A 2021, 9, 22440–22452. [Google Scholar] [CrossRef]
  18. Xue, D.-J.; Liu, S.-C.; Dai, C.-M.; Chen, S.; He, C.; Zhao, L.; Hu, J.-S.; Wan, L.-J. GeSe Thin-Film Solar Cells Fabricated by Self-Regulated Rapid Thermal Sublimation. J. Am. Chem. Soc. 2017, 8, 958–965. [Google Scholar] [CrossRef]
  19. Hou, G.-J.; Wang, D.-L.; Ali, R.; Zhou, Y.-R.; Zhu, Z.-G.; Su, G. CH3NH3PbI3/GeSe Bilayer Heterojunction Solar Cell with High Performance. arXiv 2017, arXiv:1712.01369. Available online: http://arxiv.org/abs/1712.01369 (accessed on 28 July 2022). [CrossRef] [Green Version]
  20. Hosokawa, S.; Hari, Y.; Kouchi, T.; Ono, I.; Sato, H.; Taniguchi, M.; Hiraya, A.; Takata, Y.; Kosugi, N.; Watanabe, M. Electronic structures and local atomic configurations in amorphous GeSe and GeTe. J. Phys. Condens. Matter 1998, 10, 1931–1950. [Google Scholar] [CrossRef]
  21. Greczynski, G.; Hultman, L. C 1s Peak of Adventitious Carbon Aligns to the Vacuum Level: Dire Consequences for Material’s Bonding Assignment by Photoelectron Spectroscopy. ChemPhysChem 2017, 18, 1507–1512. [Google Scholar] [CrossRef] [PubMed] [Green Version]
  22. Greczynski, G.; Hultman, L. X-ray photoelectron spectroscopy: Towards reliable binding energy referencing. Prog. Mater. Sci. 2020, 107, 100591. [Google Scholar] [CrossRef]
  23. Greczynski, G.; Hultman, L. Reliable determination of chemical state in x-ray photoelectron spectroscopy based on sample-work-function referencing to adventitious carbon: Resolving the myth of apparent constant binding energy of the C 1s peak. Appl. Surf. Sci. 2018, 451, 99–103. [Google Scholar] [CrossRef]
  24. Martin, W.C. Energy Levels of Neutral Helium (4He I). J. Phys. Chem. Ref. Data 1973, 2, 257–266. [Google Scholar] [CrossRef] [Green Version]
  25. Liu, S.-C.; Dai, C.-M.; Min, Y.; Hou, Y.; Proppe, A.H.; Zhou, Y.; Chen, C.; Chen, S.; Tang, J.; Xue, D.-J.; et al. An antibonding valence band maximum enables defect-tolerant and stable GeSe photovoltaics. Nat. Commun. 2021, 12, 670. [Google Scholar] [CrossRef] [PubMed]
  26. Solanki, G.K.; Deshpande, M.P.; Agarwal, M.K.; Patel, P.D.; Vaidya, S.N. Thermoelectric power factor measurements in GeSe single crystals grown using different transporting agents. J. Mater. Sci. Lett. 2003, 22, 985–987. [Google Scholar] [CrossRef]
  27. Aspnes, D.E. Third-derivative modulation spectroscopy with low-field electroreflectance. Surf. Sci. 1973, 37, 418–442. [Google Scholar] [CrossRef]
  28. Gomes, L.C.; Carvalho, A. Phosphorene analogues: Isoelectronic two-dimensional group-IV monochalcogenides with orthorhombic structure. Phys. Rev. B 2015, 92, 085406. [Google Scholar] [CrossRef] [Green Version]
  29. Oliva, R.; Woźniak, T.; Dybala, F.; Tołłoczko, A.; Kopaczek, J.; Scharoch, P.; Kudrawiec, R. Valley polarization investigation of GeS under high pressure. Phys. Rev. B 2020, 101, 235205. [Google Scholar] [CrossRef]
  30. Grodzicki, M.; Sito, J.; Lewandków, R.; Mazur, P.; Ciszewski, A. Interfacial Polarization of Thin Alq3, Gaq3, and Erq3 Films on GaN(0001). Materials 2022, 15, 1671. [Google Scholar] [CrossRef]
  31. Zelewski, S.J.; Kudrawiec, R. Photoacoustic and modulated reflectance studies of indirect and direct band gap in van der Waals crystals. Sci. Rep. 2017, 7, 15365. [Google Scholar] [CrossRef] [PubMed]
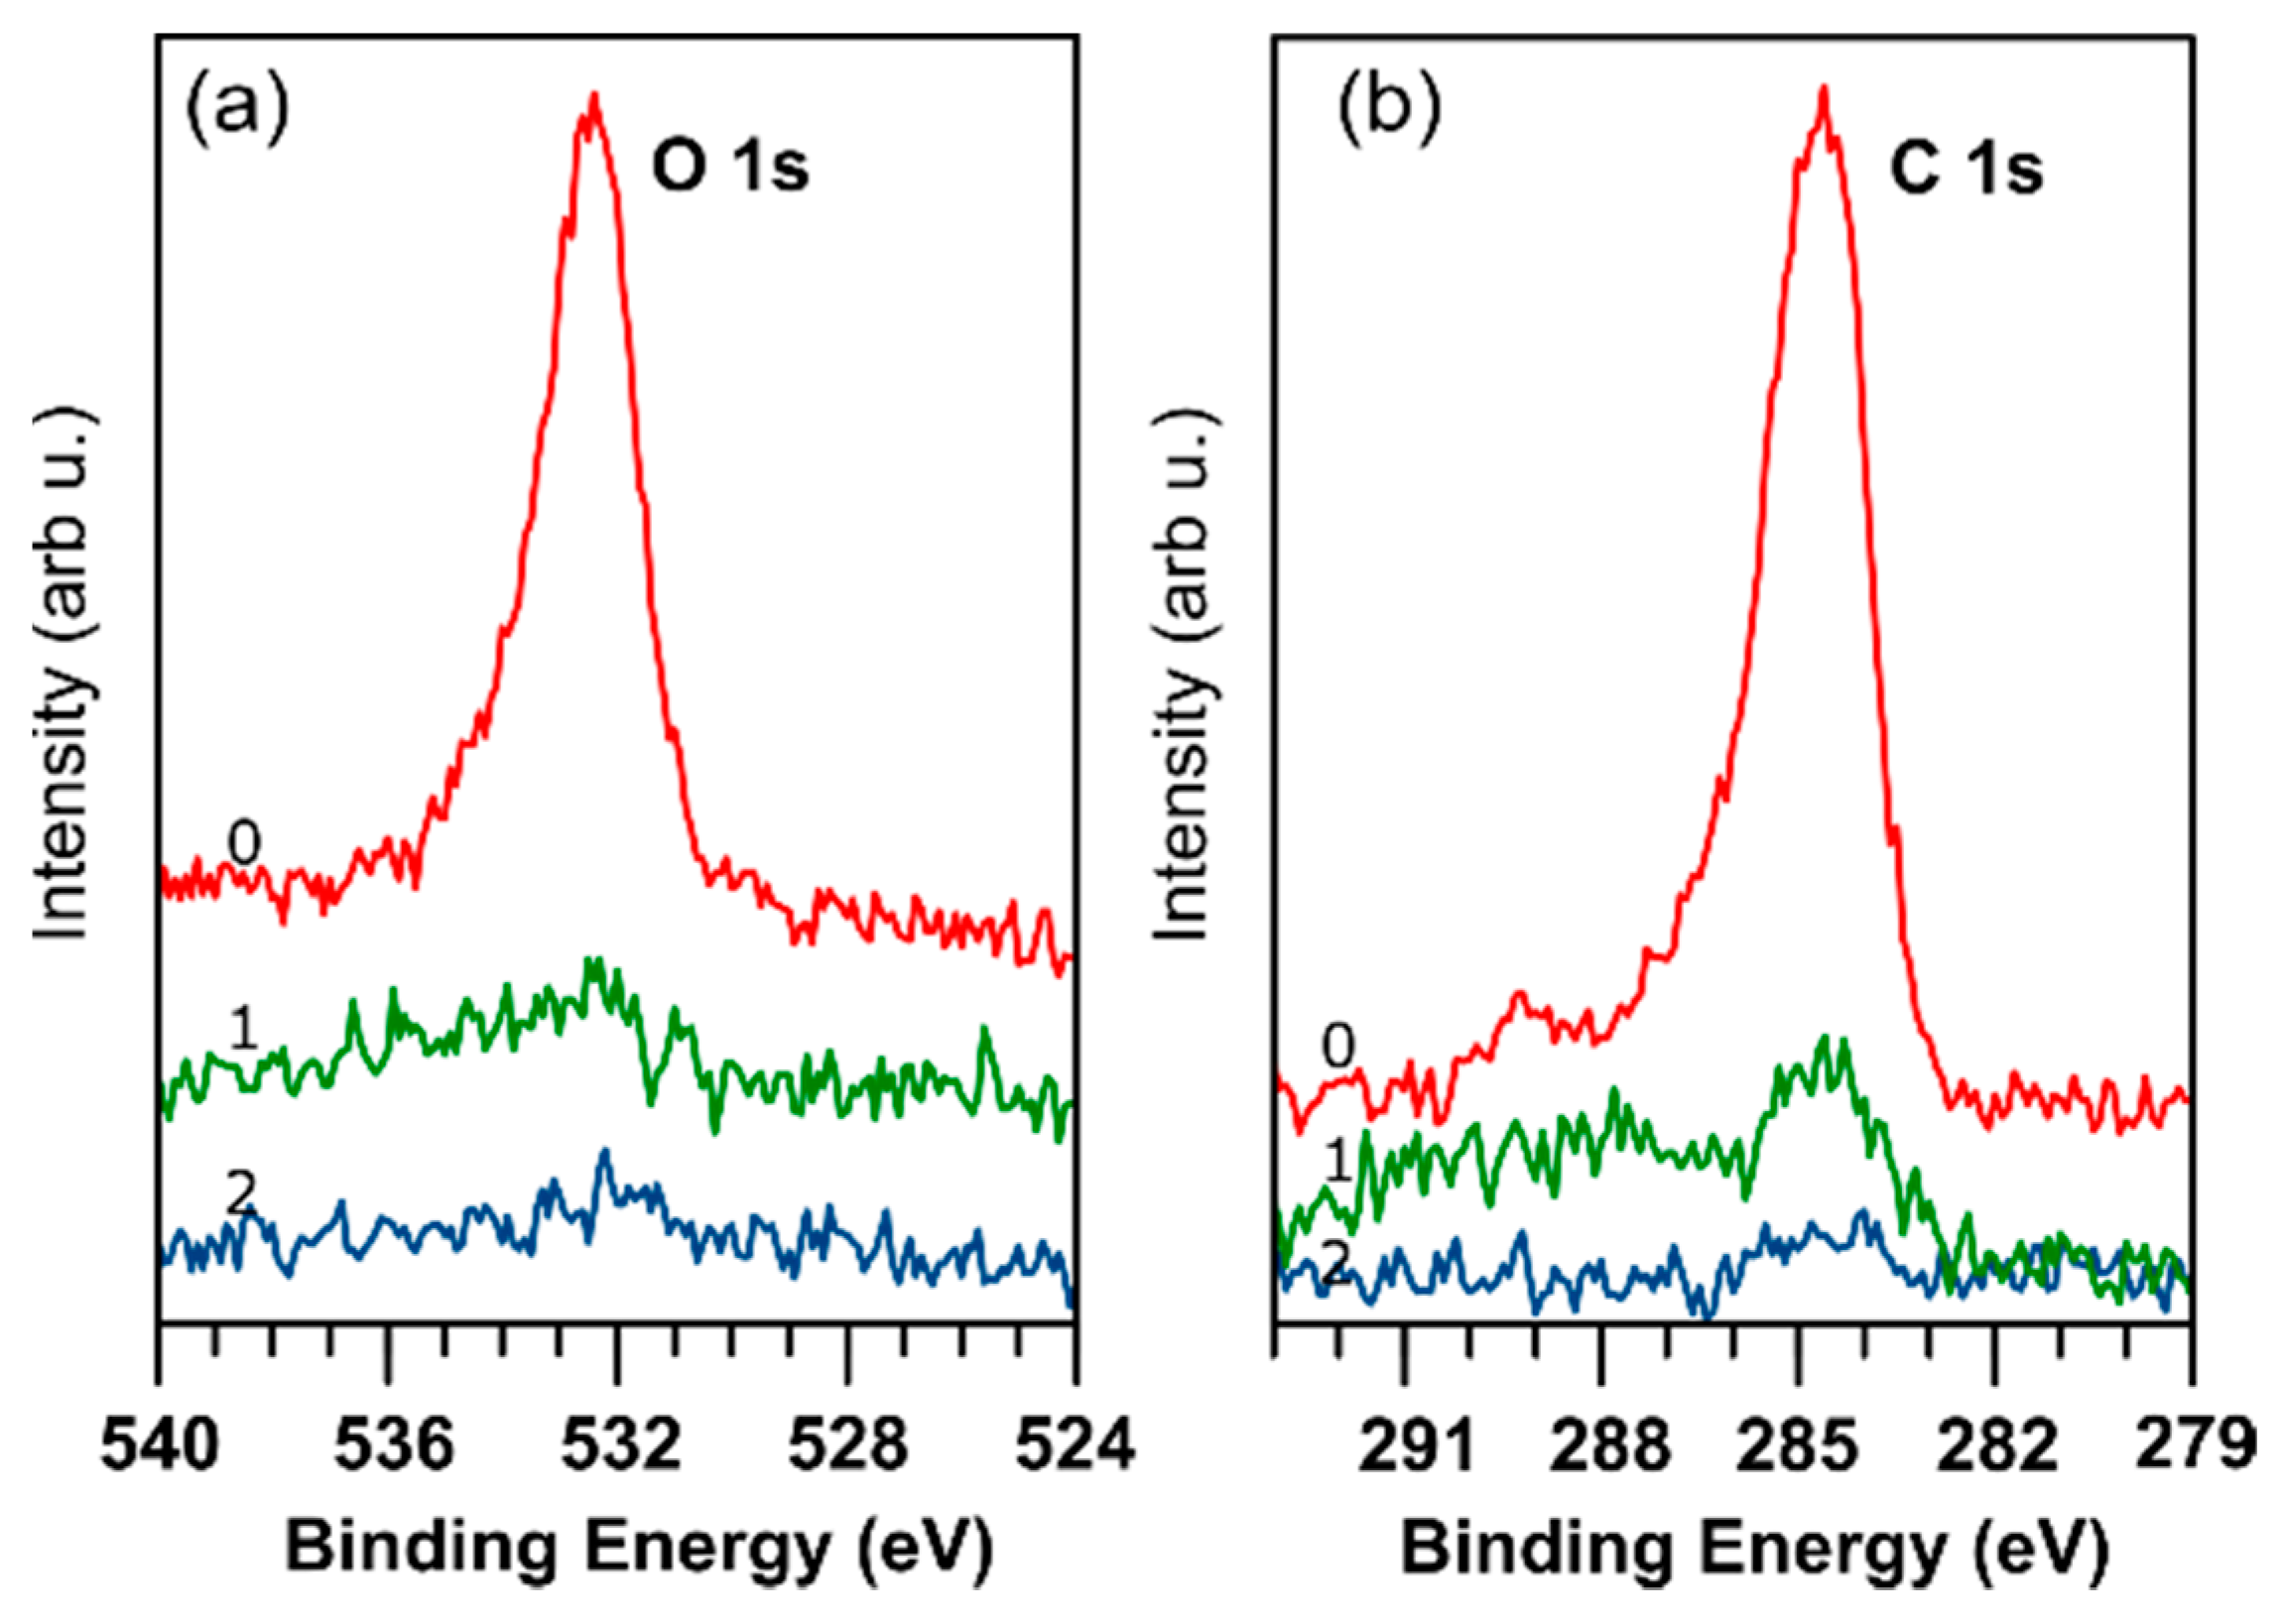
Figure 1. XPS spectra of (a) the O 1s and (b) C 1s for the GeS sample. ‘0′ corresponds to the fresh surface and ‘1′ and ‘2′ to Ar-ion sputtered for 4 and 6 min, respectively.
Crystals 12 01492 g001
Figure 2. XPS spectra of (a) the S 2p and (b) Ge 3d core levels for the GeS sample. Positions of the components for S 2p are 162 eV and 163.2 eV, for Ge 3d are 30.85 eV, 30.15 eV and an extra at 32.35 eV coming from GeS2 compound formed at the surface.
Crystals 12 01492 g002aCrystals 12 01492 g002b
Figure 3. XPS spectra of (a) the Se 2p and (b) Ge 3d core levels for the GeSe sample. Positions of the components for Se 3d are 55.5 eV and 54.15 eV, for Ge 3d are 30.5 eV and 29.85 eV.
Crystals 12 01492 g003
Figure 4. UPS spectra of (a) GeS and (b) GeSe measured using He I photons (hv = 21.22 eV). The secondary electron cut-off energy (Ecutoff) and valence band maximum position (EVBM) are labelled in the figure.
Crystals 12 01492 g004
Figure 5. Photoreflectance and optical absorption spectra of (a) GeS and (b) GeSe. Thin solid lines over the PR plots are the curves resulting from fitting with Aspnes formula (Equation (3)). Vertical arrows mark the energies of the optical transitions E1 and E2, determined from PR spectra.
Crystals 12 01492 g005
Figure 6. Band energy diagrams for GeS and GeSe samples. The valence and conduction band offsets are 0.16 eV and 0.23 eV, respectively. Abbreviations: VL—vacuum level; CB—position of conduction band minimum; VB—position of valence band maximum.
Crystals 12 01492 g006
Table 1. Basic electronic properties and main core level line positions for GeS and GeSe.
EVBM (eV)ϕ (eV)χ (eV)EI (eV)EB (eV)Ge 3d5/2 (eV)S 2p3/2 (eV)Se 3d5/2 (eV)
GeS0.385.324.115.701.5930.15162-
GeSe0.205.274.275.471.2029.85-54.15
Publisher’s Note: MDPI stays neutral with regard to jurisdictional claims in published maps and institutional affiliations.