Abstract
Due to the high cost and low accuracy of high-temperature tests, the viscosity data for multicomponent slag systems is difficult to be obtained precisely. Therefore, it is important to fulfill the viscosity database of the multicomponent slag systems via reasonable methods with lower costs. In this study, a viscosity prediction method based on the machine learning method was proposed for the CaO-SiO2-FeO-Al2O3-P2O5 quinary slag system. To provide valid data for the machine learning model, the viscosity predicted by the molecular dynamic method and multiple semi-empirical models were compared to verify the applicability of these methods to the slag system. Different machine learning models were also developed. The results showed that the prediction results from the gradient boosting decision tree method were the most accurate for the CaO-SiO2-FeO-Al2O3-P2O5 quinary slag system. Based on this method, a color-map concerning the numerical effect of Al2O3 and P2O5 contents and slag viscosity is provided, which also provides assistance for the composition engineering to fulfill a certain demand on the viscosity design.
1. Introduction
Slag is widely applied in the ironmaking and steelmaking process for steel purification. Many scholars are studying the online modification of hot steel slag [1] to obtain slag with practical application effects by adjusting its physical phase and microstructure [2,3]. Among all the slag properties, viscosity is one of the most important properties concerning the smelting performances of the slag. The slag viscosity determines the fluidity of the slag, the speed of mass transfer in the slag, the effect of slag–steel separation, and the metal yield. Wang [4] investigated the changes in the CaO-SiO2-Al2O3-MgO-FetO-P2O5 slag system caused by the composition change of P2O5 and FetO by Raman spectroscopy, Fourier transform infrared reflection, nuclear magnetic resonance, and viscosity measurements, reporting that P5+ copolymerizes with [SiO4]. Therefore, the increase in P2O5 leads to an increase in polymerization degree and viscosity. Wang [5] also claimed that the slag polymerization and the viscosity of the CaO-SiO2-Al2O3-MgO-FeO slag system increase with the increase in Al2O3 content based on Raman and magic angle spinning nuclear magnetic resonance.
However, the experiments still have limitations. Besides the difficulties to conduct experiments at such a high temperature, the instrumentation, fluid state, and homogeneity can all contribute to errors in the experimental results. Seshadri et al. [6] suggested that the most effective way to confirm viscosity is to repeat the experiment on two devices with overlapping shear rate ranges but with different modes of operation. As components in the slag system increase and the temperature rises, less experimental data are available. To numerically analyze the influencing factors on the slag viscosity, many researchers have developed reasonable models based on the limited amount of experimental data to predict viscosity over a wide range of components.
Bouhadja et al. [7] used the reverse non-equilibrium molecular dynamics (RNEMD) method to calculate the shear viscosity of (CaO–Al2O3)1–x(SiO2)x liquid melts in calcium aluminosilicate glass system. Santhy et al. [8] revealed the relationship between the network character and viscosity of silicates that the viscosity decreases with increasing O/Si ratio. Tang et al. [9] established a model based on the effect of different oxides on the polymerization of slags, which was built according to the NBO/T model proposed by Mills [10] for estimating the viscosity of silica-aluminate melt and has a good prediction for CaO-SiO2-MgO-Al2O3-R2O system slag. However, the data coverage of the semi-empirical viscosity model is still limited.
With the development of computing power, machine learning (ML) provides a practical way to analyze complex data relationships. In contrast to physical models, ML models provide satisfying data extensibility. Jiang et al. [11] performed a PCA-KNN model for the prediction of blast furnace slag viscosity based on a large number of experimental data, which also showed accuracy in terms of data sets containing temperature and alkalinity information. Saigo et al. [12] proposed Einstein–Roscoe regression (ERR) regression, which employs a Gaussian process-based migration learning framework to improve the accuracy of high-temperature slag viscosity datasets using auxiliary measurement regression parameter estimates provided at a balanced reasonable cost. Cai et al. [13] proposed a Kriging interpolation geometric model with the introduction of an oxide property weight correction for multi-system slag viscosity prediction with less error than the empirical model and can be extended to the continuous physicochemical properties of multi-component slags. Huang et al. [14] automatically predicted the viscosity of the slag by an innovative two-stage predictive modeling approach and demonstrated its effectiveness on a collected unbalanced data set. A two-equation model with a six-order polynomial combined with the Arrhenius formula was developed accordingly.
In this study, the ML viscosity prediction model was developed based on CaO-SiO2-FeO-(P2O5)-(Al2O3) slag. Molecular dynamics (MD) simulations of the slag system were firstly carried out in order to investigate the influence of different compositions of P2O5 and Al2O3 in the structure of the slag system. The viscosity of the slag was predicted by the RNEMD method to investigate the correlation between the slag structure properties and the physical properties. Several semi-empirical models were also adopted for viscosity prediction. The results were compared based on the Pearson correlation coefficient with the contents of P2O5 and Al2O3. ML model was further developed for viscosity prediction of the CaO-SiO2-FeO-(P2O5)-(Al2O3) slag system. The results of the study can provide a theoretical basis for subsequent studies of CaO-SiO2-FeO-(Al2O3)-(P2O5) slag systems with specific compositions.
2. Calculation Methods
2.1. Model Construction and Parameter Selection
The simulation system was established based on the CaO-SiO2-FeO-(P2O5)-(Al2O3) slag system. The basicity of CaO/SiO2 was fixed at 1.5. The FeO content was fixed at 30%. The absolute temperature was kept at 1873 K. The mass fraction of Al2O3 and P2O5 in the slag system varied in the range of Al2O3: 0–30%; P2O5: 0–30%. A total of 64 sets of simulations were conducted. The Al2O3 and P2O5 contents in each set of simulations and the corresponding case names are shown in Figure 1. Detailed compositions and density of different slag systems can be referred to in Table S1.
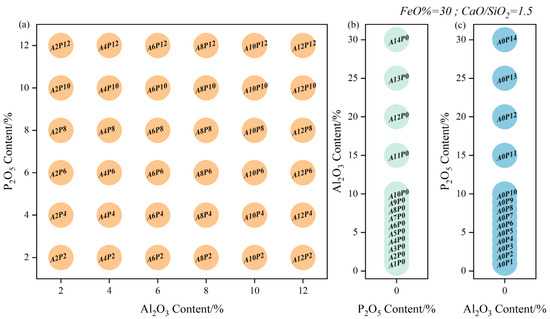
Figure 1.
The Al2O3 and P2O5 contents in each set of simulations and the corresponding case names: (a) CaO-SiO2-FeO-Al2O3-P2O5 slag system (AP model); (b) CaO-SiO2-FeO-Al2O3 slag system (A model); (c) CaO-SiO2-FeO -P2O5 slag system (P model).
In this study, a cubic box of approximately 5000 atoms was built. The size of the box was determined by Equations (1) and (2).
where ω(MO)% is the mass fraction of the oxide composition in the slag, T is the actual temperature of the system, and ρslag is the density of slag melt, g/cm3.
The Born–Mayer–Huggins interatomic potential function and Lennard–Jones two-body potential function were adopted in the present simulations. These two potential functions have been widely used in silicate systems and showed good results [15,16,17]. The functions are shown in Equations (3) and (4), and the parameters are shown in Table 1.
where Uij(r) is the interatomic pair potential, qi,qj is the ionic charge, rij is the inter-ion distance, Evdw describes the van der Waals force interactions, Dij is the well depth, and xij is van der Waals bond length.

Table 1.
The potential function parameters used in this calculation [15,16,17].
The simulation process was carried out with the melt quenching method. In the beginning, each sample was relaxed for 150 ps at 5000 K in a regular system synthesis (NVT), followed by a cooling rate of 1013 K/s to 1873 K in 312.7 ps. Data were collected in a holding time of 1873 K for more than 0.3 ns. All the MD simulations were performed using the Large-scale Atomic/Molecular Massively Parallel Simulator (LAMMPS) package [18]. The integration time step was set to 1 fs with a cut-off value of 10 Å for short-range interactions and a cut-off value of 10 Å for Coulomb interactions. Finally, the radial distribution functions, coordination numbers, atomic structure, and viscosity were analyzed with the software VMD (1.9.3, University of Illinois at Urbana-Champaign, USA, open access), Ovito (basic, 3.5.4, Germany, open access), and ISAACS (V2.1, Central Michigan University, USA, open access) [19,20,21].
2.2. RDF and CN Calculations
The radial distribution function (RDF) is usually determined by calculating the distance between all particle pairs and binning them into a histogram. The histogram is then normalized to the ideal gas. The expression is shown in Equation (5). In the RDF value curve, the first extreme value is the distance between the atom and its neighbors. The area under the extreme value curve is calculated as the coordination number (CN), with the expression in Equation (6).
where N/V is the number density of particles within dr, n(r,Δr) is the average number of other atoms around the central atom, r0 is the rightmost position starting at r = 0 where g(r) is approximately zero, and r1 is the first minimal value.
2.3. Viscosity Calculation Method
The viscosity of a fluid is commonly known as a measure of the internal friction that impedes the flow of the fluid. In MD studies, the calculation of viscosity is essential for the analysis of fluid transport properties and thermal properties.
Muller-Plathe [22] proposed a method to calculate shear viscosity in terms of RNEMD, which was achieved by exchanging momentum and artificially constructing the shear field; the formulas are shown in Equations (7) and (8). The velocity gradient and shear rate can be obtained from the simulation accordingly. This method has been applied to many fields, such as nanofluids, for the calculation of thermally conductive viscosity [23,24]. In this simulation, the RNEMD method was also adopted to calculate the viscosity of different slag systems. During the calculation, the two ends were fixed, and the system was sliced along the Z-axis. 50 slices were cut. The momentum components at the center and both sides were exchanged to construct the velocity gradient and form the shear field to calculate the viscosity. The schematic diagram is shown in Figure 2. During the calculation, the slag was considered as a liquid state. The solid fraction was not introduced in the model, which may cause some inaccuracies.
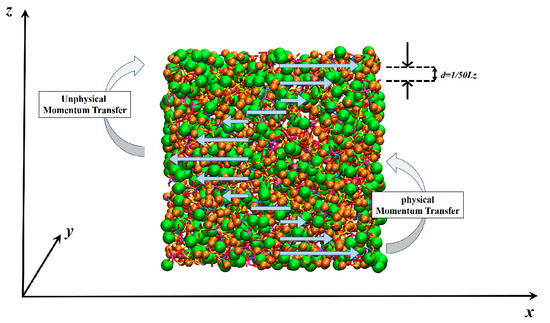
Figure 2.
Schematic diagram of shear viscosity calculated by RNEMD method.
Moreover, the viscosities of different slag systems in a full liquid state were also predicted by several semi-empirical models, including the NPL model [25], Urbain model [26,27], and Kondratiev and Jak model [28]. The predicted results were compared with those from RNEMD methods. The relation between the structure of different slag systems and the predicted viscosities was further analyzed for the applicability assessment of these perdition methods in terms of the slag systems in this study.
2.4. Machine Learning (ML) Methods
In this paper, four ML methods, namely artificial neural network (ANN) [29], random forest (RF) [30], Support Vector Machine (SVM) [31], and gradient boosting decision tree (GBDT) [32] were used based on the MATLAB toolbox to calculate the corresponding properties of the models for prediction. ANN is an information processing system that mimics the structure and function of neural networks in the human brain by simulating neuronal activity with a mathematical model. ANN usually shows better performance for fuzzy systems [33]. RF is an integrated algorithm consisting of decision trees. RF achieves the prediction of properties by building a large number of decision trees to form a forest. SVM performs non-linear classification by a kernel method and uses a hinge loss function to calculate empirical risk. A regular term to optimize structure risk in the solution system is usually added in this method. GBDT consists of multiple decision trees and accumulates the conclusions of all trees as the final result. GBDT performs well on low-dimensional and non-linear data. In this study, the P2O5 and Al2O3 contents were used as independent variables. The viscosity calculated by Urbain’s method was used as the target variable. The optimal ML model is evaluated by Root Mean Squared Error (RMSE).
3. Results and Discussion
3.1. Slag Structure Analysis
In the basic CaO-SiO2-FeO converter slag system, the Si4+ in the system acts as a network-former and has a strong adsorption capacity for surrounding oxygen atoms due to its high charge and small radius. Si atoms can combine with O and form σ-bonds. When the p-orbitals of oxygen atoms are filled, the dx-pπ bonds can be formed with the d-orbitals of Si, thus enhancing the Si-O bonds. These characteristics lead that silicate structures are easy to form large irregular short-range ordered aggregates. A certain proportion of P2O5 and Al2O3 exhibit similar properties when brought into the system. The increase in these compositions helps increase the degree of the system polymerization. Figure 3 shows the structures of CaO-SiO2-FeO-Al2O3 (A model), CaO-SiO2-FeO-P2O5 (P model), and CaO-SiO2-FeO-Al2O3-P2O5 (AP model). The [SiO4], [AlO4], and [PO4] tetrahedral structures of O combined with Si4+, Al3+, and P5+ are present in Figure 3a–c, respectively, as the main body of the grid structure. While Ca2+ and Fe2+ in the slag exist as free states in the interstices of the structure.
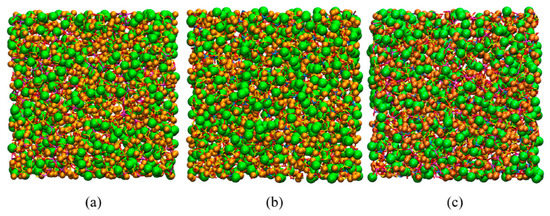
Figure 3.
Atomic distribution of the AP model. Ca (orange), Fe (green), O (red), Al (pink), P (blue), and Si (yellow): (a) CaO-SiO2-FeO-Al2O3 model; (b) CaO-SiO2-FeO-P2O5 model; (c) CaO-SiO2-FeO-Al2O3-P2O5 model.
Figures S1–S3 show the RDFs and CNs of the main atomic pairs in the P model, A model, and AP model, respectively. Based on the RDF curves and characteristic positions of the different models, the detailed bond lengths are shown in Table S2. The bond lengths barely change with the slag compositions. There are no obvious coordination plateaus in the CN curves of Ca-O and Fe-O. While the CNs of Si-O all remain around 4, indicating that the tetrahedral structure of Si-O is quite stable, as shown in Table S3. The coordination plateau of P-O is also stable and constant at 4. The CNs of Al-O have a tendency to increase, indicating that with the increase in Al content, Al3+ and O2- have a tendency to form an octahedral structure with a coordination of 6.
3.2. Oxygen Network Structure Analysis
The variation of different oxygen types for the A model and the P model is shown in Figure 4. In the A model, with the increase in Al2O3 content, the content of bridging oxygen increases, and the content of non-bridging oxygen and free oxygen decreases. When Al2O3 content is less than 10%, OA-type non-bridging oxygen increases rapidly, and AOA-type bridging oxygen grows slowly. When Al2O3 content exceeds 10%, the growth rate of SOA-type bridging oxygen slows down, and AOA-type bridging oxygen increases rapidly. The OA-type non-bridging oxygen increases more slowly when the Al2O3 content is above 20%. In the P model, the increase in P2O5 content led to an increase in PO-type non-bridging oxygen and SOP-type bridging oxygen content in the slag. The FO in the slag system decreased under the aggregation caused by P2O5. Based on the approximate relationship between the content of bridging oxygen proposed by Diao [15] and the local structure changes in this simulation, which are shown in Equations (9)–(11), the Si-O-P connection is more stable than SOS and POP at higher P2O5 content. The growth rate of AOA is greater than the growth rate of SOA with the increase in Al2O3 content when the Al2O3 content is greater than 10% due to the influence of Si in the slag.
P-O-P+ Si-O-Si→2(Si-O-P)
Al-O-Al+ Si-O-Si→2(Al-O-Si)
P-O-P+ Al-O-Al→2(P-O-Al)
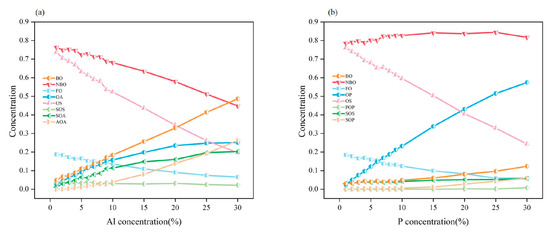
Figure 4.
Various O-type in A model and P model: (a) A model; (b) P model (BO: bridge oxygen; NBO: nonbridging oxygen; FO: free oxygen; OP: O-P type NBO; OS: O-Si type NBO; OA: O-Al type NBO; POP: P-O-P type BO; SOS: Si-O-Si type BO; AOA: Al-O-Al type BO; SOA: Si-O-Al type BO; SOP: Si-O-P type BO; AOP: Al-O-P type BO).
Figure 5 shows the changing trends of BO, FO, and NBO in the AP model. For the BO content, when the Al2O3 content is fixed, the BO content barely increases with the increase in P2O5 content. When the P2O5 content is fixed, the BO content increases significantly with the increase in Al2O3 content. For the NBO content, when the Al2O3 content, the increase in P2O5 content impels the NBO content to increase slightly. When the Al2O3 content is fixed, the content of NBO decreases as the content of Al2O3 increases. Some of the NBOs transfer to BO with the assistance of Al3+. For the FO content, the increase in both Al2O3 and P2O5 content decreases the FO content in the slag. The covariances between the different oxygen types and the content of Al2O3 and P2O5 were analyzed. The results are shown in Table 2. There is a strong positive correlation of Al2O3 with BO but a strong negative correlation with NBO. The Al2O3 and P2O5 contents also showed the same negative correlation for FO.

Figure 5.
Various O-type in AP models: (a) BO; (b) NBO; (c) FO.

Table 2.
Analysis of covariances for different types and components of oxygen.
Figure 6 shows the effects of Al2O3 and P2O5 on different types of NBO and BO in the slag. For the NBO, the content of OP increases with the increase in P2O5 content. The increase in Al2O3 content hardly affects the content of OP. The increase in Al2O3 content leads to the increase in OA content, but the increase in P2O5 content slightly decreases the content of OA. Combined with the changing trend of BO, it can be obtained that when the P2O5 content increases, the P atom combines with OA to form POA-type bridging oxygen. The depolymerization effect of Ca2+ and Fe2+ on the structure of AOA [34] also results in a higher OA content at low P content and high Al content in the slag. The increases in Al and P content also have the same reducing effect on the OS content. These OS structures will polymerize into structures such as SOA and SOP accordingly. As for BO, POP hardly appears. The AOA content increases with the increase in Al content. The AOA structure can be influenced by the depolymerization effect of Ca2+ and Fe2+, while the P2O5 content barely affects the AOA structure. In the slag system with low Al and high P contents, the SOS-type BO is easier to be formed. While high Al and low P content reduce the SOS content on the other hand. The POS-type bridging oxygen is only observed in the slag system with higher P2O5 content. When the Al content increases, Al content promotes the production of POS-type BO. The POA-type BO exists in the slag system with high Al and P contents. The SOA-type BO increases with the increase in Al content. Figure 7 shows the reaction mechanism of the oxygen network structures under the effects of P and Al atoms.
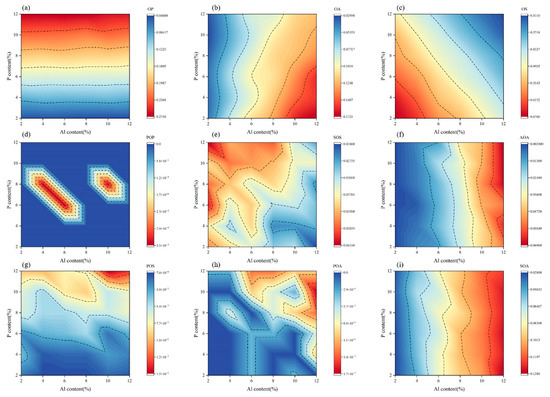
Figure 6.
Various NBO and BO in AP models: (a) OP; (b) OA; (c) OS; (d) POP; (e) SOS; (f) AOA; (g) POS; (h) POA; (i) SOA.
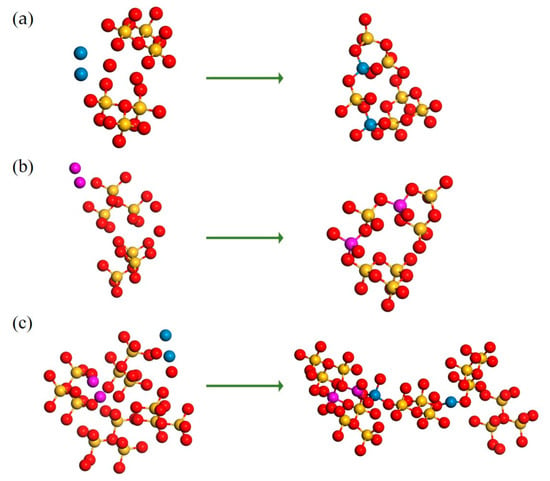
Figure 7.
Schematic diagram of the reaction principle of the polymerization process Ca (orange), Fe (green), O (red), Al (pink), P (blue), Si (yellow): (a) Formula (9); (b) Formula (10); (c) Formula (11).
3.3. Distribution of Bond Angles
Figure 8 and Figure 9 show the bond angle distributions in the [SiO4], [PO4], and [AlO4] structures at 1873 K for the A model, P model, and AP model. In A model and P model, it can be seen that the bond angles of O-Si-O are around 109.0–109.1°, which is close to the standard tetrahedral structure of 109.5°. The bond angles of O-P-O fluctuate in the range of 109–116°. The bond angle of O-Al-O stabilizes after the Al content becomes larger and forms a stable structure. In the AP models, both O-P-O and O-Si-O bond angles are more stable and close to the ideal tetrahedral structure bond angles. The O-Al-O bond angles fluctuate in the range of 102°–113°. Combined with the analysis of oxygen types in the previous section, it can be seen that the presence of both P and Al will affect the degree of polymerization to some extent. However, these two atoms have little effect on the bond angles of O-P-O, O-Al-O, and O-Si-O.
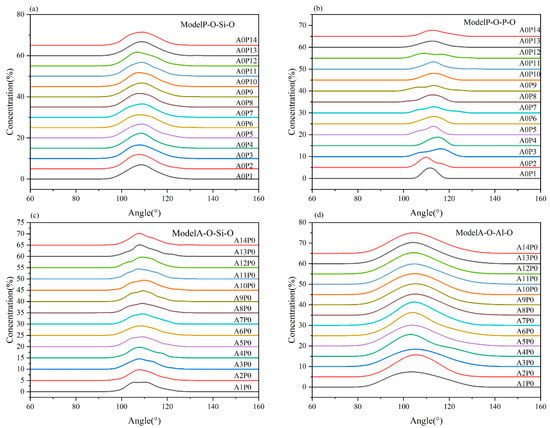
Figure 8.
Bond angle distributions in A model and P model: (a) P model O-Si-O; (b) P model O-P-O; (c) A model O-Si-O; (d) A model O-Al-O.

Figure 9.
Bond angle distributions in AP model: (a) AP model O-Si-O; (b) AP model O-P-O; (c) AP model O-Al-O.
3.4. Viscosity Prediction with MD Models and Semi-Empirical Models
The Viscosity prediction results with the NPL model [25], Urbain model [26,27], Kondratiev, and Jak model [28] were used and analyzed along with RNEMD simulation results, which are shown in Figure 10.
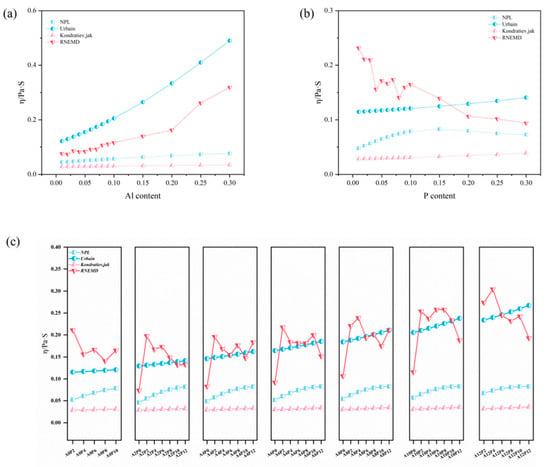
Figure 10.
Viscosity changes of different element content under different models: (a) A model; (b) P model; (c) AP model.
It can be found that the viscosity of the slag increases with the increase in P content and Al content. Based on the NBO/T theory proposed by Mills [10], the amount of non-bridging oxygen possessed by a single polymer particle contributes significantly to the variation of viscosity. The increase in the Al and P content leads to a decrease in NBO/T, which also increases the slag polymerization and the viscosity.
Due to the absence of experimental data in the slag system in this study, it is difficult to measure the applicability of these semi-empirical models and the RNEMD method on the CaO-SiO2-FeO-(P2O5)-(Al2O3) slag systems. Considering that the positive relationship between the BO number and the contents of Al2O3 and P2O5 has been confirmed by existing studies [4,5], the Pearson correlation coefficient between BO number and the contents of Al2O3 and P2O5 was introduced for the applicability assessment of these models of the viscosity prediction, which is shown in Figure 11. Based on Table 2, the covariances between BO and the contents of Al2O3 and P2O5 have provided proof that the positive relationship between BO and Al2O3 is stronger than that between BO and P2O5. Hence, the positive value of Pearson correlation coefficients of Al2O3 should be larger than that of P2O5. Only the viscosities predicted by Urbain’s model are in accord with these inferences. Other viscosity prediction models and RNEMD methods are not suitable for the viscosity prediction of the slag system in this study. Therefore, Urbain’s model is determined to be the most applicable for the viscosity prediction of the slag system in this study. The predicted viscosity data of Urbain’s model was also adopted in the ML models developed in the following section.
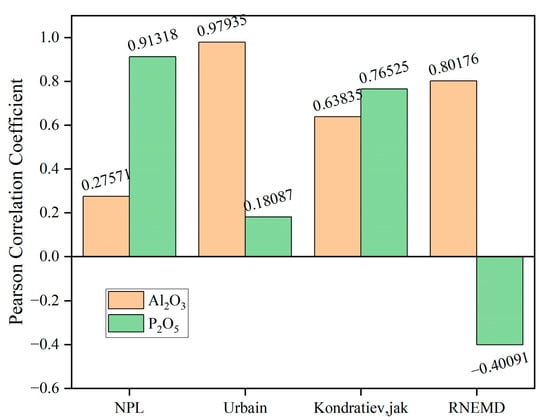
Figure 11.
Pearson correlation coefficients between different model viscosities and Al2O3 and P2O5 contents.
3.5. ML Model Development for Viscosity Prediction
To improve the accuracy of viscosity prediction by the ML models, different ML models were developed in this section, including ANN, RF, SVM, and GBDT. Before performing the prediction, the different model parameters were optimized for implementation. ANN used two hidden layers with a maximum of 100 iterations and a tolerance of 0.01. RF used 20 decision trees with several bins of 32. GBDT used a loss function with squared error and 20 decision trees with a convergence tolerance of 0.1. SVM normalized the data with a regularization parameter is 0.01, and a polynomial kernel function is used with a kernel parameter p of 1. The prediction results of different ML models are shown in Figure 12. The values of RMSE between Urbain model data and the prediction results for each ML model were calculated accordingly, which is shown in Table 3.
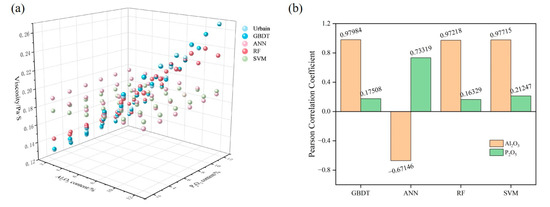
Figure 12.
Machine learning results: (a) Prediction results of viscosity by different ML models; (b) Pearson correlation coefficient of Al2O3, P2O5, and viscosity.

Table 3.
RMSE of different ML models.
According to the values of RMSE in Table 3, GBDT and ANN have the best and worst predictive power for the viscosity prediction of the slag system in this study, respectively. To further prove this conclusion, the Pearson correlation coefficients of viscosity perdition results from the four ML models were also calculated, which is shown in Figure 12b. Both Al2O3 and P2O5 contents appear positively correlated with viscosity when we adopted the GBDT predictor. While in the prediction results of the ANN model, the Al2O3 content appears to have a negative correlation with viscosity, which is contrary to the rules provided by the semi-empirical models.
Based on the ML model with GBDT methods, a color-map concerning the numerical effect of Al2O3 and P2O5 contents and slag viscosity is provided in Figure 13a. The blue color represents the smaller value of viscosity. The red color represents the larger value of viscosity. The iso-viscosity lines with a viscosity of 0.15Pa·s, 0.175Pa·s, 0.2Pa·s, 0.225Pa·s, and 0.25 Pa·s were also extracted in Figure 13b. According to this figure, the slag viscosity of the CaO-SiO2-FeO-Al2O3-P2O5 slag system in terms of different Al2O3 and P2O5 contents can be predicted and it could also be used for composition engineering to fulfill a certain demand on the viscosity design.
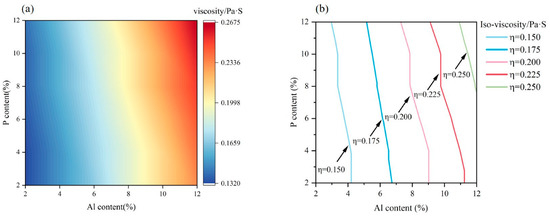
Figure 13.
Viscosity results from GBDT learning: (a) distribution of viscosity values obtained by GBDT; (b) iso-viscosities of GBDT results.
4. Conclusions
- (1)
- With the increase in the mass fraction of Al2O3 and P2O5, the concentration of BO increases, and the concentration of FO decreases, which complicates the melt structure of the slag system and increases the polymerization degree.
- (2)
- In the CaO-SiO2-FeO-Al2O3-P2O5 slag system, the content of BO was positively correlated with the content of Al2O3 and P2O5. The positive correlation was stronger for the content of Al2O3.
- (3)
- Different semi-empirical models and RNEMD methods were used to predict the viscosity of the three slag systems. The reliability of the Urbain model in predicting the viscosity of the CaO-SiO2-FeO-Al2O3-P2O5 slag system has been proved according to the Pearson correlation coefficient analysis.
- (4)
- Among all the ML methods in this study, GBDT has the best predictive power for the viscosity prediction of the slag system in this study, building a credible correlation between the structure of the CaO-SiO2-FeO-Al2O3-P2O5 slag system and viscosity prediction. Iso-viscosity lines of the CaO-SiO2-FeO-Al2O3-P2O5 slag system were provided accordingly.
Supplementary Materials
The following supporting information can be downloaded at: https://www.mdpi.com/article/10.3390/cryst12101338/s1, Figure S1: Radial distribution function and coordination numbers of the major atomic pairs in the P models; Figure S2: Radial distribution function and coordination numbers of the major atomic pairs in the A models; Figure S3: Radial distribution function and coordination numbers of the main atomic pairs in the AP models; Table S1: Component content of different CaO-SiO2-FeO-(P2O5)-(Al2O3) slag systems; Table S2: Bond lengths of major atom pairs for different models; Table S3: The coordination number of each major atomic pair for different models.
Author Contributions
Investigation, Z.L. (Ziyu Lyu), C.G. and Z.L. (Ziyang Lyu); methodology, C.G.; data curation, Z.L. (Ziyang Lyu); writing-original draft preparation, Z.L. (Ziyu Lyu); writing-review and editing, Z.L. (Ziyu Lyu) and C.G.; supervision, C.G. and Y.B.; funding acquisition, Y.B. All authors have read and agreed to the published version of the manuscript.
Funding
This work was financially supported by the Fundamental Research Funds for the Central Universities (No. FRF-TP-20-026A1), the special grade of China Postdoctoral Science Foundation (No. 2021T140050), and the State Key Laboratory of Advanced Metallurgy Foundation of China (No. 41621014).
Institutional Review Board Statement
Not applicable.
Informed Consent Statement
Not applicable.
Data Availability Statement
The data presented in this study are available on request from the corresponding author. The data are not publicly available due to further studies are on-going.
Conflicts of Interest
The authors declare no conflict of interest. The funders had no role in the design of the study; in the collection, analyses, or interpretation of data; in the writing of the manuscript, or in the decision to publish the results.
References
- Tseng, Y.; Weng, T.; Lee, Y. Hot Slag Modification of BOF Slag for Preventing its Disintegration to Enhance Slag Utilization. China Steel Tech. Rep. 2019, 32, 39–43. [Google Scholar]
- Jing, W.; Jiang, J.; Ding, S.; Duan, P. Hydration and microstructure of steel slag as cementitious material and fine aggregate in mortar. Molecules 2020, 25, 4456. [Google Scholar] [CrossRef] [PubMed]
- Wang, Z. Investigations on Physical and Chemical Properties of P-Bearing Steelmaking Slags during the Selective Enrichment Process of Phosphorus. Ph.D. Thesis, University of Science and Technology Beijing, Beijing, China, 1 June 2017. [Google Scholar]
- Wang, Z.; Shu, Q.; Sridhar, S.; Zhang, M.; Guo, M.; Zhang, Z. Effect of P2O5 and FetO on the viscosity and slag structure in steelmaking slags. Metall. Mater. Trans. B 2015, 46, 758–765. [Google Scholar] [CrossRef]
- Wang, Z.; Sun, Y.; Sridhar, S.; Zhang, M.; Guo, M.; Zhang, Z. Effect of Al2O3 on the viscosity and structure of CaO-SiO2-MgO-Al2O3-FetO slags. Metall. Mater. Trans. B 2015, 46, 537–541. [Google Scholar] [CrossRef]
- Seetharaman, S.; Mukai, K.; Sichen, D. Viscosities of slags—An overview. Steel Res. Int. 2005, 76, 267–278. [Google Scholar] [CrossRef]
- Bouhadja, M.; Jakse, N.; Pasturel, A. Stokes–Einstein violation and fragility in calcium aluminosilicate glass formers: A molecular dynamics study. Mol. Simul. 2014, 40, 251–259. [Google Scholar] [CrossRef]
- Santhy, K.; Sowmya, T.; Sankaranarayanan, S.R. Effect of oxygen to silicon ratio on the viscosity of metallurgical slags. ISIJ Int. 2005, 45, 1014–1018. [Google Scholar] [CrossRef]
- Xulong, T.; Min, G.; Xidong, W.; Zuotai, Z.; Mei, Z. Estimation model of viscosity based on modified (NBO/T) ratio. Chin. J. Eng. 2010, 32, 1542–1546. [Google Scholar] [CrossRef]
- Mills, K.C. The influence of structure on the physico-chemical properties of slags. ISIJ Int. 1993, 33, 148–155. [Google Scholar] [CrossRef]
- Jiang, D.; Zhang, J.; Wang, Z.; Feng, C.; Jiao, K.; Xu, R. A prediction model of blast furnace slag viscosity based on principal component analysis and K-nearest neighbor regression. JOM 2020, 72, 3908–3916. [Google Scholar] [CrossRef]
- Saigo, H.; Kc, D.B.; Saito, N. Einstein–Roscoe regression for the slag viscosity prediction problem in steelmaking. Sci. Rep. 2022, 12, 6541. [Google Scholar] [CrossRef] [PubMed]
- Cai, P.; Luan, J.; Liu, J.; Li, C.; Yu, Z.; Zhang, J.; Chou, K. A modified method for calculating the viscosity of multicomponent slags based on Kriging interpolation. Ceram. Int. 2022, 48, 21844–21852. [Google Scholar] [CrossRef]
- Huang, A.; Huo, Y.; Yang, J.; Gu, H.; Li, G. Computational modeling and prediction on viscosity of slags by big data mining. Minerals 2020, 10, 257. [Google Scholar] [CrossRef]
- Diao, J.; Ke, Z.; Jiang, L.; Zhang, Z.; Zhang, T.; Xie, B. Structural Properties of Molten CaO–SiO2–P2O5–FeO System. High Temp. Mater. Processes 2017, 36, 871–876. [Google Scholar] [CrossRef]
- Wu, T.; Wang, Q.; Yu, C.F.; He, S.P. Structural and viscosity properties of CaO-SiO2-Al2O3-FeO slags based on molecular dynamic simulation. J. NonCryst. Solids 2016, 450, 23–31. [Google Scholar] [CrossRef]
- Rappé, A.K.; Casewit, C.J.; Colwell, K.; Goddard, W.A., III; Skiff, W.M. UFF, a full periodic table force field for molecular mechanics and molecular dynamics simulations. J. Am. Chem. Soc. 1992, 114, 10024–10035. [Google Scholar] [CrossRef]
- Thompson, A.P.; Aktulga, H.M.; Berger, R.; Bolintineanu, D.S.; Brown, W.M.; Crozier, P.S.; in’t Veld, P.J.; Kohlmeyer, A.; Moore, S.G.; Nguyen, T.D.; et al. LAMMPS—A flexible simulation tool for particle-based materials modeling at the atomic, meso, and continuum scales. Comput. Phys. Commun. 2022, 271, 108171. [Google Scholar] [CrossRef]
- Stukowski, A. Visualization and analysis of atomistic simulation data with OVITO—The Open Visualization Tool. Model. Simul. Mater. Sci. Eng. 2009, 18, 015012. [Google Scholar] [CrossRef]
- Le Roux, S.; Petkov, V. ISAACS—Interactive structure analysis of amorphous and crystalline systems. J. Appl. Crystallogr. 2010, 43, 181–185. [Google Scholar] [CrossRef]
- Humphrey, W.; Dalke, A.; Schulten, K. VMD: Visual molecular dynamics. J. Mol. Graph. 1996, 14, 33–38. [Google Scholar] [CrossRef]
- Müller, P.F. Reversing the perturbation in nonequilibrium molecular dynamics: An easy way to calculate the shear viscosity of fluids. Phys. Rev. E 1999, 59, 4894. [Google Scholar] [CrossRef] [PubMed]
- Chen, J.; Han, K.; Wang, S.; Li, M.; Chen, J.; Ma, M. Study on thermal conductive enhancement mechanism of nanofluid based on anti-disturbance non-equilibrium molecular dynamics. CIESC J. 2019, 70, 2147–2152. [Google Scholar]
- Jiang, C.; Li, K.; Zhang, J.; Qin, Q.; Liu, Z.; Liang, W.; Sun, M.; Wang, Z. Molecular dynamics simulation on the effect of MgO/Al2O3 ratio on structure and properties of blast furnace slag under different basicity conditions. Metall. Mater. Trans. B 2019, 50, 367–375. [Google Scholar] [CrossRef]
- Mills, K.; Sridhar, S. Viscosities of ironmaking and steelmaking slags. Ironmak. Steelmak. 1999, 26, 262–268. [Google Scholar] [CrossRef]
- Urbain, G. Viscosity estimation of slags. Steel Res. 1987, 58, 111–116. [Google Scholar] [CrossRef]
- Urbain, G.; Boiret, M. Viscosité des laitiers: Mesures et estimations. Mémoires Et Études Sci. De La Rev. De Métallurgie 1989, 86, 209–214. [Google Scholar]
- Kondratiev, A.; Jak, E. Review of experimental data and modeling of the viscosities of fully liquid slags in the Al2O3-CaO-‘FeO’-SiO2 system. Metall. Mater. Trans. B 2001, 32, 1015–1025. [Google Scholar] [CrossRef]
- Wang, S.-C. Artificial neural network. In Interdisciplinary Computing in Java Programming; Springer: Berlin/Heidelberg, Germany, 2003; pp. 81–100. [Google Scholar]
- Biau, G.; Scornet, E. A random forest guided tour. Test 2016, 25, 197–227. [Google Scholar] [CrossRef]
- Balabin, R.M.; Lomakina, E.I. Support vector machine regression (SVR/LS-SVM)—An alternative to neural networks (ANN) for analytical chemistry? Comparison of nonlinear methods on near infrared (NIR) spectroscopy data. Analyst 2011, 136, 1703–1712. [Google Scholar] [CrossRef]
- Li, Q.; Wu, Z.; Wen, Z.; He, B. Privacy-preserving gradient boosting decision trees. In Proceedings of the AAAI Conference on Artificial Intelligence, Virtually, 22 February–1 March 2022; pp. 784–791. [Google Scholar]
- Mijwel, M.M. Artificial Neural Networks Advantages and Disadvantages. Available online: https://www.researchgate.net/publication/323665827 (accessed on 27 January 2018).
- Ma, S.; Li, K.; Zhang, J.; Jiang, C.; Bi, Z.; Sun, M.; Wang, Z.; Li, H. The effects of CaO and FeO on the structure and properties of aluminosilicate system: A molecular dynamics study. J. Mol. Liq. 2021, 325, 115106. [Google Scholar] [CrossRef]
Publisher’s Note: MDPI stays neutral with regard to jurisdictional claims in published maps and institutional affiliations. |
© 2022 by the authors. Licensee MDPI, Basel, Switzerland. This article is an open access article distributed under the terms and conditions of the Creative Commons Attribution (CC BY) license (https://creativecommons.org/licenses/by/4.0/).