Article

Phase Properties of Different HfO2 Polymorphs: A DFT-Based Study

1
Department of Materials, Environmental Sciences and Urban Planning, Marche Polytechnic University, 60131 Ancona, Italy
2
Information Engineering Department, Marche Polytechnic University, 60131 Ancona, Italy
*
Author to whom correspondence should be addressed.
Crystals 2022, 12(1), 90; https://doi.org/10.3390/cryst12010090
Submission received: 16 November 2021 / Revised: 31 December 2021 / Accepted: 31 December 2021 / Published: 10 January 2022
(This article belongs to the Special Issue Advanced Semiconductor Materials and Devices)

Abstract

:
Background: Hafnium Dioxide (HfO2) represents a hopeful material for gate dielectric thin films in the field of semiconductor integrated circuits. For HfO2, several crystal structures are possible, with different properties which can be difficult to describe in detail from an experimental point of view. In this study, a detailed computational approach has been shown to present a complete analysis of four HfO2 polymorphs, outlining the intrinsic properties of each phase on the basis of atomistic displacements. Methods: Density functional theory (DFT) based methods have been used to accurately describe the chemical physical properties of the polymorphs. Corrective Hubbard (U) semi-empirical terms have been added to exchange correlation energy in order to better reproduce the excited-state properties of HfO2 polymorphs. Results: the monoclinic phase resulted in the lowest cohesive energy, while the orthorhombic showed peculiar properties due to its intrinsic ferroelectric behavior. DFT + U methods showed the different responses of the four polymorphs to an applied field, and the orthorhombic phase was the least likely to undergo point defects as oxygen vacancies. Conclusions: The obtained results give a deeper insight into the differences in excited states phenomena in relation to each specific HfO2 polymorph.
Keywords:
HfO2; DFT; hubbard; energy; defects

Graphical Abstract

1. Introduction

Silicon Dioxide (SiO2) is well known as a desirable gate insulator, but it shows important limits for maintaining reliability when the thickness of the gate insulator becomes a few nanometers. Current leakage in the Complementary Metal Oxide–Semiconductor (CMOS) is significantly large for very thin SiO2 films [1,2]. This leakage represents a serious problem from the viewpoint of the reliability of advanced electronic devices and the loss of electric power of materials. In this optic, the development of next-generation CMOS devices represents a very challenging point in the scaling down of their size. Thanks to its relatively high dielectric constant, large band gap, and good thermal and chemical stabilities, Hafnium Dioxide (HfO2) represents one of the most promising candidates among many high-k materials [3,4].
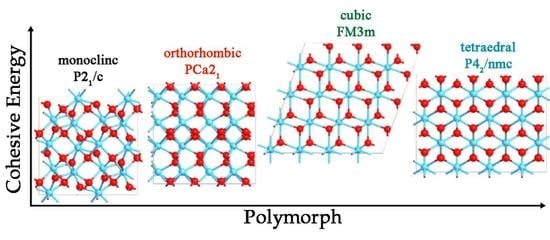
It is known that HfO2 can adopt different crystal structures in the solid state, along with the chemical physical properties depending on them. The monoclinic structure (space group P21/c) (Figure 1A) is known to be the most stable, and its dielectric constant is reported to be about 22 [5]. In the monoclinic phase, oxygen atoms can be either three- or fourfold-coordinated, while the Hf atoms can be seven- or eightfold-coordinated. The orthorhombic phase with the space group of Pca21 (Figure 1B) represents another important metastable HfO2 polymorph; this phase is widely recognized as the most responsible for ferroelectricity behavior [6,7]. On the other hand, higher dielectric constants, reaching about 30 [8,9] have been attributed to other metastable structures, such as the cubic (Fm3m) (Figure 1C) and the tetragonal (P42/nmc) (Figure 1D) examples. In these two phases, oxygen is fourfold coordinated, and the Hf atom is eightfold coordinated.
The correlation between the atomic displacements and the phase properties is of extreme significance to better understand the application of HfO2 in the manufacture of advanced electronic devices. In this work, a massive and detailed investigation of the four different HfO2 polymorphs has been conducted. Different aspects of different crystals, i.e., lattice parameters, cohesive energy, density of states (DOS), optical properties, and the effects of oxygen vacancies have been elucidated for each HfO2 polymorph using different DFT methods based on generalized gradient approximation (GGA) for exchange correlation (xc) energy description [10]. Since the DFT approach is reliable for ground state properties predictions, different studies indicate that the resulting HfO2 band gap obtained by the GGA based DFT approach is about 3.65 eV, smaller than the experimental value of 5.7 eV [11]. This means that correlation effects in HfO2 cannot be ignored; for this reason, a computational strategy able to include the correlation effect with reasonable computational effort is represented by the GGA + U approach, in which the correlation effect is incorporated through on-site Coulomb interaction “U”. This method is based on the inclusion of some corrective terms that confer a qualitative improvement compared with the GGA based DFT approach for excited state properties such as DOS and optical properties [12]. The GGA + U approach allows reproduction of experimental data in a more accurate way with respect to those obtained with the hybrid functional approach, requiring much lower computational costs [13,14].
For the mentioned reasons, the GGA + U method has been employed in this study in combination with the DFT GGA method. With the aim to better describe these strong Coulomb interactions, not only the on-site U for Hf 5d electrons, but also that for O 2p electrons have been considered [15,16]. Typically, the U correction is only applied on the d and f orbitals of metal entities. However, in certain cases the band gap is still underestimated if compared with the experimental result even with high U values. To obtain the ideal band structure, in addition to the d orbitals in transition metals (Ud), a few theoretical studies of the U effect on p orbitals (Up) in oxygen have been discussed and has been shown to be crucial in oxides [17,18]. The choice of U values is not unambiguous. Though this could be extracted from first-principles calculations, it is nontrivial to determine its value a priori. Hence, U is often determined by fitting a specific set of experimental data, such as band gaps and structural properties and, in general, more than one U value can be used [19]. It is known that the hafnium d orbital is too high in energy. On the other hand, the bottom of the conduction band is mainly composed of the oxygen 2p orbitals. It is very important to note that, since the GGA + Up + Ud method aims to correct a localized electron in the d state in a correlated system, adding the parameter Hubbard U in the p-state is also a crucial step. For this reason, in this work Hf Ud and O Up values have been respectively settled using on-site repulsion of 6 eV and 4 eV, respectively, fitting these values to the DFT approach adopted. In this way, the GGA + U formalism leads to an improved description of critical aspects such as electronic properties, as already reported in other studies of metal dioxides [20].
Another important aspect to consider is the generation of point defects and impurities, that strongly affect the physical chemical properties of polymorphs and have a decisive impact on their performance in applications as semiconductor devices. For this reason, defects formation has been considered in this work, and in particular, the DFT + U approach has been used again to identify the effects of oxygen vacancies on the structural and electrical properties of HfO2 polymorphs. The DFT and DFT + U methods have been used to make an exhaustive comparison between the four polymorphs, underlining all possible differences on the basis of the properties of phases. The results obtained have shown a direct correlation between the chemical–physical properties of HfO2 systems and the atomistic positions, suggesting a way to study in detail the properties of different polymorphs to be used for engineering HfO2 based devices. Moreover, a direct comparison between the results obtained with and without the U values has been reported to underline the capabilities and the limits of both methods and the important and powerful combination between them.

2. Materials and Methods

The modelling of all HfO2 polymorphs and all DFT and DFT + U calculations has been performed using the QuantumATK atomic scale modelling platform [21]. The electron basis has been expanded in linear combination using the atomic orbital (LCAO) method for both Hf and O entities, resembling the SIESTA formalism [22]. The Perdew-Burke-Ernzerhof (PBE) GGA density functional has been used for all simulations to estimate the electron exchange-correlation (xc) energy [23]. The ionic cores have been represented by norm-conserving (NC) PseudoDojo pseudopotentials for both Hf and O atoms [24]. For Hf, the 5d2 and 6s2 electrons have been explicitly treated as valence electrons, while the 2s2 and 2p4 electrons were the obvious valence electrons for O atoms. Pseudo-Dojo pseudopotentials are a modern NC type with multipole projectors for each angular momentum, with the aim to ensure high accuracy. Moreover, using this type of NC pseudopotential, the charge density of the electron core has been reproduced within a short-cut-off radius; this aspect is very important, because the xc energy is not linear, so the charge density in the core region could overlap with valence density when U values are included, leading to an underestimation of the xc energy. Correct on-site repulsion values have been calibrated, and the values of 6 eV and 4 eV to Hfd and Op valence electrons, respectively, have been chosen, allowing us to reproduce the bandgap values of HfO2 (Figure 2). All polymorphs have been modelled and periodic boundary condition (PBC) have been used along all axes to avoid problems with boundary effects caused by finite size and to reduce the calculation time, maintaining a high accuracy degree. The energy cut-off has been fixed at 1200 eV and the Brillouin-zone integration has been performed over a 15 × 15 × 15 k-points grid for the m-HfO2, o-HfO2, c-HfO2, and t-HfO2 polymorphs modelled. This set of parameters assure the total energy convergence of 5.0 × 10⁻⁶ eV/atom, the maximum force of 1 × 10⁻² eV/Å, the maximum stress of 2.0 × 10⁻² GPa, and the maximum displacement of 5.0 × 10⁻⁴ Å. The polarization of o-HfO2 has been obtained by the modern theory of polarization [25] and the Berry phase operator method [26].
The DFT-GGA method has been used as first approach to obtain the optimized geometries and to compute the cohesive energy of HfO2 polymorphs. In a second step, the calibrated U values are not indicated for geometry optimization and for cohesive energy calculations because of the explicit inclusion of terms for d electrons for the xc energy, which can underestimate this aspect for ground state phenomena such as those mentioned above. On the other hand, the inclusion of U values in calculation is suitable for the reproduction of excited states phenomena. For this reason, in the first step the canonical DFT approach has been used to compute ground state system properties such as lattice parameters and cohesive energy, and then Ud and Up values have been included [27]. The resulting DOS and optical properties of m, c, o, and t-HfO2 obtained by means of GGA + Ud + Up have been reported. Oxygen vacancies have been explicitly treated for all polymorphs putting two O atoms in the unit cell in a ghost configuration. This approach allows maintenance of the basic functions associated with the atoms selected when removing them to create the vacancies. The formation energy of a defect X in charge state q has been defined as:
Ef = [Xq] = Etot [Xq] − Etot [HfO2] − Σ nimi + qEF+ Ecorr
Etot [Xq] is the total energy derived from a supercell calculation containing the defect X, and Etot [HfO2] is the total energy for the perfect crystal using an equivalent supercell. The integer ni indicates the number of atoms of type i (host atoms or impurity atoms) that have been added to (ni > 0) or removed from (ni < 0) the supercell to form the defect, and the μi are the corresponding chemical potentials of these species. Chemical potentials represent the energy of the reservoirs with which atoms are being exchanged. The analog of the chemical potential for “charge” is given by the chemical potential of the electrons, i.e., the Fermi energy EF. Finally, Ecorr is a correction term that accounts for finite k-point sampling in the case of shallow impurities, or for elastic and/or electrostatic interactions between supercells. All simulations have been carried out using the QuantumATK atomic scale modelling platform.

3. Results

As previously reported, a DFT-GGA approach has been used to calculate the optimal lattice parameters after geometry optimizations and to compute the ground state cohesive energy. The DOS and the electrical properties of the four optimized systems have been investigated using the GGA + Ud + Up approach. The same approach has been used again to model oxygen vacancies, to calculate the defect formation energy, and to compute bandgap structure variations for each HfO2 polymorph.

3.1. Structure Analysis

The space group of m-HfO2 is P21/c, and the optimized values obtained after DFT optimization were 5.068 Å, 5.135 Å, and 5.292 Å for, respectively, a, b, and c vectors of the unit cell (Table 1). The detected distances between Hf and O were 2.27 Å, 2.15 Å, and 2.04 Å. The optimized values o-HfO2 (space group Pca21) of a, b, and c vectors were 5.231 Å, 5.008 Å, and 5.052 Å, respectively, while the detected distances between Hf and O were 2.14 Å and 2.05 Å. The detected value for cubic phase (space group FM3m) was 5.062 Å, and the obtained distance between Hf and O atoms in the cubic phase was 2.2 Å. Finally, for the t-polymorph, (space group P42/nmc) with unit cell consisting of a regular prism with squared basis, the optimized values were in line with the previously described cubic phase, because a = b = 5.062 Å, while c = 5.22 Å (Table 1), and the obtained distances between Hf and O ions were 2.2 Å, as well as in the c-HfO2 phase.
To be sure about the reliability of the DFT-GGA computational method adopted, a direct comparison with experimental data has been performed, and the effects of U values on the optimization of different HfO2 polymorphs have been reported. In all cases, an increase of lattice size of 0.2 Å has been observed, leading to results that deviate from the experimental trend.
The PBE-GGA approach has been used again to compute the cohesive energy of all the HfO2 polymorphs investigated. From the computational evidence the m-HfO2 was the most stable polymorph (−46.98 eV/unit cell) (Figure 2), and o-, and t- HfO2 phases have been found to be low energy systems, with cohesive energy values of −46.64 and −45.76 eV/unit cell, respectively. The c-HfO2 polymorph showed low cohesive energy, with values of −45.51 eV/unit cell.

3.2. Electrical Analysis

The optimized lattice parameters obtained from the DFT-GGA calculation have been used as a starting point to detect the effects of atomistic displacements on the electrical properties of HfO2 polymorphs and then to investigate the effects of oxygen vacancies.
For this purpose, U corrective terms have been included, and a preliminary calibration of the optimal values has been performed. As previously mentioned, the chosen values of 6 eV and 4 eV for Ud and Up terms respectively have been applied, and correct bandgap values [32] have been obtained for all the four polymorphs (Figure 3).
After the calibration, the PBE-GGA + U approach has been used to identify differences in the bandgap values, that have been obtained from partial and total DOS comparing the behavior of the HfO2 investigated phases (Figure 4). For all polymorphs, two features in the valence band have been evidenced. In the m-HfO2 the calculated bandgap value was 5.246 eV. In the o-HfO2 a similar trend with respect to the previous phase has been observed, also considering the Hf and O contributions. The calculated bandgap was 5.627 eV, and a different trend has been detected for the c-HfO2; two parts in the conduction band have been found, the first from 2.783 to 4.189 eV, the second starting from 5.538 eV. The resulted band gap value was 4.753 eV. A similar trend in Hf and O contributions has been observed for t-HfO2, but very different values in bandgap have been detected. The lower part of the conduction band was between 2.827 eV to 4.216 eV, while the upper one started from 5.462 eV, with a resulting bandgap of 6.046 eV.
To outline the differences in the phase behavior in response to an applied field, dielectric properties as a function of frequencies have been calculated including inter-band and intra-band transitions of band dispersions. In this case also, both the GGA-PBE and GGA-PBE + U approaches have been used to highlight the importance of the inclusion of U terms to simulate exited state properties of systems. In all cases the electronic static dielectric constant ε0 underwent variations depending on the HfO2 polymorph, and a typical behavior of the real part ε1 (Re (ε)) and the imaginary part ε2 (Imm (ε)) in function of frequency has been observed.
Based on the complex dielectric functions obtained with GGA-PBE values (Figure 5), important discrepancies from experimental evidence have been found. In detail, the magnitudes of maximum values of the ε2 were always higher (size 8, 9, and 12 for t-, o-, and c-HfO2 polymorphs, respectively) than the experimental values of HfO2. Regarding the ε1 behavior, in this case also the magnitudes obtained along the applied field were always higher than the experimental evidence.
Using the GGA-PBE + U approach (Figure 6), the ε0 measured for m-HfO2 was 5.73, and the ε1 increased with frequency obtaining a maximum when the photon energy was 4.96 eV, corresponding to 1200 THz. The ε2 showed vary low values along the whole range reported, showing a sensitive increase after 1100 THz. The ε0 for o-HfO2 has been found to be 5.67, while the ε1 exhibited a maximum at 920 THz (3.8 eV), then dropped sharply with the rise of photon energy, showing another peak at 1152 THz (4.76 eV). The ε2 showed two peaks at 963 and 1164 THz (corresponding to 3.98 and 4.81 eV, respectively) with increasing values along with increasing frequencies. Interestingly, the c-HfO2 showed an ε1 trend that seemed to be similar to that observed for o-HfO2 (Figure 6A). In particular, the ε0 value (5.89) was in line with the those previously measured, while a peak at 934 THz (3.86 eV) and a maximum value of ε1 in correspondence of 1045 THz (4.32 eV) have been observed; then this decreased quickly along with rise in frequency showing another peak at 1127 THz (4.66 eV). The similar behavior between o- and c-HfO2 phases is evident also when considering ε2 trend, which showed three peaks at 952, 1083, and 1149 THz, corresponding to 3.94, 4.48, and 4.75 eV, respectively (Figure 6B). The tetragonal phase showed further different behavior with respect to the previous three HfO2 polymorphs. These discrepancies have to be interpreted in terms of presence of peaks and magnitudes. The measured ε0 was 3.66 and ε1 showed lower values with respect to those observed for the previous systems, and only one peak at 1103 THz (4.56 eV) has been observed. The ε2 denoted an intermediate behavior between those detected for m- and o-HfO2, showing a gradual increase from 850 THz (3.51 eV) upwards.
Since the GGA + U approach could fail in the description of dielectric functions, to be sure about the values obtained including U values, the refractive index of monoclinic HfO2 has been calculated (Figure 7). This property has already been simulated [33] and is already known from an experimental point of view [34]. This allowed us to better note the reliability of the method used and the consistency of the fitted U values, since the results obtained from our simulation were in perfect agreement with other calculated and experimental data, confirming the accuracy of this method.

3.3. Oxygen Vacancies Effects

With the aim to better describe the properties of different HfO2 phases in the presence of point defects, oxygen vacancies have been modelled and the defect formation energy has been computed for each polymorph. Defect formation energies have been identified (Table 2) computing the total energy formation of a system with and without defects following the previously described approach used to compute the ground state cohesive energy of HfO2 polymorphs. As expected, the values obtained were always positive—otherwise the host crystals would be unstable.
From the computational results, the phase that seemed to be most prone to vacant oxygens was the cubic phase, with 0.149 eV, while the phase less likely to suffer this type of defect was the orthorhombic phase, with 0.315 eV.
Finally, the band structures with and without oxygen vacancies have been computed for all HfO2 polymorphs (Figure 8). DFT + U results showed that the numbers of valence bands and conduction bands significantly increased in all defected systems, and the band gap was lower than that of the pure HfO2 systems.

4. Discussion

The HfO2 can exhibit different polymorphs, and the chemical physical properties of material are directly linked to the atomistic disposition. The polymorphs are defined by crystallographic space group symmetries, leading to the existence of many crystalline forms. Each of these could present peculiar properties that can influence the use of this material in small device fabrication. For this reason, the DFT-GGA approach has been used first for all HfO2 phases to identify the geometry optimization and to compute the ground state cohesive energy. The first polymorph studied was m- P21/c phase, and the obtained lattice parameters outlined an optimal accommodation of the atoms in the unit cell [35,36]. The second model investigated was the o- Pca21 phase. Since more than one orthorhombic phase is known for HfO2, the choice of the specific o-phase is due to the controversial origin of ferroelectricity for the HfO2-based film stems, which is known to be related to the competition between the possible ferroelectric and non-ferroelectric HfO2 phases [37]. However, though many polar phases, such as the orthorhombic with space groups of Pca21 and Pmn21 [38] and the rhombohedral phase with the R3m space group, [39] have been supposed as the possible origins of the ferroelectricity of HfO2-based thin films, the orthorhombic phase with the space group Pca21 is most widely recognized to be responsible for its ferroelectricity [40,
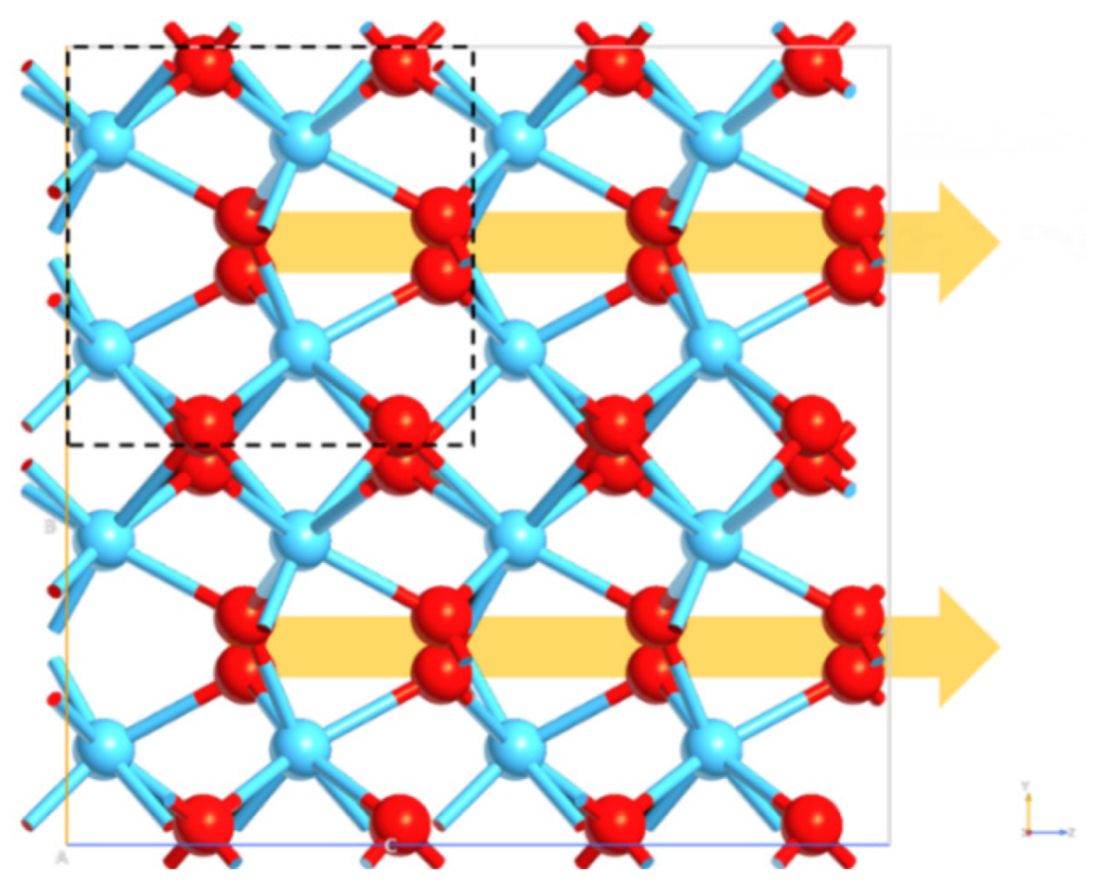
41]. The origin of the ferroelectricity in HfO2 is related to the formation of the non-centrosymmetric polar orthorhombic phase, as well as the Pca21 o-polymorph. The displacement of four polarization-related oxygen atoms per unit cell (Figure 9) leads to the polarization of o-HfO2. DFT results showed optimal lattice parameters, detecting the asymmetry and the spontaneous polarization of the optimized model.
The cubic HfO2 phase (space group Fm3m) is fully characterized by a single lattice constant a. The a value for the perfect bulk c-HfO2 has been obtained after geometry optimization, and the lattice parameters are in good agreement with other theoretical values [42,43,44]. In particular, the DFT approach showed that only the Hf–O distance changed along with the structure being preserved. These Hf–O bond lengths are consistent with those obtained by means of experimental and computational works [45]. The tetragonal t-HfO2 has been also considered, since a series of phase changes from the t-phase or m-phase to the o-phase are possible [46,47,48]. The DFT result suggested an optimization in the bond angles leading to a more suitable system configuration within the available space [49]. With the aim to perform a rigorous comparison between DFT and DFT + U results, the lattice constants of systems have been obtained using both approaches (Table 1). This comparison is very important to better describe the effects of the two treatments on the final simulated data The obtained results suggested that the addition of U terms to the xc energy led to an overestimation of the nanoparticle lengths of about 0.2 Å for all polymorphs, with an important discrepancy to the experimental data. This is due to the overlap of wavefunction of the valence electron described with xc energy, including U terms (Ud = 6 eV and Up = 4 eV), with the all-core electron density described with NC PseudoDojo pseudopotentials. This overlap causes an underestimation of xc energy, leading to wrong lattice parameters. Even if the use of lower U values could give more reliable results, this comparison confirmed the reliability of the DFT-GGA approach for the investigation of ground state phenomena as lattice constant values, without the necessity to include corrective terms.
The DFT-GGA approach has been used to compute the cohesive energy of polymorphs. Each HfO2 phase has a thermodynamic “internal energy”, which directly influences the behavior of different HfO2 systems. The most stable phase detected was the m-polymorph, and this is directly linked to the angles and the bond distances optimized in the previous geometry computation. The ferroelectric o-phase resulted in a metastable phase in bulk crystals since the cohesive energy was close to the monoclinic P21/c polymorph. The revealed distances between atoms and the asymmetric unit cell seems to stabilize the orthorhombic structure. For these reasons, the m- and the o-phases were shown to be the most stable polymorphs [50]. Following a gradual increase in the cohesive energy, m-phase and o-phase would transform to the t-phase and then to the c-phase, which showed the highest cohesive energy, probably because the atoms are placed in a more constrained way due to non-optimized angle bonds. To conclude, from GGA calculation, HfO2 shows different phase stability on the basis of the atom positions in the space, and this aspect is really important to predict the explicit properties of each polymorph. Even if some energy information is already known, this kind of investigation allowed us to have a starting point to investigate the energy effects of oxygen vacancies on polymorphs, as discussed below.
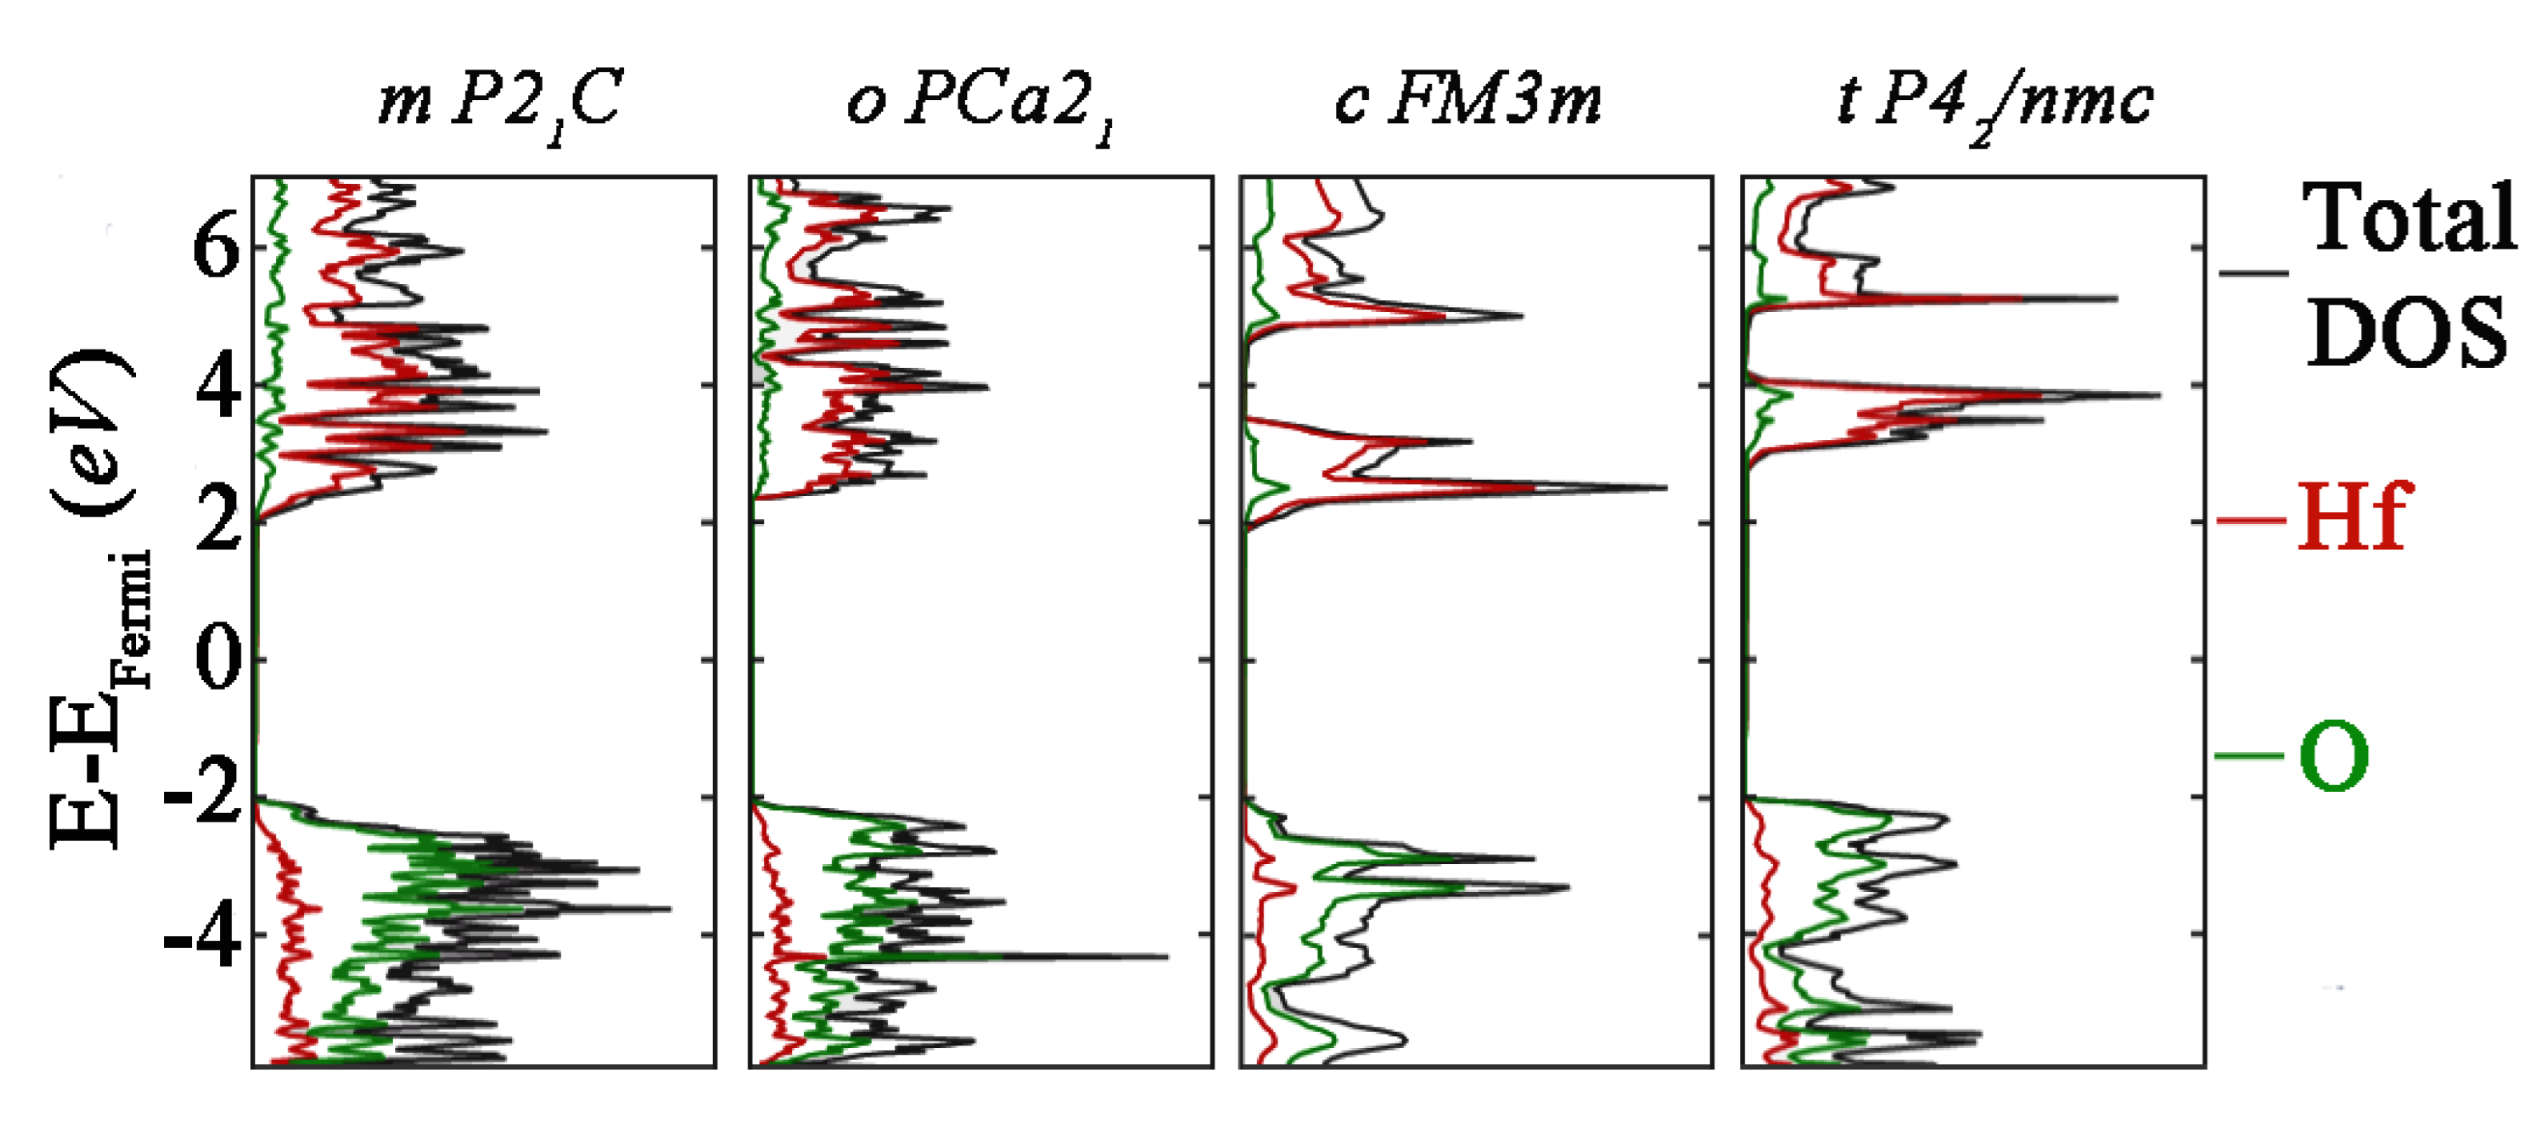
To better describe the excited state properties of different HfO2 phases modelled, total and partial DOS have been computed including the U values in the DFT approach. Since the Hubbard U values computed under one set of technical assumptions cannot be used for different DFT calculations, the finding of the optimal values to use with the PseudoDojo library is of useful importance, since no data are present in the literature. In all four HfO2 polymorphs studied, the Hf4+ and O2− entities do not change, meaning that, since U depends on the projectors used as well as other implementations, the same U values can be useful for different polymorphs [50]. To be sure about this, bandgap values with and without U values have been reported, and optimal values have been obtained. Following the calibration of the U values to use, the effective Hubbard U in GGA + U calculation tended to upper shift the minimum conduction band to provide a larger gap between the lowest conduction band and the highest valence band, and this behavior has been observed for all four polymorphs. The chosen values of 6 eV and 4 eV for Ud and Up, respectively, allowed us to obtain the correct shift for each polymorph, obtaining the optimal bandgap values found in the literature.
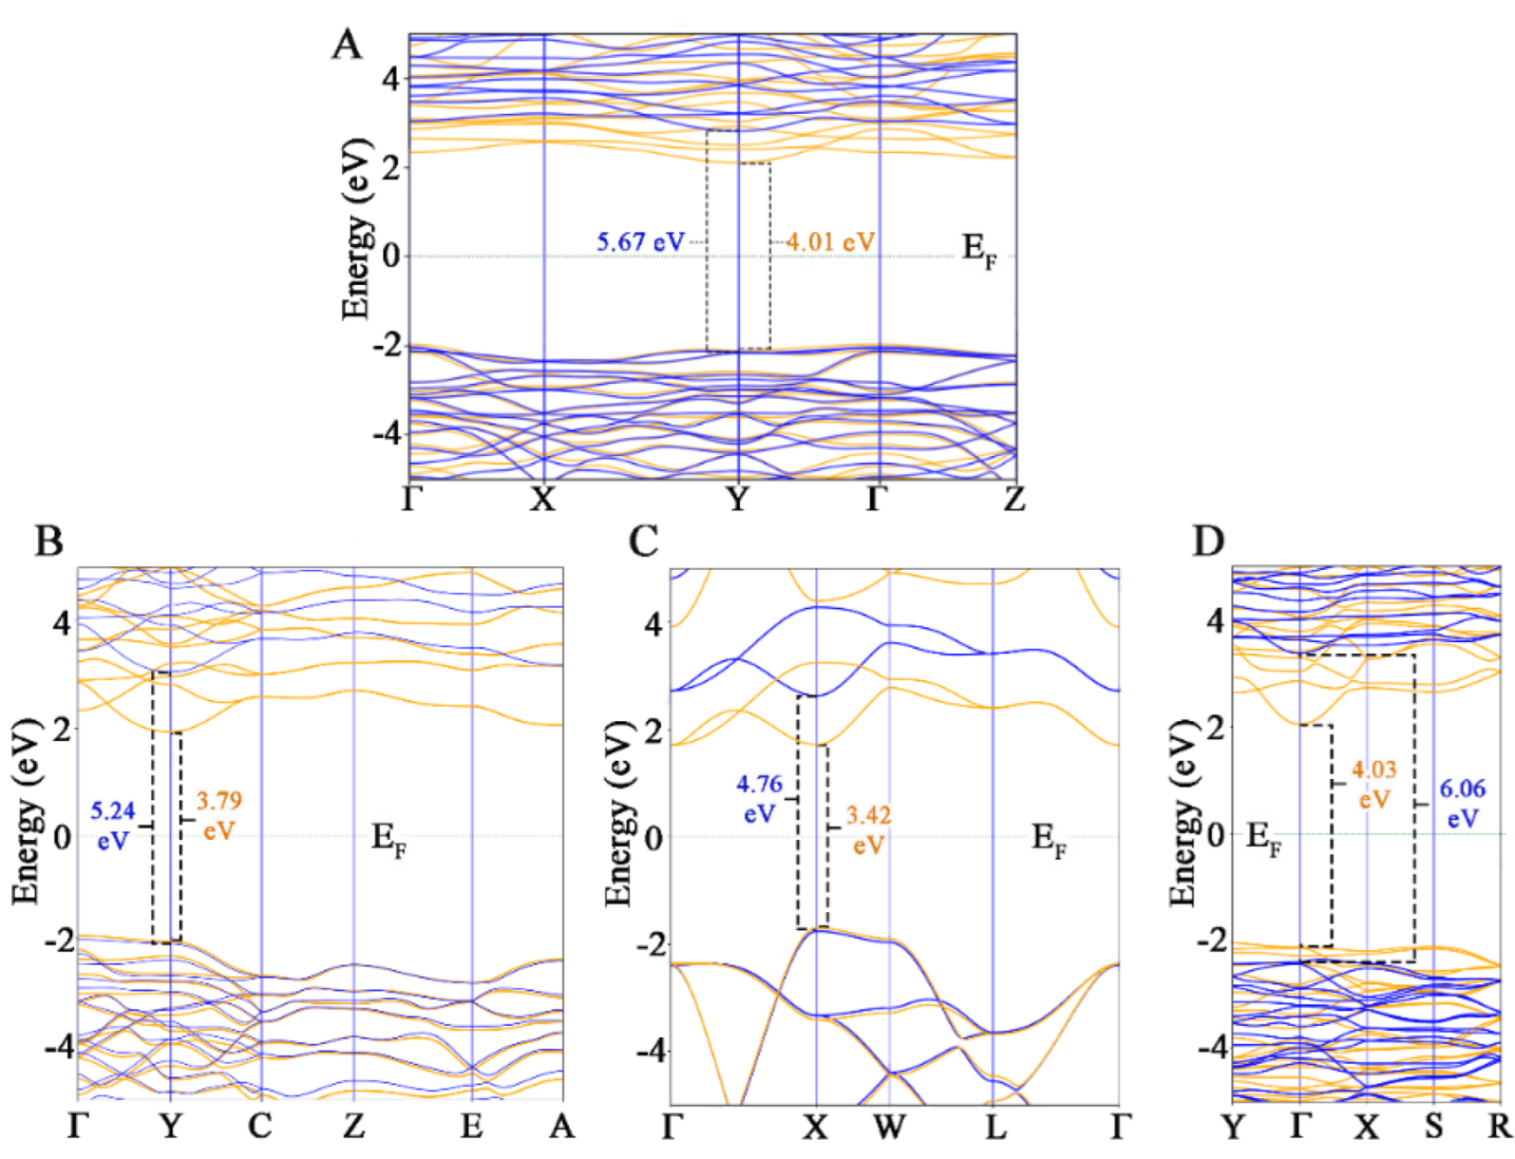
Focusing on the DOS simulated, the band structure tended to have a different appearance for all four systems. This suggests that the properties of HfO2 are defined by the short range rather than the long-range atomic ordering, and the absolute bandgap values calculated were in very good agreement with experimental evidence. The m- and o- polymorphs showed similar DOS profiles, which means that these first two phases showed some similarities, in line with an intrinsic stability detected in the cohesive energy computation. On the other hand, a lower bandgap value has been found for the c- phase, and this result could be in line with the lower stability of the phase, denoted with a higher cohesive energy then that observed for the previous systems.
Optical properties have been investigated comparing again the DFT and DFT + U approaches. Results showed that the peaks detected along the frequency range were the same using both methods, with an important difference in magnitude, because the optical properties detected with the DFT approach were always higher than the literature data, while the inclusion of U terms allowed reliable values. This result outlines the importance of including a U corrective term at this point of the investigation, confirming that canonical DFT calculations fail in accurate description of excited states phenomena such as electrical properties. Analyzing the differences between the polymorphs via the dielectric function investigation, an interesting similarity has been found between the e1 and e2 trend of o- and c-HfO2. In both cases, ε2 had more pronounced peaks around 90, 1050, and 1150 THz. This could be ascribed to the ferroelectric behavior of the o- polymorph, which should influence the response of the phase to the applied field. In fact, the spontaneous polarization of this polymorph is directly reflected to the behavior of the material in response to the simulated applied field. The t-HfO2 showed lower values of ε1, in line with a higher bandgap value with respect to the those observed for the other phases. Results suggested that the ε1 and ε2 values depend directly on the polymorph, where ε1 always assumed more intense values in o- and c-HfO2 phases, representing the greater polarization capacity of the material in these two phases. To verify the consistency of the dielectric functions simulated, the refractive index of m-HfO2 has been simulated and compared with other calculated data based on the use of the GGA + U method, and then showing a perfect agreement along the energy range of the applied filed. The magnitudes detected have been compared with experimental data, showing the reliability of the method and its capability to detect different responses of different polymorphs to an applied field.
Finally, the effects of the oxygen vacancies have been investigated following the DFT + U approach already used. The reason for this kind of approach is to identify if different polymorphs may have different aptitudes to suffer defects, because this directly influences the properties of polymorphs, leading to a loss of performance of semiconductor devices. The calculation of defect formation energy includes (i) vibrational (phonon) contributions, because the creation of a defect modifies the chemical bonds and thus the bond strength in its vicinity, (ii) electronic contributions, which are commonly small for semiconductors but can be sizable for metals, and (iii) magnetic excitations. As expected, different responses have been detected on the basis of different atoms’ displacement, and in particular the c-phase was the most prone to undergo vacant oxygens. The lower stability of the polymorph with respect to the other models could lead an intrinsic instability that is directly linked to a major propensity of the oxygen vacancies. On the other hand, the o-phase was the least subject to oxygen vacancies, possibly ascribed to the ferroelectric behavior of the o-polymorph, since the oxygen entities are directly involved in this behavior and the spontaneous polarization is directly linked to a strong overlap between the wavefunctions. The bandgaps structures showed important changes when the oxygen vacancies occurred, and the band gap value is narrowed along with increase in oxygen vacancy concentrations due to the delocalized states in the valence band. In more detail, the overlap of the nonlocalized oxygen vacancy states with valence band raises the position of the valence band, resulting in a band gap narrowing. These results clearly show that the band gap of all HfO2 phases decreased due to oxygen vacancies, and that all HfO2 polymorphs investigated showed a similar response to the oxygen vacancy onset.

5. Conclusions

HfO2 shows many polymorphs with different material properties. This large variation promises many prominent applications of HfO2 based devices. This work shows the potentialities of the atomistic simulation method exposed and the possibility of obtaining more and different information. In particular, a complete comparison of four different polymorphs has been reported using GGA and GGA + U methods in combination. Since some information is already known, a complete comparison of all the properties investigated between the four most important HfO2 most polymorphs is new. Moreover, the capabilities and the limits of the GGA and GGA + U methods used have been underlined, laying the foundations for their correct use and providing the elements to understand when to use different approaches, showing the correct way to combine them and their impact on the reliability of the final results. The optimal balance between the accuracy degree and reasonable simulation time required makes this combined method a valid alternative to more expensive simulation methods such as those based on semi-hybrid functionals, or purely ab-initio. The differences between monoclinic (P21/c), orthorhombic (PCa21), cubic (Fm3m), and tetragonal (P42/nmc) HfO2 polymorphs have been exhaustively discussed on the basis of transition phenomena between them. The DFT-GGA approach has been used to obtain lattice parameters of geometry optimized structures, and the results coincided well with the experimental value and other theoretical results. In addition, the computation of the cohesive energy, which depends on the specific polymorph, revealed that m- and o- HfO2 phases are observed as the most stable.
To better describe electrical properties that are correlated to the excited states of different polymorphs, the on-site Coulomb interactions have been included for 5d orbital of Hf atom and 2p orbital of O atom with the aim to solve the discrepancies between experimental and predicted excited states properties, improving the description of the electronic properties. Optimal bandgap values for all the four polymorphs have been obtained with Ud = 6 eV and Up = 4 eV, suggesting that these values are reliable to use in combination with the settled approach. The electron structure and optical properties of HfO2 phases have been calculated by the calibrated GGA + U method. Since the atomistic composition is always the same, the results obtained suggested different densities of states and bandgap values in relation to the polymorph, confirming the importance of investigating the atomistic effects on the materials properties. Differences between polymorphs have been also observed in the measuring of static dielectric constant value (ε0) and in the function of an applied field, since ε1 and ε2 had different trends in relation to the phase. Different ε0 values have been detected and features in ε1 and ε2 values have been identified in the high frequencies range for o- and c-HfO2 polymorphs. To better identify the role of U terms, lattice parameters and optical properties have been calculated using GGA and GGA + U, and the results have been compared and discussed.
Finally, the role of oxygen vacancies as electron acceptors has been investigated. The results suggested that oxygen vacancies play important roles in modulating the electrical activity of the HfO2 nanostructures, prompting a decrease in bandgap of different polymorphs. The defect formation calculation showed a peculiar propensity of the c-HfO2 phase for oxygen vacancies, while the o-HfO2 resulted was the least prone to these kinds of defect. The changing in the bandgap structures did not outline different responses of different phases, showing an increase in the number of the valence and conduction bands and a narrowing in the bandgap values for all systems. All these findings provide further insight into the influences of oxygen defects observed in HfO2 structures outlining the importance of the first principal calculations; in particular, the combined approach of GGA and GGA + U methods can be used as a guideline for engineering HfO2 based devices, accurately predicting their properties before production.

Author Contributions

Conceptualization, E.L., P.S., L.P. and D.M.; methodology, E.L.; software, E.L.; validation, E.L.; formal analysis, E.L. and P.S.; investigation, E.L. and L.P.; resources, E.L.; data curation, E.L. and D.M.; writing—original draft preparation, E.L.; writing—review and editing, E.L., P.S., L.P. and D.M.; visualization, E.L.; All authors have read and agreed to the published version of the manuscript.

Funding

This work is supported by the European Project “Nanomaterials enabling smart energy harvesting for next-generation Internet-of-Things” (NANO-EH) (grant agreement No. 951761) (FETPROACT-EIC-05-2019).

Data Availability Statement

Not applicable.

Acknowledgments

This work is part of the research of H2020 (FETPROACT-EIC-05-2019) “Nanomaterials enabling smart energy harvesting for next-generation Internet-of-Things” (NANO-EH) (grant agreement No. 951761).

Conflicts of Interest

The authors declare no conflict of interest.

References

  1. Wilk, G.D.; Wallace, R.M.; Anthony, J.M. High-κ gate dielectrics: Current status and materials properties considerations. J. Appl. Phys. 2001, 89, 5243. [Google Scholar] [CrossRef]
  2. Robertson, J. High dielectric constant oxides. EPJ Appl. Phys. 2004, 28, 265–291. [Google Scholar] [CrossRef] [Green Version]
  3. Buiu, O.; Lu, Y.; Mitrovic, I.Z.; Hall, S.; Chalker, P.; Potter, R.J. Spectroellipsometric assessment of HfO2 thin films. Thin Solid Films 2006, 2, 623–626. [Google Scholar] [CrossRef]
  4. Jones, M.N.; Kwon, Y.W.; Norton, D.P. Dielectric constant and current transport for HfO2 thin films on ITO. Appl. Phys. A Mater. Sci. Process. 2005, 81, 285–288. [Google Scholar] [CrossRef]
  5. Schlom, D.G.; Haeni, J.H. A thermodynamic approach to selecting alternative gate dielectrics. MRS Bull. 2002, 27, 198–204. [Google Scholar] [CrossRef]
  6. Clima, S.; Wouters, D.J.; Adelmann, C.; Schenk, T.; Schroeder, U.; Jurczak, M.; Pourtois, G. Identification of the ferroelectric switching process and dopant-dependent switching properties in orthorhombic HfO2: A first principles insight. Appl. Phys. Lett. 2014, 104, 092906. [Google Scholar] [CrossRef]
  7. Sang, X.; Grimley, E.D.; Schenk, T.; Schroeder, U.; Lebeau, J.M. On the structural origins of ferroelectricity in HfO2 thin films. Appl. Phys. Lett. 2015, 106, 162905. [Google Scholar] [CrossRef]
  8. Kita, K.; Kyuno, K.; Toriumi, A. Permittivity increase of yttrium-doped HfO2 through structural phase transformation. Appl. Phys. Lett. 2005, 86, 102906. [Google Scholar] [CrossRef]
  9. Heo, S.; Tahir, D.; Chung, J.G.; Lee, J.C.; Kim, K.; Lee, J.; Lee, H.I.; Park, G.S.; Oh, S.K.; Kang, H.J.; et al. Band alignment of atomic layer deposited (HfZrO4)1−x(SiO2)x gate dielectrics on Si (100). Appl. Phys. Lett. 2015, 107, 182101. [Google Scholar] [CrossRef]
  10. Zhao, X.; Vanderbilt, D. First-principles study of structural, vibrational, and lattice dielectric properties of hafnium oxide. Phys. Rev. B Condens. Matter Mater. Phys. 2002, 65, 233106. [Google Scholar] [CrossRef] [Green Version]
  11. Wang, H.; Wang, Y.; Feng, J.; Ye, C.; Wang, B.Y.; Wang, H.B.; Li, Q.; Jiang, Y.; Huang, A.P.; Xiao, Z.S. Structure and electrical properties of HfO2 high-k films prepared by pulsed laser deposition on Si (100). Appl. Phys. A Mater. Sci. Process 2008, 93, 681–684. [Google Scholar] [CrossRef]
  12. Anisimov, V.I.; Aryasetiawan, F.; Lichtenstein, A.I. First-principles calculations of the electronic structure and spectra of strongly correlated systems: The LDA + U method. J. Phys. Condens. Matter 1997, 9, 767. [Google Scholar] [CrossRef] [Green Version]
  13. Jiang, H.; Gomez-Abal, R.I.; Rinke, P.; Scheffler, M. First-principles modeling of localized d states with the GW@LDA + U approach. Phys. Rev. B 2010, 82, 045108. [Google Scholar] [CrossRef] [Green Version]
  14. Wang, L.; Maxisch, T.; Ceder, G. Oxidation energies of transition metal oxides within the GGA + U Framework. Phys. Rev. B Condens. Matter Mater. Phys. 2006, 73, 195107. [Google Scholar] [CrossRef] [Green Version]
  15. Plata, J.J.; Márquez, A.M.; Sanz, J.F. Communication: Improving the density functional theory U description of CeO2 by including the contribution of the O 2p electrons. J. Chem. Phys. 2012, 136, 041101. [Google Scholar] [CrossRef] [Green Version]
  16. Brown, J.J.; Page, A.J. The Hubbard-U correction and optical properties of d0 metal oxide photocatalysts. J. Chem. Phys. 2020, 153, 224116. [Google Scholar] [CrossRef]
  17. Electronic structures and optical properties of monoclinic ZrO2 studied by first-principles local density approximation + U approach. J. Adv. Ceram 2017, 6, 43–49. [CrossRef] [Green Version]
  18. Coury, M.E.A.; Dudarev, S.L.; Foulkes, W.M.C.; Horsfield, A.P.; Ma, P.W.; Spencer, J.S. Hubbard-like Hamiltonians for interacting electrons in S, P, and D orbitals. Phys. Rev. B 2016, 93, 07510. [Google Scholar] [CrossRef] [Green Version]
  19. Sai Gautam, G.; Carter, E.A. Evaluating transition metal oxides within DFT-SCAN and SCAN+U frameworks for solar thermochemical applications. Phys. Rev. Mater. 2018, 2, 095401. [Google Scholar] [CrossRef]
  20. Li, J.; Meng, S.; Li, L.; Lu, H.; Tohyama, T. First-principles generalized gradient approximation (GGA) + Ud + Up studies of electronic structures and optical properties in cubic HfO2. Comput. Mater. Sci. 2014, 81, 397–401. [Google Scholar] [CrossRef] [Green Version]
  21. Smidstrup, S.; Markussen, T.; Vancraeyveld, P.; Wellendorff, J.; Schneider, J.; Gunst, T.; Verstichel, B.; Stradi, D.; Khomyakov, P.A.; Vej-Hansen, U.G.; et al. QuantumATK: An integrated platform of electronic and atomic-scale modelling tools. J. Phys. Condens. Matter 2020, 32, 015901. [Google Scholar] [CrossRef] [PubMed]
  22. Soler, J.M.; Artacho, E.; Gale, J.D.; García, A.; Junquera, J.; Ordejón, P.; Sánchez-Portal, D. The SIESTA method for ab initio order-N materials simulation. J. Phys. Condens. Matter 2002, 14, 2745–2779. [Google Scholar] [CrossRef] [Green Version]
  23. Perdew, J.P.; Burke, K.; Ernzerhof, M. Generalized gradient approximation made simple. Phys. Rev. Lett. 1996, 77, 3865–3868. [Google Scholar] [CrossRef] [PubMed] [Green Version]
  24. Van Setten, M.J.; Giantomassi, M.; Bousquet, E.; Verstraete, M.J.; Hamann, D.R.; Gonze, X.; Rignanese, G.M. The PseudoDojo: Training and grading a 85 element optimized norm-conserving pseudopotential table. Comput. Phys. Commun. 2018, 226, 39. [Google Scholar] [CrossRef] [Green Version]
  25. King-Smith, R.D.; Vanderbilt, D. Theory of polarization of crystalline solids. Phys. Rev. B 1993, 47, 1651. [Google Scholar] [CrossRef] [PubMed]
  26. Fan, S.T.; Chen, Y.W.; Liu, C.W. Strain effect on the stability in ferroelectric HfO2 simulated by first-principles calculations. J. Phys. D Appl. Phys. 2020, 53, 23LT01. [Google Scholar] [CrossRef]
  27. Li, J.; Lu, H.; Li, Y.; Meng, S.; Zhang, Y. First-principles generalized gradient approximation (GGA)+U studies of electronic structure and optical properties in cubic ZrO2. Solid State Commun. 2015, 211, 38–42. [Google Scholar] [CrossRef]
  28. Hoffmann, M.; Schroeder, U.; Schenk, T.; Shimizu, T.; Funakubo, H.; Sakata, O.; Pohl, D.; Drescher, M.; Adelmann, C.; Materlik, R.; et al. Stabilizing the ferroelectric phase in doped hafnium oxide. J. Appl. Phys. 2015, 118, 072006. [Google Scholar] [CrossRef]
  29. El-Shanshoury, I.A.; Rudenko, V.A.; Ibrahim, I.A. Polymorphic Behavior of Thin Evaporated Films of Zirconium and Hafnium Oxides. J. Am. Ceram. Soc. 1970, 53, 264–268. [Google Scholar] [CrossRef]
  30. MacLaren, I.; Ras, T.; MacKenzie, M.; Craven, A.J.; McComb, D.W.; De Gendt, S. Texture, Twinning, and Metastable “Tetragonal” Phase in Ultrathin Films of HfO2 on a Si Substrate. J. Electrochem. Soc. 2009, 156, G103. [Google Scholar] [CrossRef]
  31. Al-Khatatbeh, Y.; Lee, K.K.M.; Kiefer, B. Phase diagram up to 105 GPa and mechanical strength of HfO2. Phys. Rev. B Condens. Matter Mater. Phys. 2010, 82, 144106. [Google Scholar] [CrossRef] [Green Version]
  32. Garcia, J.C.; Lino, A.A.T.; Scolfaro, L.M.R.; Leite, J.R.; Freire, V.N.; Farias, G.A.; da Silva, E.F., Jr. Band Structure Derived Properties of HfO2 from First Principles Calculations. AIP Conf. Proc. 2005, 772, 189. [Google Scholar]
  33. Torchio, P.; Gatto, A.; Alvisi, M.; Albrand, G.; Kaiser, N.; Amra, C. High-reflectivity HfO2/SiO2 ultraviolet mirrors. Appl. Opt. 2002, 41, 16. [Google Scholar] [CrossRef] [PubMed]
  34. Senami, M.; Tsuchida, Y.; Fukushima, A.; Ikeda, Y.; Tachibana, A. Local dielectric property of cubic, tetragonal, and monoclinic hafnium oxides. Jpn. J. Appl. Phys. 2012, 51, 031101. [Google Scholar] [CrossRef]
  35. Zhao, X.; Vanderbilt, D. Phonons and lattice dielectric properties of zirconia. Phys. Rev. B Condens. Matter Mater. Phys. 2002, 65, 075105. [Google Scholar] [CrossRef] [Green Version]
  36. Richter, C.; Schenk, T.; Park, M.H.; Tscharntke, F.A.; Grimley, E.D.; LeBeau, J.M.; Zhou, C.; Fancher, C.M.; Jones, J.L.; Mikolajick, T.; et al. Si Doped Hafnium Oxide—A “Fragile” Ferroelectric System. Adv. Electron. Mater. 2017, 3, 1700131. [Google Scholar] [CrossRef]
  37. Huan, T.D.; Sharma, V.; Rossetti, G.A.; Ramprasad, R. Pathways towards ferroelectricity in hafnia. Phys. Rev. B Condens. Matter Mater. Phys. 2014, 90, 064111. [Google Scholar] [CrossRef] [Green Version]
  38. Wei, Y.; Nukala, P.; Salverda, M.; Matzen, S.; Zhao, H.J.; Momand, J.; Everhardt, A.; Blake, G.R.; Lecoeur, P.; Kooi, B.J.; et al. A rhombohedral ferroelectric phase in epitaxially-strained Hf0.5Zr0.5O2 thin films. Nat. Mater. 2018, 17, 1095–1100. [Google Scholar] [CrossRef] [PubMed] [Green Version]
  39. Park, M.H.; Chung, C.C.; Schenk, T.; Richter, C.; Hoffmann, M.; Wirth, S.; Jones, J.L.; Mikolajick, T.; Schroeder, U. Origin of Temperature-Dependent Ferroelectricity in Si-Doped HfO2. Adv. Electron. Mater. 2018, 4, 1700489. [Google Scholar] [CrossRef]
  40. Tao, L.L.; Paudel, T.R.; Kovalev, A.A.; Tsymbal, E.Y. Reversible spin texture in ferroelectric HfO2. Phys. Rev. B 2017, 95, 245141. [Google Scholar] [CrossRef] [Green Version]
  41. Shein, K.I.; Shein, I.R.; Medvedeva, N.I.; Bamburov, V.G.; Ivanovskii, A.L. Electronic structure of tetragonal thorium silicate in comparison with thorium dioxide. Dokl. Phys. Chem. 2006, 409, 198–201. [Google Scholar] [CrossRef]
  42. Jaffe, J.E.; Bachorz, R.A.; Gutowski, M. Low-temperature polymorphs of ZrO2 and HfO2: A density-functional theory study. Phys. Rev. B Condens. Matter Mater. Phys. 2005, 72, 144107. [Google Scholar] [CrossRef]
  43. Ondračka, P.; Holec, D.; Nečas, D.; Zajíčková, L. Accurate prediction of band gaps and optical properties of HfO2. J. Phys. D Appl. Phys. 2016, 49, 395301. [Google Scholar] [CrossRef] [Green Version]
  44. Demkov, A.A. Investigating alternative gate dielectrics: A theoretical approach. Phys. Status Solidi Basic Res. 2001, 1, 57–67. [Google Scholar] [CrossRef]
  45. Grimley, E.D.; Schenk, T.; Sang, X.; Pešić, M.; Schroeder, U.; Mikolajick, T.; LeBeau, J.M. Structural Changes Underlying Field-Cycling Phenomena in Ferroelectric HfO2 Thin Films. Adv. Electron. Mater. 2016, 2, 1600173. [Google Scholar] [CrossRef]
  46. Park, M.H.; Kim, H.J.; Kim, Y.J.; Lee, Y.H.; Moon, T.; Kim, K.D.; Hyun, S.D.; Fengler, F.; Schroeder, U.; Hwang, C.S. Effect of Zr Content on the Wake-Up Effect in Hf1-xZrxO2 Films. ACS Appl. Mater. Interfaces 2016, 8, 15466–15475. [Google Scholar] [CrossRef]
  47. Pešić, M.; Fengler, F.P.G.; Larcher, L.; Padovani, A.; Schenk, T.; Grimley, E.D.; Sang, X.; LeBeau, J.M.; Slesazeck, S.; Schroeder, U.; et al. Physical Mechanisms behind the Field-Cycling Behavior of HfO2-Based Ferroelectric Capacitors. Adv. Funct. Mater. 2016, 26, 4601–4612. [Google Scholar] [CrossRef]
  48. Wang, J.; Li, H.P.; Stevens, R. Hafnia and hafnia-toughened ceramics. J. Mater. Sci. 1992, 27, 5397–5430. [Google Scholar] [CrossRef]
  49. Müller, J.; Böscke, T.S.; Schröder, U.; Mueller, S.; Bräuhaus, D.; Böttger, U.; Frey, L.; Mikolajick, T. Ferroelectricity in simple binary ZrO2 and HfO2. Nano Lett. 2012, 12, 4318–4323. [Google Scholar] [CrossRef] [PubMed]
  50. Kaczkowski, J.; Pugaczowa-Michalska, M.; Płowas’-Korus, I. Comparative density functional studies of pristine and doped bismuth ferrite polymorphs by GGA + U and meta-GGA SCAN + U. Phys. Chem. Chem. Phys. 2021, 23, 8571. [Google Scholar] [CrossRef] [PubMed]
Figure 1. Atomic structures of single domains of monoclinic (A), orthorhombic (B), cubic (C), and tetragonal (D) HfO2 polymorphs. Hf and O atoms are reported in light blue and red spheres, respectively.
Crystals 12 00090 g001
Figure 2. Cohesive energy of HfO2 polymorphs.
Crystals 12 00090 g002
Figure 3. Calculated electronic band structures of o- (A), m- (B), c- (C), and t- (D) HfO2 polymorphs using GGA (orange) and GGA + U (blue) approach. Fermi level is highlighted by a dotted line.
Crystals 12 00090 g003
Figure 4. Partial and total DOS of HfO2 polymorphs investigated. The m-P21c, o-PCa21, c-FM3m, and t-P42/nmc are reported to note the differences between the polymorphs.
Crystals 12 00090 g004
Figure 5. Real part ε1 (A) and imaginary part ε2 (B) of dielectric function for HfO2 in function of frequency. These data have been obtained using the GGA-PBE approach.
Crystals 12 00090 g005
Figure 6. Real part ε1 (A) and imaginary part ε2 (B) of dielectric function for HfO2 in function of frequency. These data have been obtained using the GGA-PBE + U approach.
Crystals 12 00090 g006
Figure 7. Calculated refractive index for m-HfO2 in function of frequency.
Crystals 12 00090 g007
Figure 8. Bandgap structures of m- (A), o- (B), c- (C), and t- (D) HfO2. The blue lines highlight the bands of models with no defect, while orange lines outline the bands of defected HfO2 polymorphs.
Crystals 12 00090 g008
Figure 9. Orthorhombic phase of HfO2. Hf and O entities are reported in light blue and red respectively. The dashed square shows the o-unit cell. The yellow arrows highlight the polarization direction.
Crystals 12 00090 g009
Table 1. Lattice Constants of HfO2 Unit Cells (in Å).
PhaseSpace GroupCalculated (PBE-GGA)Calculated (PBE-GGA + U)Experiments
MonoclinicP21/ca = 5.068
b = 5.135
c = 5.292
a = 5.208
b = 5.325
c = 5.424
a = 5.07 [28]
b = 5.14
c = 5.29
OrthorhombicPca21a = 5.231
b = 5.008
c = 5.052
a = 5.411
b = 5.220
c = 5.248
a = 5.23 [29]
b = 5.00
c = 5.05
CubicFm3ma = b = c = 5.062a = b = c = 5.277a = b = c = 5.08 [30]
TetragonalP42/nmca = b = 5.062
c = 5.22
a = b = 5.283
c = 5.43
a = b = 5.06 [31]
c = 5.2
Table 2. Defect formation energies in eV of HfO2 polymorphs.
PhaseHfO2 Formation EnergyHfO2 − x
Formation Energy
Defect Formation Energy
Monoclinic P21/c−3.915−3.6300.285
Orthorhombic Pca21−3.887−3.5720.315
Cubic Fm3m−3.792−3.6430.149
Tetragonal P42/nmc−3.813−3.5920.221
Publisher’s Note: MDPI stays neutral with regard to jurisdictional claims in published maps and institutional affiliations.

