1. Introduction
Repetitively pulsed coherent powerful radiation sources in the mid-IR range have a wide variety of applications in many areas, such as material processing (glass, ceramics, or semiconductors) [
1,
2] and medicine, including disease diagnosis using gas analysis and the resonance ablation of biological tissues [
3]. Coherent radiation sources capable of generating powerful pulsed radiation in the wavelength range of 3.5–5 µm are relevant when creating lidar systems based on the differential absorption method for the control of greenhouse gas emissions (as the most intensive absorption lines of greenhouse gases are in this spectral range) [
4,
5,
6]. Among the most effective solid sources of coherent radiation in the mid-IR range are optical parametric oscillators (OPO).
Currently, the most powerful OPOs in the wavelength range of 3.5–5 µm are developed based on nonlinear-optical ZnGeP
2 (ZGP) crystals [
7]. The OPO data can generate radiation with an average power of up to 160 W, or pulse energy up to 200 mJ with a pulse duration of 20–60 ns and a repetition rate of up to 100 kHz [
8,
9,
10]. However, long-term work without the failure of powerful OPOs based on ZGP is limited to the laser-induced damage threshold (LIDT) of the surface of the given material. In this regard, the potential for the practical use of the OPO data of the mid-IR range is associated with the need to improve the methods for the processing of the working surfaces of crystals to increase their LIDT. The problem of ZGP optical breakdown by laser radiation at wavelengths from 1.064 μm to 10 μm is the subject of several published articles [
11,
12,
13,
14,
15,
16,
17,
18]. These articles revealed a significant difference in the magnitude of the LIDT of the ZGP crystal at the wavelengths of 1.064 μm and 2.1 μm [
11]. The dynamic visualization of the breakdown process with laser radiation at a wavelength of 2.1 μm in the volume of ZGP showed that an avalanche-shaped temperature increase occurs within the nonlinear-optical element [
12]. An increase in the ZGP breakdown threshold with a decrease in the duration of the pump radiation pulses is “indicated in favor of the thermal nature of the breakdown for nanosecond pulses due to abnormal infrared absorption.” In [
14], it was shown that the cooling of a crystal to a temperature of −60 °C leads to an increase in the LIDT by 1.5–3 times, up to 9 J/cm
2 at the wavelength of the acting laser radiation of 2.091 μm and the frequency of 10 kHz pulses.
In [
15], it was reported that the LIDT of ZGP elements at a wavelength of 9.55 μm was determined by the intensity of the acting beam of 142 MW/cm
2, a pulse duration of 85 ns and a repetition rate of 1 Hz, which is ~9.5 J/cm
2 in terms of energy density pulses. In the articles, it was also reported, in particular, that the laser damage threshold of the ZGP surface is limited by the level of the power density of the pump radiation, but not by the radiation intensity [
16]. The direct dependence of LIDT on the growth technology and optical quality of crystals was demonstrated in [
14].
In [
17,
18], it was shown that improving the polishing of the ZGP working surfaces and a decrease or complete removal of the near-surface fractured layer leads to an increase in the breakdown threshold. In [
17], it was shown that a decrease in the near-surface fractured layer led to a decrease in R
q by two times, a change in the PV parameter by more than five times, and the LIDT with regard to the energy density increased by two times. The LIDT at a wavelength of 2.05 μm and the pulse frequency of 10 kHz for ZGP samples with a sputtered antireflection coating was improved from 1 J/cm
2 to 2 J/cm
2. An increase in LIDT was achieved by improving the polishing of the surface of the ZGP samples. At the same time, the results of the studies presented in [
14] show that an almost unchanged polishing parameter R
Z and the variation of the R
q parameter by more than four times, as well as the variation of the R
a parameter by more than five times did not lead to any changes in LIDT. This was assumed to be because the irregularities of the polished surface (peaks and depressions) described by the R
z parameter contribute to the optical breakdown mechanism, and can “seed” inhomogeneities to initialize the optical breakdown due to field effects at a wavelength of 2.091 μm.
Thus, previous studies indicate that the quality of the polishing of the ZGP surface significantly affects the LIDT value, which in turn limits the reliability of the coherent mid-IR radiation sources produced based on a nonlinear ZGP crystal. These circumstances stimulate the development of new polishing methods that provide better surface roughness and a higher LIDT value.
One of the promising methods for the improvement of the surface quality is magnetorheological polishing) [
19], which, among other things, is increasingly used in the processing of laser crystals to increase the radiation resistance threshold and reduce the roughness level. The research presented in this article is devoted to checking the possibility of using magnetorheological processing as a method for the removal of a defect layer after fine polishing and the reduction of the level of surface roughness of a single-crystal ZGP. The definition of a defective layer after fine polishing was understood as a fractured layer formed during the mechanical polishing of optical materials. As a rule, the depth of this layer is approximately twice the size of the abrasive used [
20]. The influence of magnetorheological processing on the LIDT of ZGP was estimated.
2. Samples under Study and their Parameters
Two samples of a single-crystal ZGP were used for the research—sample No. 1 and No. 2—with dimensions of 6 × 6 × 20 mm
3. The samples under study were cut from a single-crystal ZGP boule (manufactured by LLC “LOK”, Tomsk, Russia) at angles θ = 54.5° and φ = 0° relative to the optical axis. A single-crystal ZnGeP
2 boule was grown using the Bridgman method in the vertical direction on an oriented seed; the growth was carried out from a molten polycrystalline compound previously synthesized using the two-temperature method [
21]. The radiation absorption, taking into account multiple reflections from the crystal faces, at a wavelength of 2.097 μm for both samples, was 0.03 cm
−1.
The phase composition of the samples under study was determined prior to the study using X-ray diffraction analysis. According to the result of the X-ray structural analysis, no foreign phases were detected in any the samples under study (
Table 1).
Holograms of the internal volume of the samples under study were obtained using a digital holographic camera DHC-1.064, manufactured by LLC “LOK”. The reconstruction of the produced digital holograms was carried out to characterize the volumetric defects. The limiting resolution of the method was 3 μm (a detailed description of the digital holography technique, including those applied to the visualization of defects in ZGP and a description of the holographic camera used, is given in [
22]). No volume defects with linear dimensions ≥ the limiting resolution of the applied holographic method were detected in any of the three samples used in this work.
The initial polishing of the working surfaces of both test samples was carried out on a 4-PD-200 polishing and finishing machine (SZOS, Minsk, Belarus). The initial processing of the working surfaces of all of the samples consisted of polishing on a cambric polishing pad using ACM 0.5/0 synthetic diamond powder (with an average grain size of 270 nm). The removal of the material was ~50 μm, which allowed the removal of the fractured layer formed in the process of cutting the crystal into oriented plates, and their preliminary grinding. Then, the samples were additionally polished on a cambric polishing pad using ACM 0.25/0 synthetic diamond powder. After that, the samples were polished on a resin polishing pad made of polishing resin using ACM 0.25/0 synthetic diamond powder.
The working surfaces of sample No. 2 were additionally subjected to magnetorheological processing (MRP) from two ends. The MRP was carried out on a five-axis CNC machine, UMO-00.00.000 (UMO-00.00.000, ITMO, Minsk, Belarus). For the MPR a non-aqueous liquid with magnetic particles of carbonyl iron and nanodiamonds was used. A two-stage MRP was used to increase the productivity of the material removal from the surface, which included hard and soft modes, differing in the size of the gap between the impeller and the workpiece. A ZGP crystal sample was fixed on the installation using a holder made of fluoroplastic.
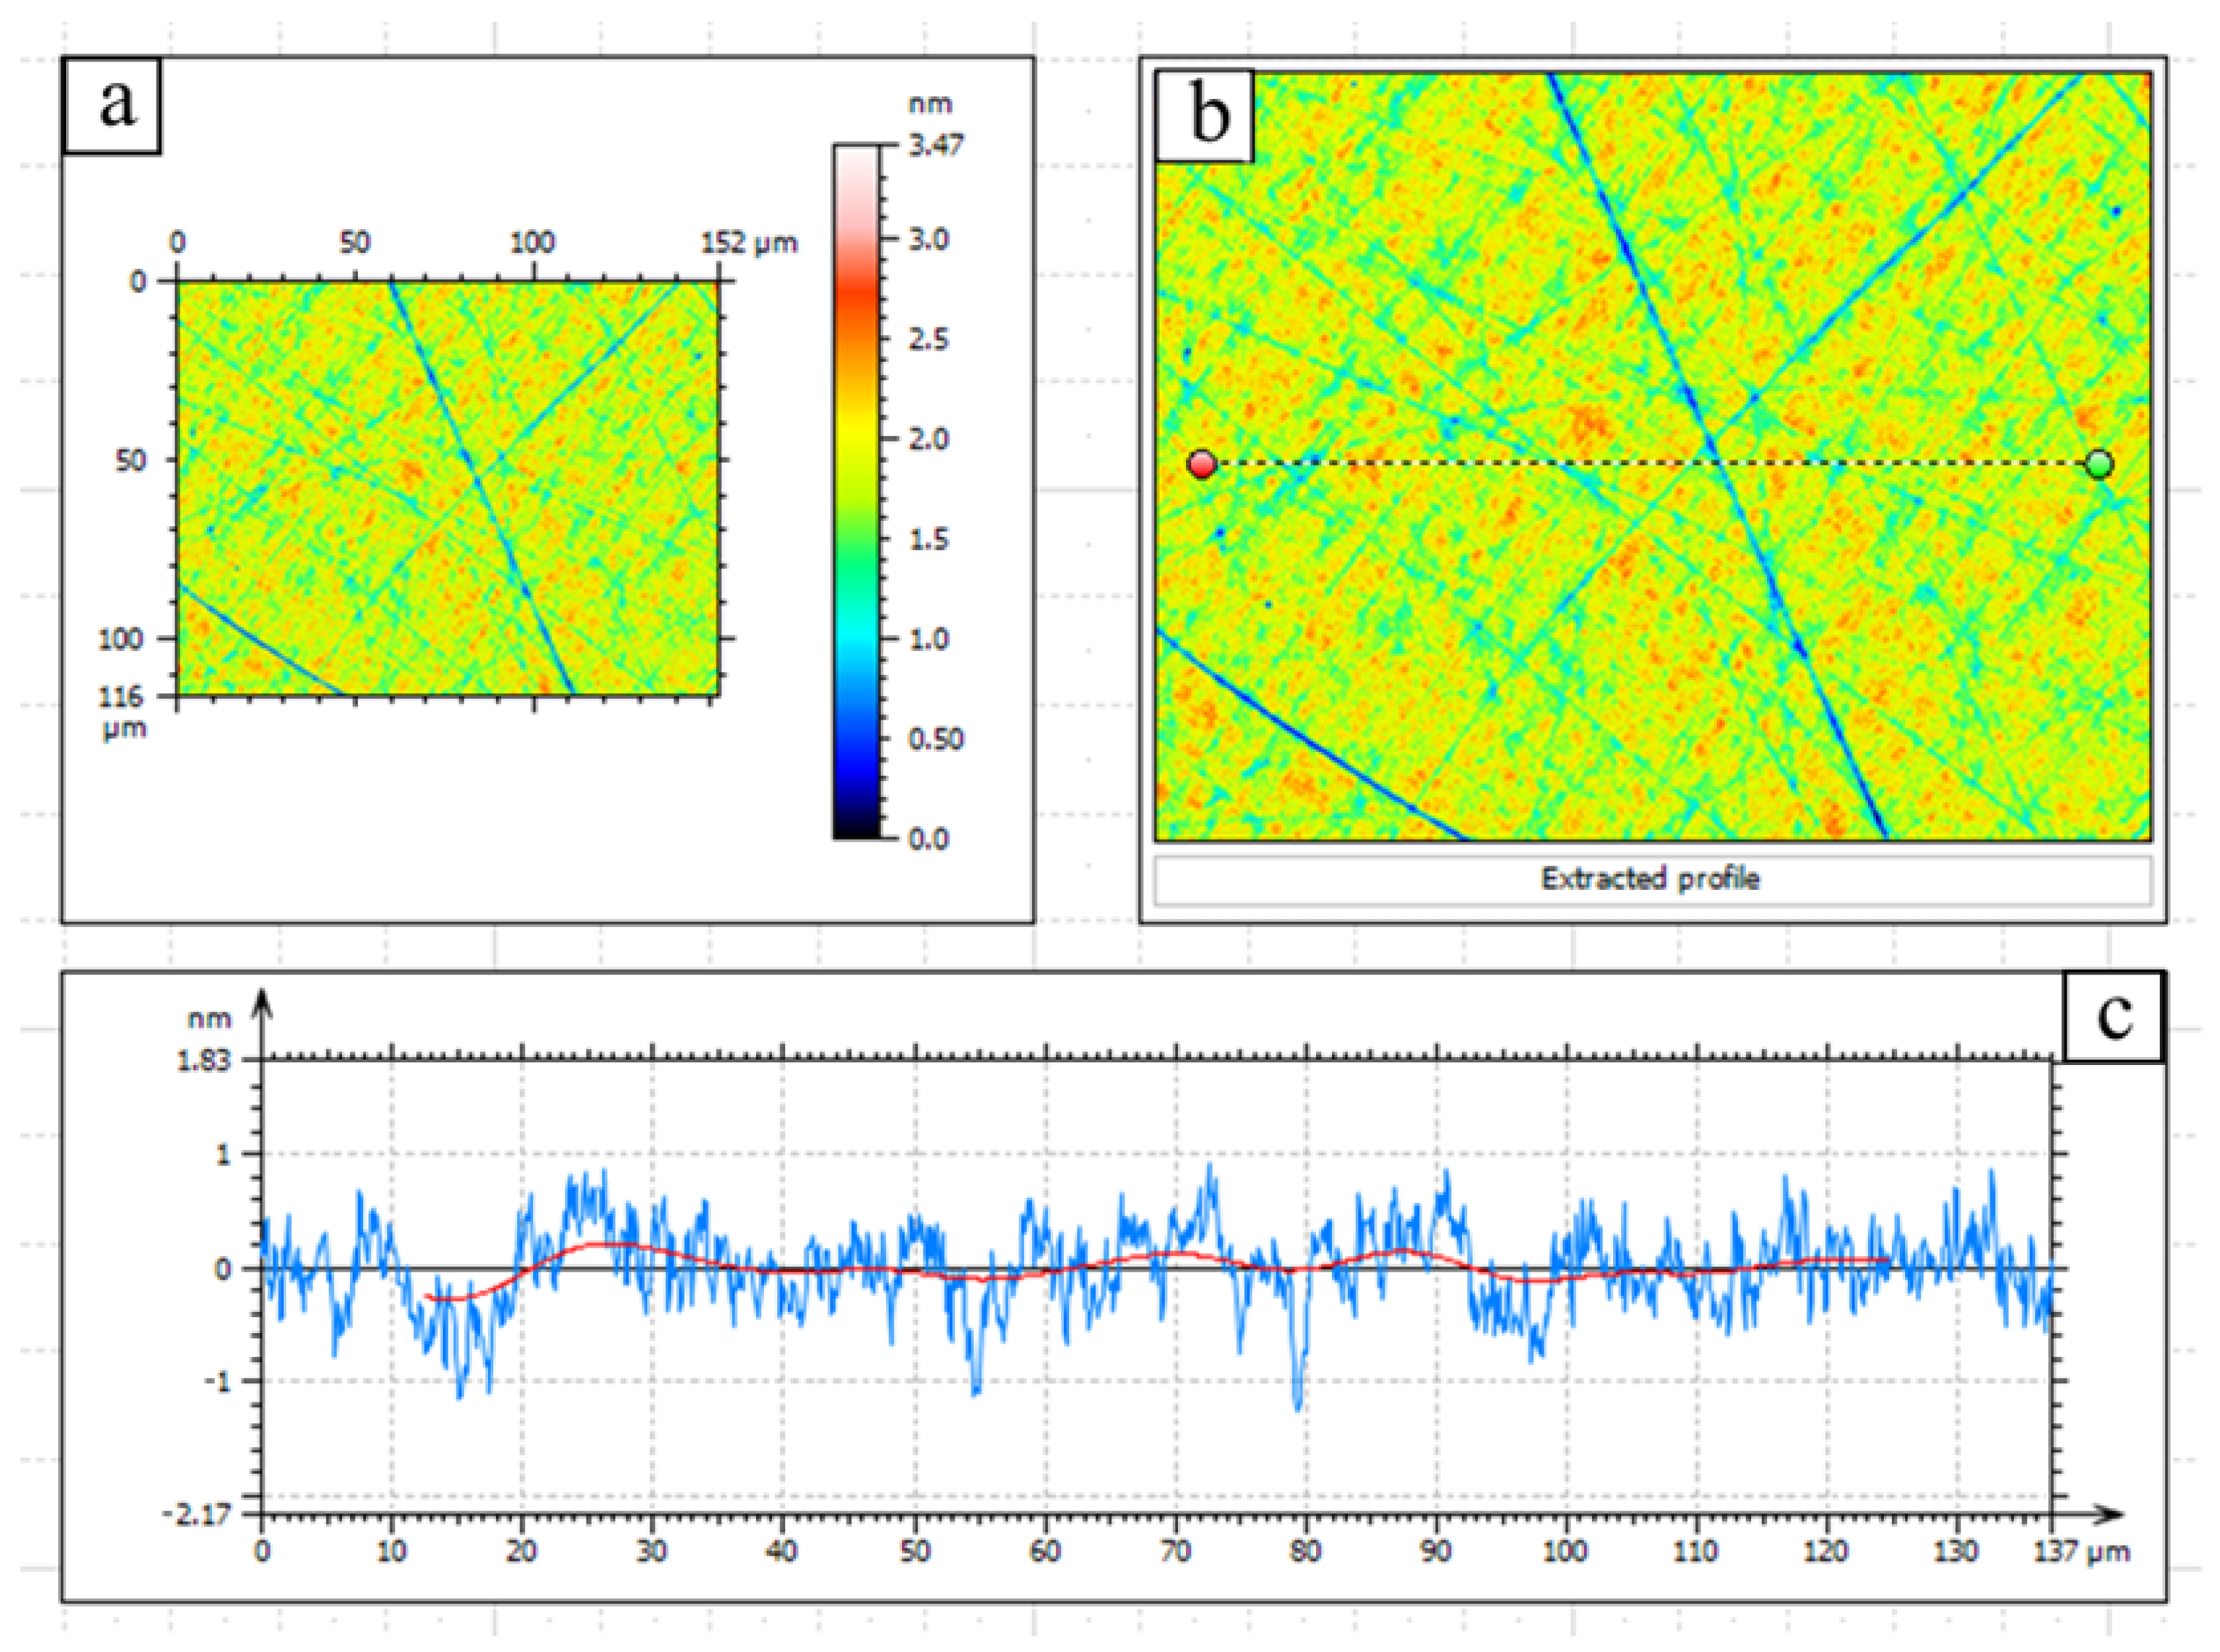
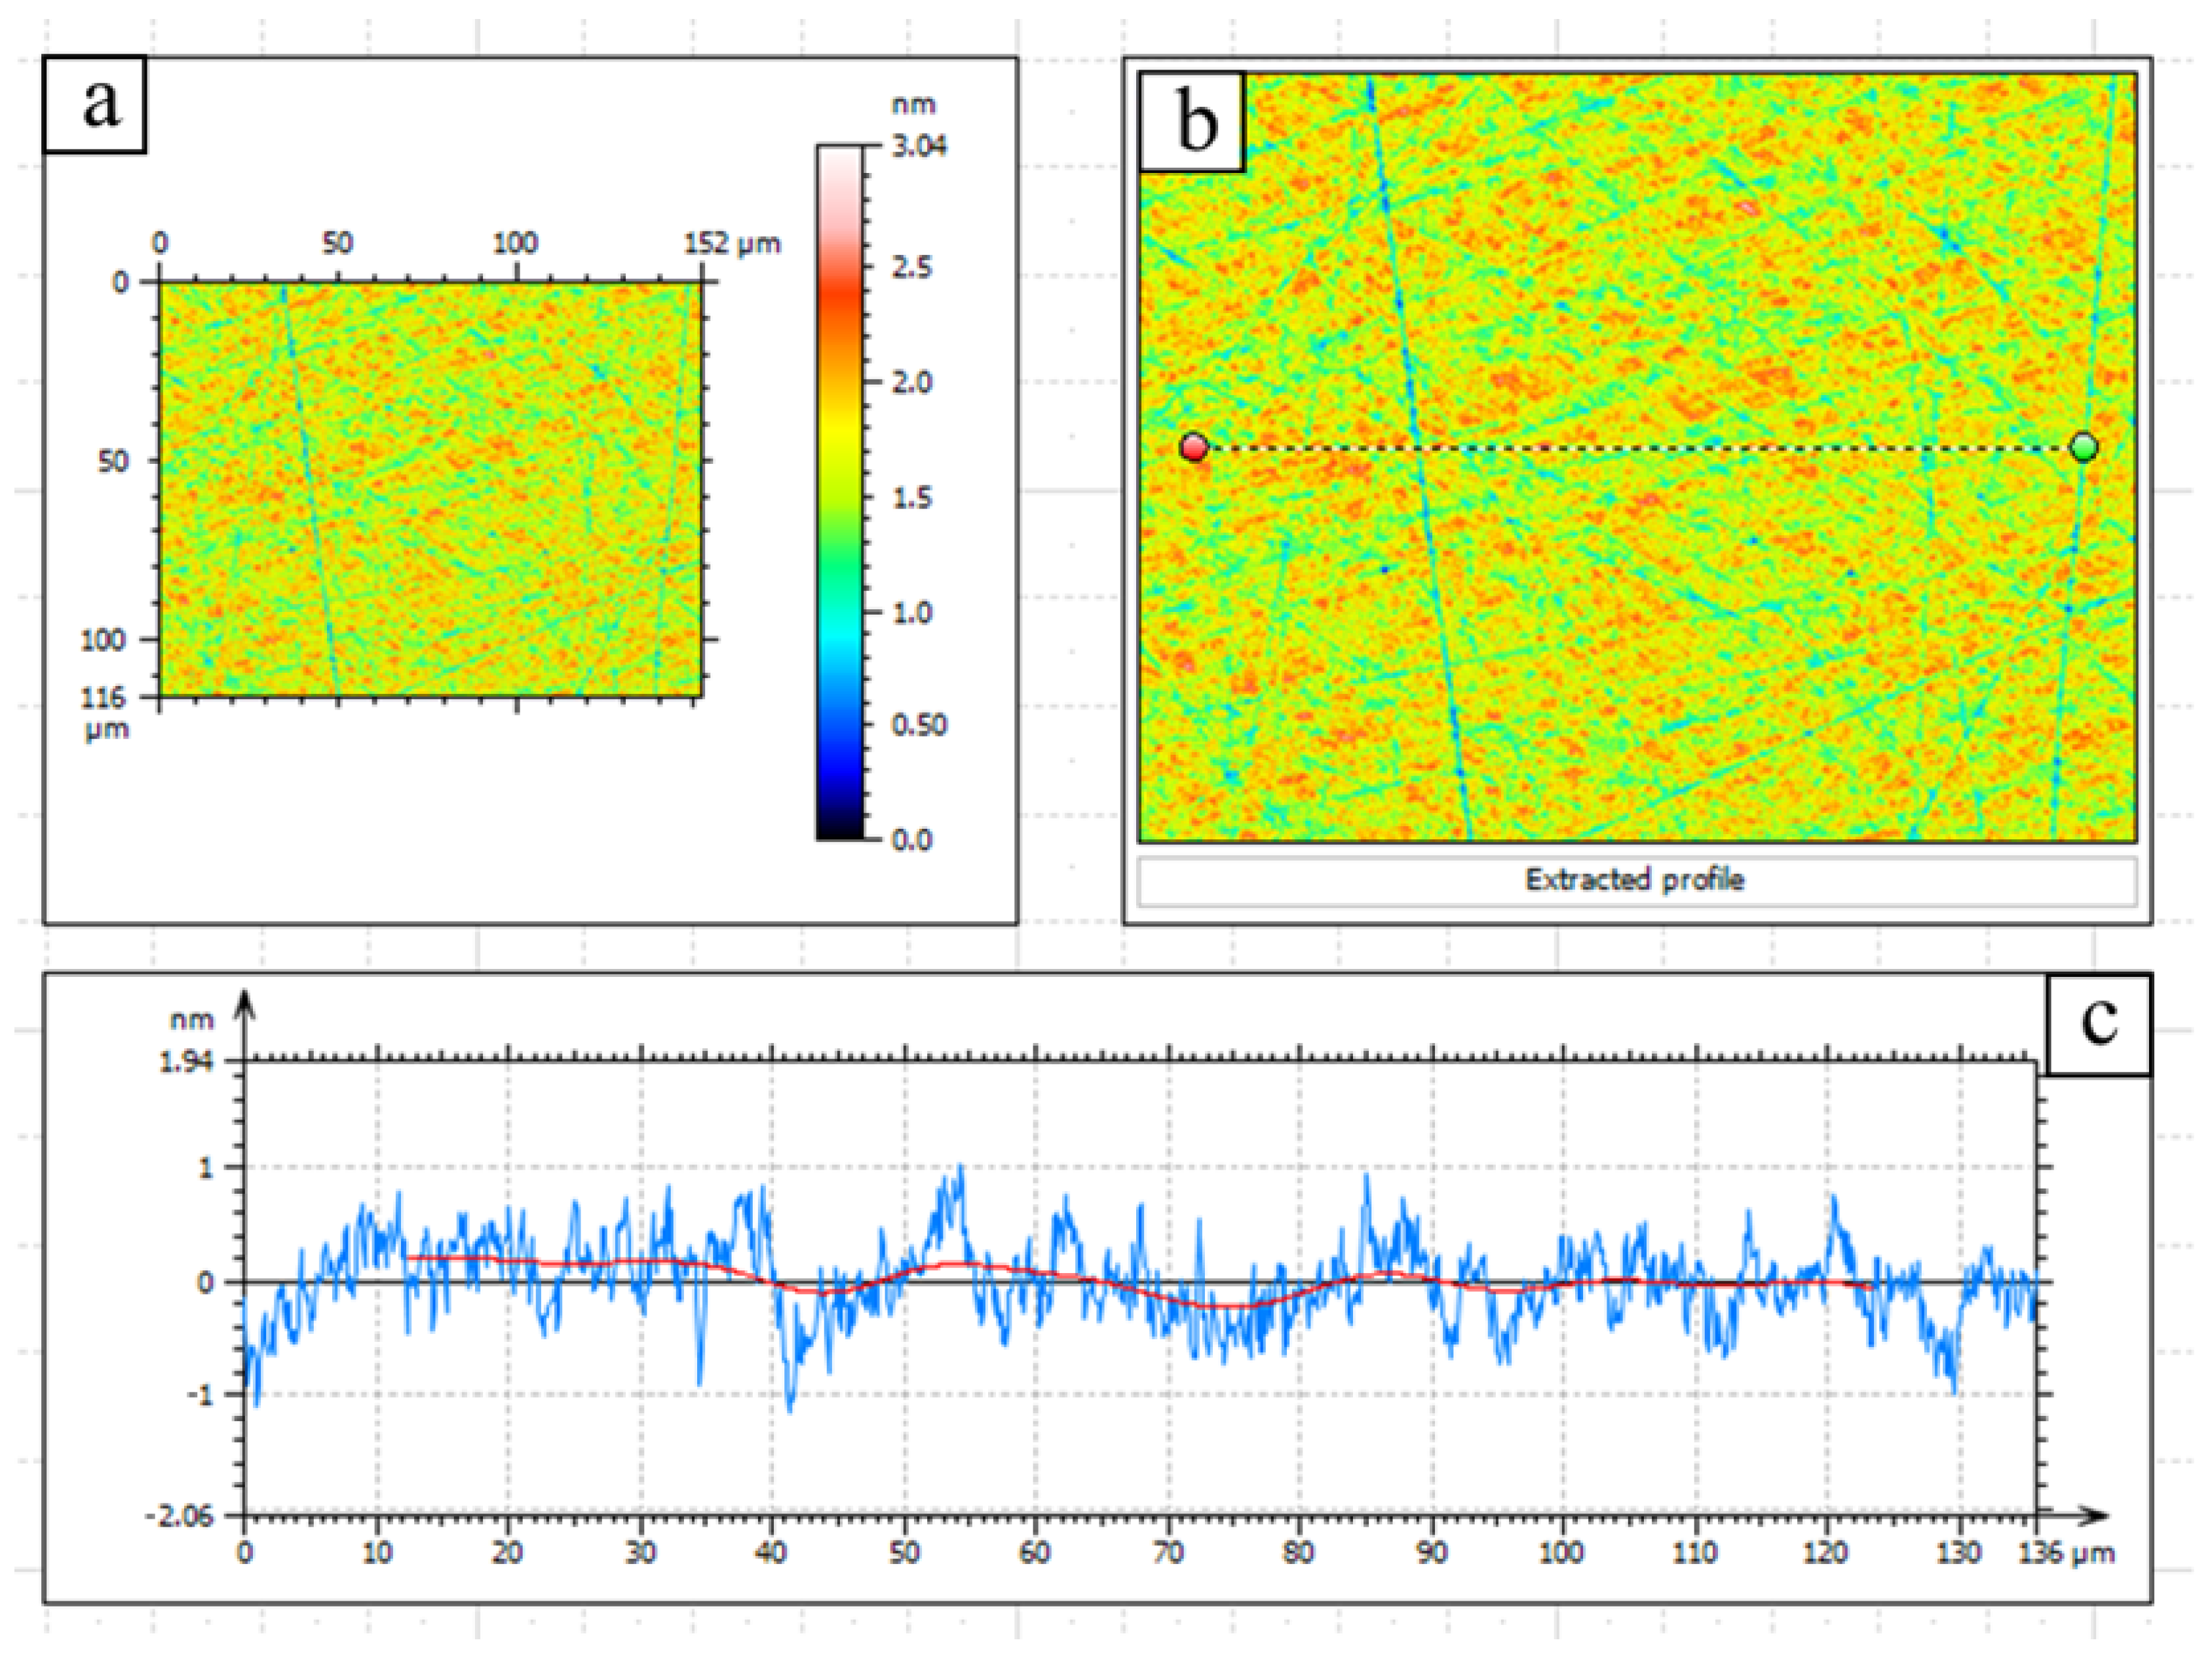
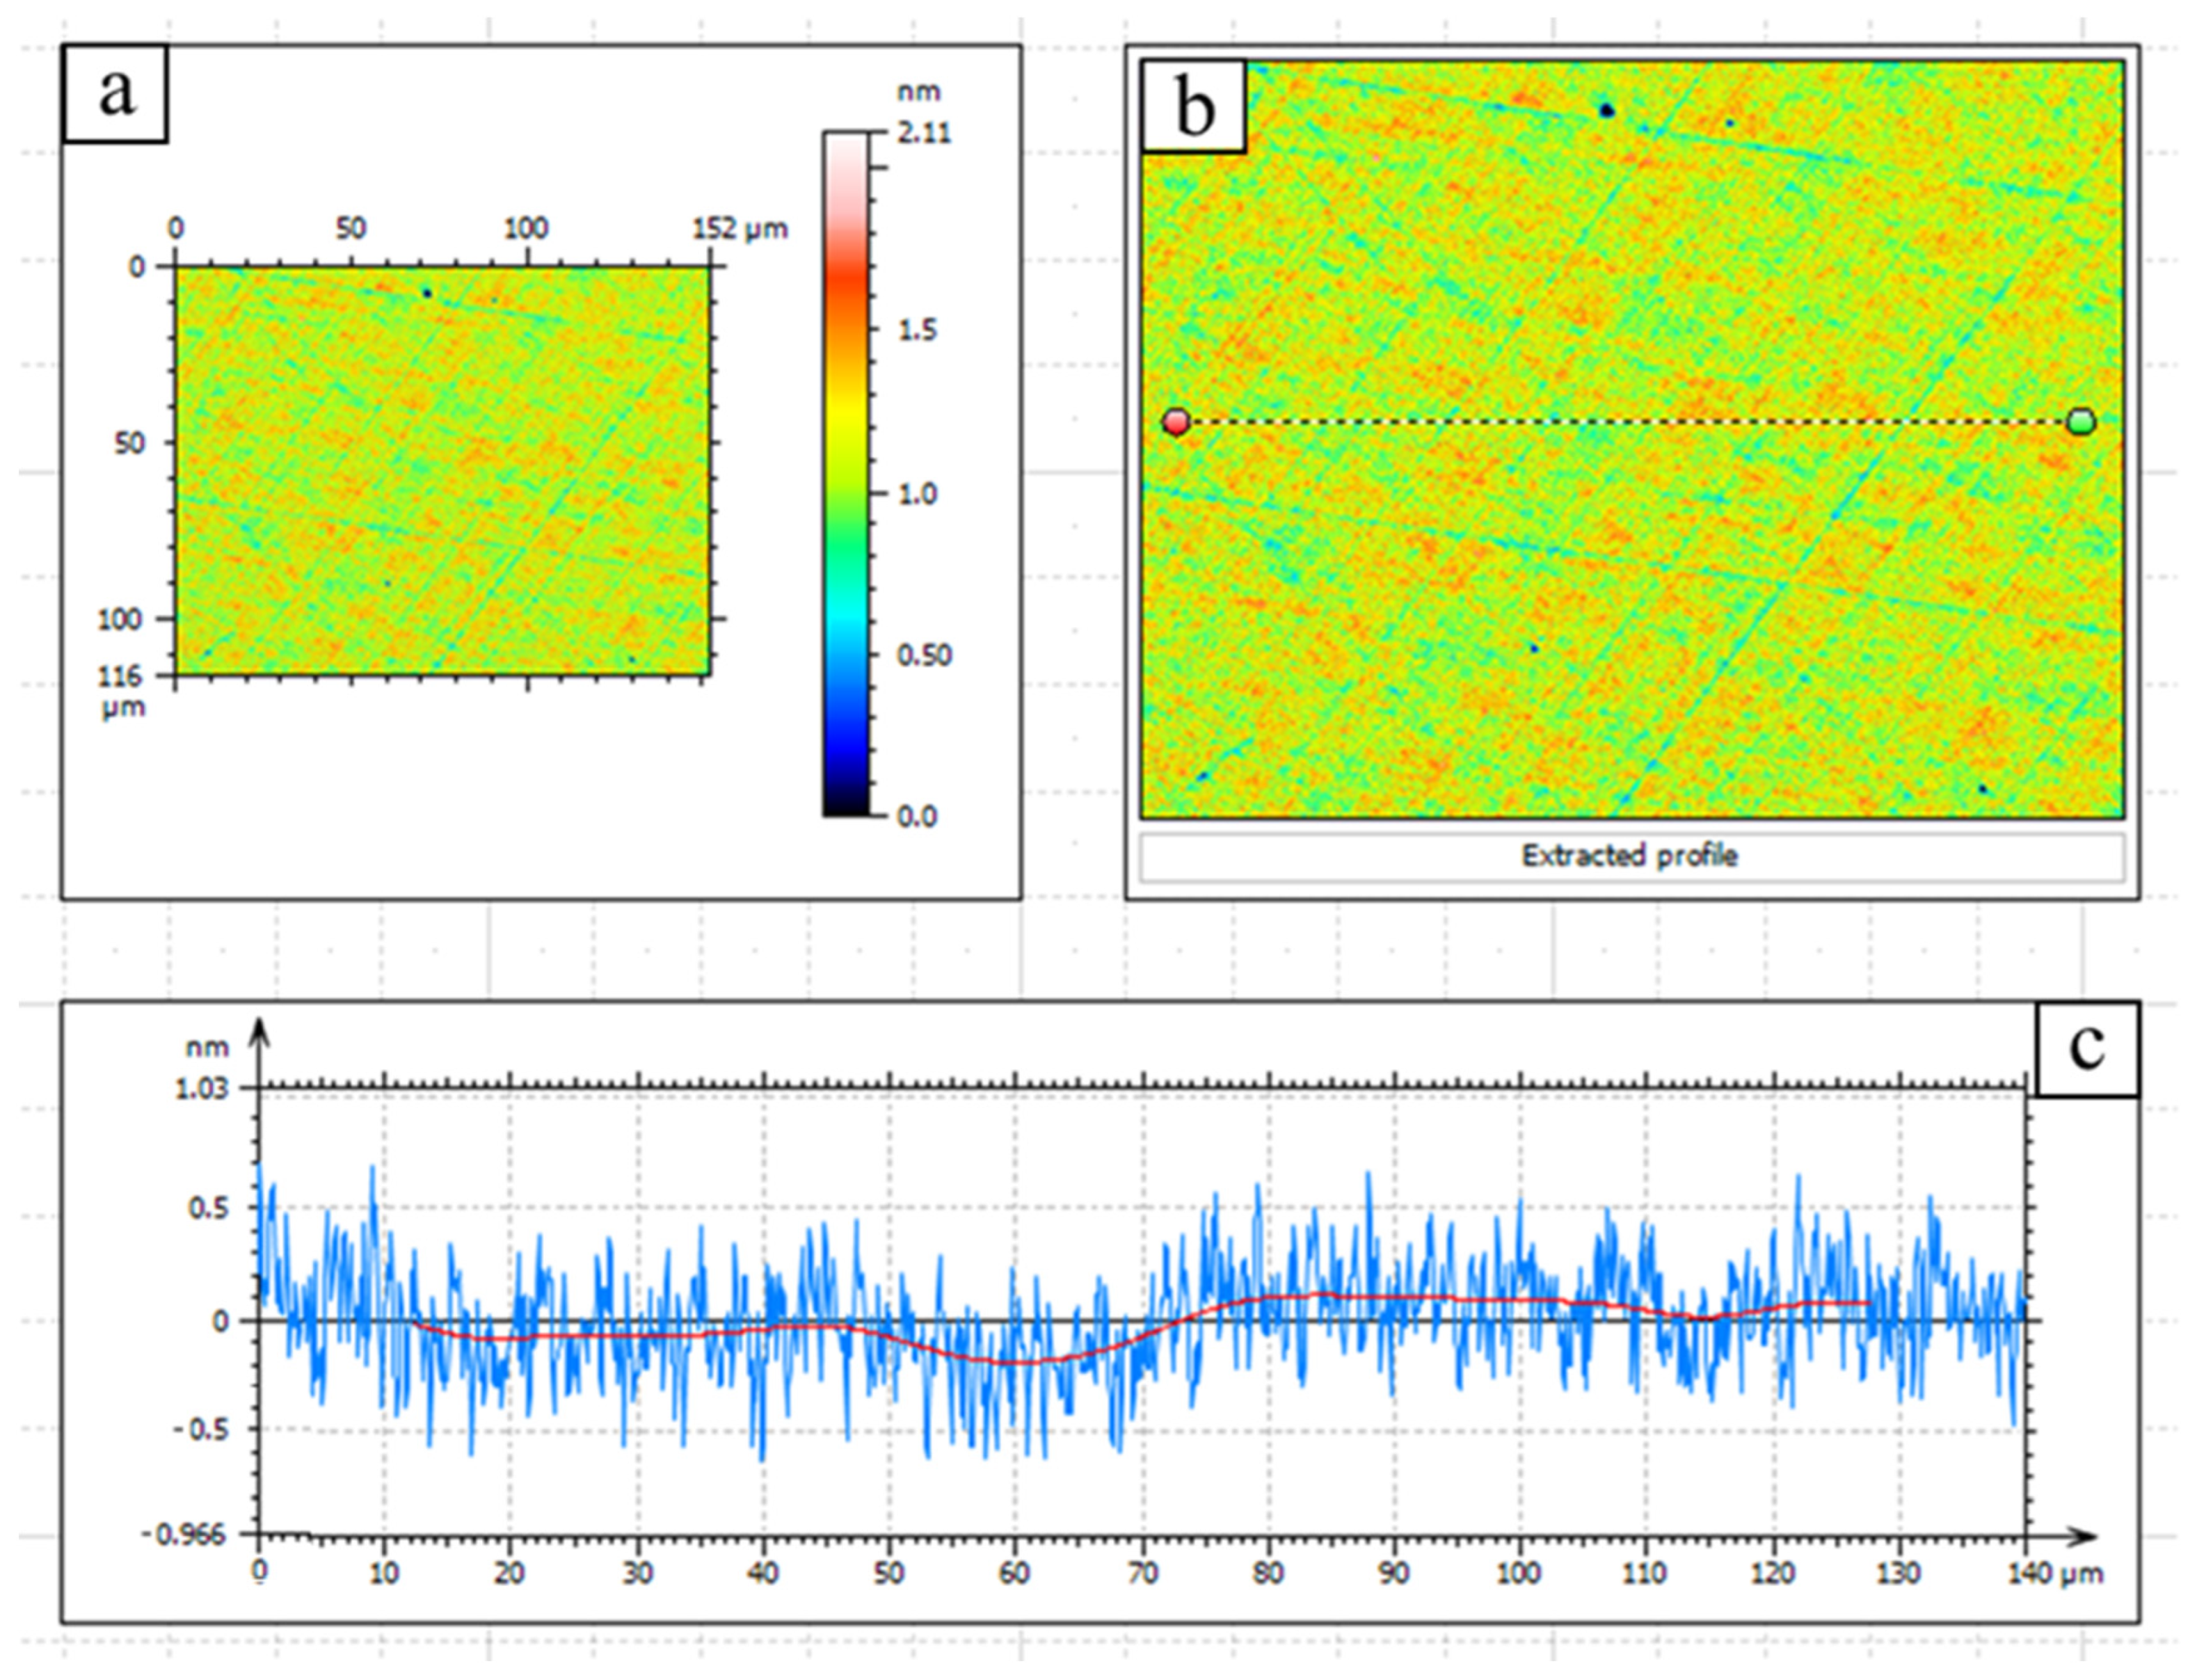
After the polishing process, the samples were washed in accordance with the conventional method and the MRP technology. Washing was carried out both on the working edges and on the lateral edges, on which glue was applied to fasten the individual elements into blocks. The main contaminants of the polished surface of ZGP were chemical impurities from the water used in the polishing process, residues of polishing resin and polishing powder, remnants of instant glue and picein, as well as fine dust particles. In the first stage, the glued block was placed in high-purity acetone (C₃H₆O) heated to a boiling point of ~50 °С for the gluing. After the gluing, the elements were washed in bidistilled water and placed on a glass support, then lowered into a container with acetone (these operations were performed with the constant irrigation of the crystal surface with bidistilled water to prevent the surface from drying out). Then, the container with acetone was placed in an ultrasonic bath (USB) (JP-030S, Skymen, Shenzhen, China), the frequency of the ultrasonic vibrations was 20 kHz, the power of the piezoelectric element was 50 W. The acetone in the ultrasonic system was heated to the boiling point, and the ultrasound was turned on. The elements in the USB were washed in boiling acetone for 40–50 min. The procedure was repeated 5 times. With each subsequent iteration, the acetone remaining after the process was poured out and pure acetone was poured into the bath. This was performed in order to prevent the contaminating components dissolved in the acetone from re-settling on the crystal surface. When removing the elements from the bath and replacing the acetone, the elements were continuously irrigated with acetone to prevent the crystal surfaces from drying out. Then, the glass holder with the elements was placed in a container with bidistilled water and transferred to an ultrasonic system filled with phosphoric acid (H₃PO₄) diluted with bidistilled water in a ratio of 1:3. Furthermore, the washing was carried out in the USB with heating up to 70 °С, and with a turned-on ultrasound for 10 min. Then, the glass holder with the elements was placed in a container with bidistilled water and transferred to the USB filled with bidistilled water. Washing was carried out in the USB at room temperature, and with a turned-on ultrasound for 10 min. Then, the glass holder with the elements was placed in a container with bidistilled water and transferred to the USB filled with boiling acetone. Washing was carried out with a turned-on ultrasound for 30 min. Then, the glass holder with the elements was placed in a container with bidistilled water and transferred to the USB filled with boiling isopropyl ethanol (CH₃CH(OH)CH₃) (70 °С). Then, the glass holder with the elements was placed in a container with bidistilled water, after which the elements were dried. At the final stage of washing, the optical control of the crystal surface was carried out using an optical microscope with 30× magnification. If necessary, fine contamination was removed using cotton swabs soaked in acetone. The washed elements were transported in special membrane containers (so that the working surfaces of the crystal did not touch the walls of the containers). The packing into the shipping containers was carried out in an atmosphere of inert argon gas.The surface roughness of samples 1 and 2 was measured on a 3D optical profilometer, MicroXAM-800 (KLA-Tencor, Milpitas, CA, USA). Sample 2 was measured twice before and after MRP. A PSI phase mode and a Nikon X50 lens (Tokyo, Japan) were used for all of the samples. The field of view was 116 μm × 152 μm. The following parameters were assessed in accordance with ISO 4287-2014: the root-mean-square roughness depth (R
q), the arithmetic mean deviation of the roughness profile from the midline (R
a), and the sum of the average absolute values of the heights of the five largest profile protrusions and the depths of the five largest profile valleys (R
z). The results of measurements of the surface roughness of samples No. 1 and No. 2 are shown in
Figure 1,
Figure 2 and
Figure 3.
The material loss from the surface after MRP was estimated using the gravimetric method, for which a Pioneer PA214C analytical balance (Ohaus, Parsippany, NJ, USA) with a measurement resolution of 0.0001 g was used. The density taken in the calculations of the material loss from the surface was 4.16 g/cm3.
3. Setup Parameters and the Technique for the Determination of the LIDT Threshold of the Samples under Study
A Ho:YAG laser generating radiation at a wavelength of 2097 μm, pumped by a continuous thulium fiber laser, was the source of radiation. The Ho:YAG laser operated in the active Q-switched mode with a pulse duration of τ = 35 ns and a pulse repetition rate of 10 kHz. The measured diameter in all of the experiments was d = 350 ± 10 μm at the e−2 level of the maximum intensity. The maximum average radiation power generated by the Ho:YAG laser was 20 W in a linearly polarized Gaussian beam (parameter M2 ≤ 1.2).
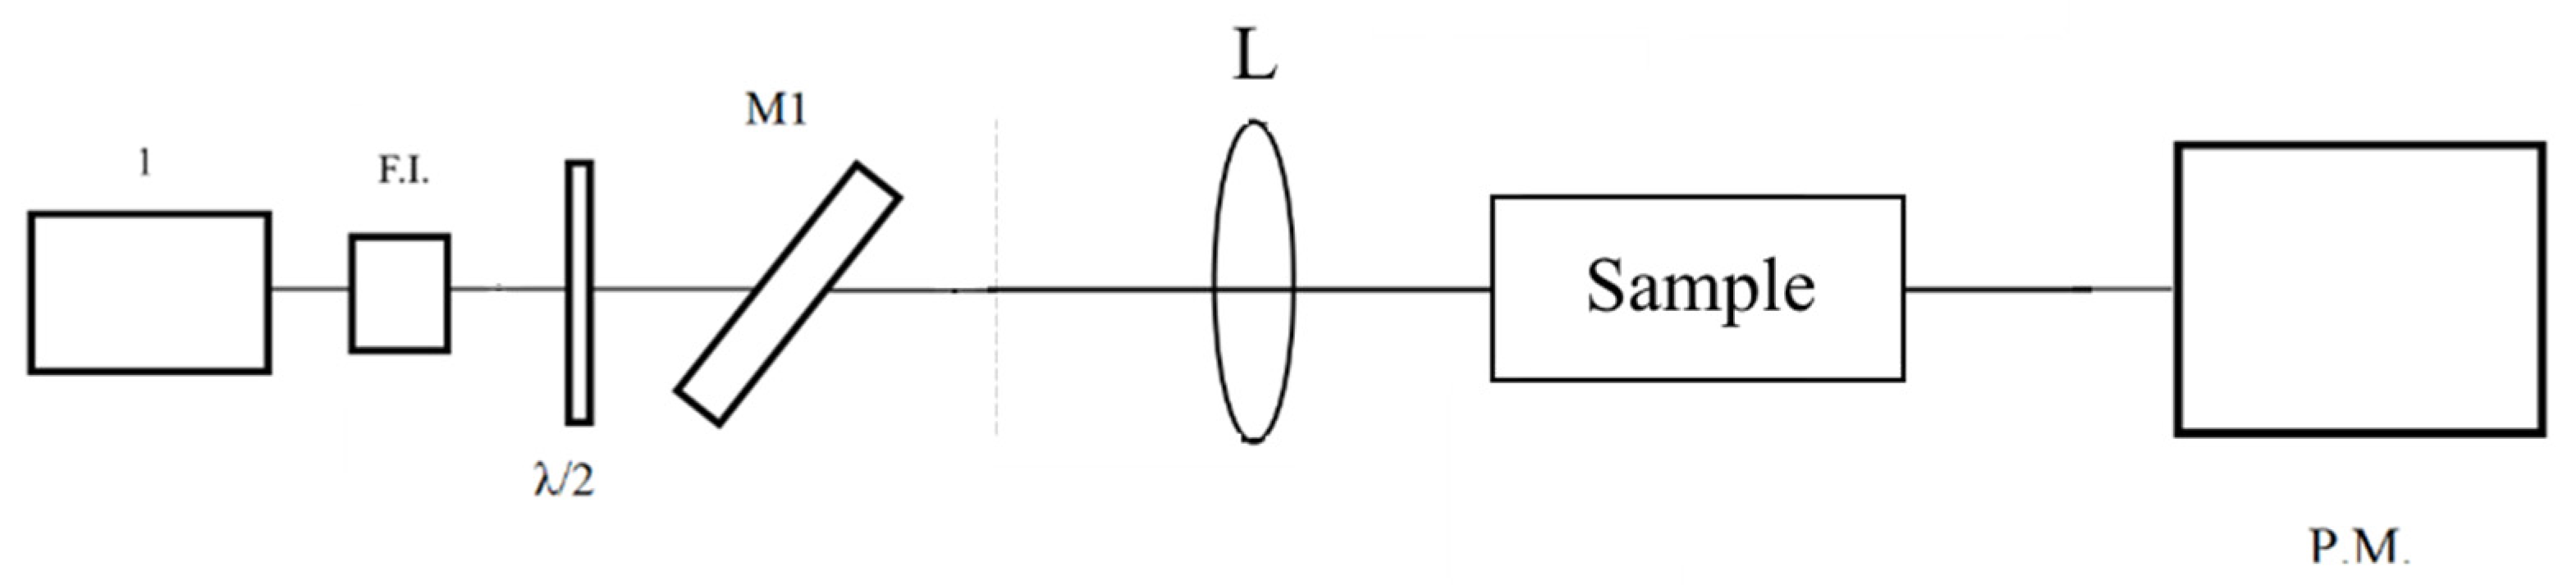
The schematic layout of the experimental stand is shown in
Figure 4. The power of the incident laser radiation was changed using an attenuator consisting of a half-wave plate (λ/2) and a polarizing mirror (M1). A Faraday isolator (F.I.) was used to prevent the reflected radiation from entering the laser, which prevented an uncontrolled change in the parameters of the incident radiation. The average laser power (Pav) was measured before each experiment with an Ophir power meter (P.M.), 30(150)A-BB-18, Jerusalem, Israel.
According to the international standard ISO11146 [
23], the effective area of a Gaussian beam is determined as S = πd
2/4 [
23]. The energy density of the laser radiation was determined by the following equation:
The energy density of the laser irradiation was determined by Equation (2):
where d is the diameter of the laser beam, f is the pulse repetition rate, and τ is the duration of the laser pulses.
The “R-on-1” technique was used to determine the LIDT of the samples, which requires less space on the sample surface compared to the “S-on-1” technique, and therefore can be used for samples with a limited aperture; however, it is considered coarser [
24]. The essence of this technique is that each individual region of the crystal is irradiated with laser radiation with a sequential increase in the intensity of the laser radiation until an optical breakdown occurs or a predetermined value of the energy density is reached. In our work, the study was carried out with an exposure duration of τ
ex = 5 s. The sample under study was exposed to packets of laser pulses with a fixed energy density level, which did not cause damage to the crystal surface. Then, the energy density level was increased with a step of ~0.1 J/cm
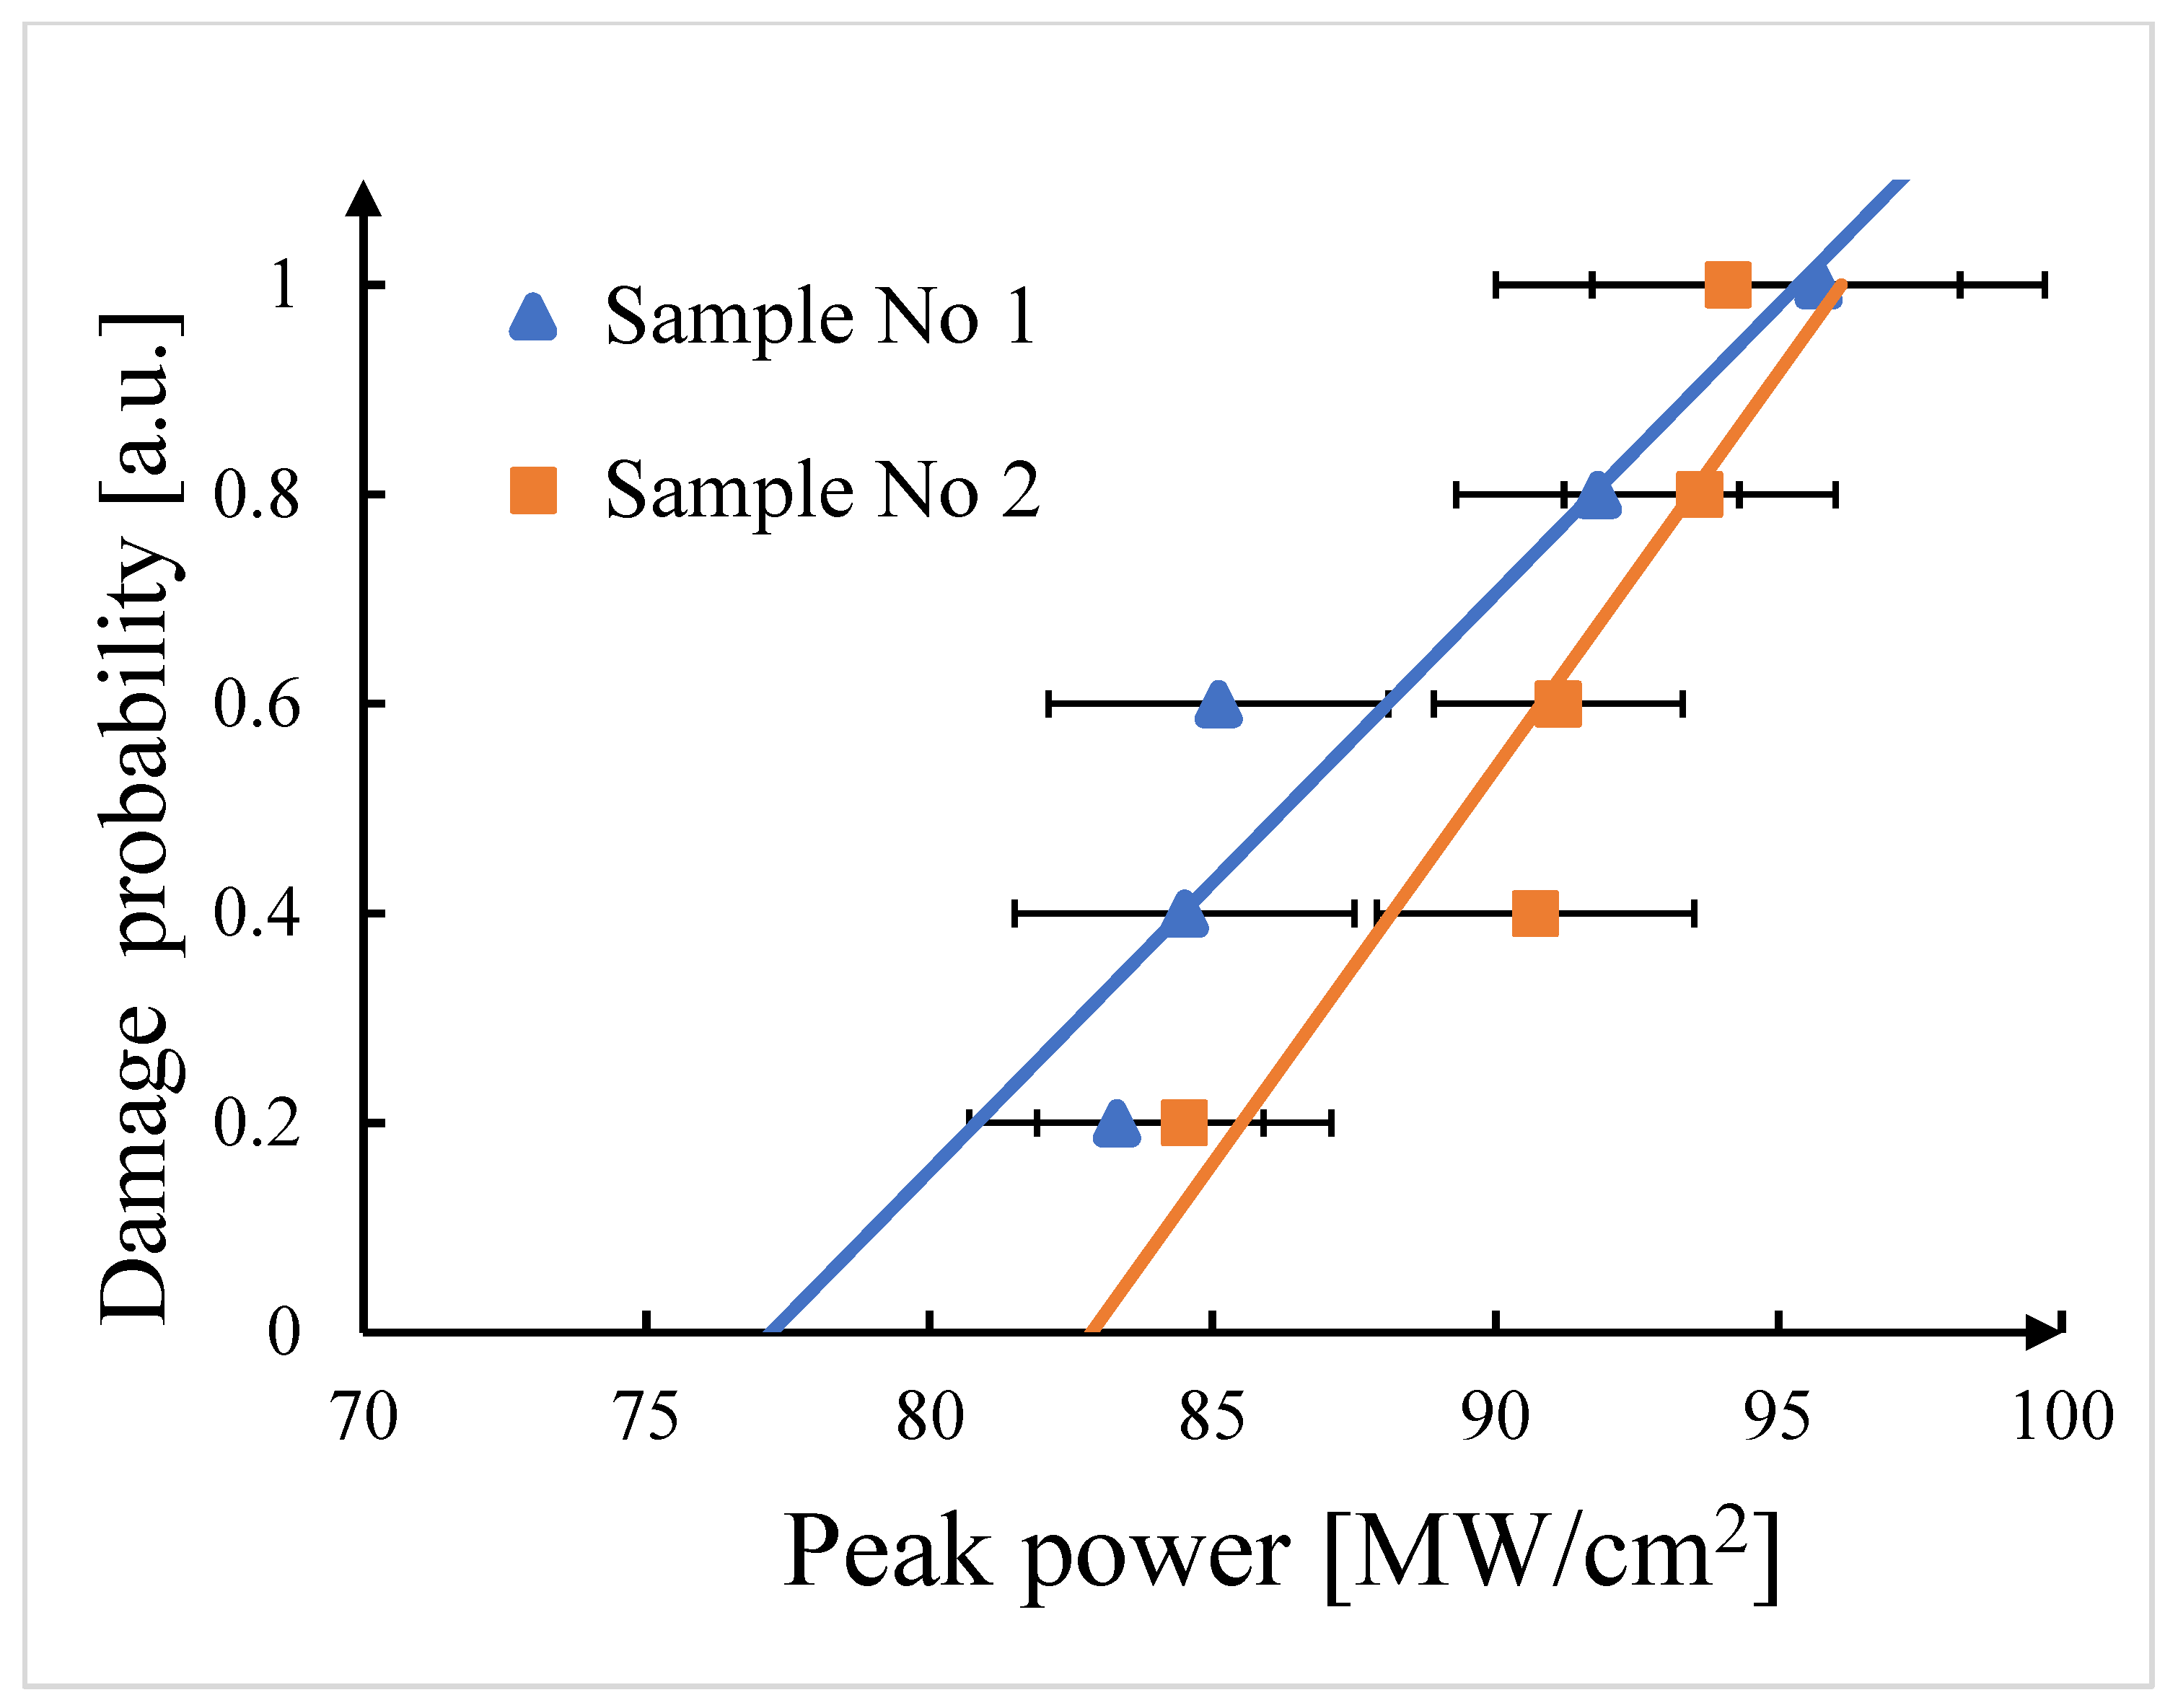
2. The experiment was terminated when visible damage appeared on one of the surfaces of the nonlinear element. Then, the sample was moved 0.5 mm in height or width using a two-dimensional movement; the experiment was repeated five times. The optical breakdown probability was obtained by plotting the cumulative probability versus the optical breakdown energy density. The value of the LIDT (W
0d) was taken to be the energy density corresponding to the approximation of the optical breakdown probability to zero.
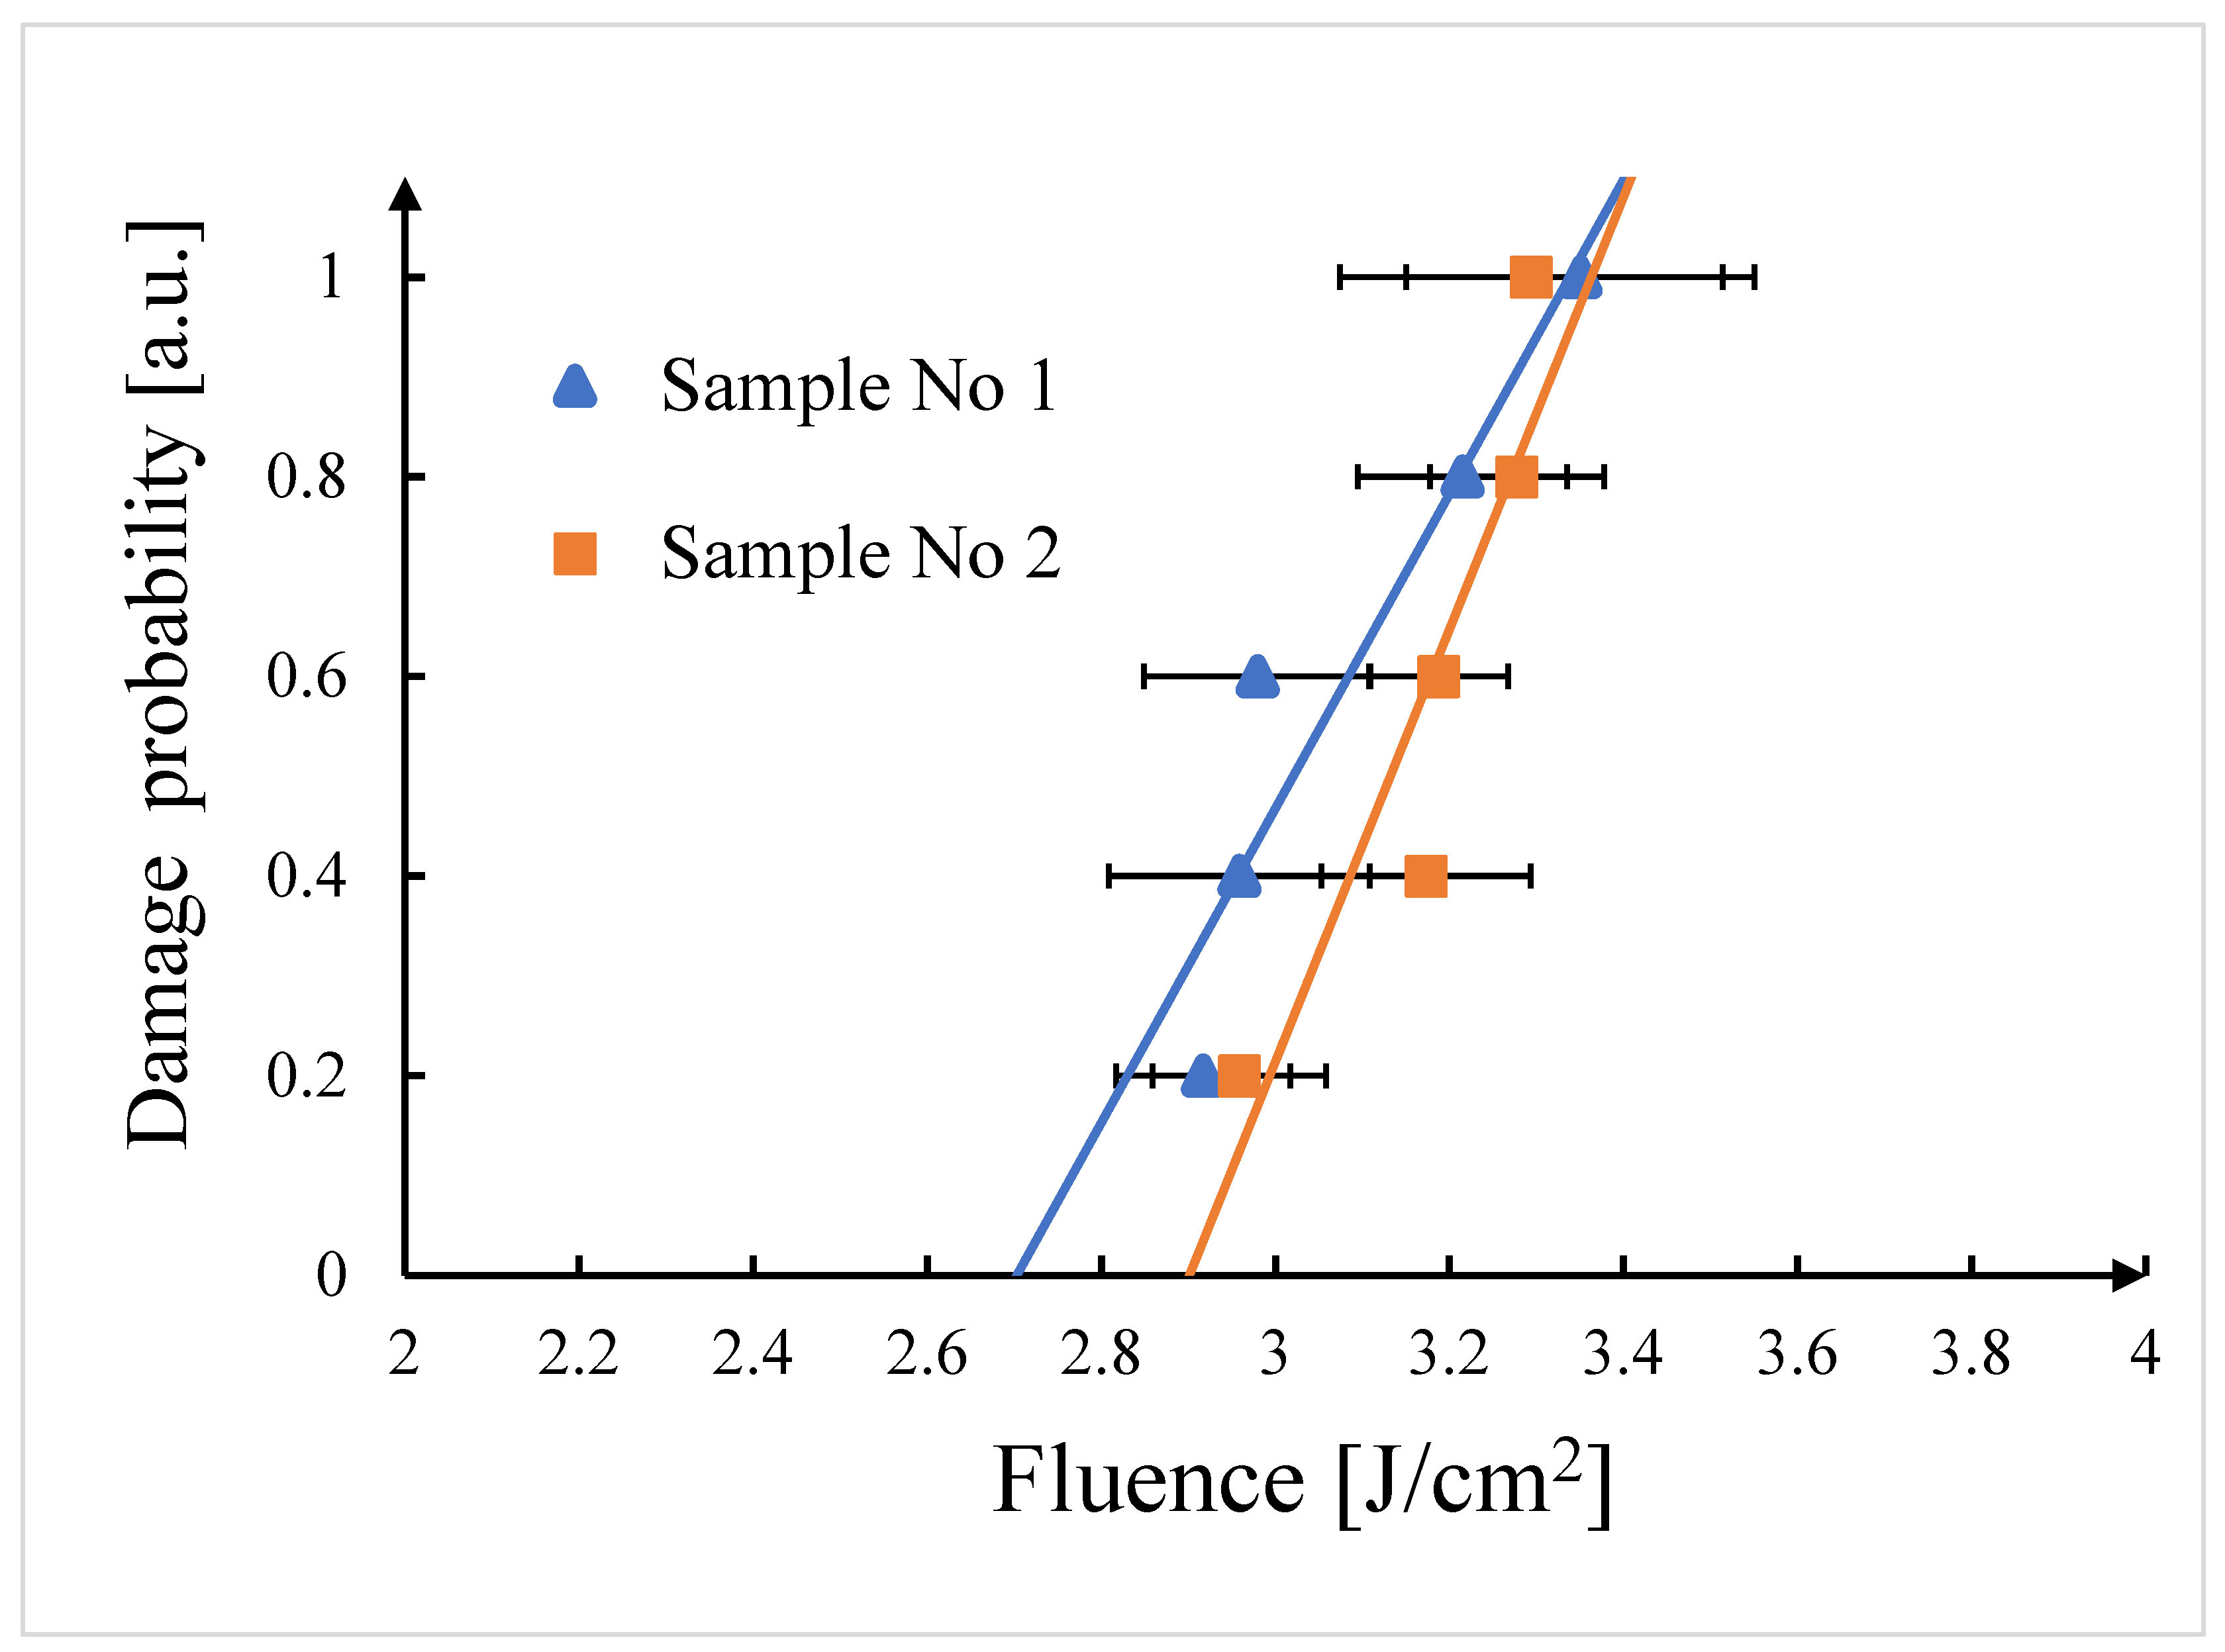
Figure 5 shows the results of the measurement of the LIDT using the R-on-1 technique. In the presented plots, the ordinate represents the probability of optical breakdown in relative units, normalized to unity, and the abscissa represents the energy density of the testing laser radiation.
The average value of the threshold energy density Wav and the mean square error of its determination
were calculated for each series of measurements after which an optical breakdown was observed, using the following equations:
where
N is the total number of damaged areas,
Wi is the threshold energy density in one of the irradiated regions, and
ni is the number of regions with a breakdown threshold
Wi.
To find the confidence interval of the LIDT value (
WD)
where
k is Student’s coefficient; Student’s t-distribution was used for the confidence probability [
25,
26].
where Γ is the gamma function.
After the absorption of the samples was determined, the values of the LIDT were obtained in terms of the energy density,
, and the power density,
, of the testing laser radiation at the probability P
D = 0 for each sample, according to the method described above. The average value of the energy density,
, and the power density,
, of the testing radiation, at which the optical breakdown of the sample occurred, was calculated using Equations (1)–(6), and the confidence interval of the LIDT of the values in terms of energy density,
, and power density,
, at a confidence level of 0.98 was determined. The experimental results are presented in
Table 2.
4. Experimental Results and their Discussion
The results of the measurement of the roughness parameters of the samples are presented in
Table 3.
The analysis of the surface topography of sample No. 1 and sample No. 2, polished using conventional technology, showed that the surface relief was formed under the influence of the multidirectional movement of the working tool; there are single extended scratches up to 1.3 nm deep. The surface topography of sample 2 after MRP did not contain the indicated scratches, and is represented by a less-textured profile formed under the influence of a magnetorheological fluid. A significant improvement in the roughness parameters by 1.37–1.42 times was observed near the surface after MRP. In contrast to [
17,
18], where the authors reached the nanometer and subnanometer level of the surface roughness of the ZGP crystal samples, the samples studied in this article had an Angstrom roughness level of Ra 2.27 Å for sample No. 1 and Ra 1.54 Å for sample No. 2 after MRP.
All of the surfaces have single point depressions, most likely due to the imperfection of the internal structure of the crystal. These defects are hardly noticeable after traditional polishing because they are partially or completely erased. After MRP, the material is removed from the surface practically without any damage, which more clearly visualizes the areola of the defect and allows the establishment of the true size of the point structural imperfection, i.e., 0.5–1.5 µm.
The removal of the material after MRP from the surfaces of sample 2 was as follows: side A was 6.95 μm and side B was 9.50 μm. In fact, an area of 22 mm × 20 mm instead of 6 mm × 6 mm was treated after MRP. Therefore, the total processing time for side A was 435 min, and for side B it was 345 min. If we subtract the time associated with the acceleration and reversal of the working tool from the total MPR time, then the effective time spent on the working tool on the crystal surface was 8.2% of the total time: for side A it was 28 min, and for side B it was 36 min. In this regard, it is advisable in the future to provide a group type of crystal processing during MRP to increase the efficiency of the use of the equipment.
Figure 5 and
Figure 6, and
Table 2 show the results of the LIDT study of sample No. 1 (polished using conventional technology) and sample No. 2 immediately after MRP polishing.
As can be seen from the results of the determination of the LIDT (
Figure 5 and
Figure 6, and
Table 2), the difference in the LIDT in the energy density and the power density for two samples fits into the error of the LIDT determination technique, even though a significant improvement in the roughness parameters by 1.37–1.42 times was observed on the surfaces of sample No. 2 after MRP. At first, the results obtained contradicted the data [
17,
18], in which an improvement in roughness parameters by 2.1 times led to an increase in LIDT by 1.6 times. However, it should be noted that, in [
17], the R
z parameter was reduced from 225 nm to 41 nm, and the R
q parameter was reduced from 1.2 nm to 0.57 nm (the minimum achieved value of the R
z parameter was an order of magnitude larger than the dimension of the parameters of the ZGP crystalline lattice). Based on the results presented in
Table 3, both polishing techniques presented in this article allowed us to obtain a surface with a roughness (estimated by the parameters R
a, R
q, and R
z) of the same order of dimension with the parameters of the unit cell of the ZGP crystalline lattice (a = b = 0.547 nm and c = 1.07 nm,
Table 1).
The absence of a distinguishable difference in the breakdown threshold for the two samples is most likely conditioned upon the fact that the LIDT value at the indicated orders of magnitude of the surface roughness parameters is determined not by the quality of polishing, but by the number of point depressions caused by the physical limitations of the structural configuration of the crystal volume. These results are in good agreement with the assumption made in [
14] about the significant effect of the concentration of dislocations in a ZGP crystal on LIDT. It was noted in [
27] that at a sufficiently low concentration, zero-dimensional defects (dislocations, bulk defects), practically without affecting the conditions of radiation propagation due to a weak shadow effect, can significantly reduce the LIDT at the points of their emergence on the surface, playing the role of “nuclei” (or “weak links”), from which the irreversible process of the matrix crystal destruction begins under the action of optical beams of extreme intensity. It can be assumed that the observed point depressions, which are clearly distinguishable during MRP polishing—having dimensions of 0.5–1.5 µm—are a consequence of the “emergence” of dislocations on the surface during the polishing process. As is known, mechanically stressed regions emerge around the dislocations, the presence of which in the process of polishing can cause the appearance of detected point depressions with the above dimensions. An alternative explanation of the results obtained is the presence of volume defects 0.5–1.5 μm in size in the studied ZGP crystals due to the presence of impurities of the intrinsic components in the initial synthesized material, in the form of binary phosphides of zinc and germanium (Zn
3P
2, ZnP
2, GeP). These defects could not have been detected during the characterization of the samples under study, as the resolution of the digital holographic camera used to detect volumetric defects is 3 μm, which is half the size of the detected irregularities. The detective power of the X-ray structural analysis may also have turned out to be insufficient. From the above, it can be assumed that some of the possible ways to increase the LIDT are to further improve the technology of synthesis and crystal growth, to minimize defects in the crystal structure, and to improve the characteristics of the optical coatings.
5. Conclusions
Samples of a single-crystal ZnGeP2 with an angstrom level of surface roughness were investigated in this article. Magnetorheological processing was applied to polish the working surfaces of the single-crystal ZGP, in which a non-aqueous liquid with magnetic particles of carbonyl iron with the addition of nanodiamonds was used. The material showed good polishability: MRP led to a significant improvement in the surface roughness parameters by 1.37–1.42 times (Ra 1.54 Å), compared to the conventional crystal polishing technique (Ra 2.27 Å) using an aqueous suspension based on diamond powder and a resin pad. The removal of the material from the crystal surface after MRP ranged from 6.95 to 9.5 μm. Moreover, the use of MRP allowed the more accurate characterization of possible structural defects that emerge on the surface of a single crystal and have a size of ~0.5–1.5 μm. The useful processing time of the 6 × 6 sample was 8.2% of the total processing time. It is recommended to use the group type of crystal processing during MRP in order to minimize the time spent on the idling and reverse of the working tool, which will significantly increase the efficiency of the use of the industrial equipment. Thus, both polishing methods allowed us to obtain an Angstrom level of surface roughness comparable in its order of magnitude with the unit cell parameters of the ZGP crystalline lattice, which indicates that the surface quality after MRP is close to the maximum possible.
Despite the fact that the sample subjected to MRP showed a significant improvement in the surface roughness parameters compared to the sample polished using the conventional technology, the LIDT remained practically unchanged. The absence of a difference in the breakdown threshold for the two samples was most likely due to the fact that the LIDT value at Angstrom parameters of surface roughness is determined to a greater extent not by the quality of polishing, but by the physical limitations of the structural configuration of the crystal. It has been suggested that the LIDT is most influenced by dislocations or volume defects “emerging” on the polished surface, rather than by the roughness level. Thus, at the Angstrom level of roughness, the decisive factor affecting the LIDT value is the concentration of bulk defects “emerging” on the crystal surface.


 ,
, 


