Abstract
In this work, we train a hybrid deep-learning model (fDNN, Forest Deep Neural Network) to predict the doping level measured from the Hall Effect measurement at room temperature and to investigate the doping behavior of Si dopant in both (100) and (010) β-Ga2O3 thin film grown by the metalorganic vapor phase epitaxy (MOVPE). The model reveals that a hidden parameter, the Si supplied per nm (mol/nm), has a dominant influence on the doping process compared with other process parameters. An empirical relation is concluded from this model to estimate the doping level of the grown film with the Si supplied per nm (mol/nm) as the primary variable for both (100) and (010) β-Ga2O3 thin film. The outcome of the work indicates the similarity between the doping behavior of (100) and (010) β-Ga2O3 thin film via MOVPE and the generality of the results to different deposition systems.
1. Introduction
Recently, β-Ga2O3 has attracted significant attention in academia and industry as one of the potential candidates for power-electronics application due to its wide bandgap of 4.9 eV and a high theoretical breakdown voltage of up to 8 MV/cm2 [1]. A critical advantage of β-Ga2O3 is the availability of large, high-quality native substrates grown from the melt using various techniques, such as the Czochralski method [2,3], the floating-zone techniques [4,5], edge-defined film-fed growth (EFG) [6], and the vertical Bridgman method [7], which allows for the economically practical manufacturing of β-Ga2O3 when compared to other wide-bandgap semiconductors. Due to these properties, β-Ga2O3 is considered a potential alternative to GaN and SiC for future power electronics [8]. As for most semiconductor device applications, a well-controlled doping process is crucial, including a precise doping level, doping uniformity, and doping profile. Group IV elements, such as Ge [9,10], Sn [11], and Si [12], are the potential n-type dopants to the β-Ga2O3 thin films. Si, due to a wide doping range (1 × 10¹⁷ to 8 × 1019 cm−3) and low “memory effect” in the reactor chamber [12], has attracted great interest for the doping of β-Ga2O3 thin film grown by MOVPE.
Doping is a kinetically controlled process that is strongly influenced by growth conditions. However, the nonlinear correlation between the parameters in the MOVPE process (i.e., the metal and oxidant precursor concentrations, temperature, dopant concentration, etc.) creates a multidimensional parameter space such that optimization for a specific application is challenging and time-consuming. Therefore, finding a predictive empirical relation that results in the desired doping level has become a challenge in thin-film research. In the field of MOVPE-grown β-Ga2O3, the observed doping level is usually limited to two situations: (1) only the relation between the doping level and a single process parameter is revealed, e.g., the chamber pressure [13,14] and the concentration of the Si precursor [12,15], and (2) the reported results are usually collected in different deposition systems, which are difficult to be applied to other systems directly. To deal with the above limitations, data-driven approaches such as machine learning and deep learning are seen as promising tools that are applied to explore the ample process-parameter space and understand the nonlinear relationship between them [16], and have already demonstrated a wide application in different research topics such as bulk crystal growth [17,18,19,20], thin-film growth [21,22,23], molecular-property prediction [24,25,26], and chemical-reaction development [27]. Nevertheless, the available dataset in lab-level research is usually small due to the limited workforce and faculty resources, which is a critical issue for a data-driven methodology such as deep learning. Building a predictive model for the lab-level research is challenging since the number of fabricated samples (n) is usually smaller than the number of process parameters (p), which is commonly known as the “large p, small n” problem [28], and raises both the risk of overfitting and the challenge of high-variance gradients while training the neural network. In the recent progress of the field of bioinformatics, Kong et al. [29] proposed a novel deep-learning framework to vastly enhance the prediction accuracy with a hybrid structure of the random forest and neural network, named Forest Deep Neural Network (fDNN). This framework has a relatively higher prediction accuracy than existing methods for the “large p, small n” problem. Inspired by their work, we implemented the fDNN model to investigate the doping behavior of β-Ga2O3 thin film. The parameter space of our dataset was chosen to cover several orders of magnitude in order to generalize the modeling results over the space and to identify the parameter windows for different doping levels. The results of the fDNN were used to explain the experimental findings within the multidimensional parameter space, and an empirical relation was provided based on the insight of the fDNN. In the current work, we identified the critical growth parameter describing the free-electron concentration of the MOVPE-grown Si-doped β-Ga2O3 thin film (both (100) and (010) orientations) with the help of the fDNN model and our experimental dataset. The dataset used for the model training consisted of 104 samples of (100)-oriented films with a low defect density [30,31], and all of the incorporated Si in the films was expected to be electrically active. To further examine the robustness of the developed model, another dataset consisted of 15 samples of (010)-oriented films from our previous results [12], and results from the literature were extracted and fitted with satisfying results [15].
2. Materials and Methods
2.1. Experimental
The MOVPE system used in this work consisted of a vertical showerhead low-pressure reactor (Structured Materials Industries, Inc., Piscataway Township, NJ, USA) equipped with a rotating susceptor that was utilized for the deposition of n-type β-Ga2O3 thin films. Triethylgallium (TEGa) was used as the metalorganic precursor for Ga and Tetraethylorthosilicate (TEOS) was used as the metalorganic precursor for the n-type doping by Si, while O2 (5N) was used as the oxidant. High-purity Ar (5N) acted as the push gas. High-quality, semi-insulating (Mg-doped, [Mg] = ~2 × 1018 cm−3) (100) β-Ga2O3 substrates were grown by the Czochralski method [2] at Leibniz-Institut für Kristallzüchtung (IKZ) and commercial, semi-insulating (Fe-doped, [Fe] is in the range of 1 to 4 × 1018 cm−3) (010) β-Ga2O3 substrates were grown by the EFG method [6]. To reduce possible Si contaminants on the substrate surface, the substrates were immersed in hydrofluoric acid (5%) for 5 min and then rinsed with deionized water before being loaded into the chamber. The experimental parameter space for the β-Ga2O3 thin film dataset in this work is summarized in Table 1. The electrical data (doping level and mobility) were obtained by conductivity and Hall Effect measurements at room temperature in a van-der-Pauw configuration using small InGa eutectic contacts that exhibited ohmic behavior. The chemical concentration of the incorporated Si dopant and the thickness of the grown films were determined by the secondary ion mass spectrum (SIMS) performed by RTG Mikroanalyse GmbH Berlin. The thickness of the grown films was also determined by a LayTec in situ process monitoring system (multi-wavelength reflectance, EpiTT and EpiNet 2017). Since the reflectance spectroscopy required a significant contrast in the refractive index between film and substrate, we used reference films that were simultaneously grown in the same runs on sapphire substrates. For several deposition runs of β-Ga2O3 on (100) and (010) β-Ga2O3 substrate, we could verify the same or comparable thickness by transmission electron microscopy (TEM) and SIMS to that of the films deposited on sapphire substrates.

Table 1.
The process parameters and their range in this work.
2.2. Machine-Learning Methodology
The fDNN model consists of two parts: A random-forest part and a neural-network part, as shown in Figure 1. The random-forest part is a feature selector to learn sparse feature representations from raw inputs under the supervision of training labels, and the neural network part is to predict outcomes for the new feature representations selected by the random-forest part. The detailed derivations of the random forest and the Forest Deep Neural Network refer to Leo Breiman [32] and Kong et al. [29].
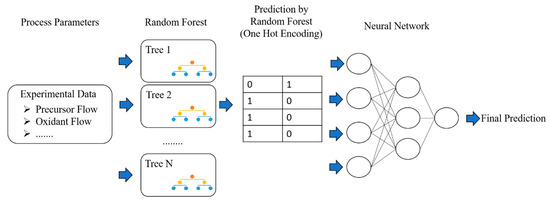
Figure 1.
The simplified structure of the fDNN model in this work based on Ref. [29].
The experimental data that were input into the machine-learning model can be categorized into two groups: growth parameters such as precursor concentration, chamber pressure, growth temperature, etc., and measurement values such as film growth rate and free-carrier concentration. The process parameters were controllable and set by the operator, and the measurement values were collected by the methodologies described in the experimental section. The following 6 inputs (growth parameters) were entered for the initiation training: growth temperature (°C), chamber pressure (mbar), TEGa molar flow (mol/min), TEOS molar flow(mol/min), oxygen molar flow(mol/min), and push gas (sccm). The target variable was the free-carrier concentration (doping level) that was measured by the Hall Effect measurement. In general, the free-electron concentration measured by the Hall Effect measurement may deviate from the chemical-dopant concentration due to structural defects such as incoherent twin boundaries [33], the point defects such as gallium vacancies [1,34], or the residual impurities such as Mg [35] and Fe [36], which significantly lower the doping efficiency and deteriorate the electrical properties. For the films investigated in this work, the structural defects were not observed under transmission electron microscopy (TEM) [12] or eliminated by applying substrate miscut [30,37] for the (010) and (100) cases, respectively, and the residual impurities in the selected samples of this work were also far below the doping level. Therefore, the point defects became the primary compensating acceptor in our consideration. The gallium vacancies and their complexes might play a dominant role [38,39]. In some related works [12,40], the concentration of the gallium vacancy was found with to be <1 × 1016 cm−3, which is far lower than the dopant concentration range (1017–1019 cm−3) that we investigated in this work. As a result, the measured free-electron concentration was expected to be close to the chemical concentration of Si measured by SIMS.
Subsequently, our dataset was randomly subdivided into a training set and a testing set, with 85% of the data being randomly selected into the training set and the remaining 15% sample being classified into the testing set by default. The performances of the model were expressed by statistical regression metrics: coefficient of determination (R2) and root mean square error (RMSE). This work applied a k-fold cross-validation method to evaluate the trained model [41], where k was 10. The method partitioned the training dataset into k non-overlapping sets, and a total of k models were fit and evaluated.
The training of the fDNN model consisted of two steps. First, the training data, including labels, were used to fit the random-forest model, and second, the predictions that were transformed by one-hot encoding from each decision tree for all sets of the process parameters were fed into the neural network. In the current implementation, the input for the neural network was an n × M × 2 tensor rather than an n × M matrix, where n is the input number of process parameter sets, and M is the number of trees in the random forest. In the present model, M was chosen as 65, which is in the suggested range from Ref. [41], and there was no significant improvement by further increasing M during the model training. For the second model training step, the number of layers and the neuron number of a hidden layer were determined by 10-fold cross-validations in the range of 1–3 hidden layers and 9–16 neurons per hidden layer. The results are given in Supplementary Materials Table S1. The highest R2, 0.8, was reached for 2 hidden layers and 14 neurons per layer. Therefore, a multi-layer structure was defined with two hidden layers, one input layer, and one output layer (14 neurons per hidden layer). The input layer represented the selected features by the random-forest part, and the output layer corresponded to the free-electron concentration measured by the Hall measurement. Rectified Linear Unit (ReLU) was the activation function implemented in this neural network, and the Adam optimizer [42] was chosen since it is currently the most widely used gradient-descent algorithm.
The prediction performance of the fDNN model also depends on both hyper-parameters of the random forest and the neural network. The hyperparameters of the random forest include the number of trees in the forest and tree-related parameters such as the depth of the decision tree, the maximum number of features considered for splitting in a node, etc. The hyper-parameters of a neural network are framework-related parameters such as the number of hidden layers and the number of neurons per hidden layer and training-related parameters such as the learning rate and the batch size. The values of the above hyperparameters values were optimized by a combination of manual exploration and grid search, and the finalized values can be found in the Supplementary Materials Table S2.
In the research of thin-film development, one may not simply be satisfied with a predictive model for a specific system but may also be interested in finding the key descriptor for further process improvement. After fitting the fDNN model, a newly developed variable-ranking mechanism [29], which combines the variable-importance calculation embedded in random forests and the Connection Weights (CW) method [43] used in neural networks, was applied to calculate a score for each process parameter as the variable importance in the fDNN.
3. Results and Discussion
With the help of the variable-ranking mechanism, we first examined the influence of the initial input parameters (6 input parameters) on the doping level. The Ga precursor molar flow played a significant role in predicting, followed by the Ar push-gas flow, chamber pressure, and oxygen flow, as shown in Figure 2a. Surprisingly, the TEOS molar flow did not significantly influence the doping level according to the variable-ranking mechanism, which conflicts with our domain knowledge but can be explained by the multicollinearity of the TEOS molar flow values, as shown in Supplementary Materials Figure S1. The multicollinearity does not influence the prediction accuracy of the random-forest model but may deteriorate the interpretability of the variable-ranking result [44,45]. Therefore, the importance of the TEOS molar flow should still be highly evaluated for further model training. As reported in the literature, the Ga precursor is the dominant parameter in predicting the growth rate of the β-Ga2O3 film [46]. Following the observed similarity, the growth rate (nm/min) was introduced into the dataset, and a new parameter was found to be a decisive descriptor for the doping prediction, as shown in Figure 2b. This newly found parameter, the Si supplied per nm (mol/nm), can be defined by dividing the concentration of Si precursor (mol/min) with the thin-film growth rate (nm/min), which can be considered as the amount of Si dopant supplied while growing 1 nm of β-Ga2O3 film.
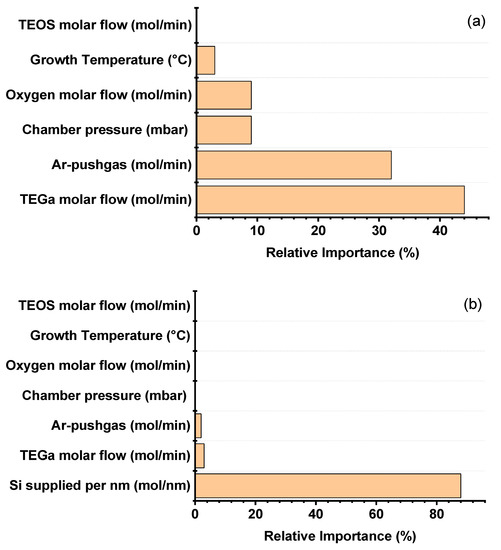
Figure 2.
The parameter importance based on the trained fDNN model. The importance is ranked by the features containing the most information for the model to make a prediction of the free-carrier concentration in the films: (a) individual process parameters and (b) added with a created parameter: Si supplied per nm (mol/nm).
With this new parameter, a predictive model for (100) β-Ga2O3 thin film was developed by including the Si supplied per nm and the other process parameters (7 input parameters). A comparison between the predicted level and the measured doping level is presented in Figure 3. A robust linear relationship between the predicted values and measured values from the training and testing sets indicates that the fDNN model generalized very well to individual datasets, providing the training set/testing set R2 of 0.99/0.86 and the RMSE of 1.4 × 10¹⁶/1 × 1018. The prediction region of the developed model covered the range from 1017 to 1019 cm−3. The prediction deviation, especially at a heavily-doped regime (>1 × 1018 cm−3), mainly resulted from the noise of the measurement data and a relatively finite experimental resolution. By estimating the normalized root mean square error value (NRMSE), the prediction deviation was low enough for the practical estimation (NRMSE values are ≤0.1 for both training and testing set; NRMSE will be 0 in an ideal case), and it satisfied the limited size of the available dataset.
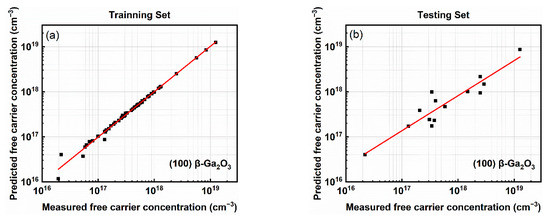
Figure 3.
The plot of the predicted doping level versus the measured free-carrier concentration from (100) β-Ga2O3 thin films using the trained fDNN: (a) Training set and (b) Testing set.
Ten experiments on (010) oriented substrates were also performed in order to examine the model’s validity for the substrate of different facet orientations (as shown in Table 2). A comparison between the predicted and measured doping levels is provided in Figure 4. The prediction error is in an acceptable range, which implies that the developed model was flexible enough to provide desirable prediction accuracy for both (100) and (010) substrates considering the system fluctuation of the MOVPE system. The possible prediction deviation of the doping level may be due to the lack of reliable in situ growth-rate-measurement techniques, as is widely utilized for the homoepitaxial growth of III-V group semiconductor materials [47], and the unknown incoming precursor molar flow on the substrate surface. It puts doubts on the precision of the collected growth parameters and the quality of data.

Table 2.
Experimental parameters for the model validation on (010) β-Ga2O3 thin films. The corresponding process parameters are listed below. The experimental results and detailed mechanism in Table 2 are referred to Refs. [12,46].
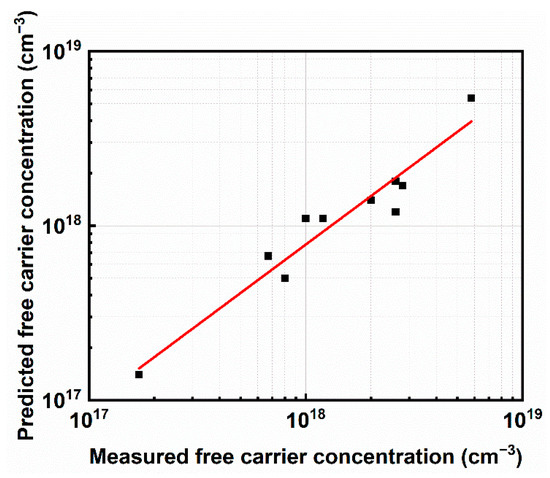
Figure 4.
Measured values and predicted values of free-carrier concentration from (010) β-Ga2O3 thin films with the process parameters listed in Table 2.
A model trained with a (100)-based dataset providing the generality to predict the doping level of (010)-β-Ga2O3-grown films suggests that the doping process in both substrate orientations may have no fundamental difference and share the same descriptor for the doping process. The R2 of the predicted values for the (010) samples was 0.93 while the RMSE was around 4 × 10¹⁷, which were comparable with the results of the (100) samples. To further validate the observation of the trained model, two samples, (100) and (010), were grown in the same chamber with the SIMS measurement results shown in Figure 5a,b. It can be seen that the measured Si concentrations were both around 4 × 1017 cm−3, which matches the result of the model. Si peaks with a concentration close to mid-1018 cm−3 or higher are visible at the substrate and film interface in both samples. Similar Si peaks at the interface between the substrate and the film have already been reported in the literature [13,48,49]. Different reasons have been suggested, such as remaining SiOx on the substrate surface [49] or Si impurities inside the chamber [48], but no commonly agreed conclusion has been confirmed yet. A detailed study on this specific issue has been performed but is beyond the scope of this work, and the results will be presented elsewhere.
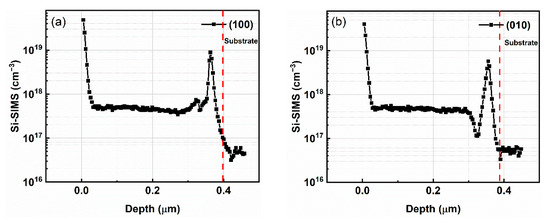
Figure 5.
The Si profiles by SIMS of (a) (100) and (b) (010) in the same-chamber experimental run. The experimental conditions are: the growth rate is maintained at 0.9 µm/h with the TEOS molar flow kept at 1.84 × 10⁻¹⁰ mol/min. The red dashed line indicates the interface between the substrate and the grown film.
A doping engineering strategy was developed following the results of the model, with the Si supplied per nm (mol/nm) as the main variable. To provide an estimation for doping engineering, we defined a concentration contrast, , between different doping levels (i + 1 and i) with Si supplied per nm, Ni, as a single parameter as the following form Equation (1):
Figure 6a,b show the free-carrier concentration obtained by the Hall Effect measurement and the Si concentration obtained by the SIMS measurement versus the Si supplied per nm (mol/nm) with the data points of both the in-house-grown (100) substrates (black squares, labeled as IKZ) and commercial (010) (red circles, labeled as IKZ-Tamura) substrates from our dataset and the literature (blue triangles, referred to Ref. [15]) fitted by Equation (1) [15]. These findings indicate that the Si-doping behavior for β-Ga2O3 is substrate-orientation-independent, precursor-type-independent (SiH4 is the Si precursor used in the work of Bhattacharyya et al. [15]), and equipment-independent.
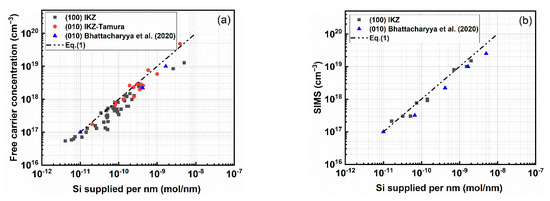
Figure 6.
Comparison of the results of (a) Hall Effect measurement and (b) SIMS measurement from both (100) and (010) MOVPE-grown β-Ga2O3 thin films with the Si supplied per nm (mol/nm) as the main variable.
Studies on the temperature-dependent states indicated a two-donor level, with a shallower donor energy level (ED1 = ∼10 − 35 meV) and deeper second donor (ED2 = ∼80 − 100 meV) energy levels [49,50,51]. Si is a common n-type dopant in β-Ga2O3 [52], which is predicted by the first principle of density functional theory (DFT) [53] to be a shallow donor with its preference site as a tetrahedral site Ga(I) under oxygen-rich condition due to a lower formation energy. As a result, Si generally incorporates more at (ED1), leading to efficient activation at room temperature, and shows no significant probability to substitute the oxygen site. Therefore, the free-electron concentration is expected to be proportional to the density of Si atoms supplied during the film growth. Besides, Equation (1) also indicates a kinetically controlled doping process and that the thin-film growth rate is faster than the diffusion rate of Si adsorbed onto the surface; with a fixed TEOS molar flow but varied growth rate, the amount of supplied Si atoms on the substrate surface is constant, but the surrounding gallium-oxide matrix changes, therefore, the actually-incorporated Si amount and free-electron concentration (when all incorporated Si are electrically active) is limited by the thin-film growth rate instead of the supplied amount of Si precursor. It is a well-known fact that the thin-film growth rate is an implicit function of a set of process parameters, such as precursor concentration, chamber pressure, and growth temperature. Following the discussion above, the previously reported observation of the influence of a single process parameter [12,13,14,15,37] on the doping level can be considered to influence the thin film growth rate instead of doping behavior. With the current model, we demonstrated that the doping behavior in MOVPE-grown β-Ga2O3 thin film can be concluded by a single descriptor from a macroscopic view, i.e., Si supplied per nm (mol/nm), when the point defect is the only compensating factor in the film. In some other works, hydrogen was revealed to be a potential shallow donor [39,54]. However, it was not stable in a temperature-elevated environment, according to our experience.
4. Conclusions
This work demonstrated that a hybrid deep-learning model can precisely predict the doping level in MOVPE-grown Si-doped β-Ga2O3 thin film in the range of 1017 to 1019 cm−3. With the help of the model, a key descriptor, i.e., the Si supplied per nm (mol/nm), was identified to show a linear relationship with the doping level of both (100) and (010) β-Ga2O3 thin films. Furthermore, an empirical relationship was extracted in order to estimate the doping level with a good generality for different substrate orientations, dopant precursor types, and deposition systems. This will save time in process development at both the lab and industry levels.
Supplementary Materials
The following are available online at https://www.mdpi.com/article/10.3390/cryst12010008/s1, Figure S1: The correlation between the TEOS flow rate (mol/min) and the free carrier concentration measured by Hall effect measurement, Table S1: R2 of fDNN with 1–3 hidden layer and 9–16 neurons from 10-fold cross-validation, Table S2: The hyperparameter of fDNN: random forest and neural network.
Author Contributions
Conceptualization, T.-S.C. and M.A.; Data curation, S.B.A.; Formal analysis, T.-S.C. and K.I.; Funding acquisition, A.P.; Investigation, T.-S.C. and W.M.; Methodology, T.-S.C., R.G., K.I. and N.D.; Project administration, A.P.; Resources, S.B.A., R.G. and A.P.; Software, T.-S.C.; Supervision, S.B.A., N.D., M.A. and A.P.; Validation, N.D.; Visualization, T.-S.C.; Writing—original draft, T.-S.C.; Writing—review & editing, K.I., N.D., J.R., T.T.V.T., W.M. and P.S. All authors have read and agreed to the published version of the manuscript.
Funding
This work was performed in the framework of GraFOx, a Leibniz ScienceCampus. The work was funded by the BMBF under grant number 03VP03712 and 16ES1084K, the European Community (Europäische Fonds für regionale Entwicklung-EFRE) under grant number 1.8/15, and by the Deutsche Forschungsgemeinschaft under project funding reference number WA-1453/3-1 and PO-2659/1-2.
Institutional Review Board Statement
Not applicable.
Informed Consent Statement
Not applicable.
Data Availability Statement
The data that support the findings of this study are available from the corresponding author upon reasonable request.
Acknowledgments
The authors thank Jutta Schwarzkopf and Arved Enders-Seidlitz for reading the manuscript and Mike Pietsch for the electrical measurements.
Conflicts of Interest
The authors declare no conflict of interest.
References
- Mccluskey, M.D. Point defects in Ga2O3. J. Appl. Phys. 2020, 127, 101101. [Google Scholar] [CrossRef] [Green Version]
- Galazka, Z.; Uecker, R.; Klimm, D.; Irmscher, K.; Naumann, M.; Pietsch, M.; Kwasniewski, A.; Bertram, R.; Ganschow, S.; Bickermann, M. Scaling-Up of Bulk β-Ga2O3 Single Crystals by the Czochralski Method. ECS J. Solid State Sci. Technol. 2017, 6, Q3007–Q3011. [Google Scholar] [CrossRef]
- Galazka, Z.; Ganschow, S.; Irmscher, K.; Klimm, D.; Albrecht, M.; Schewski, R.; Pietsch, M.; Schulz, T.; Dittmar, A.; Kwasniewski, A.; et al. Bulk single crystals of β-Ga2O3 and Ga-based spinels as ultra-wide bandgap transparent semiconducting oxides. Prog. Cryst. Growth Charact. Mater. 2021, 67, 100511. [Google Scholar] [CrossRef]
- Suzuki, N.; Ohira, S.; Tanaka, M.; Sugawara, T.; Nakajima, K.; Shishido, T. Fabrication and characterization of transparent conductive Sn-doped β-Ga2O3 single crystal. Phys. Status Solidi C 2007, 4, 2310–2313. [Google Scholar] [CrossRef]
- Villora, E.G.; Shimamura, K.; Yoshikawa, Y.; Aoki, K.; Ichinose, N. Large-size β-Ga2O3 single crystals and wafers. J. Cryst. Growth 2004, 270, 420–426. [Google Scholar] [CrossRef]
- Kuramata, A.; Koshi, K.; Watanabe, S.; Yamaoka, Y.; Masui, T.; Yamakoshi, S. High-quality β-Ga2O3 single crystals grown by edge-defined film-fed growth. Jpn. J. Appl. Phys. 2016, 55, 1202A2. [Google Scholar] [CrossRef]
- Hoshikawa, K.; Ohba, E.; Kobayashi, T.; Yanagisawa, J.; Miyagawa, C.; Nakamura, Y. Growth of β-Ga2O3 single crystals using vertical Bridgman method in ambient air. J. Cryst. Growth 2016, 447, 36–41. [Google Scholar] [CrossRef]
- Higashiwaki, M.; Sasaki, K.; Kuramata, A.; Masui, T.; Yamakoshi, S. Gallium oxide (Ga2O3) metal-semiconductor field-effect transistors. Appl. Phys. Lett. 2012, 100, 013504. [Google Scholar] [CrossRef]
- Ahmadi, E.; Koksaldi, O.S.; Kaun, S.W.; Oshima, Y.; Short, D.B.; Mishra, U.K.; Speck, J.S. Ge doping of β-Ga2O3 films grown by plasma-assisted molecular beam epitaxy. Appl. Phys. Express 2017, 10, 041102. [Google Scholar] [CrossRef]
- Alema, F.; Seryogin, G.; Osinsky, A.; Osinsky, A. Ge doping of β-Ga2O3 by MOCVD. APL Mater. 2021, 9, 091102. [Google Scholar] [CrossRef]
- Lim, K.; Schelhas, L.T.; Siah, S.C.; Brandt, R.E.; Zakutayev, A.; Lany, S.; Gorman, B.; Sun, C.J.; Ginley, D.; Buonassisi, T.; et al. The effect of sub-oxide phases on the transparency of tin-doped gallium oxide. Appl. Phys. Lett. 2016, 109, 141909. [Google Scholar] [CrossRef] [Green Version]
- Baldini, M.; Albrecht, M.; Fiedler, A.; Irmscher, K.; Schewski, R.; Wagner, G. Si- and Sn-doped homoepitaxial β-Ga2O3 layers grown by MOVPE on (010)-oriented substrates. ECS J. Solid State Sci. Technol. 2017, 6, Q3040–Q3044. [Google Scholar] [CrossRef]
- Bin Anooz, S.; Grüneberg, R.; Chou, T.S.; Fiedler, A.; Irmscher, K.; Wouters, C.; Schewski, R.; Albrecht, M.; Galazka, Z.; Miller, W.; et al. Impact of chamber pressure and Si-doping on the surface morphology and electrical properties of homoepitaxial (100) β-Ga2O3 thin films grown by MOVPE. J. Phys. D Appl. Phys. 2021, 54, 034003. [Google Scholar] [CrossRef]
- Feng, Z.; Anhar Uddin Bhuiyan, A.F.M.; Karim, M.R.; Zhao, H. MOCVD homoepitaxy of Si-doped (010) β-Ga2O3 thin films with superior transport properties. Appl. Phys. Lett. 2019, 114, 250601. [Google Scholar] [CrossRef]
- Bhattacharyya, A.; Ranga, P.; Roy, S.; Ogle, J.; Whittaker-Brooks, L.; Krishnamoorthy, S. Low temperature homoepitaxy of (010) β-Ga2O3 by metalorganic vapor phase epitaxy: Expanding the growth window. Appl. Phys. Lett. 2020, 117, 142102. [Google Scholar] [CrossRef]
- Rojas, R. Neural Networks: A Systematic Introduction; Springer: Berlin/Heidelberg, Germany, 1996. [Google Scholar]
- Dropka, N.; Holena, M. Optimization of magnetically driven directional solidification of silicon using artificial neural networks and Gaussian process models. J. Cryst. Growth 2017, 471, 53–61. [Google Scholar] [CrossRef]
- Dropka, N.; Holena, M.; Ecklebe, S.; Frank-Rotsch, C.; Winkler, J. Fast forecasting of VGF crystal growth process by dynamic neural networks. J. Cryst. Growth 2019, 521, 9–14. [Google Scholar] [CrossRef]
- Kutsukake, K.; Nagai, Y.; Horikawa, T.; Banba, H. Real-time prediction of interstitial oxygen concentration in Czochralski silicon using machine learning. Appl. Phys. Express 2020, 13, 125502. [Google Scholar] [CrossRef]
- Tsunooka, Y.; Kokubo, N.; Hatasa, G.; Harada, S.; Tagawa, M.; Ujihara, T. High-speed prediction of computational fluid dynamics simulation in crystal growth. CrystEngComm 2018, 20, 6546–6550. [Google Scholar] [CrossRef] [Green Version]
- Lee, M. Robust random forest based non-fullerene organic solar cells efficiency prediction. Org. Electron. 2020, 76, 105465. [Google Scholar] [CrossRef]
- Wei, L.; Xu, X.; Bullock, J.; Ager, J.W. Machine Learning Optimization of p-Type Transparent Conducting Films. Chem. Mater. 2019, 31, 7340–7350. [Google Scholar] [CrossRef] [Green Version]
- Wakabayashi, Y.K.; Otsuka, T.; Krockenberger, Y.; Sawada, H.; Taniyasu, Y.; Yamamoto, H. Machine-learning-assisted thin-film growth: Bayesian optimization in molecular beam epitaxy of SrRuO3 thin films. APL Mater. 2019, 7, 101114. [Google Scholar] [CrossRef] [Green Version]
- Hansen, K.; Montavon, G.; Biegler, F.; Fazli, S.; Rupp, M.; Scheffler, M.; Von Lilienfeld, O.A.; Tkatchenko, A.; Müller, K.R. Assessment and validation of machine learning methods for predicting molecular atomization energies. J. Chem. Theory Comput. 2013, 9, 3404–3419. [Google Scholar] [CrossRef] [PubMed]
- Von Lilienfeld, O.A. Quantum Machine Learning in Chemical Compound Space. Angew. Chem. Int. Ed. 2018, 57, 4164–4169. [Google Scholar] [CrossRef] [PubMed]
- Schmidt, J.; Marques, M.R.G.; Botti, S.; Marques, M.A.L. Recent advances and applications of machine learning in solid-state materials science. npj Comput. Mater. 2019, 5, 83. [Google Scholar] [CrossRef]
- Stocker, S.; Csányi, G.; Reuter, K.; Margraf, J.T. Machine learning in chemical reaction space. Nat. Commun. 2020, 11, 5505. [Google Scholar] [CrossRef]
- Zhang, M.; Zhang, D.; Wells, M.T. Variable selection for large p small n regression models with incomplete data: Mapping QTL with epistases. BMC Bioinform. 2008, 9, 251. [Google Scholar] [CrossRef] [Green Version]
- Kong, Y.; Yu, T. A Deep Neural Network Model using Random Forest to Extract Feature Representation for Gene Expression Data Classification. Sci. Rep. 2018, 8, 16477. [Google Scholar] [CrossRef] [Green Version]
- Schewski, R.; Lion, K.; Fiedler, A.; Wouters, C.; Popp, A.; Levchenko, S.V.; Schulz, T.; Schmidbauer, M.; Bin Anooz, S.; Grüneberg, R.; et al. Step-flow growth in homoepitaxy of β-Ga2O3 (100)—The influence of the miscut direction and faceting. APL Mater. 2019, 7, 022515. [Google Scholar] [CrossRef] [Green Version]
- Bin Anooz, S.; Grüneberg, R.; Wouters, C.; Schewski, R.; Albrecht, M.; Fiedler, A.; Irmscher, K.; Galazka, Z.; Miller, W.; Wagner, G.; et al. Step Flow Growth of β-Ga2O3 Thin Films on Vicinal (100) β-Ga2O3 Substrates Grown by MOVPE. Appl. Phys. Lett. 2020, 116, 182106. [Google Scholar] [CrossRef]
- Breiman, L. Random Forests. Mach. Learn. 2001, 45, 5–32. [Google Scholar] [CrossRef] [Green Version]
- Fiedler, A.; Schewski, R.; Baldini, M.; Galazka, Z.; Wagner, G.; Albrecht, M.; Irmscher, K. Influence of incoherent twin boundaries on the electrical properties of β-Ga2O3 layers homoepitaxially grown by metal-organic vapor phase epitaxy. J. Appl. Phys. 2017, 122, 165701. [Google Scholar] [CrossRef]
- Korhonen, E.; Tuomisto, F.; Gogova, D.; Wagner, G.; Baldini, M.; Galazka, Z.; Schewski, R.; Albrecht, M. Electrical compensation by Ga vacancies in Ga2O3 thin films. Appl. Phys. Lett. 2015, 106, 242103. [Google Scholar] [CrossRef] [Green Version]
- Peelaers, H.; Lyons, J.L.; Varley, J.B.; Van De Walle, C.G. Deep acceptors and their diffusion in Ga2O3. APL Mater. 2019, 7, 022519. [Google Scholar] [CrossRef] [Green Version]
- Tadjer, M.J.; Freitas, J.A.; Culbertson, J.C.; Weber, M.H.; Glaser, E.R.; Mock, A.L.; Mahadik, N.A.; Schmieder, K.; Jackson, E.; Gallagher, J.C.; et al. Structural and electronic properties of Si- And Sn-doped (−201) β-Ga2O3 annealed in nitrogen and oxygen atmospheres. J. Phys. D Appl. Phys. 2020, 53, 504002. [Google Scholar] [CrossRef]
- Mazzolini, P.; Falkenstein, A.; Galazka, Z.; Martin, M.; Bierwagen, O. Offcut-related step-flow and growth rate enhancement during (100) β-Ga2O3 homoepitaxy by metal-exchange catalyzed molecular beam epitaxy (MEXCAT-MBE). Appl. Phys. Lett. 2020, 117, 222105. [Google Scholar] [CrossRef]
- Wang, Z.; Chen, X.; Ren, F.F.; Gu, S.; Ye, J. Deep-level defects in gallium oxide. J. Phys. D Appl. Phys. 2021, 54, 043002. [Google Scholar] [CrossRef]
- Varley, J.B.; Peelaers, H.; Janotti, A.; Van De Walle, C.G. Hydrogenated cation vacancies in semiconducting oxides. J. Phys. Condens. Matter 2011, 23, 334212. [Google Scholar] [CrossRef]
- Makkonen, I.; Karjalainen, A.; Prozheeva, V.; Wagner, G.; Baldini, M.; Tuomisto, F. Ga vacancies and electrical compensation in β-Ga2O3 thin films studied with positron annihilation spectroscopy. In Proceedings of the Oxide-Based Materials and Devices X, San Francisco, CA, USA, 3–7 February 2019; Volume 10919, p. 4. [Google Scholar] [CrossRef] [Green Version]
- Oshiro, T.M.; Perez, P.S.; Baranauskas, J.A. How Many Trees in a Random Forest? In Proceedings of the Machine Learning and Data Mining in Pattern Recognition; Perner, P., Ed.; Springer: Berlin/Heidelberg, Germany, 2012; pp. 154–168. [Google Scholar]
- Kingma, D.P.; Ba, J.L. Adam: A method for stochastic optimization. In Proceedings of the 3rd International Conference for Learning Representations, San Diego, CA, USA, 7–9 May 2015; pp. 1–15. [Google Scholar]
- Olden, J.D.; Jackson, D.A. Illuminating the “black box”: A randomization approach for understanding variable contributions in artificial neural networks. Ecol. Modell. 2002, 154, 135–150. [Google Scholar] [CrossRef]
- Strobl, C.; Boulesteix, A.L.; Kneib, T.; Augustin, T.; Zeileis, A. Conditional variable importance for random forests. BMC Bioinform. 2008, 9, 307. [Google Scholar] [CrossRef] [Green Version]
- Toloşi, L.; Lengauer, T. Classification with correlated features: Unreliability of feature ranking and solutions. Bioinformatics 2011, 27, 1986–1994. [Google Scholar] [CrossRef] [PubMed]
- Alema, F.; Hertog, B.; Osinsky, A.; Mukhopadhyay, P.; Toporkov, M.; Schoenfeld, W.V. Fast growth rate of epitaxial β-Ga2O3 by close coupled showerhead MOCVD. J. Cryst. Growth 2017, 475, 77–82. [Google Scholar] [CrossRef]
- Kaspari, C.; Pristovsek, M.; Richter, W. Homoepitaxial growth rate measurement using in situ reflectance anisotropy spectroscopy. J. Cryst. Growth 2007, 298, 46–49. [Google Scholar] [CrossRef]
- Fu, K.; Fu, H.; Deng, X.; Su, P.-Y.Y.; Liu, H.; Hatch, K.; Cheng, C.-Y.Y.; Messina, D.; Meidanshahi, R.V.; Peri, P.; et al. The impact of interfacial Si contamination on GaN-on-GaN regrowth for high power vertical devices. Appl. Phys. Lett. 2021, 118, 222104. [Google Scholar] [CrossRef]
- Feng, Z.; Bhuiyan, A.F.M.A.U.; Xia, Z.; Moore, W.; Chen, Z.; McGlone, J.F.; Daughton, D.R.; Arehart, A.R.; Ringel, S.A.; Rajan, S.; et al. Probing Charge Transport and Background Doping in Metal-Organic Chemical Vapor Deposition-Grown (010) β-Ga2O3. Phys. Status Solidi RRL 2020, 14, 2000145. [Google Scholar] [CrossRef]
- Neal, A.T.; Mou, S.; Lopez, R.; Li, J.V.; Thomson, D.B.; Chabak, K.D.; Jessen, G.H. Incomplete Ionization of a 110 meV Unintentional Donor in β-Ga2O3 and its Effect on Power Devices. Sci. Rep. 2017, 7, 13218. [Google Scholar] [CrossRef] [PubMed] [Green Version]
- Alema, F.; Zhang, Y.; Osinsky, A.; Valente, N.; Mauze, A.; Itoh, T.; Speck, J.S. Low temperature electron mobility exceeding 104 cm2/V s in MOCVD grown β-Ga2O3. APL Mater. 2019, 7, 121110. [Google Scholar] [CrossRef] [Green Version]
- Tadjer, M.J.; Lyons, J.L.; Nepal, N.; Freitas, J.A.; Koehler, A.D.; Foster, G.M. Review—theory and characterization of doping and defects in β-Ga2O3. ECS J. Solid State Sci. Technol. 2019, 8, Q3187–Q3194. [Google Scholar] [CrossRef]
- Varley, J.B.; Weber, J.R.; Janotti, A.; Van De Walle, C.G. Oxygen vacancies and donor impurities in β-Ga2O3. Appl. Phys. Lett. 2010, 97, 142106. [Google Scholar] [CrossRef]
- Weiser, P.; Stavola, M.; Fowler, W.B.; Qin, Y.; Pearton, S. Structure and vibrational properties of the dominant O-H center in β-Ga2O3. Appl. Phys. Lett. 2018, 112, 232104. [Google Scholar] [CrossRef]
Publisher’s Note: MDPI stays neutral with regard to jurisdictional claims in published maps and institutional affiliations. |
© 2021 by the authors. Licensee MDPI, Basel, Switzerland. This article is an open access article distributed under the terms and conditions of the Creative Commons Attribution (CC BY) license (https://creativecommons.org/licenses/by/4.0/).