Article

Detection of Scratch on Transparent Plate with Strong Scattering Noise by Digital Holographic Technique

1
Department of Optics and Photonics, National Central University, Taoyuan City 32001, Taiwan
2
Department of Photonics, Feng Chia University, Taichung City 407802, Taiwan
*
Author to whom correspondence should be addressed.
Crystals 2021, 11(9), 1107; https://doi.org/10.3390/cryst11091107
Submission received: 19 May 2021 / Revised: 1 September 2021 / Accepted: 8 September 2021 / Published: 11 September 2021

Abstract

:
We applied a digital holographic detection technique to detect the scratches on glass surfaces with scattering noise. In the experiment, scratches with widths of 1.67 µm were generated on the front sides of the glass slides, and three different gray levels were painted on the back sides of the glass slides to generate the scattering noise. It demonstrated that the digital holographic detection method can enhance the image contrast of the scratch under high scattering noise. The high defocus tolerance promises a detection process without optical focusing and thus benefits the high-speed automatic optical inspection.

Graphical Abstract

1. Introduction

Modern consumption products use a great deal of transparent elements, which tend to be more complicated due to the evolution of 3D molding technologies. In order to present a perfect product to the consumer, the surface defects of each element should always be checked seriously. Some elements, such as the glass of the back lid of a smart cell phone, are created with sparkling color or painted with a mark. The detection of surface defects suffers from strong scattering noise, and the defect detection of a 3D molding transparent element needs to apply optical focusing to make sure a clear image is captured. The image based automatic optical inspection (AOI) techniques for surface defects detection of flat glass has made advances in image-processing algorithms [1,2,3,4,5,6] and defects classification [7,8,9,10,11]. However, the 2D optical detection system faces the contrast degradation caused by defocus and scattering noise, which fails the thresholding means and the edge detections of the image-processing algorithm. The autofocus technique may be applied to improve the image contrast, but it cannot keep itself from slowing down the detection progress [12,13,14]. The alternative solution is applying optical coherent tomography (OCT) to obtain not only the clear image of defects but also the depth information [15,16,17,18,19]. However, the image acquiring process is time-consuming.
The digital holographic (DH) imaging can take 3D information of the surface defect and apply digital focus in any depth; it provides a better solution for transparent plates with scattering noise [20,21,22]. Transparent plate detection applying the digital holographic (DH) technique was applied on quantitative phase measurement [23,24,25,26,27,28]. Recently, AOI using the digital holographic (DH) technique was proposed [29,30]. The numerical autofocus in digital holography with aid of the traditional autofocus technique was developed [31,32,33,34,35], making DH-based AOI an attractive solution. However, its performance for defects detection with strong scattering noise and defocus condition has not been studied. In this study, we applied the digital holographic detection (DHD) technique to detect scratches with scattering noise and demonstrated the high defocusing tolerance of the DHD technique. Because the focusing process was applied digitally rather than mechanically, it brought significant advantages of simple and fast detection.

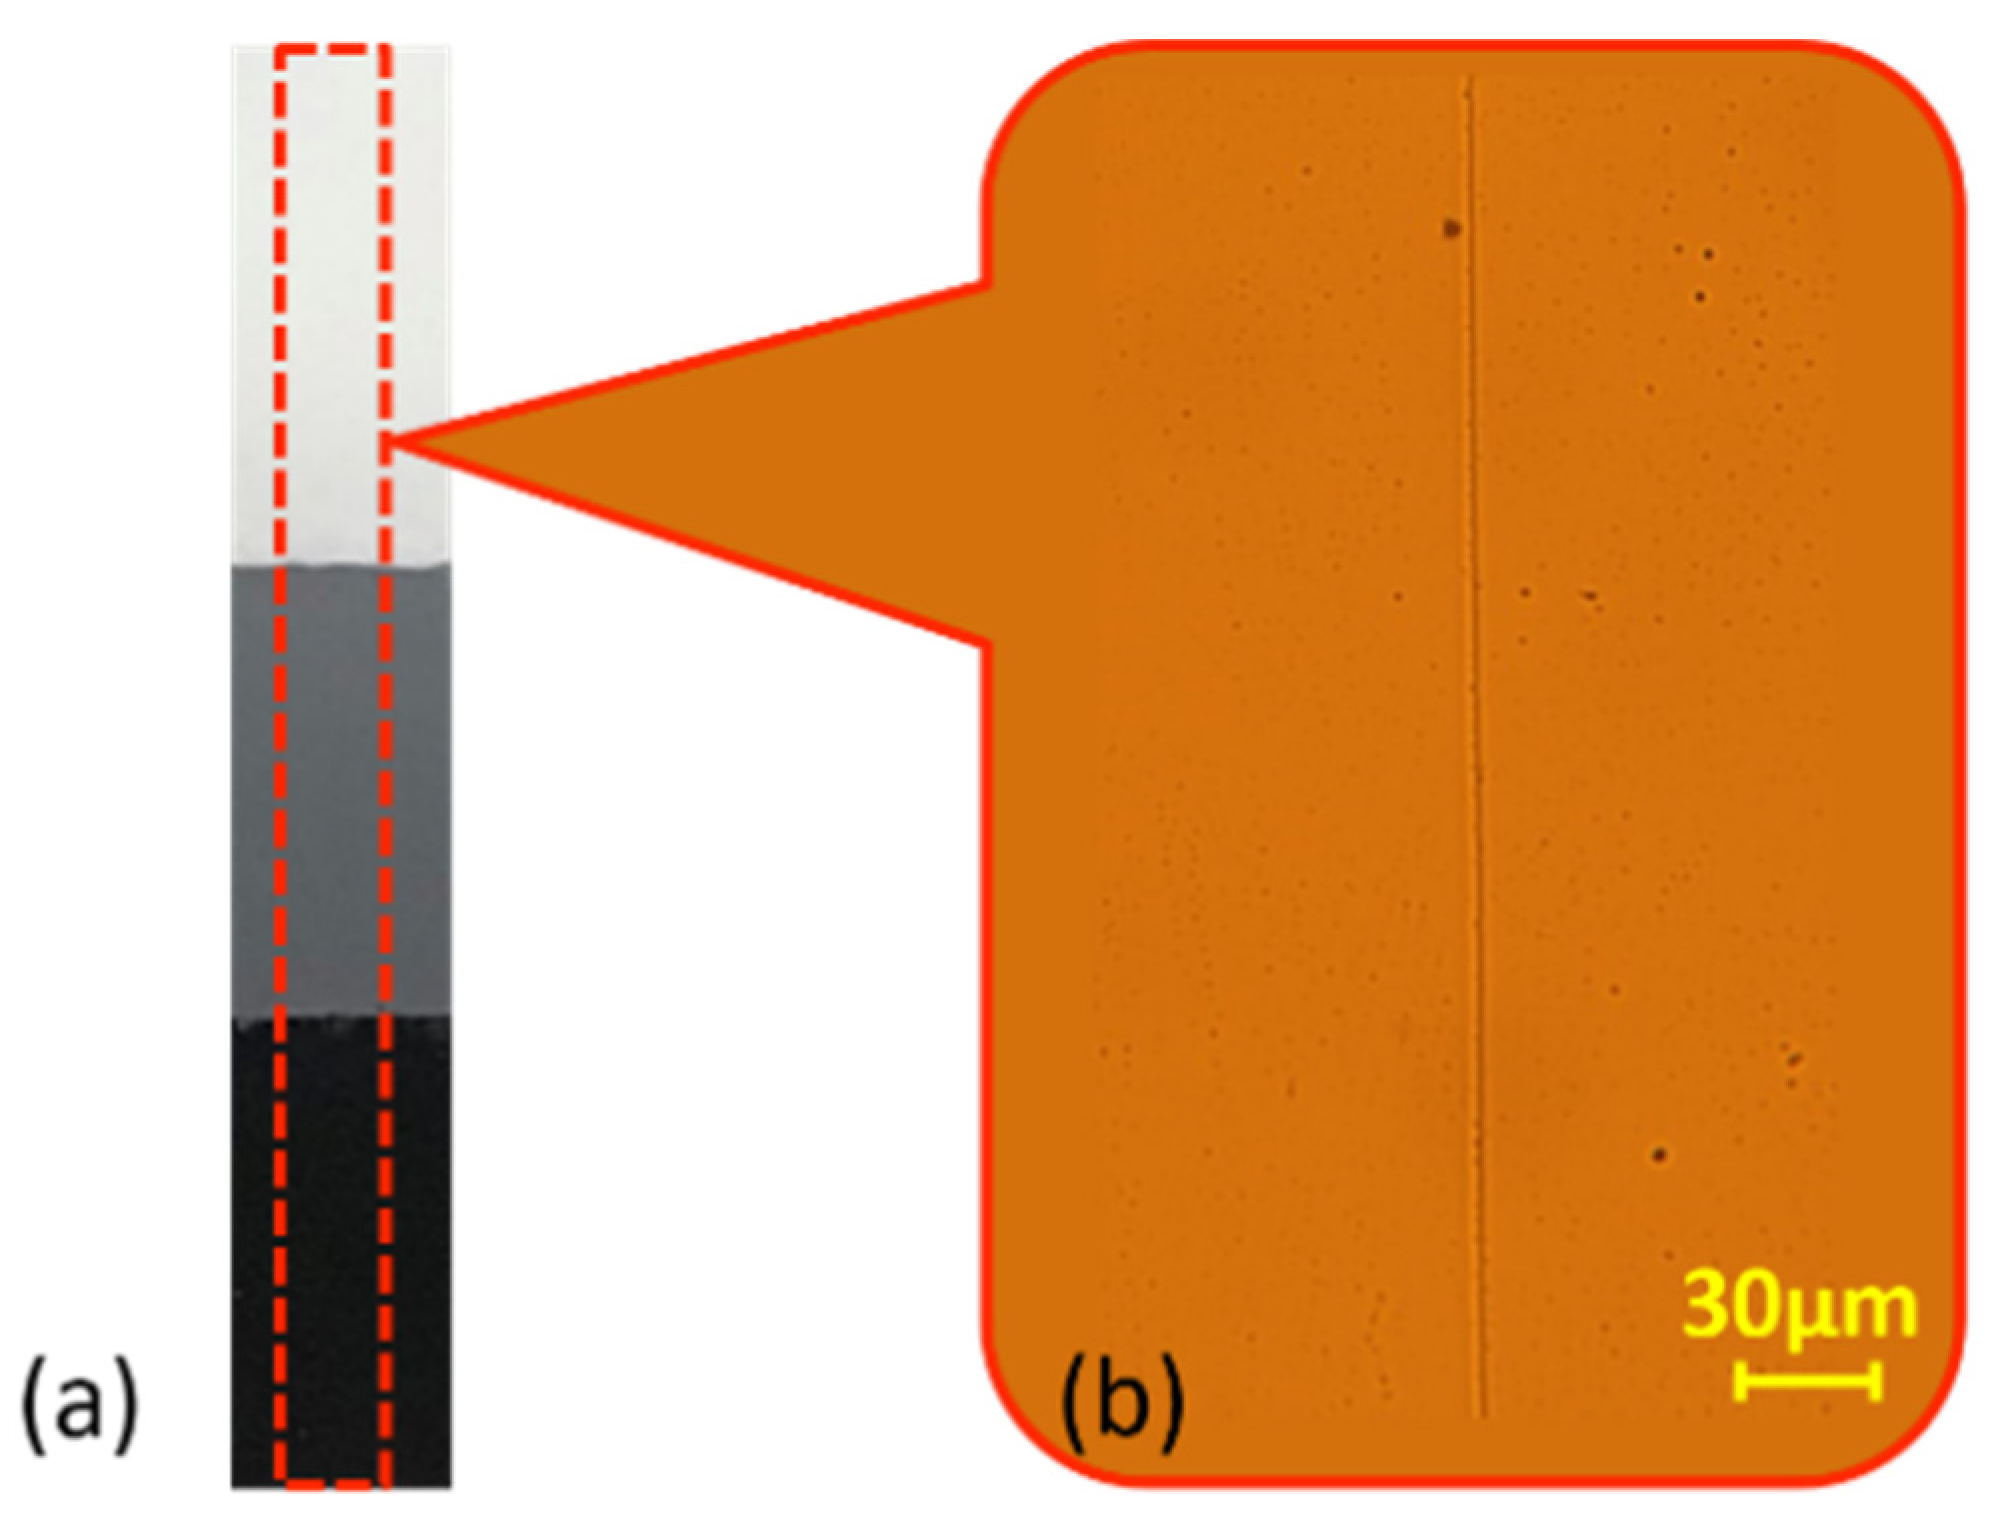
2. Sample Preparation
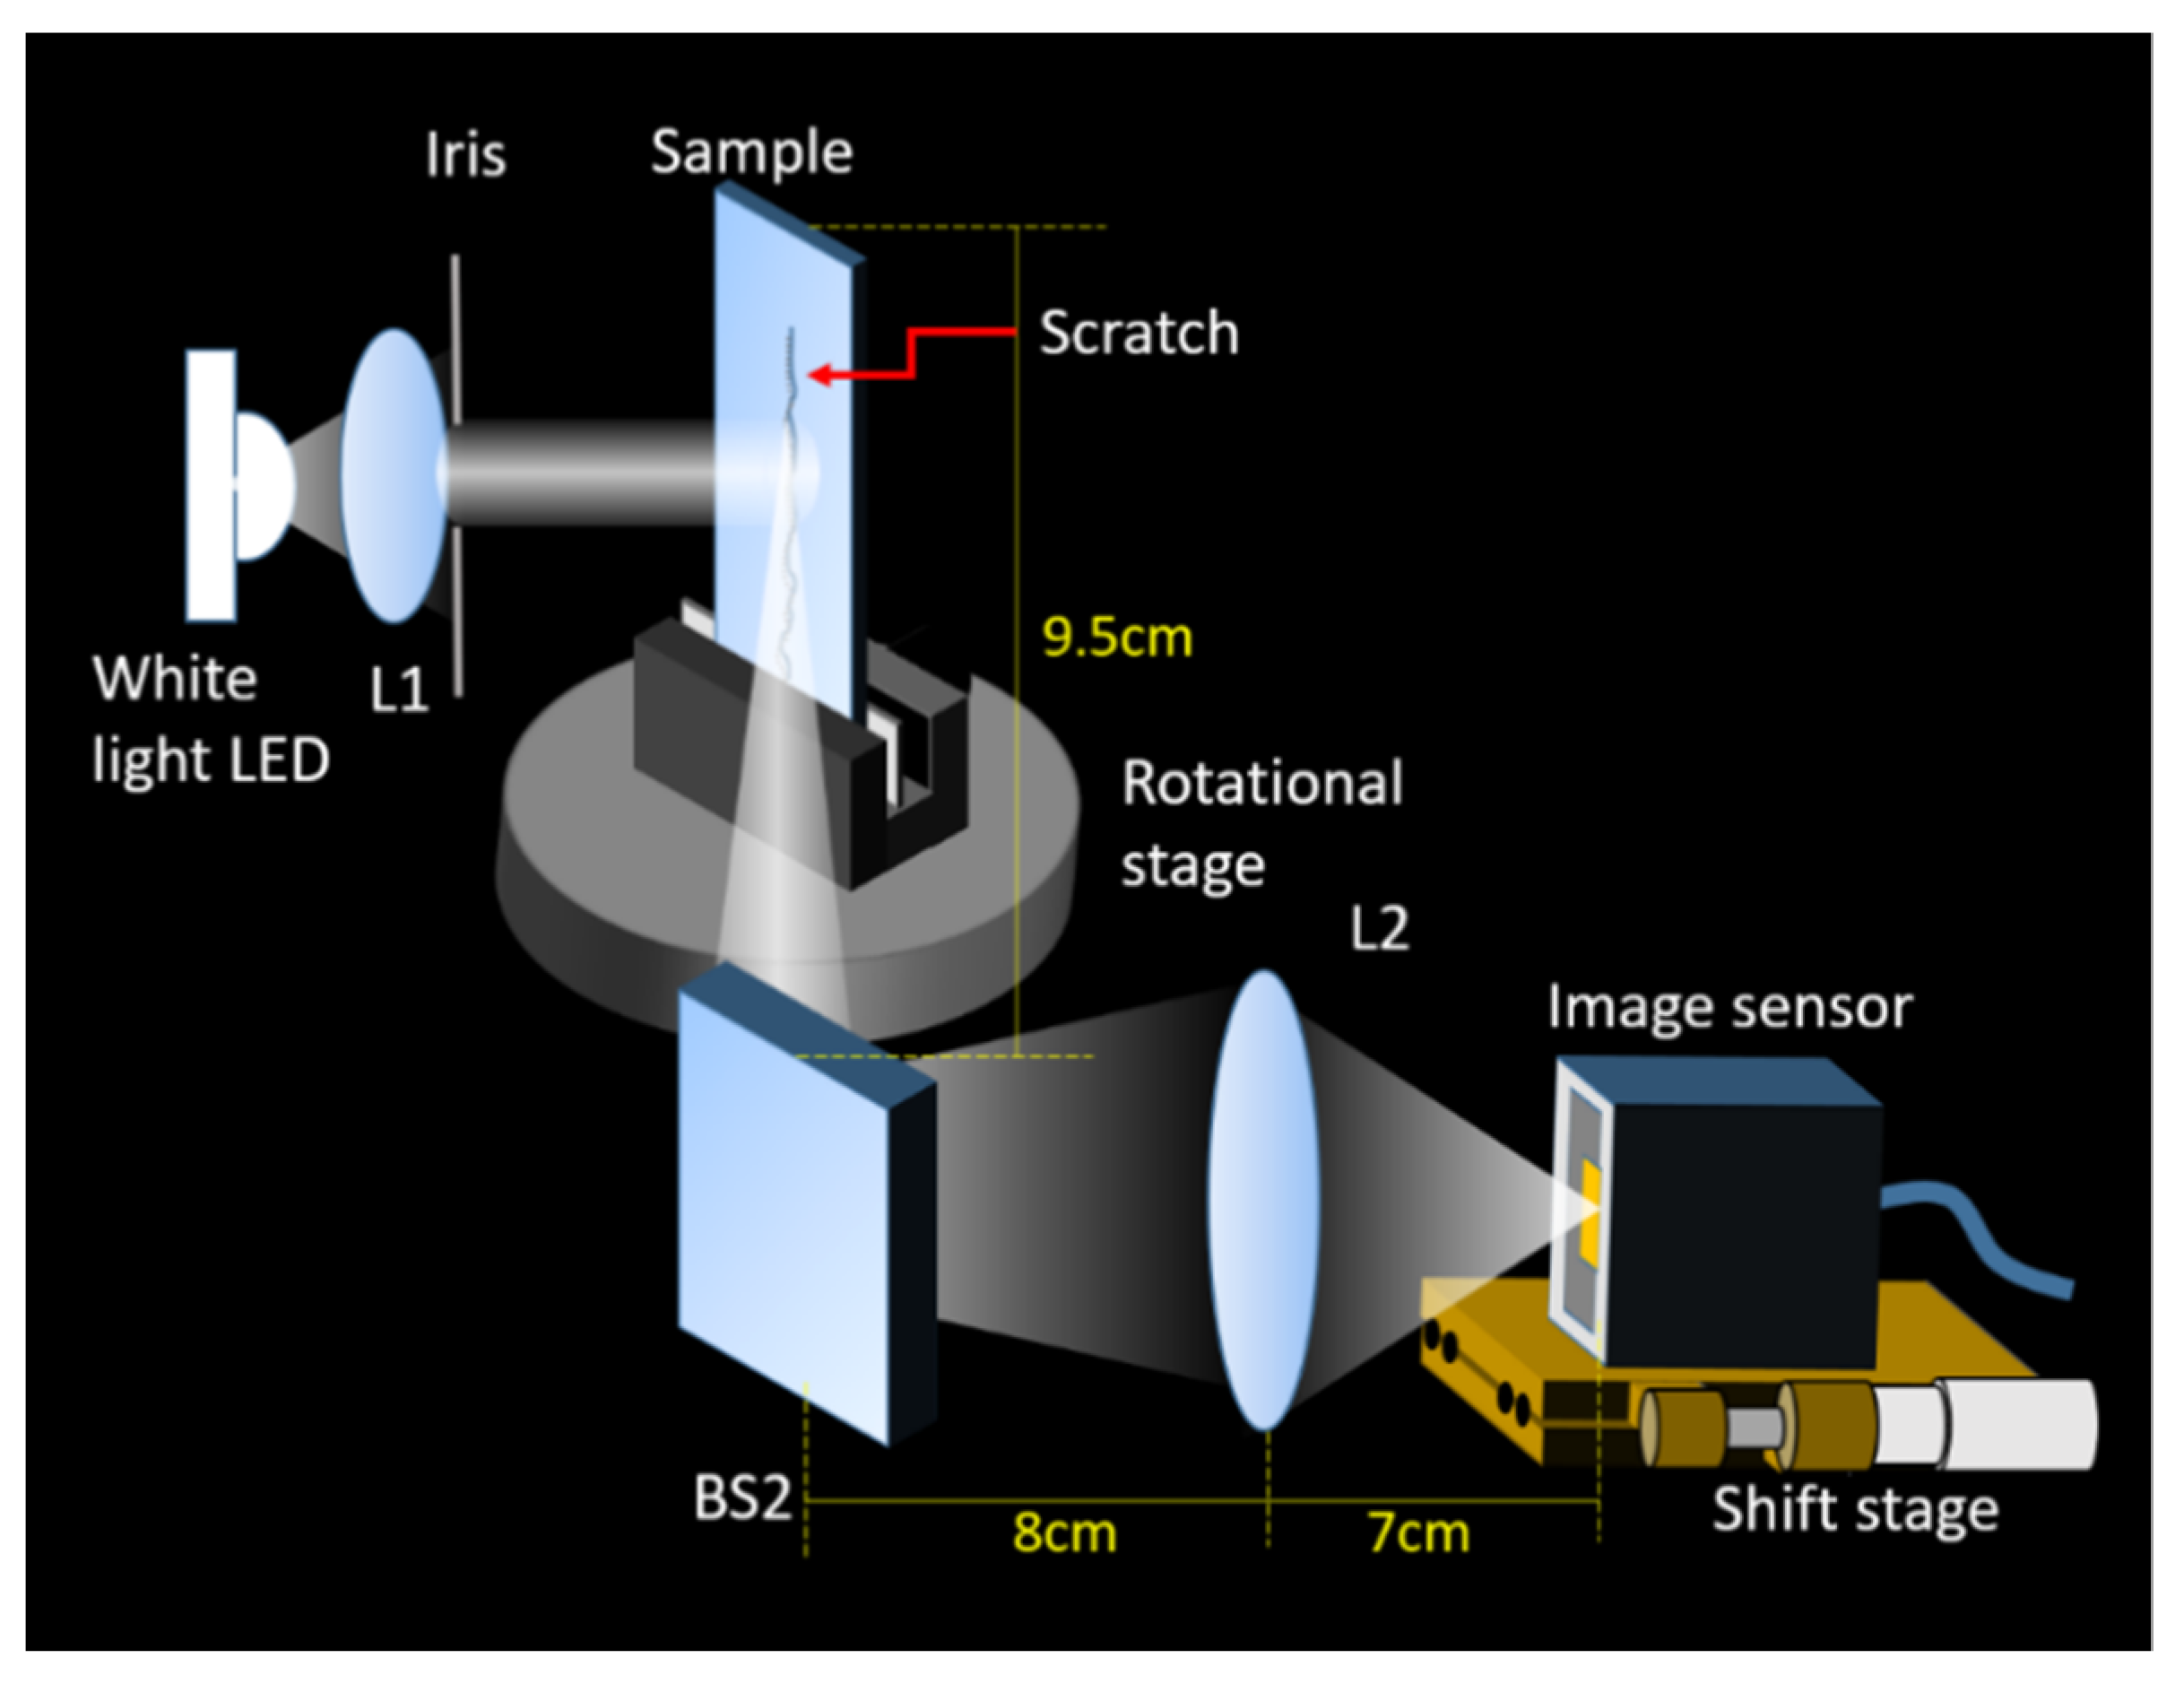
The goal of this paper was to detect the scratch of a transparent plate by the DHD technique, especially when the image was disturbed by scattering noise and defocus condition. To produce the sample with a scratch, glass slides with 1 mm thickness were put on top of a diamond knife and loaded with 10 g weight. The weight of 10 g was meaningful because it is similar to the weight of the cover glass of a cell phone. The loaded weight produced a constant force that pushed the glass slides to the diamond knife. Then, we pulled the glass slide to generate a scratch on the front surface of the glass slides. The back surfaces of the glass were painted 3 different gray levels of paint, i.e., white, gray, and black, to produce different levels of scattering noise. The area of the paints covered the whole field of view of the detection system. The absorption ratios of the light for the 3 gray levels of paints were measured by an integration sphere, and the measured values were 13.8%, 81.4%, and 93.6%, respectively. Figure 1a shows scratches were produced on the front surfaces of the glass, and the back surfaces of the glass slides were painted with 3 gray levels. Figure 1b shows the image of the scratch captured by an optical microscope, and the measured width of the scratch was 1.65 µm.

3. Experiments

The experiment included a control group and an experimental group. In the control group, we used a white-light imaging system (WIS) to simulate the conventional optical inspection system. In the experimental group, the digital holographic detection (DHD) technique with laser light source was used to detect the scratch.

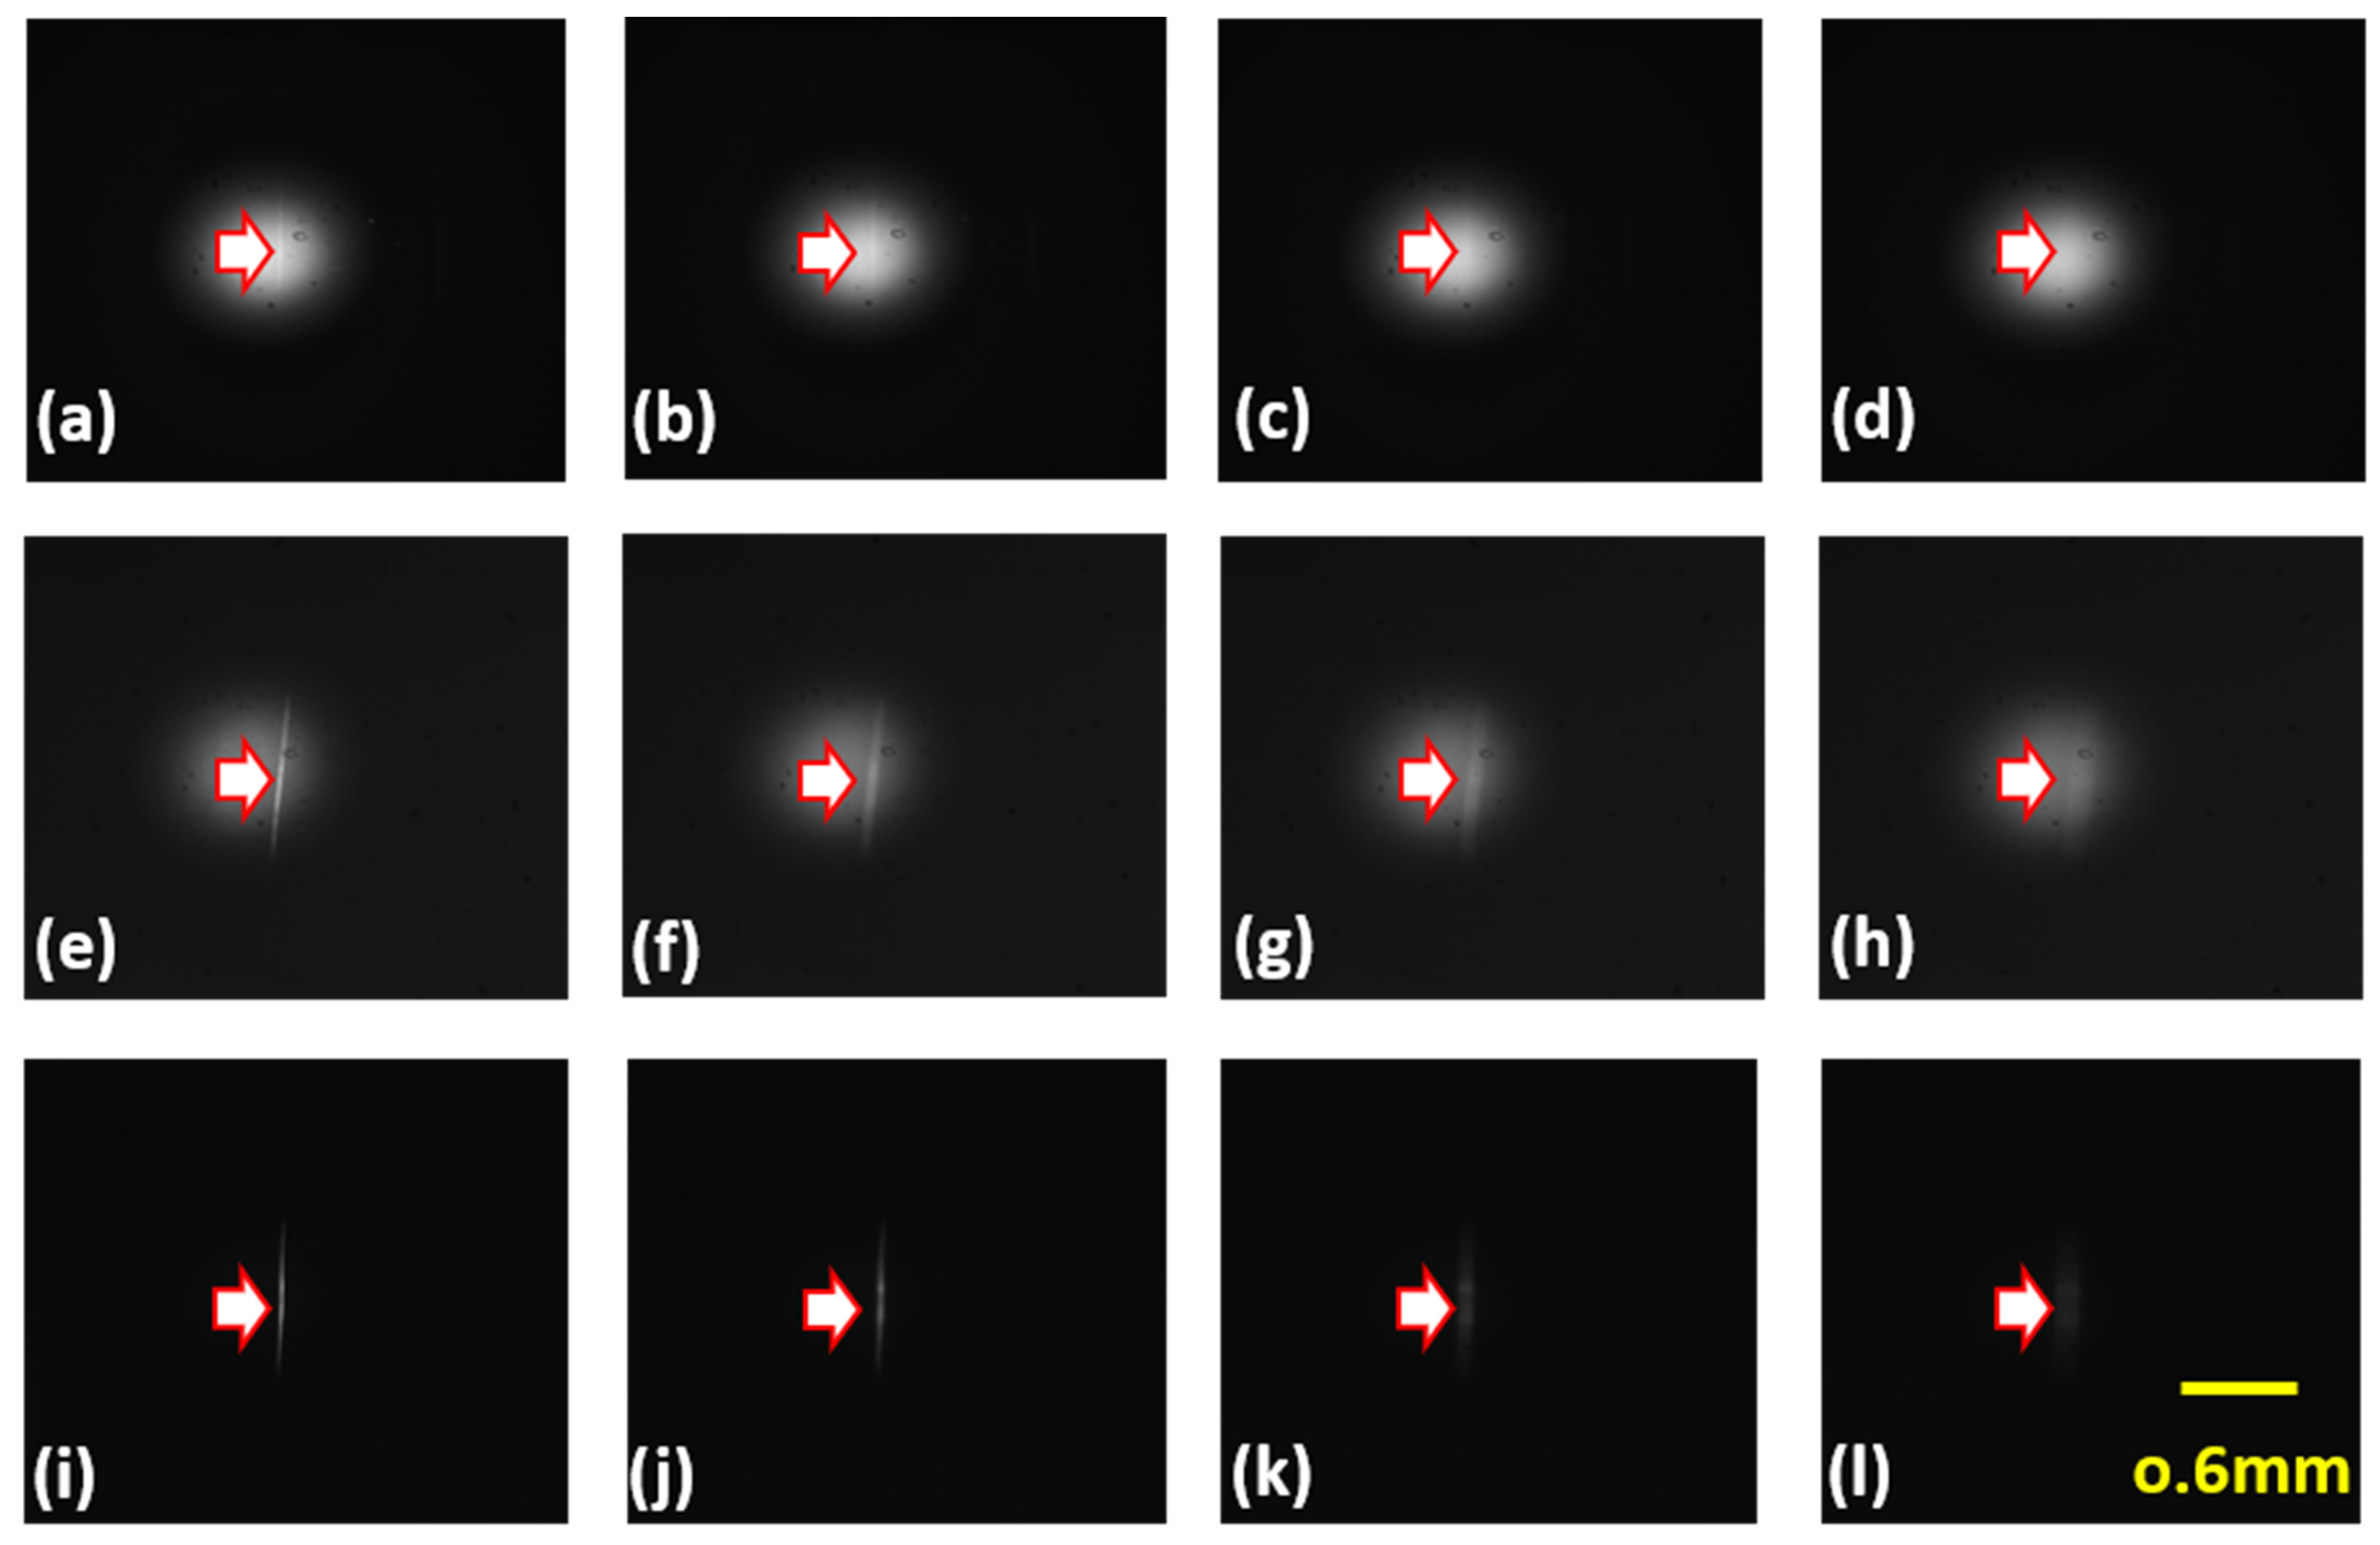
3.1. Scratch Detection with WIS

The experimental control group used a WIS to simulate the conventional AOI system. The white-light LED light source illuminated the sample, as shown in Figure 2. A rotational stage was used to rotate the sample to make the observation direction close to the specular direction while avoiding the specular reflection noise. Lens L2 (50 mm f1.8) was used to image the scratch to the image sensor. The object distance was 17.5 cm, and the image distance was 7 cm. The image sensor (Basler da1920–30 um, 1920 × 1080 resolution, 2.2 μm × 2.2 μm pixel pitch) was put on the imaging plane of the sample, and a shift stage was used to control the defocus distance. A beam splitter (BS2, half reflection and half transmission) was located between the sample and L2 because it was necessary for the experimental group. We kept it in the WIS system to ensure similar experimental conditions between the control group and the experimental group.
Figure 3 shows the scratch observed by the camera with different tilting angles. Figure 3a shows, when observing the scratch in the specular direction, the specular reflection noise was stronger than the scratch signal and made it unobservable. If we slightly tilted the sample 2°, we could observe a clear scratch signal along with a specular reflection noise (Figure 3b). If the tilting angle was as large as 7°, the clear scratch could be observed without the disturbance of the specular reflection noise (Figure 3c). When the tilting angle was larger than 13°, we could not recognize the scratch anymore (Figure 3d). The small observing angle range made the scratch hard to be found by a production line checker. In this paper, the defocusing tolerance of the WIS technique and the DHD technique were the concern points. Therefore, the observation direction was tilted 7° from the specular reflection direction.
Figure 4 shows the target images taken by the WIS when the normal direction of the sample tilted 7° from the incident angle. The first row (a–d) shows the pictures with white paint on the back surfaces of the glass. The second row (e–h) shows the pictures with gray paint. The third row (i–l) shows the pictures with white paint. Images (a), (e), and (i) in the first column show the pictures in focus; (b), (f), and (j) in the second column show the pictures defocusing 1 mm; (c), (g), and (k) in the third column show the pictures defocusing 2 mm; and (d), (h), and (l) in the fourth column show the pictures defocusing 3 mm. It shows we could detect the scratch when the imaging setup was aligned carefully. However, the image tended to be blurred as long as the imaging system was out of focus. The stronger the scattering noise was, the lower was the contrast of the scratch to the scattering noise.

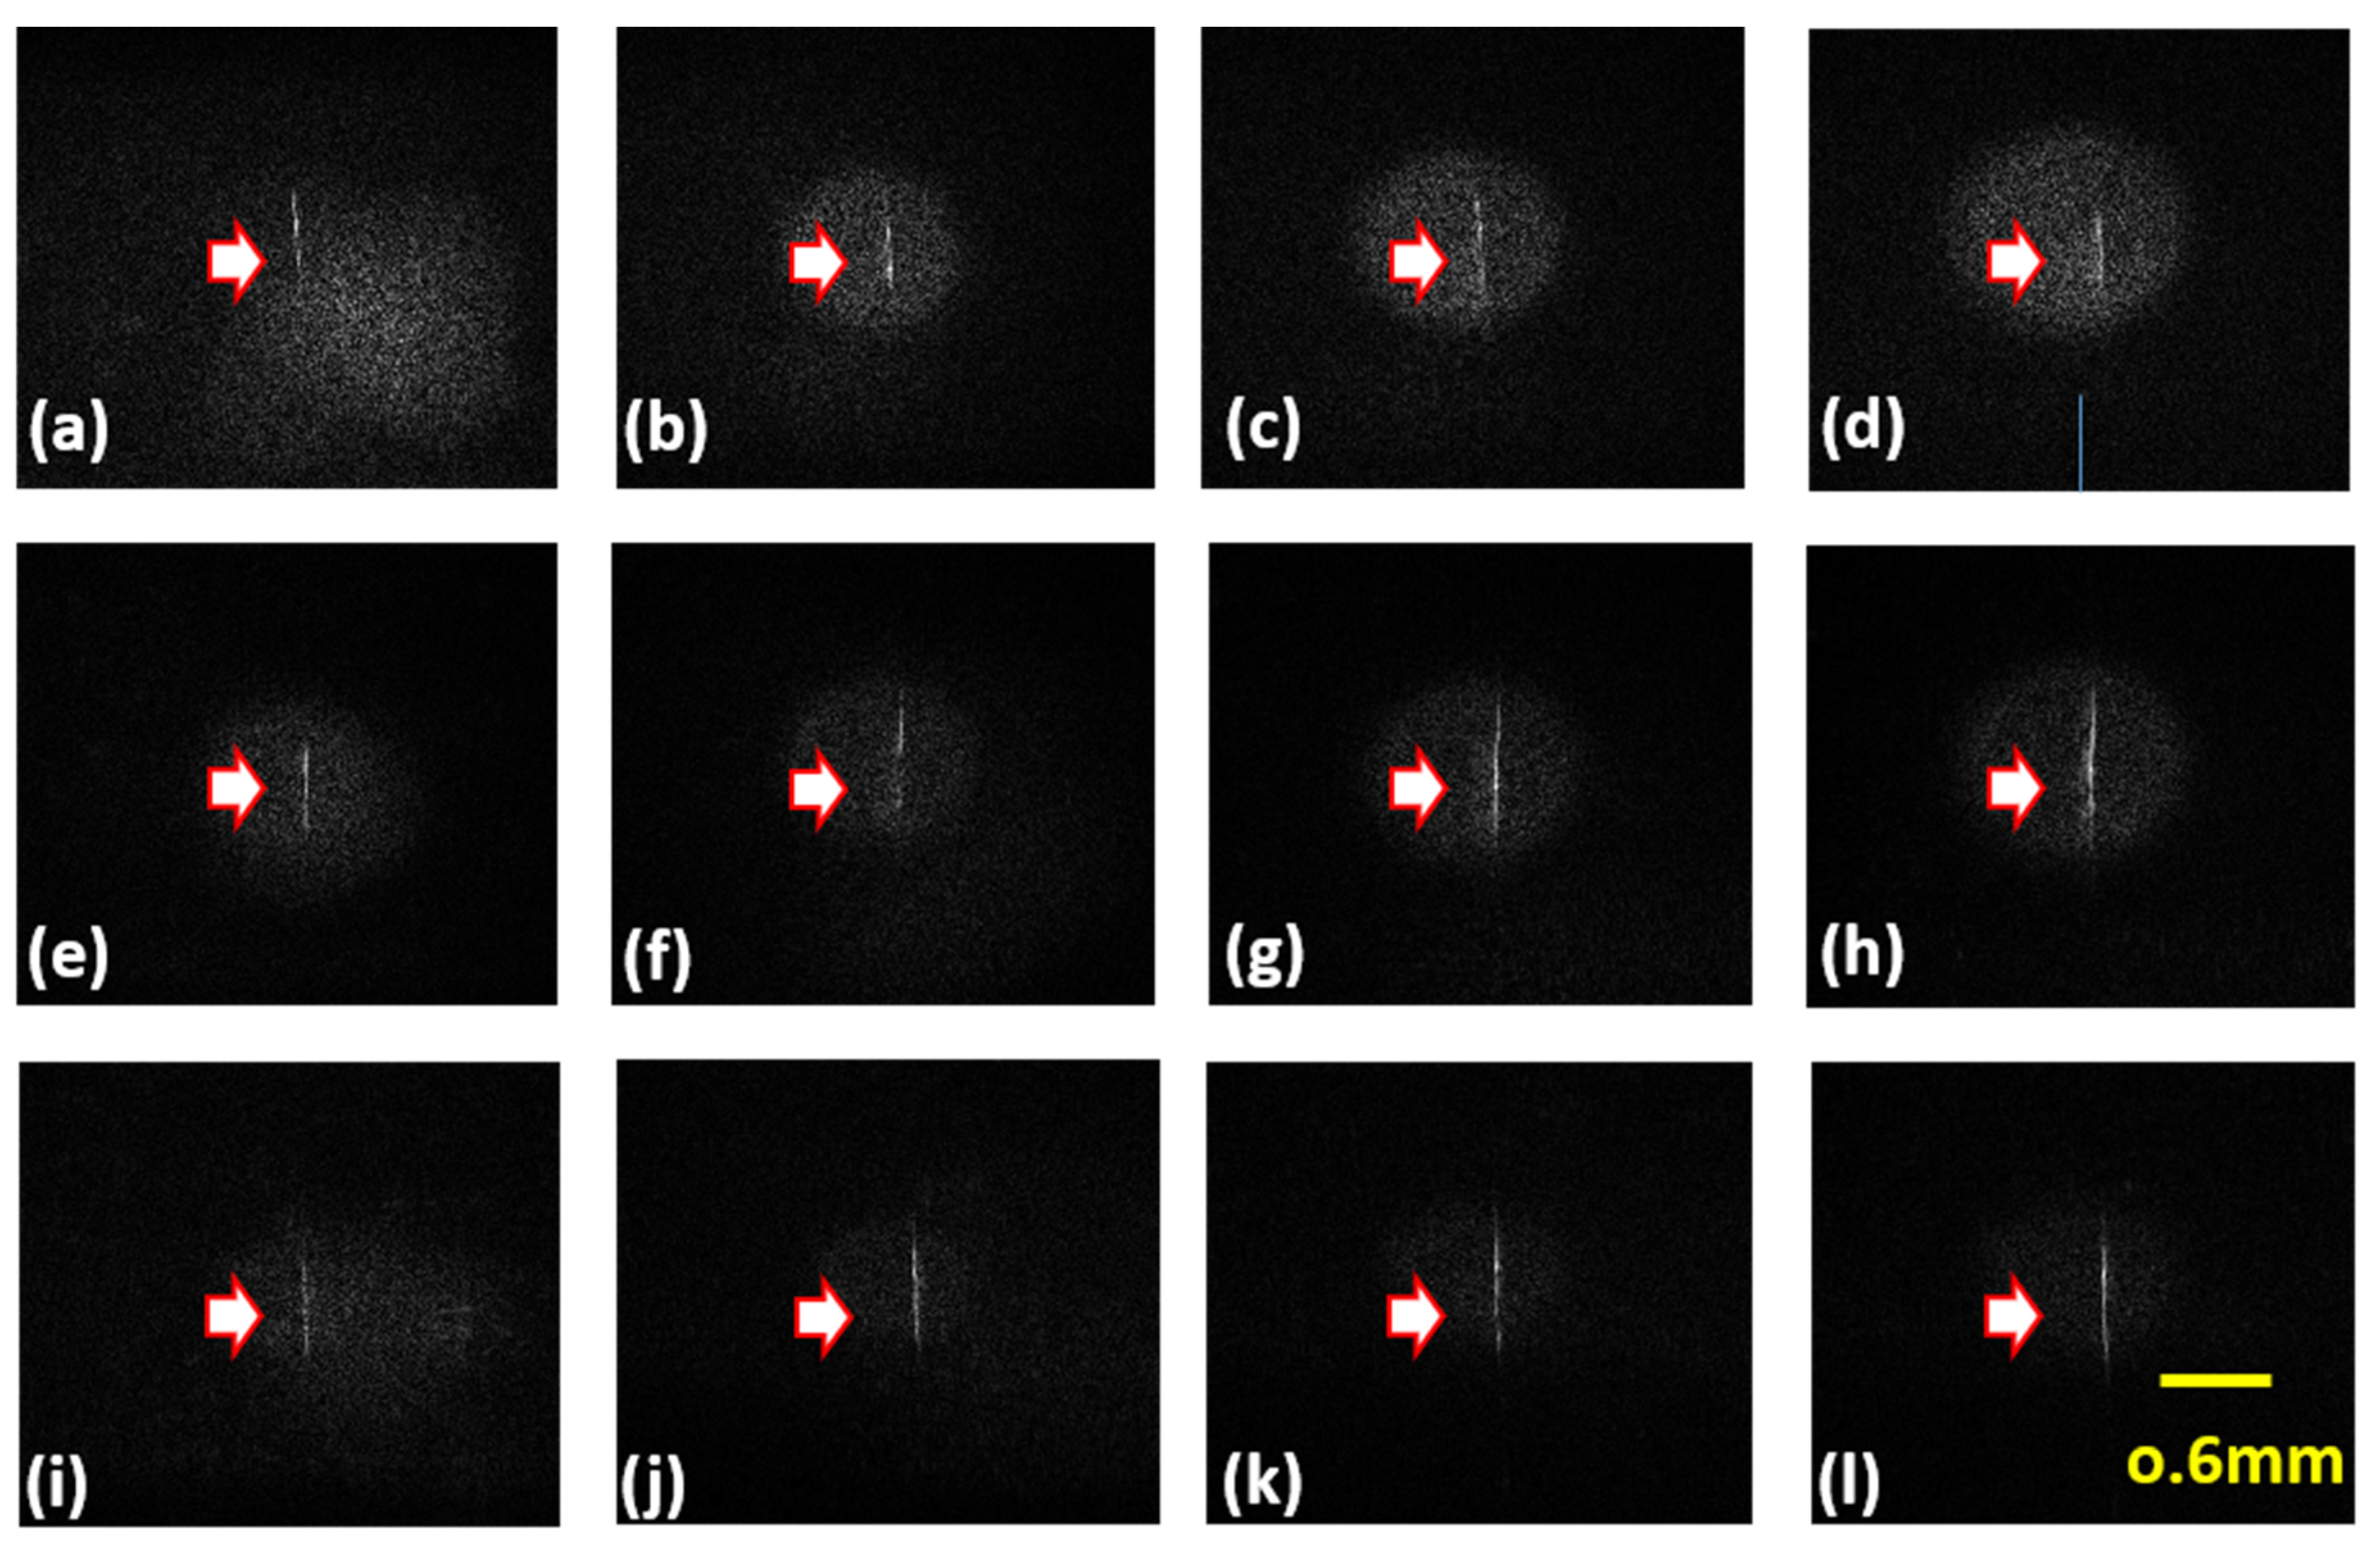
3.2. Scratch Detection with DHD

The experiment setup of the DHD was an off-axis Mach–Zehnder interferometer architecture. The sample was put in the signal beam. The reference beam was tilted to produce an off-axis interference fringe. The image sensor along with the lens (L2) took the picture of the interference fringe on the conjugate plane of the sample. After the off-axis interfering fringe was recorded, we extracted the first order signal in the Fourier domain and shifted it to the center of the Fourier domain, i.e.,
u 1 ( f x , f y ) = { F [ I 0 ( x , y ) ] r e c t ( f x f x 1 w x ) r e c t ( f y f y 1 w y ) } δ ( f x + f x 1 , f y + f y 1 )
where F is the Fourier transform operator; I0 is the captured interference fringe; fx and fy are the coordinates in the Fourier domain along the x direction and the y direction, respectively; rect is the rectangular function, and it is the frequency filter used to extract the first order signal; fx1 and fy1 are the center of the frequency filter; wx and wy are the widths of the frequency filter along the x direction and the y direction, respectively. The angular spectrum beam propagation method was applied to calculate the Fourier spectrum in specific depth z [36,37], i.e.,
u z ( f x , f y , z ) = u 1 ( f x , f y ) e x p ( i k z 1 λ 2 f x 2 λ 2 f y 2 ) · c i r c ( λ 2 f x 2 + λ 2 f y 2 )
where k is the wave vector, and λ is the wavelength. Then, we applied the inverse Fourier transform to obtain the electric field on the distance z from the detection plane to calculate an in-focus image.
I z ( x , y ) = | F 1 [ u z ( f x , f y , z ) ] | 2
The experimental setup for the digital holographic detection (DHD) was an off-axis Mach–Zehnder interferometer, as shown in Figure 5. The expanded laser beam (633 nm, He–Ne laser) was split to a reference beam and a signal beam by the beam splitter (BS1, half reflection and half transmission). The sample was put in the path of the signal beam. A rotational stage was used to rotate the sample to make the sample tilting 7°. The signal diffracted from the scratch was directed to the image sensor by the beam splitter (BS2, half reflection and half transmission) and interfered with the reference beam on the image sensor. The reference beam incident used the image sensor with a tilting angle. Lens L2 (50 mm f1.8) was used to image the scratch to the image sensor. The object distance was 17.5 cm, and the image distance was 7 cm. The image sensor was put on the imaging plane of the sample, and a shift stage was used to induce a defocus distance z0. After the interfering image was captured, we applied Equations (1)–(3) to reconstruct an in-focus image by making the parameter z equal to −z0.
Figure 6 shows the target images taken by the DHD system. We found the scattering noise still mixed with the scratch signal. Thus, the method worked independently with the sample’s thickness. The first row (a–d) shows the reconstructed pictures with white paint on the back surfaces of the glass. The second row (e–h) shows the reconstructed pictures with gray paint. The third row (i–l) shows the reconstructed pictures with white paint. Images (a), (e), and (i) in the first column show the reconstructed pictures with the interference fringe suffering 3 mm defocus; (b), (f), and (j) in the second column show the reconstructed pictures with the interference fringe suffering 6 mm defocus; (c), (g), and (k) in the third column show the reconstructed pictures with the interference fringe suffering 9 mm defocus; and (d), (h), and (l) in the fourth column show the reconstructed pictures with the interference fringe suffering 12 mm defocus. The images became clearer when the image was taken under defocus condition. Whether it was in-focus or defocused up to 3 mm, the reconstructed scratch after digital focusing could always be recognized. It thus shows a large defocusing tolerance in the image capture process.

4. Discussion

In order to quantitatively compare the performance between the WIS system and the DHD system, we analyzed the target images. Figure 7a shows we chose an interesting area of the target image, inside the green frame, to make analyzation. In general, the interesting area should be located inside the scattering area. The area size should be large enough such that the scattering noise dominates the average value. In this paper, the area size was chosen to be 280 × 10 pixels. We used a contrast ratio to evaluate the performance of the system. The contrast ratio (CR) defines the significance of the scratch signal and is expressed as
C R   =   j 1 = 1 N m a x ( I ( i , j 1 ) ) / N i 1 , j 1 = 1 M , N I ( i 1 , j 1 ) / M N
where I(i,j) is the target image inside the interesting area. M and N are the pixel numbers of the interesting area along the x direction and the y direction, respectively. In the numerator, the peak value of each raw was averaged along the column to present the average of the scratch. In the denominator, it was averaged over the interesting area to present the average scattering noise. Figure 7b shows the CR value varying with the defocus distance. Each point with stand deviation bar was calculated from ten interesting areas. The dashed lines, WIS-1, WIS-2, and WIS-3, stand for the CR value of WIS with the glass painted white, gray, and black, respectively. The solid lines, DHD-1, DHD-2, and DHD-3, stand for the CR value of DHD with the glass painted white, gray, and black, respectively. It shows the WIS-3 had better contrast when it was in-focus. However, it dropped dramatically as the imaging sensor defocused larger than 3 mm. WIS-1 and WIS-2 stand for the measurement with strong scattering noise. It shows the defocusing tolerance was smaller than 1 mm. In comparison, the DHD had a moderate CR value when it was in-focus, because it tended to be filtered out in the first-order signal extraction process described in Equation (1). When the DHD was captured with some defocus, the amount of filtered-out signal decreased, and the contrast of the interfering fringe increased. Additionally, it led to a better CR value. Even under the strong scattering noise, DHD-1 always kept a moderate CR value. Compared with the defocus tolerance of WIS, the defocus tolerance of DHD was larger than 10 mm. The high defocus tolerance promises a detection process without optical focusing. It thus benefits the high speed AOI system.

5. Conclusions

Modern consumption products use a great deal of transparent elements, which became more complicated due to the evolution of 3D molding technologies. Additionally, the defect detection of a 3D molding transparent element needs an autofocus technique to make sure a clear image is captured. The requirement of autofocus thus sets a speed limit of the AOI technique. Some elements, such as the glass of the back lid of a smart cell phone, are created with sparkling color or painted with a mark. Thus, the detection of surface defects suffers strong scattering noise. It leads to the demand of surface defects inspection under scattering noise. In this paper, we applied the DHD technique to detect scratches with scattering noise and demonstrated the high defocusing tolerance of the DHD technique. Glass slides were put on top of a diamond knife and were loaded with a weight to generate a scratch with 1.67 µm width. Three different gray levels of paint with absorption ratios of 13.8%, 81.4%, and 93.6%, were painted on the back sides of the glass slides. This generated the scattering noise to simulate glass with sparkling color or glass that was painted with a mark on the backside surface. In the experiment, we used WIS as the control group to simulate the conventional AOI system. It showed, under strong scattering, the defocus tolerance of the WIS system was smaller than 1 mm. In comparison, the defocus tolerance of DHD was larger than 10 mm. The high defocus tolerance promises a detection process without optical focusing. It thus benefits the high speed AOI system.

Author Contributions

Conceptualization, Y.-W.Y.; Data curation, Y.-W.Y.; Investigation, W.-L.W., H.-S.K., C.-C.S. and W.-H.W.; Methodology, Y.-W.Y., W.-L.W., S.-H.M. and C.-C.S.; Resources, H.-S.K., S.-H.M., C.-C.S. and T.-H.Y.; Software, Y.-W.Y., W.-L.W. and Y.-S.L.; Supervision, Y.-W.Y. All authors have read and agreed to the published version of the manuscript.

Funding

This research was funded by Minitry of Science and Technology of the Republic of China, grant number: 108-2221-E-008-097-MY3 and 109-2221-E-035-078.

Institutional Review Board Statement

Not applicable.

Informed Consent Statement

Not applicable.

Data Availability Statement

Data can be available on a request from the corresponding author via email.

Conflicts of Interest

The authors declare no conflict of interest.

References

  1. Malamas, E.N.; Petrakis, E.G.; Zervakis, M.; Petit, L.; Legat, J.-D. A survey on industrial vision systems, applications and tools. Image Vis. Comput. 2003, 21, 171–188. [Google Scholar] [CrossRef]
  2. He, Z.; Sun, L. Surface defect detection method for glass substrate using improved Otsu segmentation. Appl. Opt. 2015, 54, 9823–9830. [Google Scholar] [CrossRef]
  3. Rosli, N.; Fauadi, M.; Awang, N.; Noor, A. Vision-Based Defects Detection for Glass Production based on Improved Image Processing Method. J. Advanc. Manufactur. Technol. 2018, 84, 203–212. [Google Scholar]
  4. Fenzani, F.; Rahmani, A. Wavelet analysis for defects detection in flat glass. In Proceedings of the Multiconference on Computational Engineering in Systems Applications, Beijing, China, 4–6 October 2006. [Google Scholar]
  5. Akdemïr, B.; Öztürk, S. Glass Surface Defects Detection with Wavelet Transforms. Int. J. Mater. Mech. Manuf. 2015, 3, 170–173. [Google Scholar] [CrossRef] [Green Version]
  6. Tribhuwan, S.; Rajeshwar, L. Agrawal and A. Acharya. Detection of Defects in Glass Sheet using C.S.C based Segmentation Method. Int. J. Comput. Appl. 2013, 68, 29–32. [Google Scholar]
  7. Liu, Y.; Yu, F. Automatic inspection system of surface defects on optical IR-CUT filter based on machine vision. Opt. Lasers Eng. 2014, 55, 243–257. [Google Scholar] [CrossRef]
  8. Adamo, F.; Attivissimo, F.; Di Nisio, A. Calibration of an Inspection System for Online Quality Control of Satin Glass. IEEE Trans. Instrum. Meas. 2010, 59, 1035–1046. [Google Scholar] [CrossRef]
  9. Ai, J.; Zhu, X. Analysis and detection of ceramic-glass surface defects based on computer vision. In Proceedings of the 4th World Congress on Intelligent and Automation (Cat. No.02EX527), Shanghai, China, 10–14 June 2002; pp. 3014–3018. [Google Scholar]
  10. Singh, T.S.; Sukhpreet, K. Study on Various Glass Defect Using SIFT. Int. J. Innov. Eng. Technol. 2013, 2, 316–326. [Google Scholar]
  11. Zhao, J.; Kong, Q.-J.; Zhao, X.; Liu, J.; Liu, Y. A Method for Detection and Classification of Glass Defects in Low Resolution Images. In Proceedings of the Sixth International Conference on Image and Graphics, Hefei, China, 12–15 August 2011; pp. 642–647. [Google Scholar]
  12. Chang, H.-C.; Shih, T.-M.; Zu Chen, N.; Pu, N.-W. A microscope system based on bevel-axial method auto-focus. Opt. Lasers Eng. 2009, 47, 547–551. [Google Scholar] [CrossRef]
  13. Yazdanfar, S.; Kenny, K.B.; Tasimi, K.; Corwin, A.D.; Dixon, E.L.; Filkins, R.J. Simple and robust image-based autofocusing for digital microscopy. Opt. Express 2008, 16, 8670–8677. [Google Scholar] [CrossRef]
  14. Lee, M.E.; Chen, C.F.; Lin, T.N.; Chen, C.N. The application of discrete cosine transform (DCT) combined with the nonlinear regression routine on optical auto-focusing. In Proceedings of the 2009 Digest of Technical Papers International Conference on Consumer Electronics, Las Vegas, NV, USA, 10–14 January 2009; pp. 1–2. [Google Scholar]
  15. Chen, Z.; Shen, Y.; Bao, W.; Li, P.; Wang, X.; Ding, Z. Identification of surface defects on glass by parallel spectral domain optical coherence tomography. Opt. Express 2015, 23, 23634–23646. [Google Scholar] [CrossRef]
  16. Huang, D.; Swanson, E.A.; Lin, C.P.; Schuman, J.S.; Stinson, W.G.; Chang, W.; Hee, M.R.; Flotte, T.; Gregory, K.; Puliafito, C.A.; et al. Optical coherence tomography. Science 1991, 254, 1178–1181. [Google Scholar] [CrossRef] [PubMed] [Green Version]
  17. Tsai, M.-T.; Chang, F.-Y.; Lee, Y.-J.; Lee, J.-D.; Wang, H.-C.; Lee, C.-K. Defect detection and property evaluation of indium tin oxide conducting glass using optical coherence tomography. Opt. Express 2011, 19, 7559–7566. [Google Scholar] [CrossRef] [PubMed]
  18. Cho, N.H.; Park, K.; Kim, J.-Y.; Jung, Y.; Kim, J. Quantitative assessment of touch-screen panel by nondestructive inspection with three-dimensional real-time display optical coherence tomography. Opt. Lasers Eng. 2015, 68, 50–57. [Google Scholar] [CrossRef]
  19. Wijesinghe, R.E.; Park, K.; Jung, Y.; Kim, P.; Jeon, M.; Kim, J. Industrial resin inspection for display production using automated fluid-inspection based on multimodal optical detection techniques. Opt. Lasers Eng. 2017, 96, 75–82. [Google Scholar] [CrossRef]
  20. Yamaguchi, I.; Kato, J.-I.; Ohta, S.; Mizuno, J. Image formation in phase-shifting digital holography and applications to microscopy. Appl. Opt. 2001, 40, 6177–6186. [Google Scholar] [CrossRef]
  21. Greenbaum, A.; Luo, W.; Su, T.-W.; Göröcs, Z.; Xue, L.; O Isikman, S.; Coskun, A.; Mudanyali, O.; Ozcan, A. Imaging without lenses: Achievements and remaining challenges of wide-field on-chip microscopy. Nat. Methods 2012, 9, 889–895. [Google Scholar] [CrossRef]
  22. Yu, Y.-W.; Sun, C.-C.; Hsieh, P.-K.; Huang, Y.-H.; Song, C.-Y.; Yang, T.-H. An edge-lit volume holographic optical element for an objective turret in a lensless digital holographic microscope. Sci. Rep. 2020, 10, 1–9. [Google Scholar]
  23. Montrésor, S.; Picart, P.; Sakharuk, O.; Muravsky, L. Error analysis for noise reduction in 3D deformation measurement with digital color holography. J. Opt. Soc. Am. B 2017, 34, B9–B15. [Google Scholar] [CrossRef]
  24. Oliveira, G.N.; Rodrigues, D.M.C.; Nunes, L.C.S.; Santos, P.A.M.D. Digital Fourier transform holography applied to investigate mechanical deformation in polymers. Opt. Lasers Eng. 2012, 50, 1798–1803. [Google Scholar] [CrossRef]
  25. Hesseling, C.; Homeyer, T.; Peinke, J.; Gülker, G. Particle depth position detection by 2D correlation in digital in-line holography. Opt. Lett. 2016, 41, 4947–4950. [Google Scholar] [CrossRef] [PubMed]
  26. Desse, J.-M.; Picart, P.; Olchewsky, F. Quantitative phase imaging in flows with high resolution holographic diffraction grating. Opt. Express 2015, 23, 23726–23737. [Google Scholar] [CrossRef] [Green Version]
  27. Xia, H.; Guo, R.; Yan, F.; Cheng, H.; Lin, Z.; Ma, Q.; Wang, F. Simultaneous measurement of stress-optic constant and stress field of transparent plate by digital holographic interferometry. Optik 2016, 127, 11974–11981. [Google Scholar] [CrossRef]
  28. Xia, H.-T.; Guo, R.-X.; Fan, Z.-B.; Cheng, H.-M.; Yang, B.-C. Non-invasive Mechanical Measurement for Transparent Objects by Digital Holographic Interferometry Based on Iterative Least-Squares Phase Unwrapping. Exp. Mech. 2011, 52, 439–445. [Google Scholar] [CrossRef]
  29. Chien, K.-C.C.; Tu, H.-Y. Complex defect inspection for transparent substrate by combining digital holography with machine learning. J. Opt. 2019, 21, 085701. [Google Scholar] [CrossRef]
  30. Cheng, C.J.; Chang, C.K.C.; Lin, Y.C. Digital hologram for data augmentation in learning-based pattern classification. Opt. Lett. 2018, 43, 5419–5422. [Google Scholar] [CrossRef]
  31. Ilhan, H.A.; Doğar, M.; Özcan, M. Fast autofocusing in digital holography using scaled holograms. Opt. Commun. 2013, 287, 81–84. [Google Scholar] [CrossRef]
  32. Ilhan, H.A.; Doğar, M.; Özcan, M. Real-time, auto-focusing digital holographic microscope using graphics processors. Rev. Sci. Instruments 2013, 84, 083704. [Google Scholar]
  33. Dubois, F.; Schockaert, C.; Callens, N.; Yourassowsky, C. Focus plane detection criteria in digital holography microscopy by amplitude analysis. Opt. Express 2006, 14, 5895–5908. [Google Scholar] [CrossRef]
  34. Lyu, M.; Yuan, C.; Li, D.; Situ, G. Fast autofocusing in digital holography using the magnitude differential. Appl. Opt. 2017, 56, F152–F157. [Google Scholar] [CrossRef]
  35. Ren, Z.; Xu, Z.; Lam, E.Y. Learning-based nonparametric autofocusing for digital holography. Optica 2018, 5, 337–344. [Google Scholar] [CrossRef]
  36. Goodman, J.W. Introduction to Fourier Optics, 2nd ed.; McGraw-Hill: Boston, MA, USA, 2002; pp. 55–58. [Google Scholar]
  37. Kim, M.K. Principles and techniques of digital holographic microscopy. SPIE Rev. 2010, 1, 018005. [Google Scholar] [CrossRef] [Green Version]
Figure 1. The picture of the sample: (a) a scratch was produced on the front surface of the glass slide. Then, the back surface of the glass slide was painted white, gray, and black; (b) the microscope image of the scratch.
Crystals 11 01107 g001
Figure 2. Schematic diagram of the WIS setup, where BS means beam splitter, and L means lens.
Crystals 11 01107 g002
Figure 3. The scratch with scattering produced by the gray paint was observed by the camera. We rotated the transparent plate to find the best observation angle. It shows the normal direction of the sample was tilted (a) 0°, (b) 2°, (c) 7°, and (d) 13° from the incident angle.
Crystals 11 01107 g003
Figure 4. The target images taken from the WIS system with normal direction of the sample tilting 7° from the incident angle. The paint on the back surface of the glass was (ad) white, (eh) gray, and (il) black. (a,e,i) in the first column show the pictures in focus; (b,f,j) in the second column show the pictures defocusing 1mm; (c,g,k) in the third column show the pictures defocusing 2 mm; (d,h,l) in the third column show the pictures defocusing 3 mm.
Crystals 11 01107 g004
Figure 5. Schematic diagram of the DHD setup, where BS means beam splitter, and L means lens.
Crystals 11 01107 g005
Figure 6. The target images taken from the DHD system with normal direction of the sample tilting 7° from the incident angle. The paint on the back surfaces of the glass was (ad) white, (eh) gray, and (il) black. (a,e,i) in the first column show the reconstructed pictures with the interference fringe suffering 3 mm defocus; (b,f,j) in the second column show the reconstructed pictures with the interference fringe suffering 6 mm defocus; (c,g,k) in the third column show the reconstructed pictures with the interference fringe suffering 9 mm defocus; (d,h,l) in the third column show the reconstructed pictures with the interference fringe suffering 12 mm defocus.
Crystals 11 01107 g006
Figure 7. (a) The interesting area for the calculation of the CR value; (b) the CR value varying with the defocus distance.
Crystals 11 01107 g007
Publisher’s Note: MDPI stays neutral with regard to jurisdictional claims in published maps and institutional affiliations.

