Article

In Situ Evolution of Pores in Lithium Hydride at Elevated Temperatures Characterized by X-ray Computed Tomography

1
State Key Laboratory of Particle Detection and Electronics, University of Science and Technology of China, Hefei 230026, China
2
School of Nuclear Science and Technology, University of Science and Technology of China, Hefei 230027, China
3
Science and Technology on Surface Physics and Chemistry Laboratory, Mianyang 621908, China
*
Author to whom correspondence should be addressed.
Crystals 2021, 11(9), 1093; https://doi.org/10.3390/cryst11091093
Submission received: 27 July 2021 / Revised: 1 September 2021 / Accepted: 2 September 2021 / Published: 8 September 2021
(This article belongs to the Special Issue Defects in Crystals)

Abstract

:
The evolution of defects such as pores at elevated temperatures is crucial for revealing the thermal stability of lithium hydride ceramic. The in situ evolution of pores in sintered lithium hydride ceramic from 25 °C to 500 °C, such as the statistics of pores and the 3D structure of pores, was investigated by X-ray computed tomography. Based on the statistics of pores, the porosity significantly increased from 25 °C to 200 °C and decreased after 200 °C, due to the significant change in the number and total volume of the round-shaped pores and the branched crack-like pores with an increasing temperature. According to the 3D structure of pores, the positions of pores did not change, and the sizes of pores went up in the range of 25–200 °C and went down after 200 °C. Some small round-shaped pores with an Equivalent Diameter of less than 9 μm appeared at 200 °C and disappeared at elevated temperatures. Some adjacent pores of all types connected at 200 °C, and some branched crack-like pores gradually disconnected with an increasing temperature. The expansion of pores at 200 °C caused by the release of residual hydrogen and the contraction of pores after 200 °C because of the migration and diffusion of some hydrogen in pores might be the reason for the evolution of pores with an increasing temperature.

1. Introduction

Lithium hydride (LiH), one of the most important ceramic materials in nuclear engineering, is an ideal material for neutron shielding and moderating due to the combination of a high absorption cross-section, high hydrogen density and high melting point (~683 °C) [1,2,3,4,5]. As a special ceramic which has an easy deliquescence and combustion in air at room temperature [6,7], LiH ceramic might have complex properties at a high temperature. The mechanical property of LiH under high temperatures was measured, indicating that the tensile strength of sintered LiH increased slightly before 300 °C and decreased after 300 °C [7,8]. The evolution of its microstructures, such as grains, intrinsic defects and micro-cracks, might lead to its tensile strength change with the temperature. The indirect inference of the grain effect through the fracture surface has been studied [7,8] and was not sufficient to explain the change of tensile properties with the temperature. Thus, it is critical to measure the amount, size, and location of defects such as pores and inclusions of LiH, especially at different temperatures, which may help us understand the thermal damage mechanism.
However, the internal defects of ceramics were difficult to detect. Normally, the ultrasonic method [9,10,11,12] was used to measure ceramics defects, which were surface cracks generated by a thermal shock loading test, and scanning electron microscopy (SEM) was used to obverse the fracture surface [7,8,13,14,15,16]. Owing to the depth limitation of the resolution and focus, these methods cannot nondestructively characterize the internal defects of ceramics. Recently, the resolution of X-ray computed tomography (XCT) has reached the μm level [17]. XCT, such as micro-focus X-ray computed tomography (micro-CT), synchrotron radiation X-ray computed tomography (SR-CT) and multiscale X-ray computed tomography, has been used to investigate the pore evolution of some other ceramic materials in sintering, such as boron carbide, silicon nitride, alumina and silicon carbide [18,19,20,21,22,23,24,25,26,27]. Nevertheless, it was difficult to characterize the in situ changes of defects in sintered ceramics with an increasing temperature. Hence, XCT was first used to characterize the pores of sintered LiH ceramic in the present paper, particularly the in situ evolution of pores at elevated temperatures.
For the closed porosity, the common measurement method was the effective density method [28]. However, it was difficult to measure the density of LiH because of its reactivity. Moreover, the density of LiH has been measured by several methods, such as the pycnometer, the helium densitometer and X-ray crystallography, and the results showed that the volumetric density was higher than its theoretical density because of hydrolysis products [6]. Thus, the porosity of LiH could not be computed according to the measured density. XCT could be more appropriate to measure the porosity of LiH.
The current paper studied the temperature effect on the pores of sintered LiH ceramic by XCT. There were three methods used to separate the pores from the LiH matrix: Otsu, the iterative self-organizing data (IsoData) segmentation algorithm and the combination of the nonlinear diffusion filter and Otsu algorithm. The in situ evolution of pores in sintered LiH ceramic from 25 °C to 500 °C, such as the statistics of pores and the 3D structure of pores, was analyzed in detail.

2. Materials and Methods

Lithium hydride ceramic was obtained by powder prepared by the reaction of lithium metal with hydrogen and was sintered [2,6,7,8,29]. A specimen with a size of 8 × 4 × 3 mm3 was heated in a vacuum furnace from a universal testing machine at 200 °C, 300 °C, 400 °C and 500 °C for thirty min, respectively. The Zeiss Xradia 520 Versa (Zeiss, Germany) Computed Tomography system was used to obtain a series of cross-section reconstructed images (CT images) of LiH. With a voxel size of 4.1902 μm, 2001 tomographic projections with a 2 s exposure time were obtained over a full 360° rotation for a total scanning time of approximately 150 min. The voltage was 40 kV and the target current was 75 μA.
The porosity of LiH at different temperatures was computed over a region of interest (ROI) defined by a size of 850 × 1040 × 620 voxels. There were some segmentation algorithms that could be used to segment the pores from the matrix, such as the Mean, Otsu [30], IsoData, fuzzy c-mean clustering (FMC), Maximum Entropy (MaxEntropy) and K-mean clustering (KMC) segmentation algorithms [31]. The Otsu, IsoData and FMC segmentation algorithms, when compared with other algorithms, had a good performance in the pore and grain separation of rock [31].
The present work used the Otsu and IsoData algorithms to segment the images based on the histogram of grey levels for porosity computing. The Otsu segmentation algorithm determines the optimal threshold to segment the image based on the minimal or maximal variances between the two parts divided [32]. The IsoData segmentation algorithm is a clustering algorithm, which allows one to divide the scatter datasets into different numbers of clusters to obtain the segmented results by minimizing both the intra-cluster variances and the squared error function [33]. Because the five groups of images had different noises, the filter, the nonlinear diffusion algorithm, was used to analyze the noise influence on porosity. The nonlinear diffusion algorithm could preserve the edge because the diffusion was reduced or stopped in the vicinity of edges [34]. The images were filtered by the nonlinear diffusion algorithm and then segmented by the Otsu algorithm.
According to the images segmented by the Otsu and IsoData algorithms and the combination of the nonlinear diffusion algorithm and Otsu algorithm, the volume and amount of pores were computed by Avizo 2020. The volume of pores corresponded to the number of voxels of the pores multiplied by the volume of a single voxel. The shape of pores was viewed by a three-dimensional rendering based on segmented images. The porosity was defined as the ratio of the pores’ volume to ROI volume.

3. Results and Discussion

3.1. Statistics of Pores

The porosity computed by Otsu, IsoData segmentation algorithm and the combination of nonlinear diffusion filter and Otsu algorithm is shown in Figure 1. The change of porosity computed by Otsu, IsoData algorithm and the combination of nonlinear diffusion filter and Otsu algorithm is similar. The trend of the porosity climbs from 25 °C to 200 °C, and drops after 200 °C. The change of porosity from 25 °C to 200 °C is about a third of the porosity at room temperature. The porosity is very small, less than 1.2% at different temperatures. The porosity computed by combining the filter and Otsu algorithm is smaller than that computed by the other two algorithms because some small pores are filtered.
As shown in Figure 2, there are many pores in the LiH specimen. The distribution of pores is not uniform. From the shape of pores, three kinds of pores are divided: round-shaped (Type I) pores, long strip (Type II) pores and branched crack-like (Type III) pores. Long strip pores and branched crack-like pores are formed at the boundaries among granules at sintering [23]. The length of Type II pores and Type III pores is the maximum of the 3D Feret Diameters, which is defined as the distance between two parallel tangents of the particle at an arbitrary angle. The diameter of Type II pores is the largest distance between two parallel lines touching the pore without intersecting it and lying in a plane orthogonal to the length. The Equivalent Diameter of Type I pores is the diameter of a sphere that has the same volume as the pores. The ratio of the length to diameter of long strip (Type II) pores is greater than 2.5. The evolution of the three kinds of pores with the temperature is different and will be analyzed in the next section.
Figure 3a–c shows the amount statistical distribution of the three kinds of pores at different temperatures. The x axis is the median value of the statistical interval. The amount of Type I pores decreases as their volume rises at different temperatures. However, Type II and Type III pores increase and then decrease with an increasing volume. The amount of pores is the largest at 200 °C in most statistical intervals, except Type II pores. At different temperatures, the main volume range of three kinds of pores is described as follows. About 84–85% of Type I pores have a volume of 0–1030 μm3, and the Equivalent Diameter is about 0–13 μm. The volume range of about 80–86% of Type II pores is 368–3899 μm3. Their length is about 13–101 μm, and the diameter is about 4–23 μm. There are about 84–85% of Type III pores in the range of 1471–22,292 μm3, and the length is about 21–191 μm.
The amount and volume change of the three kinds of pores with an increasing temperature are shown in Figure 4a,b. In the range of 25–500 °C, the amount of Type I pores, Type II pores and Type III pores accounts for about 78–80%, 1.4–2% and 18–20% of the sum, respectively. Thus, the ordinate scale of Type I pores is three times that of Type III pores and 30 times that of Type II pores in the graph showing the amount as a function of the temperature. The volume of Type III pores is 89–92% of the total, which is about 10 times that of Type I pores and 100 times that of Type II pores. According to the volume relationship of the three kinds of pores, the ordinate scale is set as shown in Figure 4a,b. The number of Type I and III pores rises in the range of 25–200 °C and falls after 200 °C. Their amount tendency is the same as their volume change with an increasing temperature. This shows that the amount change of Type I and III pores is one of the reasons for the change of their total volume. The amount change of Type I pores is more significant than that of Type II and III pores. However, the volume change of Type III pores is the highest, at about 95–98% of the total volume change in the same temperature range. The volume change of each pore may be the cause of the volume change of different types of pores with an increasing temperature. The amount and total volume of Type II pores slightly changes in the range of 25–500 °C. To sum up, the combination of the amount and volume change leads to the porosity change with an increasing temperature, and the porosity change of LiH is mainly affected by Type I and III pores.

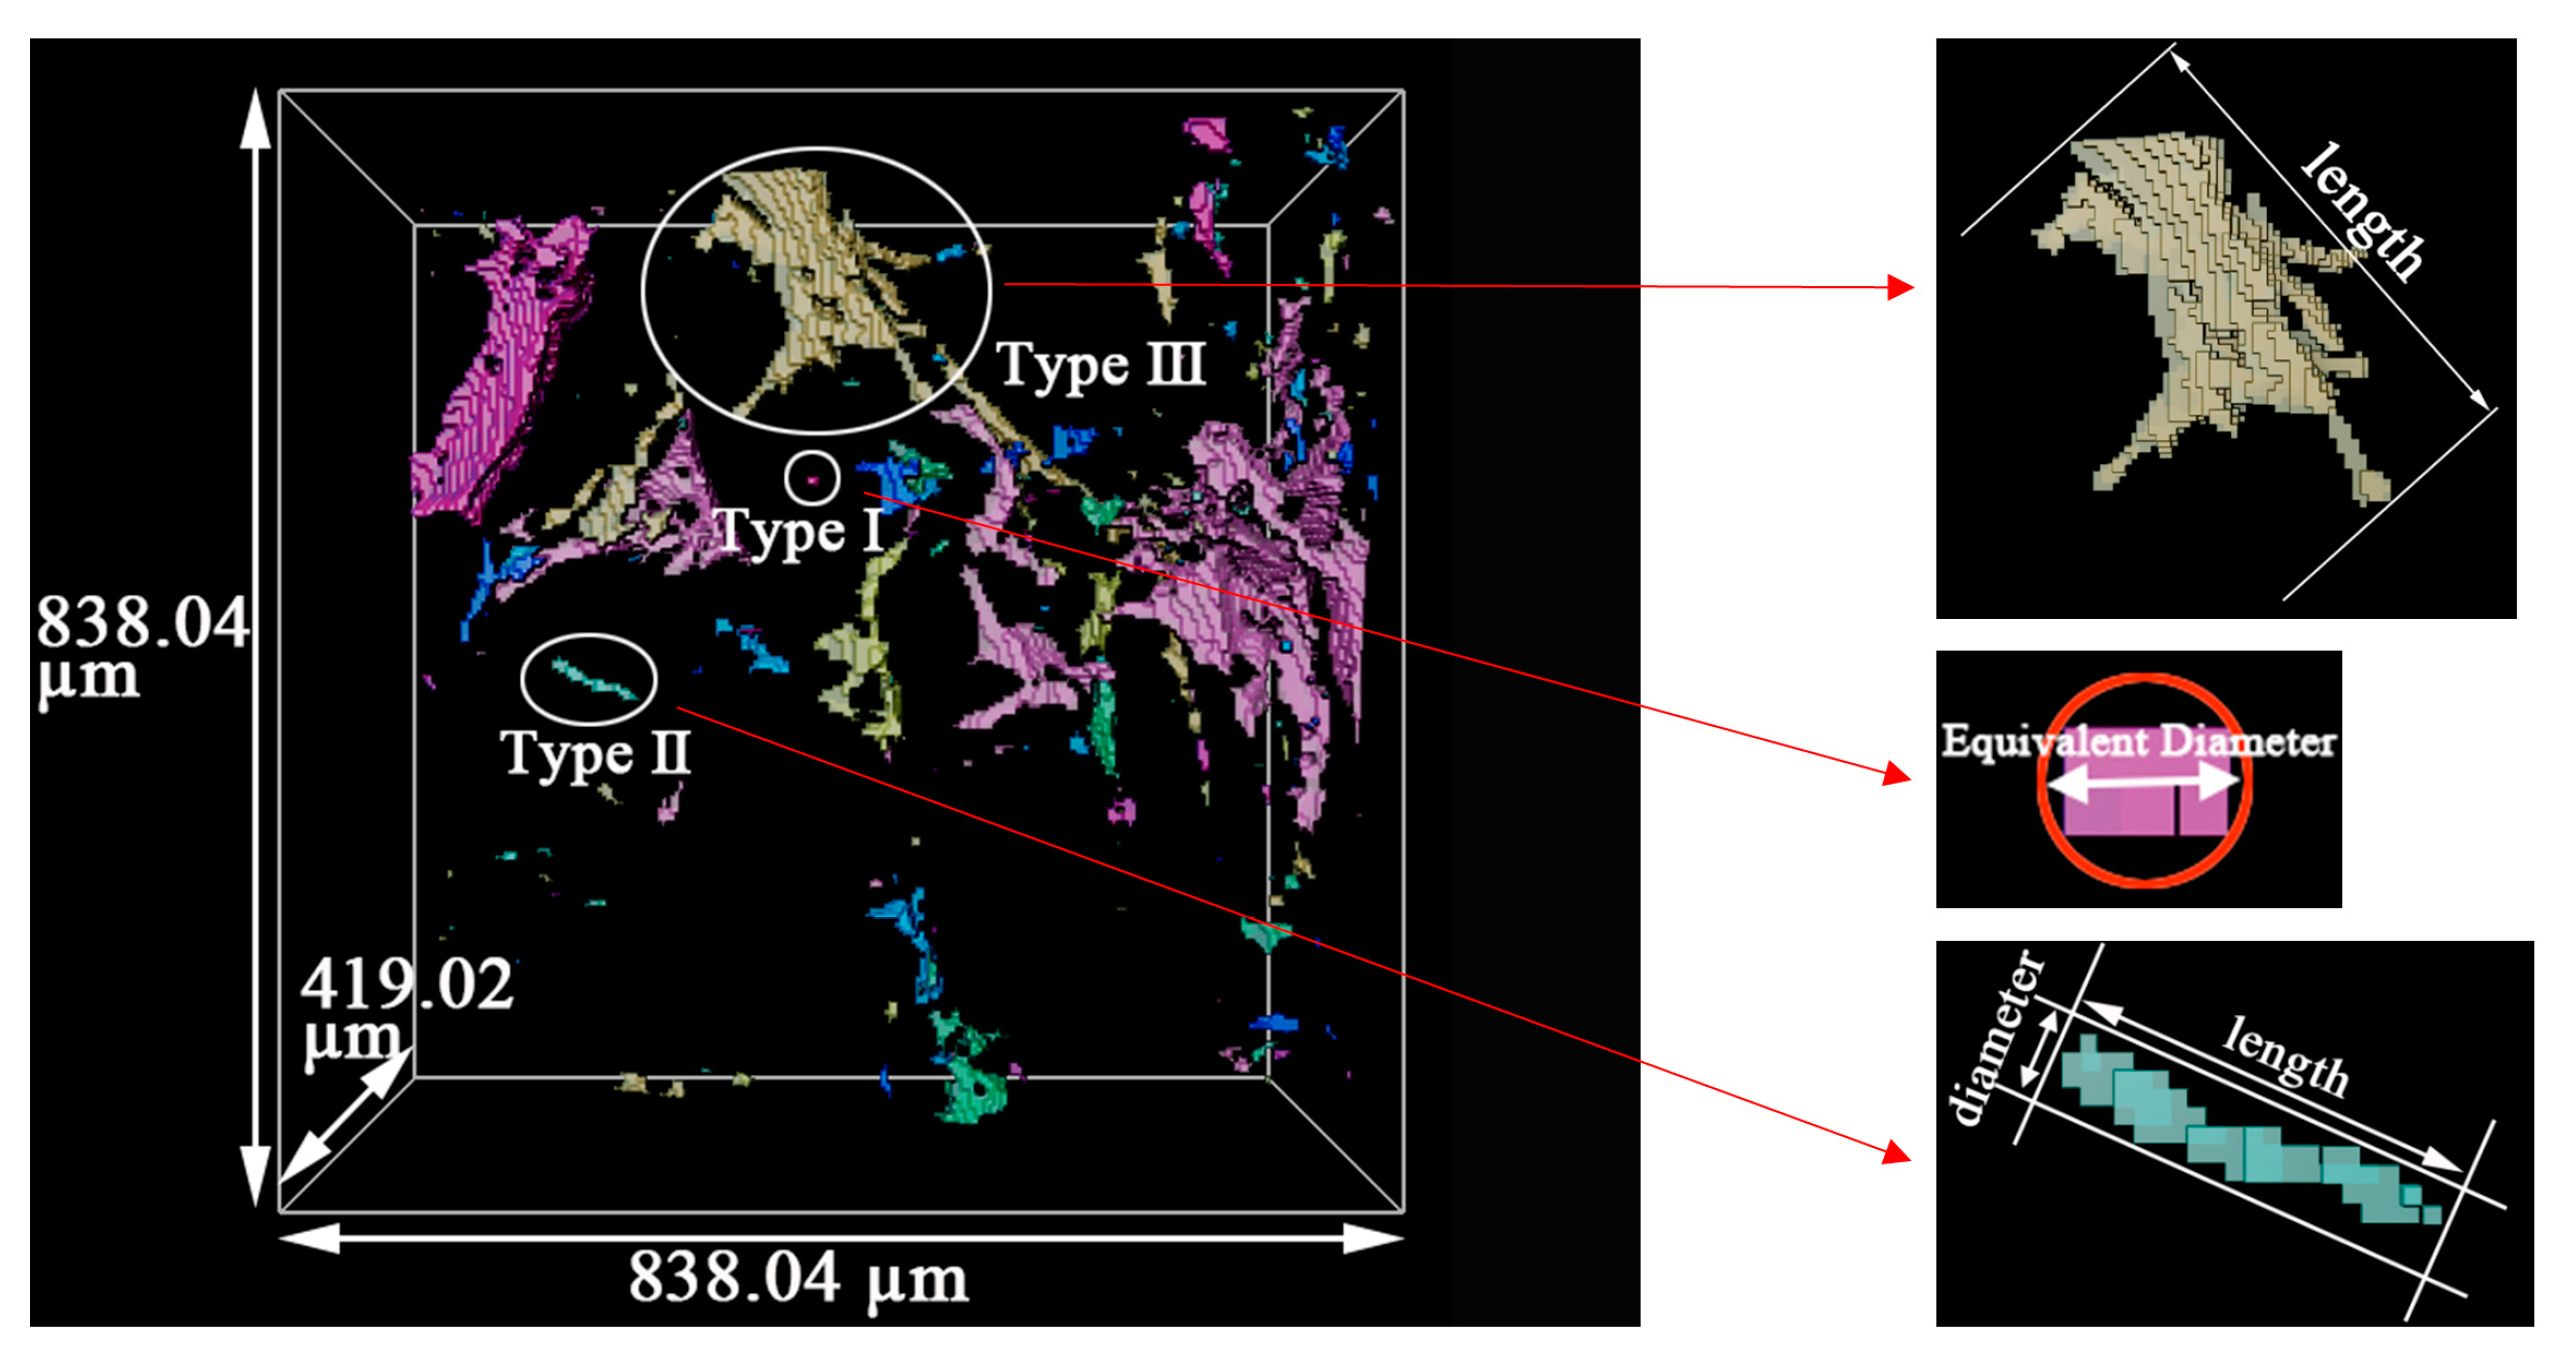
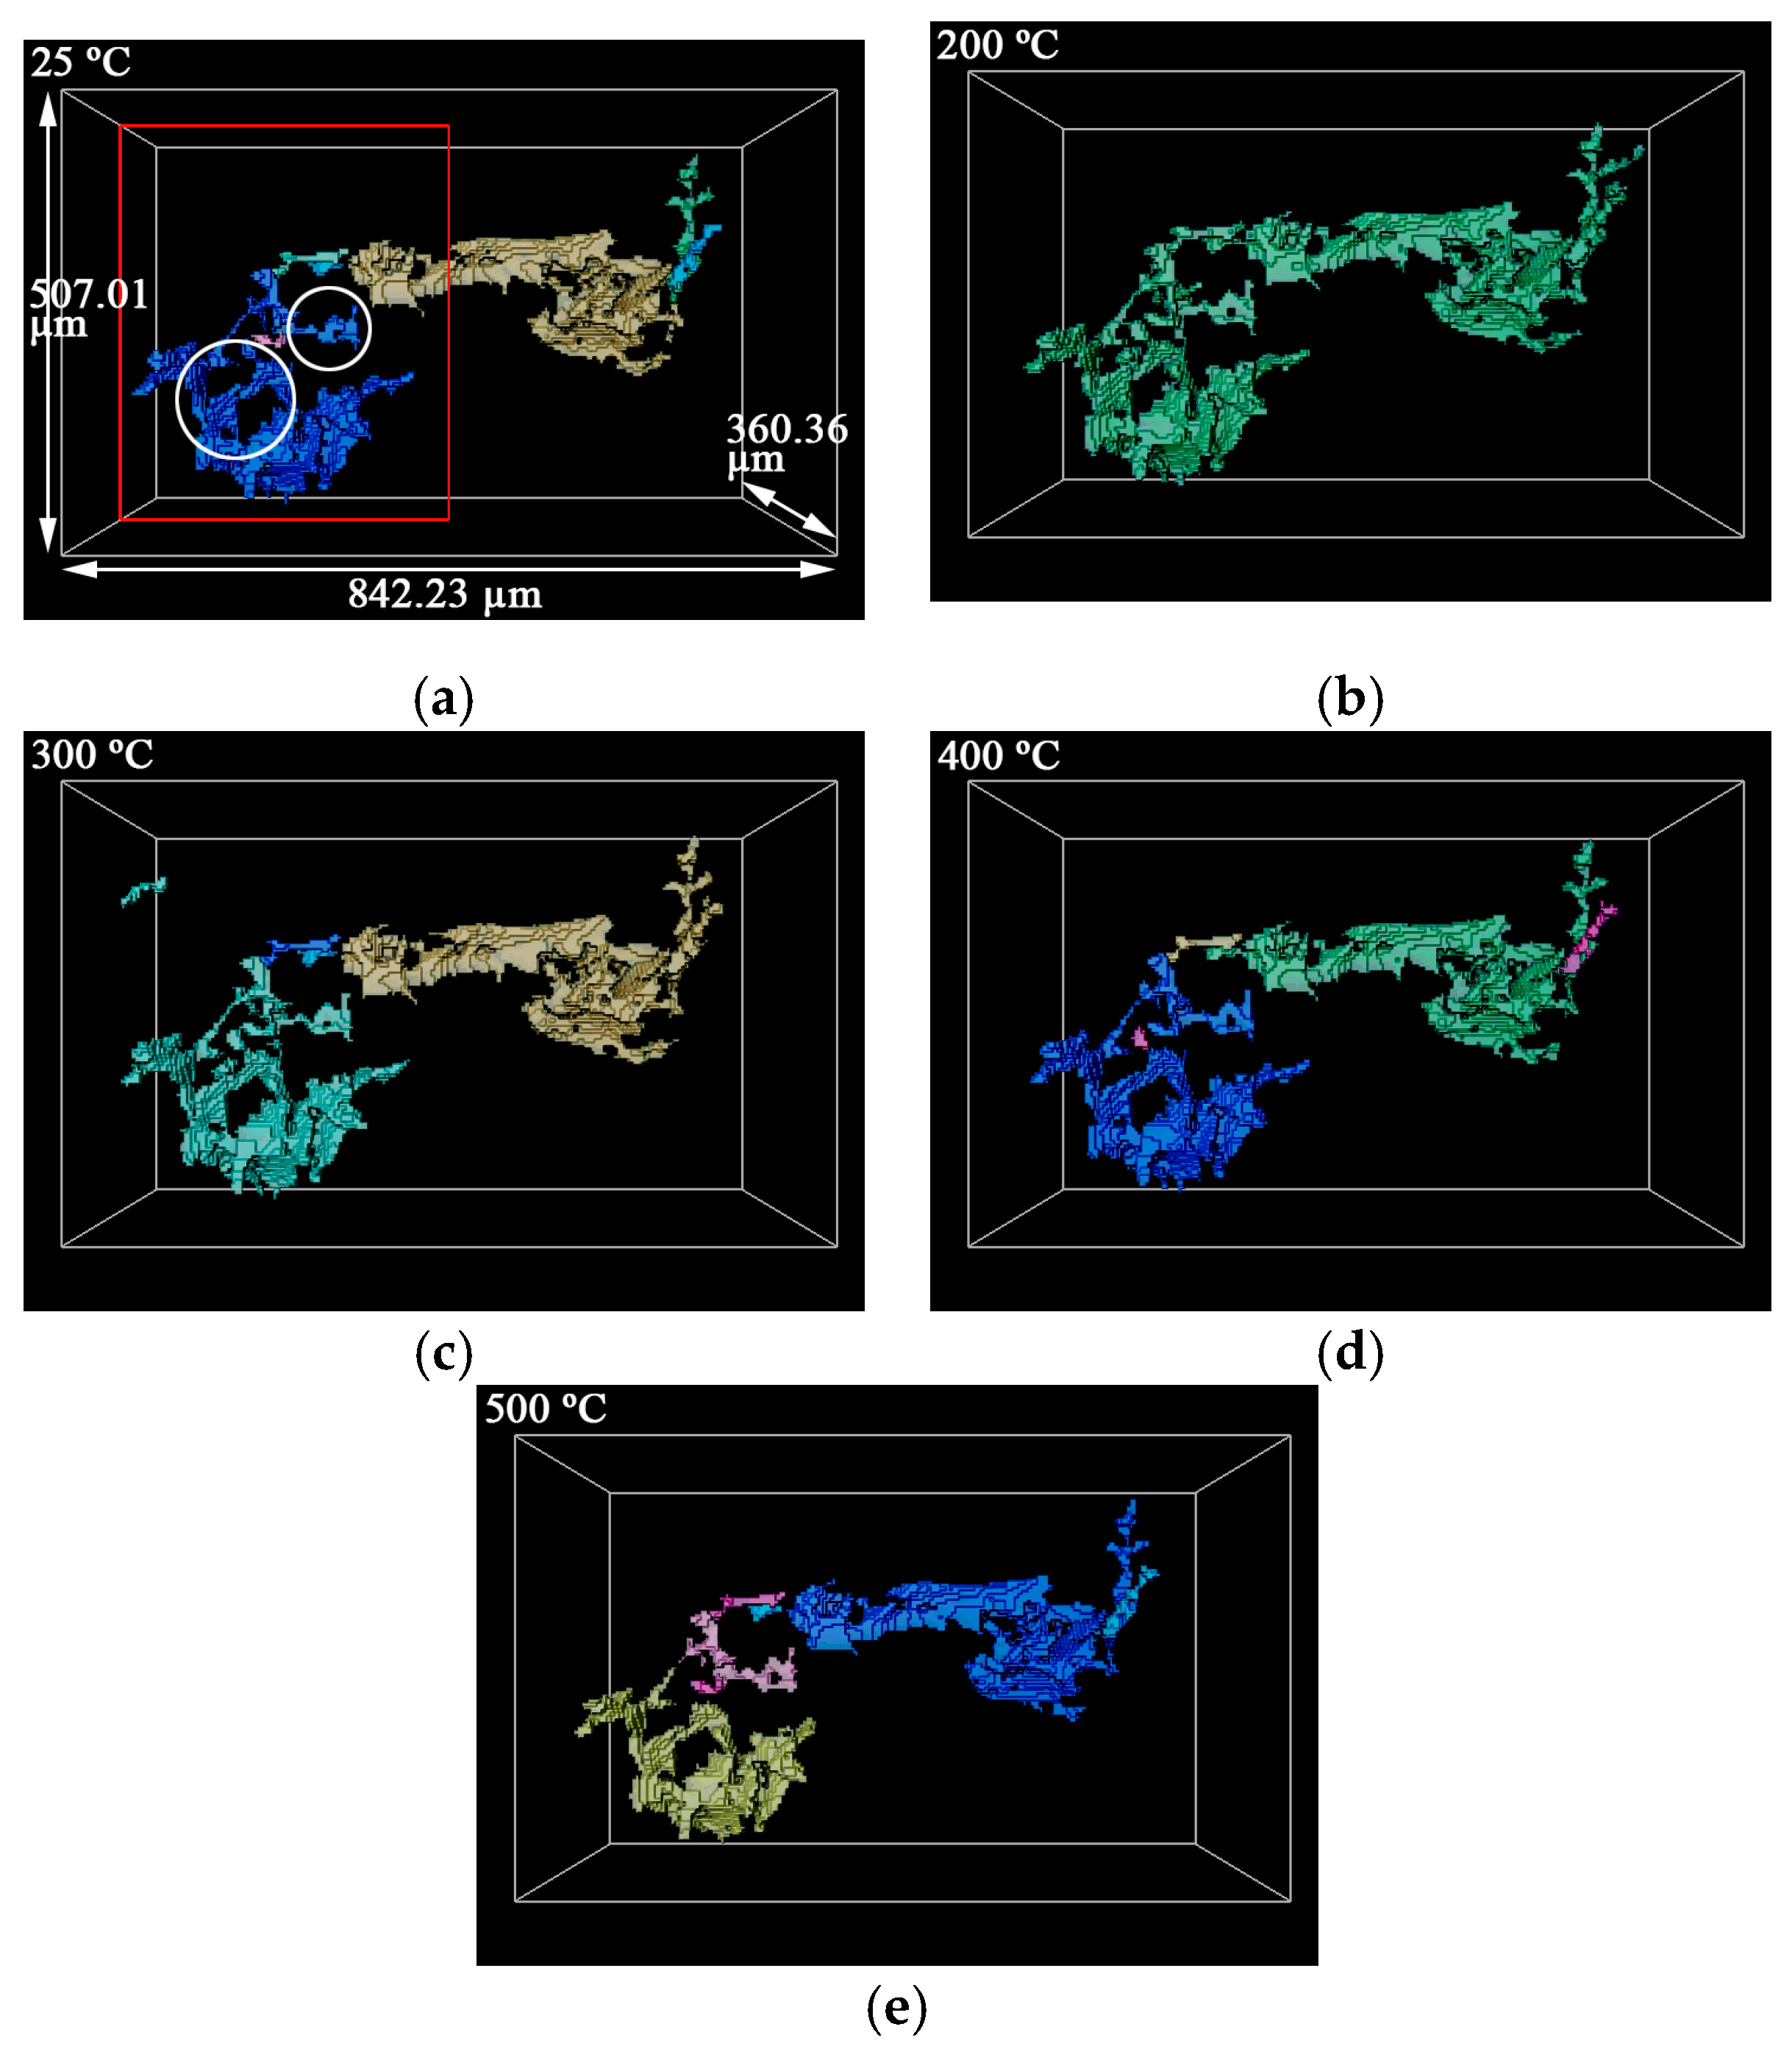
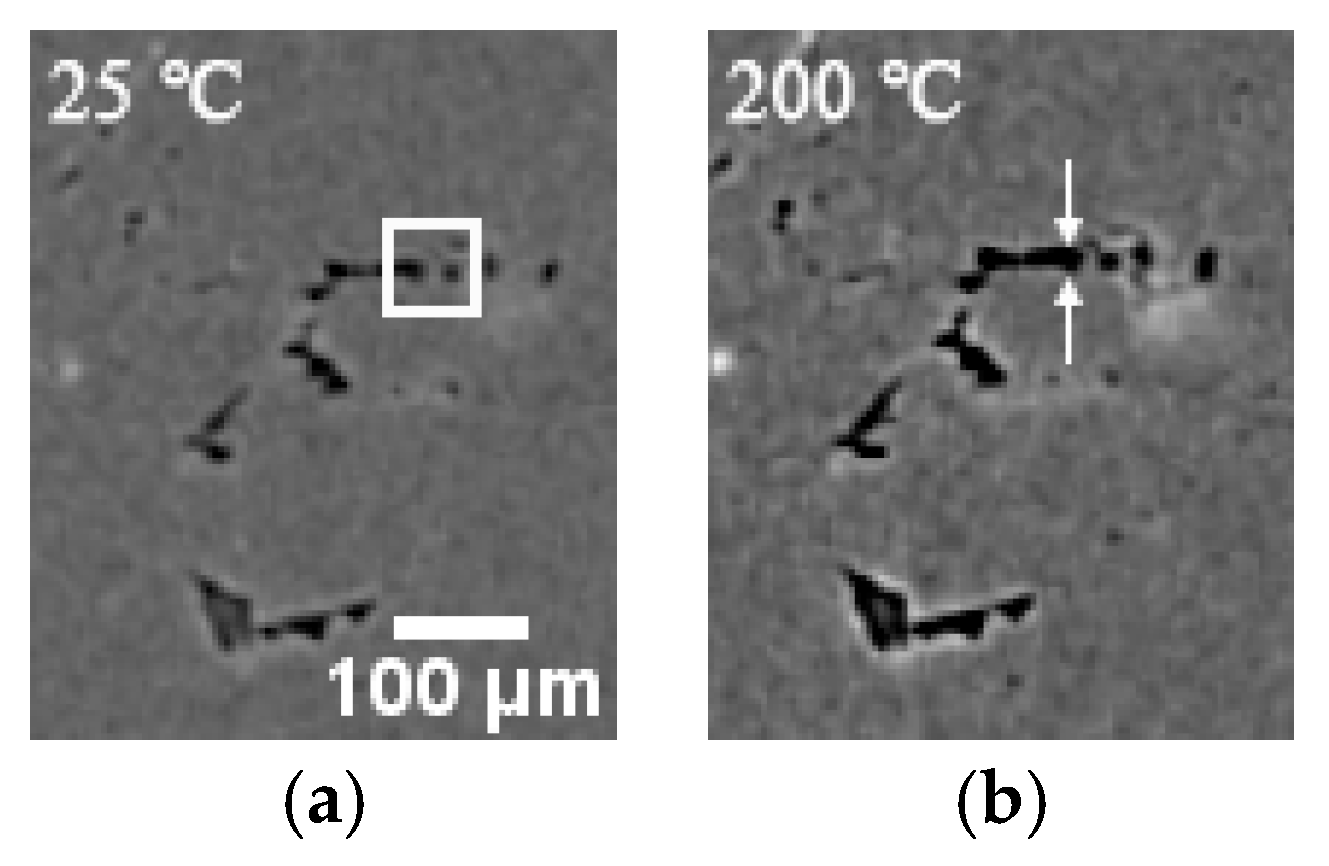
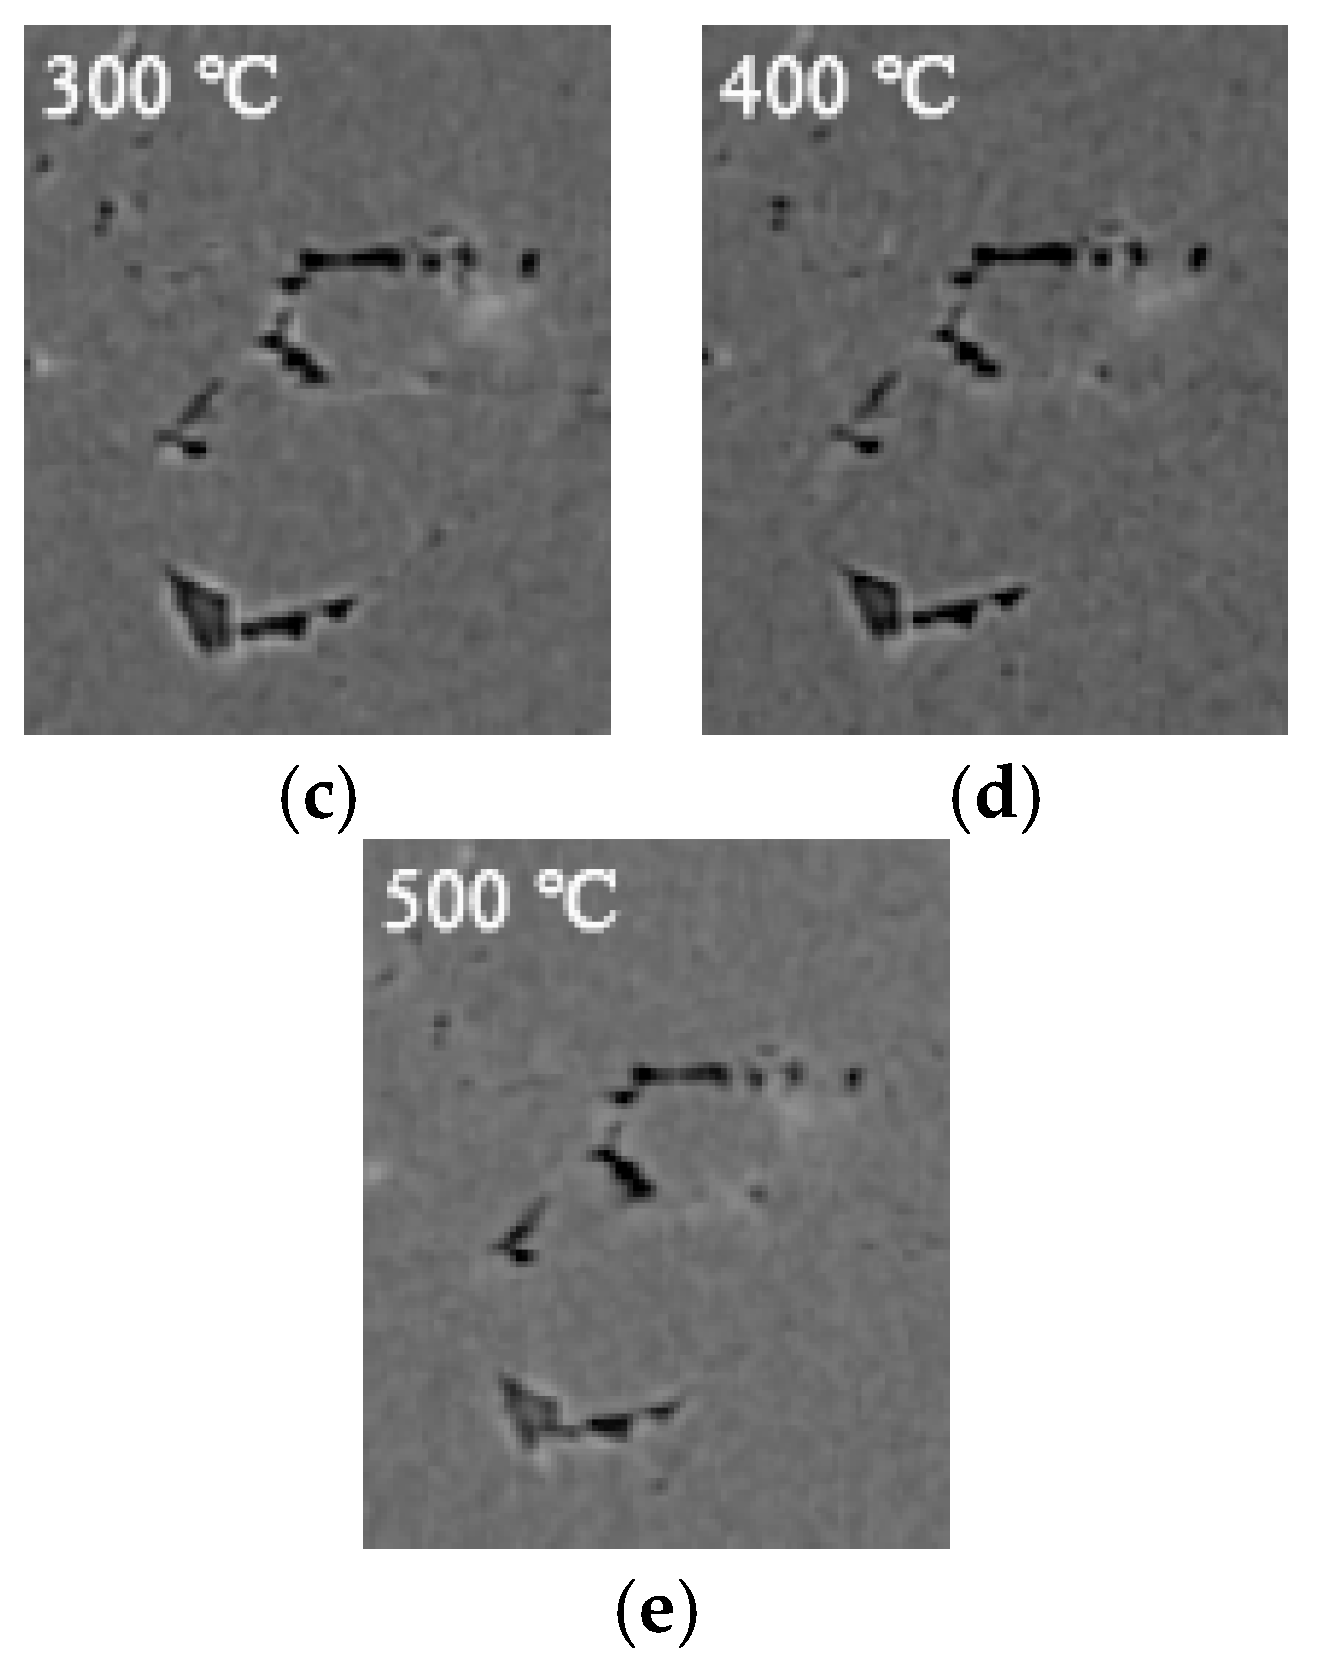
3.2. 3D Structure of Pores during Evolution

The amount and volume of Type I pores change with an increasing temperature, as shown in Figure 5a–e. The pores in the areas marked by white circles show the most significant change at different temperatures. Some new pores appear, and the existing pores have larger diameters at 200 °C. After 200 °C, the pores are smaller than at 200 °C, and some pores gradually disappear. However, the location of the pores does not change at different temperatures. According to the analysis, some round-shaped pores with an Equivalent Diameter under 9 μm appear at 200 °C and gradually disappear after 200 °C. This is the main reason for the largest number of Type I pores being at 200 °C. Some large Type I pores with an Equivalent Diameter of about 13–16 μm generate branches to be Type III pores with a length of about 38–44 μm at 200 °C. Additionally, some adjacent Type I pores connect into Type III pores at 200 °C.
Figure 6a–e shows the CT images at different temperatures corresponding to the cross-section marked by the red square shown in Figure 5a. Comparing CT images at different temperatures, the sizes of pores in white squares are the largest at 200 °C and decrease after 200 °C. The pore marked by a white circle is not clear after 200 °C and disappears at 500 °C. This is the same as the result concluded in Figure 5a–e, according to which the sizes of pores are the largest and the maximum number of pores is at 200 °C.
The size of a Type II pore changes with an increasing temperature in Figure 7a–e. The most obvious size change is marked by a red circle. This indicates that the pore grows from 25 °C to 200 °C and shrinks after 200 °C. As shown in Figure 8, the volume, length and diameter of pore increase from 25 °C to 200 °C and decrease after 200 °C. The deviation of the pore volume, length and diameter is obtained based on the calculation results of the Otsu and IsoData segmentation algorithms. On the contrary, the aspect ratio of the pore is smallest at 200 °C and gradually increases after 200 °C. The aspect ratio of the pore is about 4.76 at 25 °C, 3.80 at 200 °C, 3.82 at 300 °C, 3.96 at 400 °C and 4.78 at 500 °C. The pore is in the same place at different temperatures.
Figure 9a–e shows some examples of the shape and size change of pores with an increasing temperature, such as a Type II pore and some Type III pores. Seven pores at 25 °C, close to each other, connect into one pore at 200 °C and then separate into several pores after 200 °C. According to the region marked by white circles, the sizes of pores are the largest at 200 °C and become smaller after 200 °C. The adjacent pores are shown in different colors. The total volume of these pores is 1.20 × 106 μm3 at 25 °C, 1.59 × 106 μm3 at 200 °C, 1.40 × 106 μm3 at 300 °C, 1.25 × 106 μm3 at 400 °C and 1.12 × 106 μm3 at 500 °C. The positions of these pores are the same under different temperatures.
The CT images in Figure 10a–e correspond to the cross-section that is marked by a red square in Figure 9a. They can more intuitively analyze whether the two pores that are the yellow pore and the green pore, which is long strip pore in Figure 9a, connect. Based on the region marked by a white square at 25 °C, the two pores connect into one at 200 °C and disconnect at 300–500 °C. At 200 °C, the sizes of the pores are slightly larger than the same pores at elevated temperatures. Furthermore, there are some small pores that disappear in the CT images at elevated temperatures. The size marked by arrows is about 17 μm at 25 °C, 300 °C and 400 °C, 21 μm at 200 °C and 13 μm at 500 °C. Based on Figure 9a–e and Figure 10a–e, with the increase of volume at 200 °C, some near-branched pores connect into large pores that are mainly Type III pores. Additionally, the pore separates into two or more pores with an increasing temperature because the weak connection is broken with the decrease of volume. The connection or disconnection of adjacent pores is one of the reasons for the amount change of Type III pores with an increasing temperature.
In sum, at 200 °C the statistics of pores indicate that the amount and total volume of Type I and III pores and the porosity are the largest; and the sizes of pores are the largest on the basis of the 3D structure of pores during evolution. Therefore, the change of pores is the most significant at 200 °C. According to reference [6], the first significant rate of hydrogen loss of LiH was at 100 °C. Additionally, the decomposition of LiH to release hydrogen required a high temperature above 900 °C [35]. Thus, it may be the release of residual hydrogen that induces the hydrogen loss of LiH when the temperature is under 200 °C. The release of residual hydrogen inducing the expansion of pores may be the reason for the size increase of the three kinds of pores at 200 °C. Some Type I pores with sizes under 4.1902 μm expand until they are detected. The expansion of some Type I and II pores causes them to branch out, which leads them to directly form or connect into Type III pores. Some Type III pores expand and then connect. After 300 °C, the grains gradually grow [7,8]. The increase of temperature is conductive to the migration and diffusion of substances and the migration of the grain boundary in LiH. During this process, some hydrogen in pores may be released after its migration and diffusion. Furthermore, there is no more residual hydrogen releasing, so the sizes of the three kinds of pores decrease in the range of 300–500 °C. Some Type I pores with an Equivalent Diameter under 9 μm disappear, and some Type III pores disconnect into several small pores. This shows that the expansion and contraction of pores are the cause of the size changes of the three kinds of pores with an increasing temperature, resulting in the appearance and disappearance of some Type I pores with an Equivalent Diameter under 9 μm, the connection of some adjacent pores and the disconnection of some Type III pores, which in turn lead to the amount and total volume change of pores with an increasing temperature, as shown in Figure 4a,b. In summary, the expansion and contraction of pores are the main reasons leading to the porosity evolution of LiH with an increasing temperature.

4. Conclusions

The temperature effect on the pores of sintered LiH ceramic was investigated by XCT in the range of 25–500 °C. The in situ evolution of pores in sintered LiH ceramic at elevated temperatures was analyzed in detail, such as the statistics of pores and the 3D structure of pores.
(1)
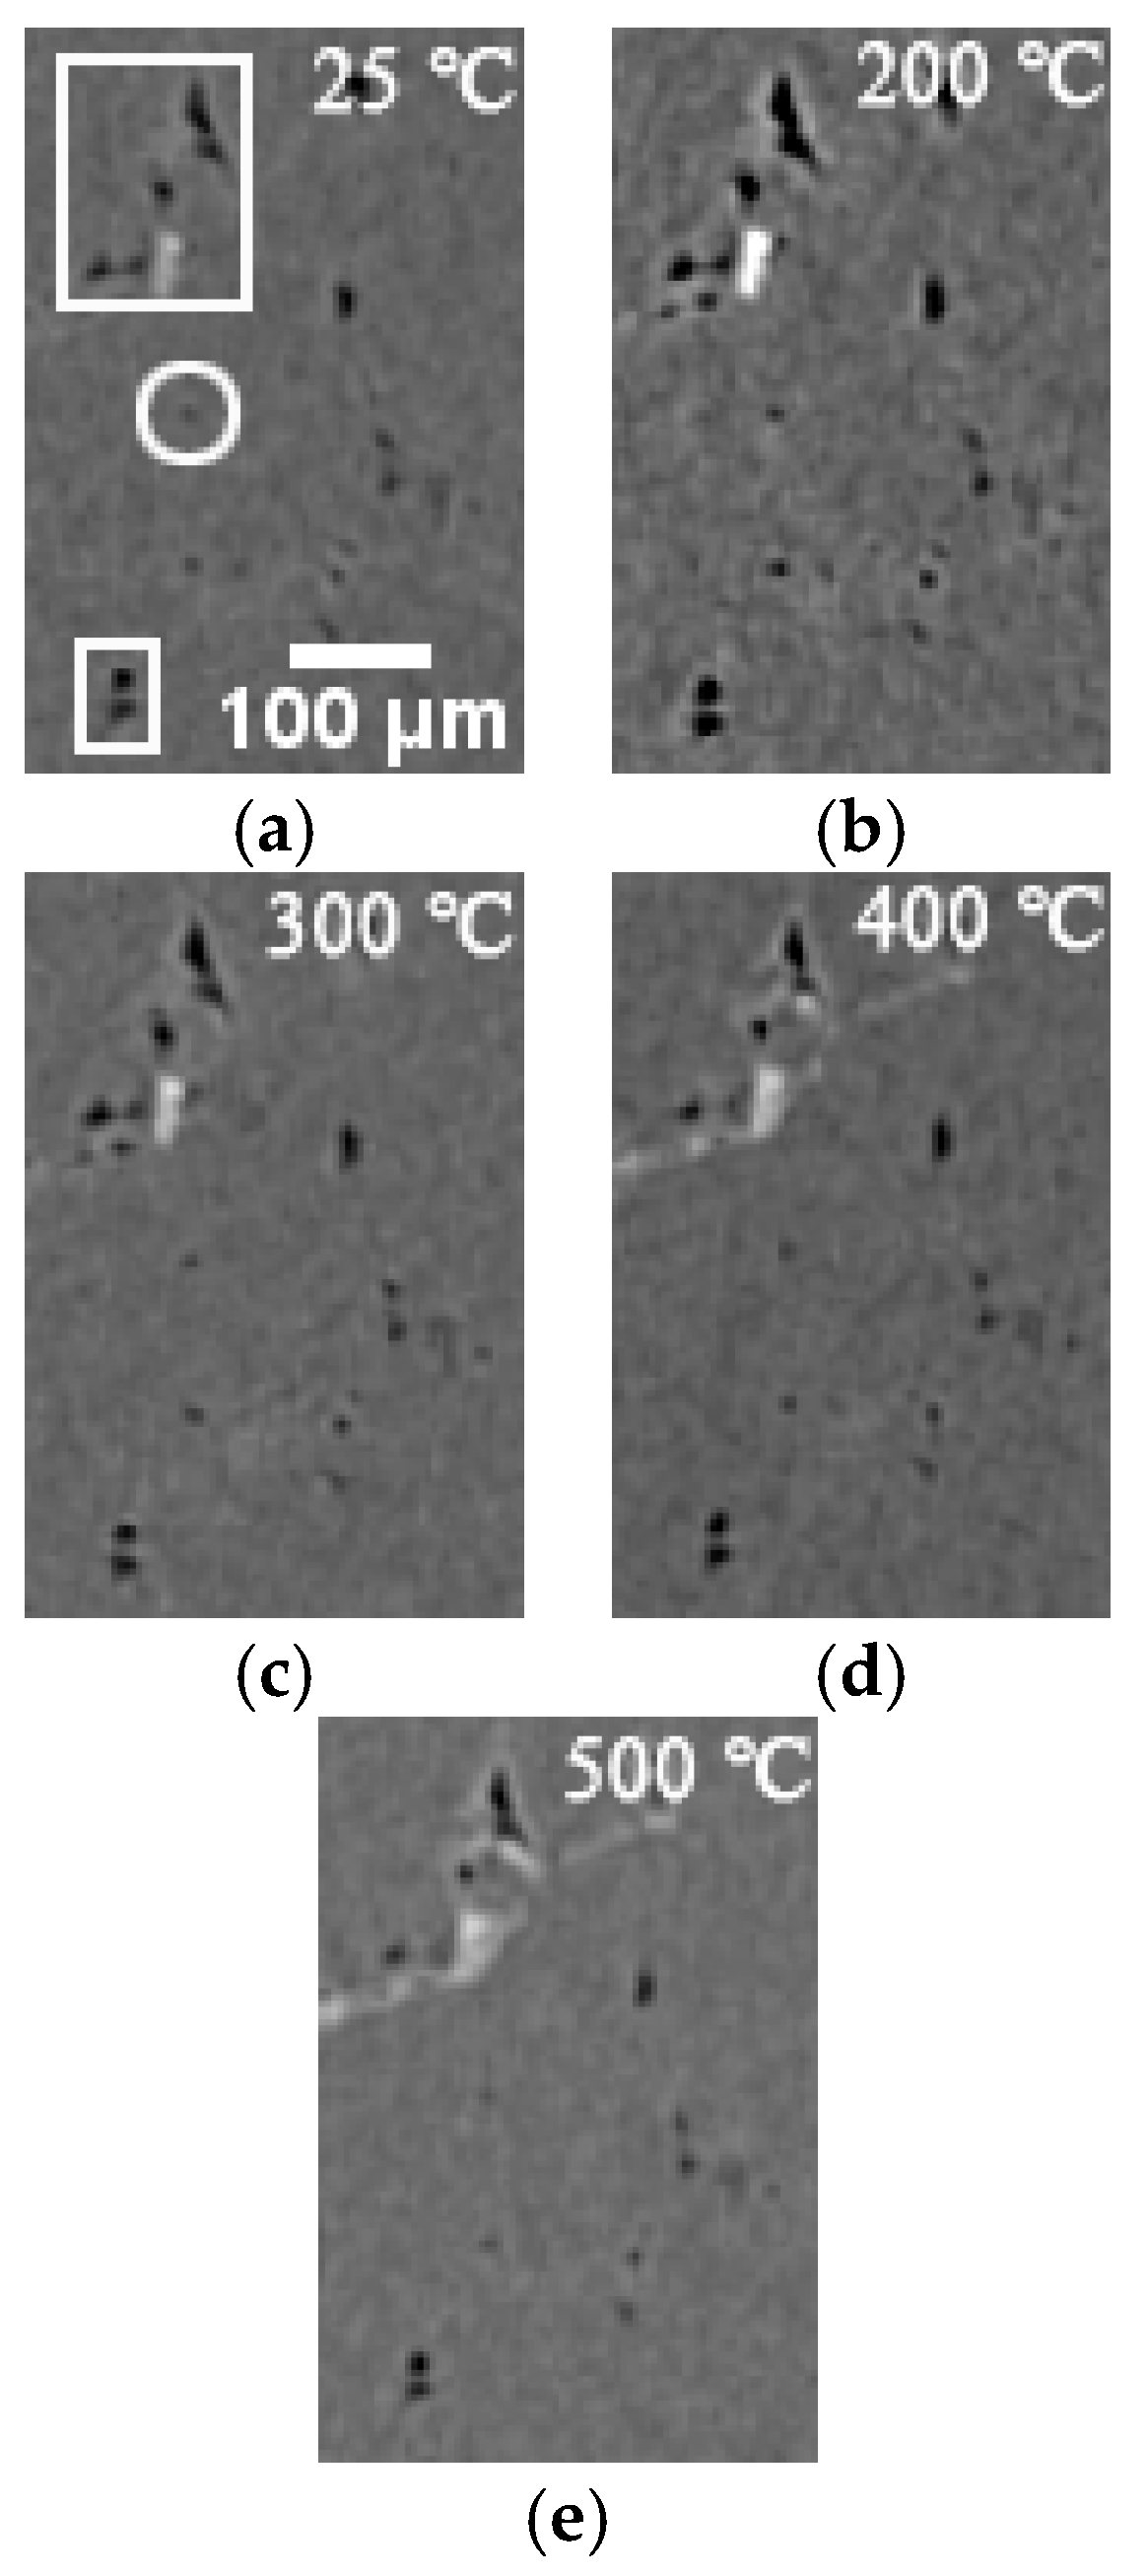
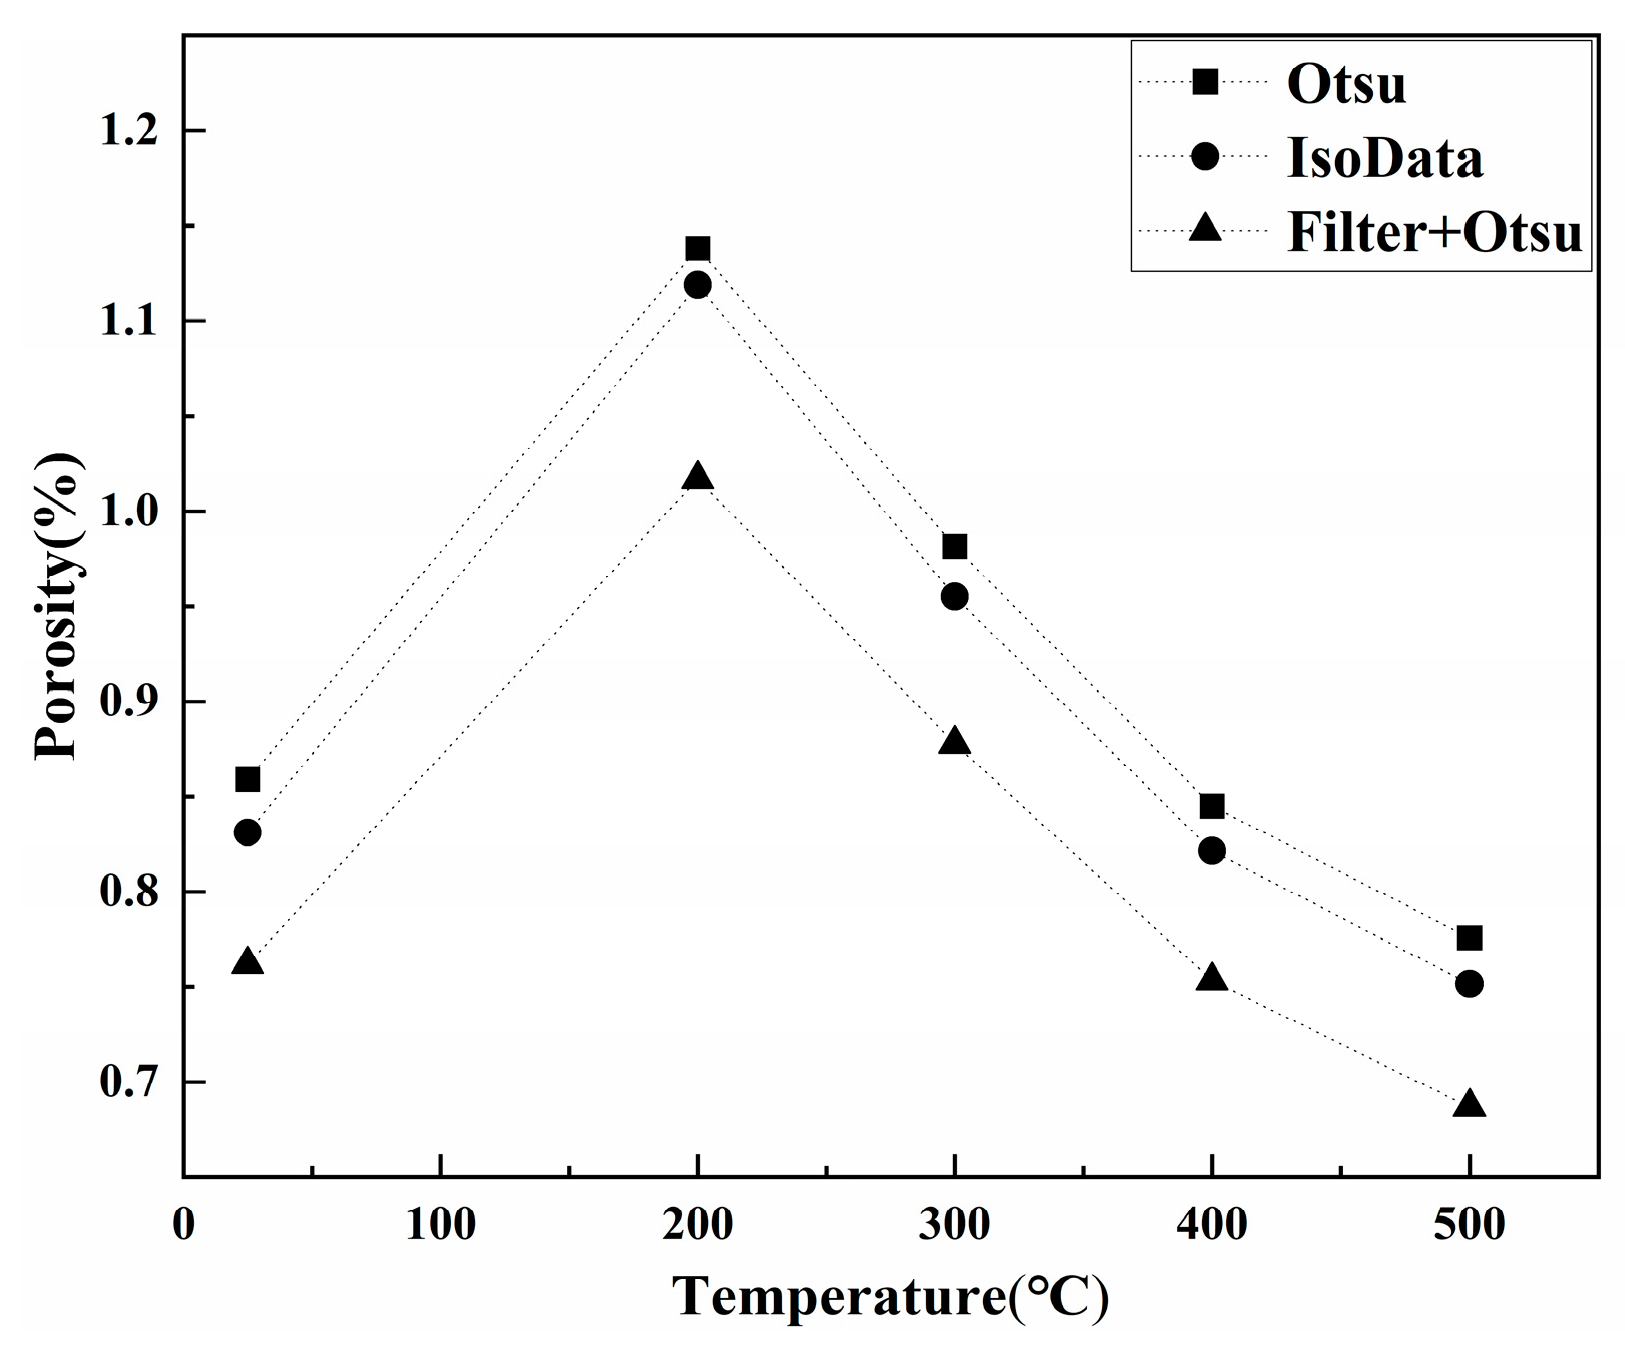
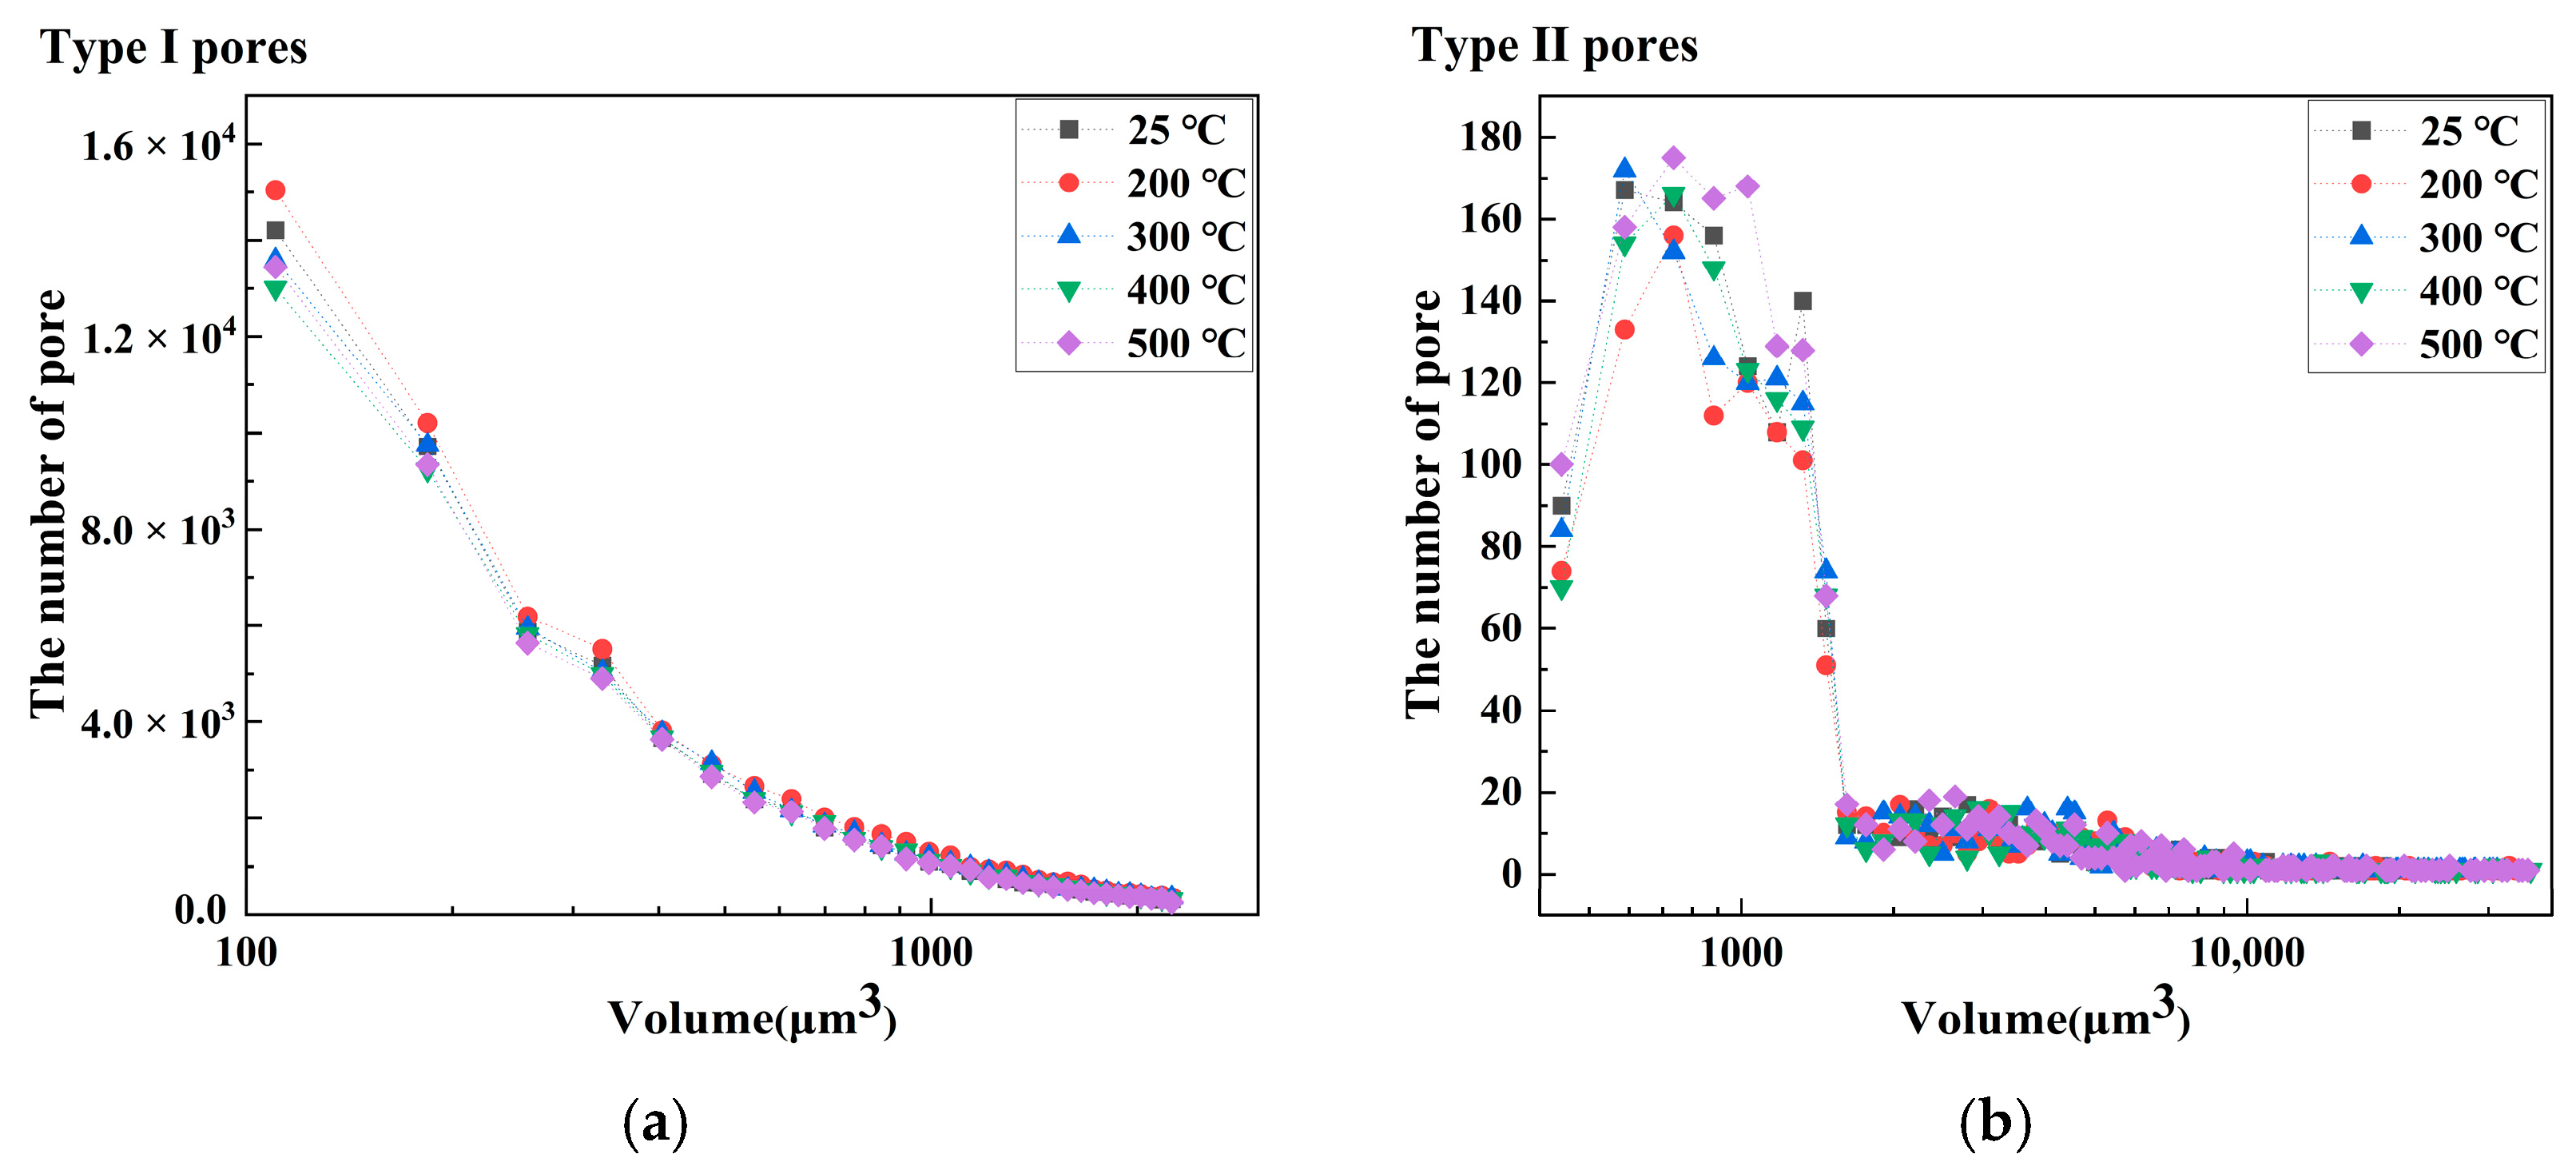
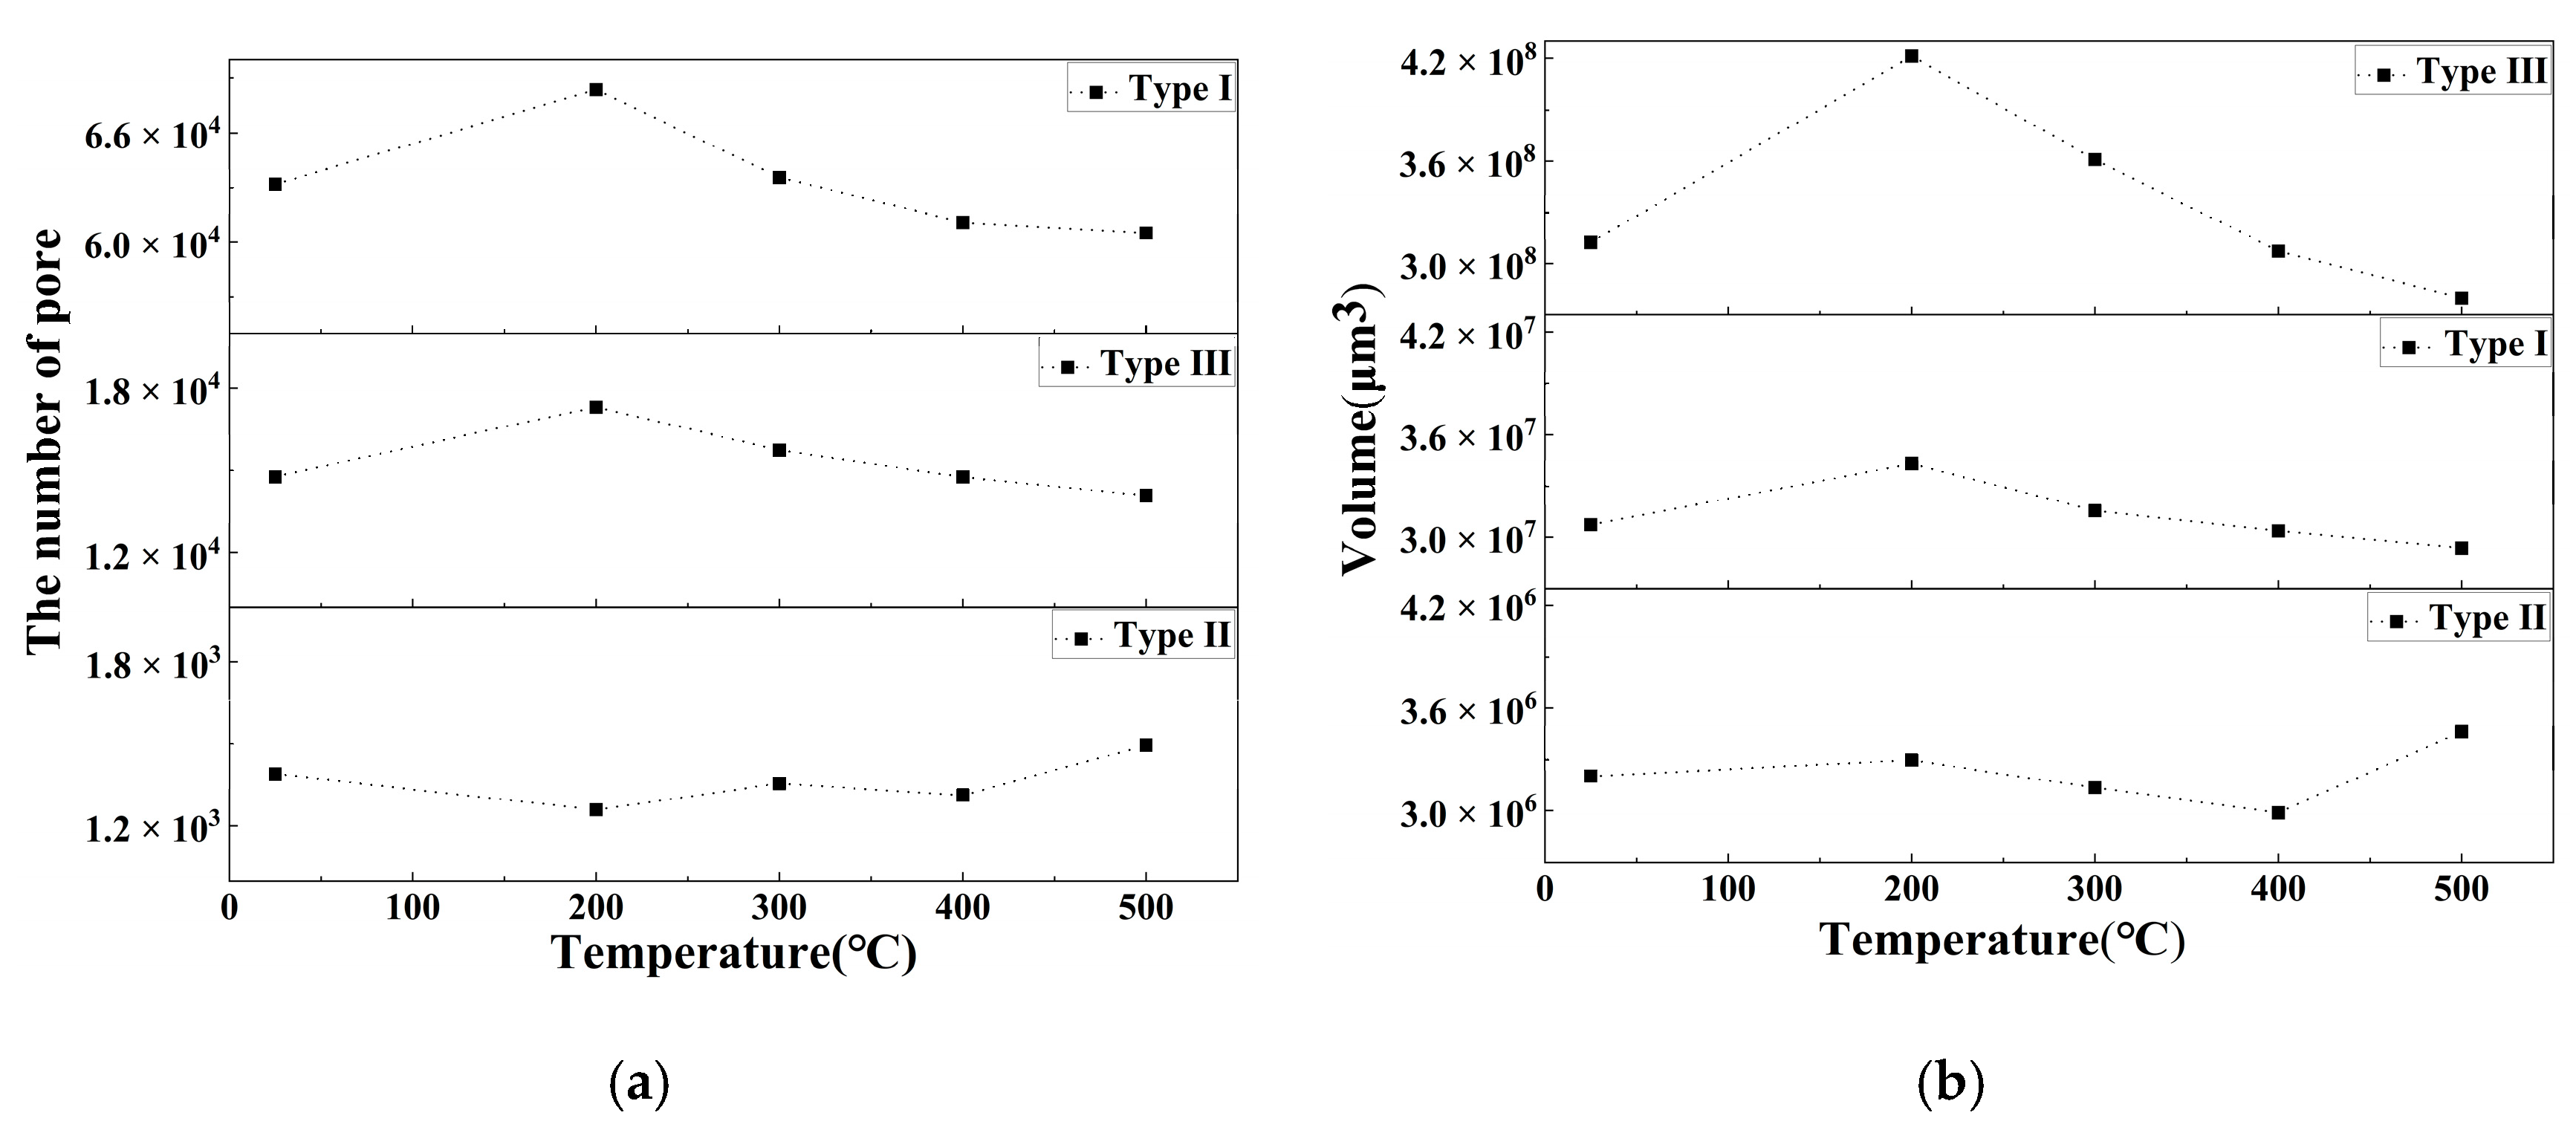
The porosity of LiH significantly increased from 25 °C to 200 °C and decreased after 200 °C because of the significant change in the number and total volume of Type I and III pores with an increasing temperature. The amount and total volume of Type II pores slightly changed with the temperature.
(2)
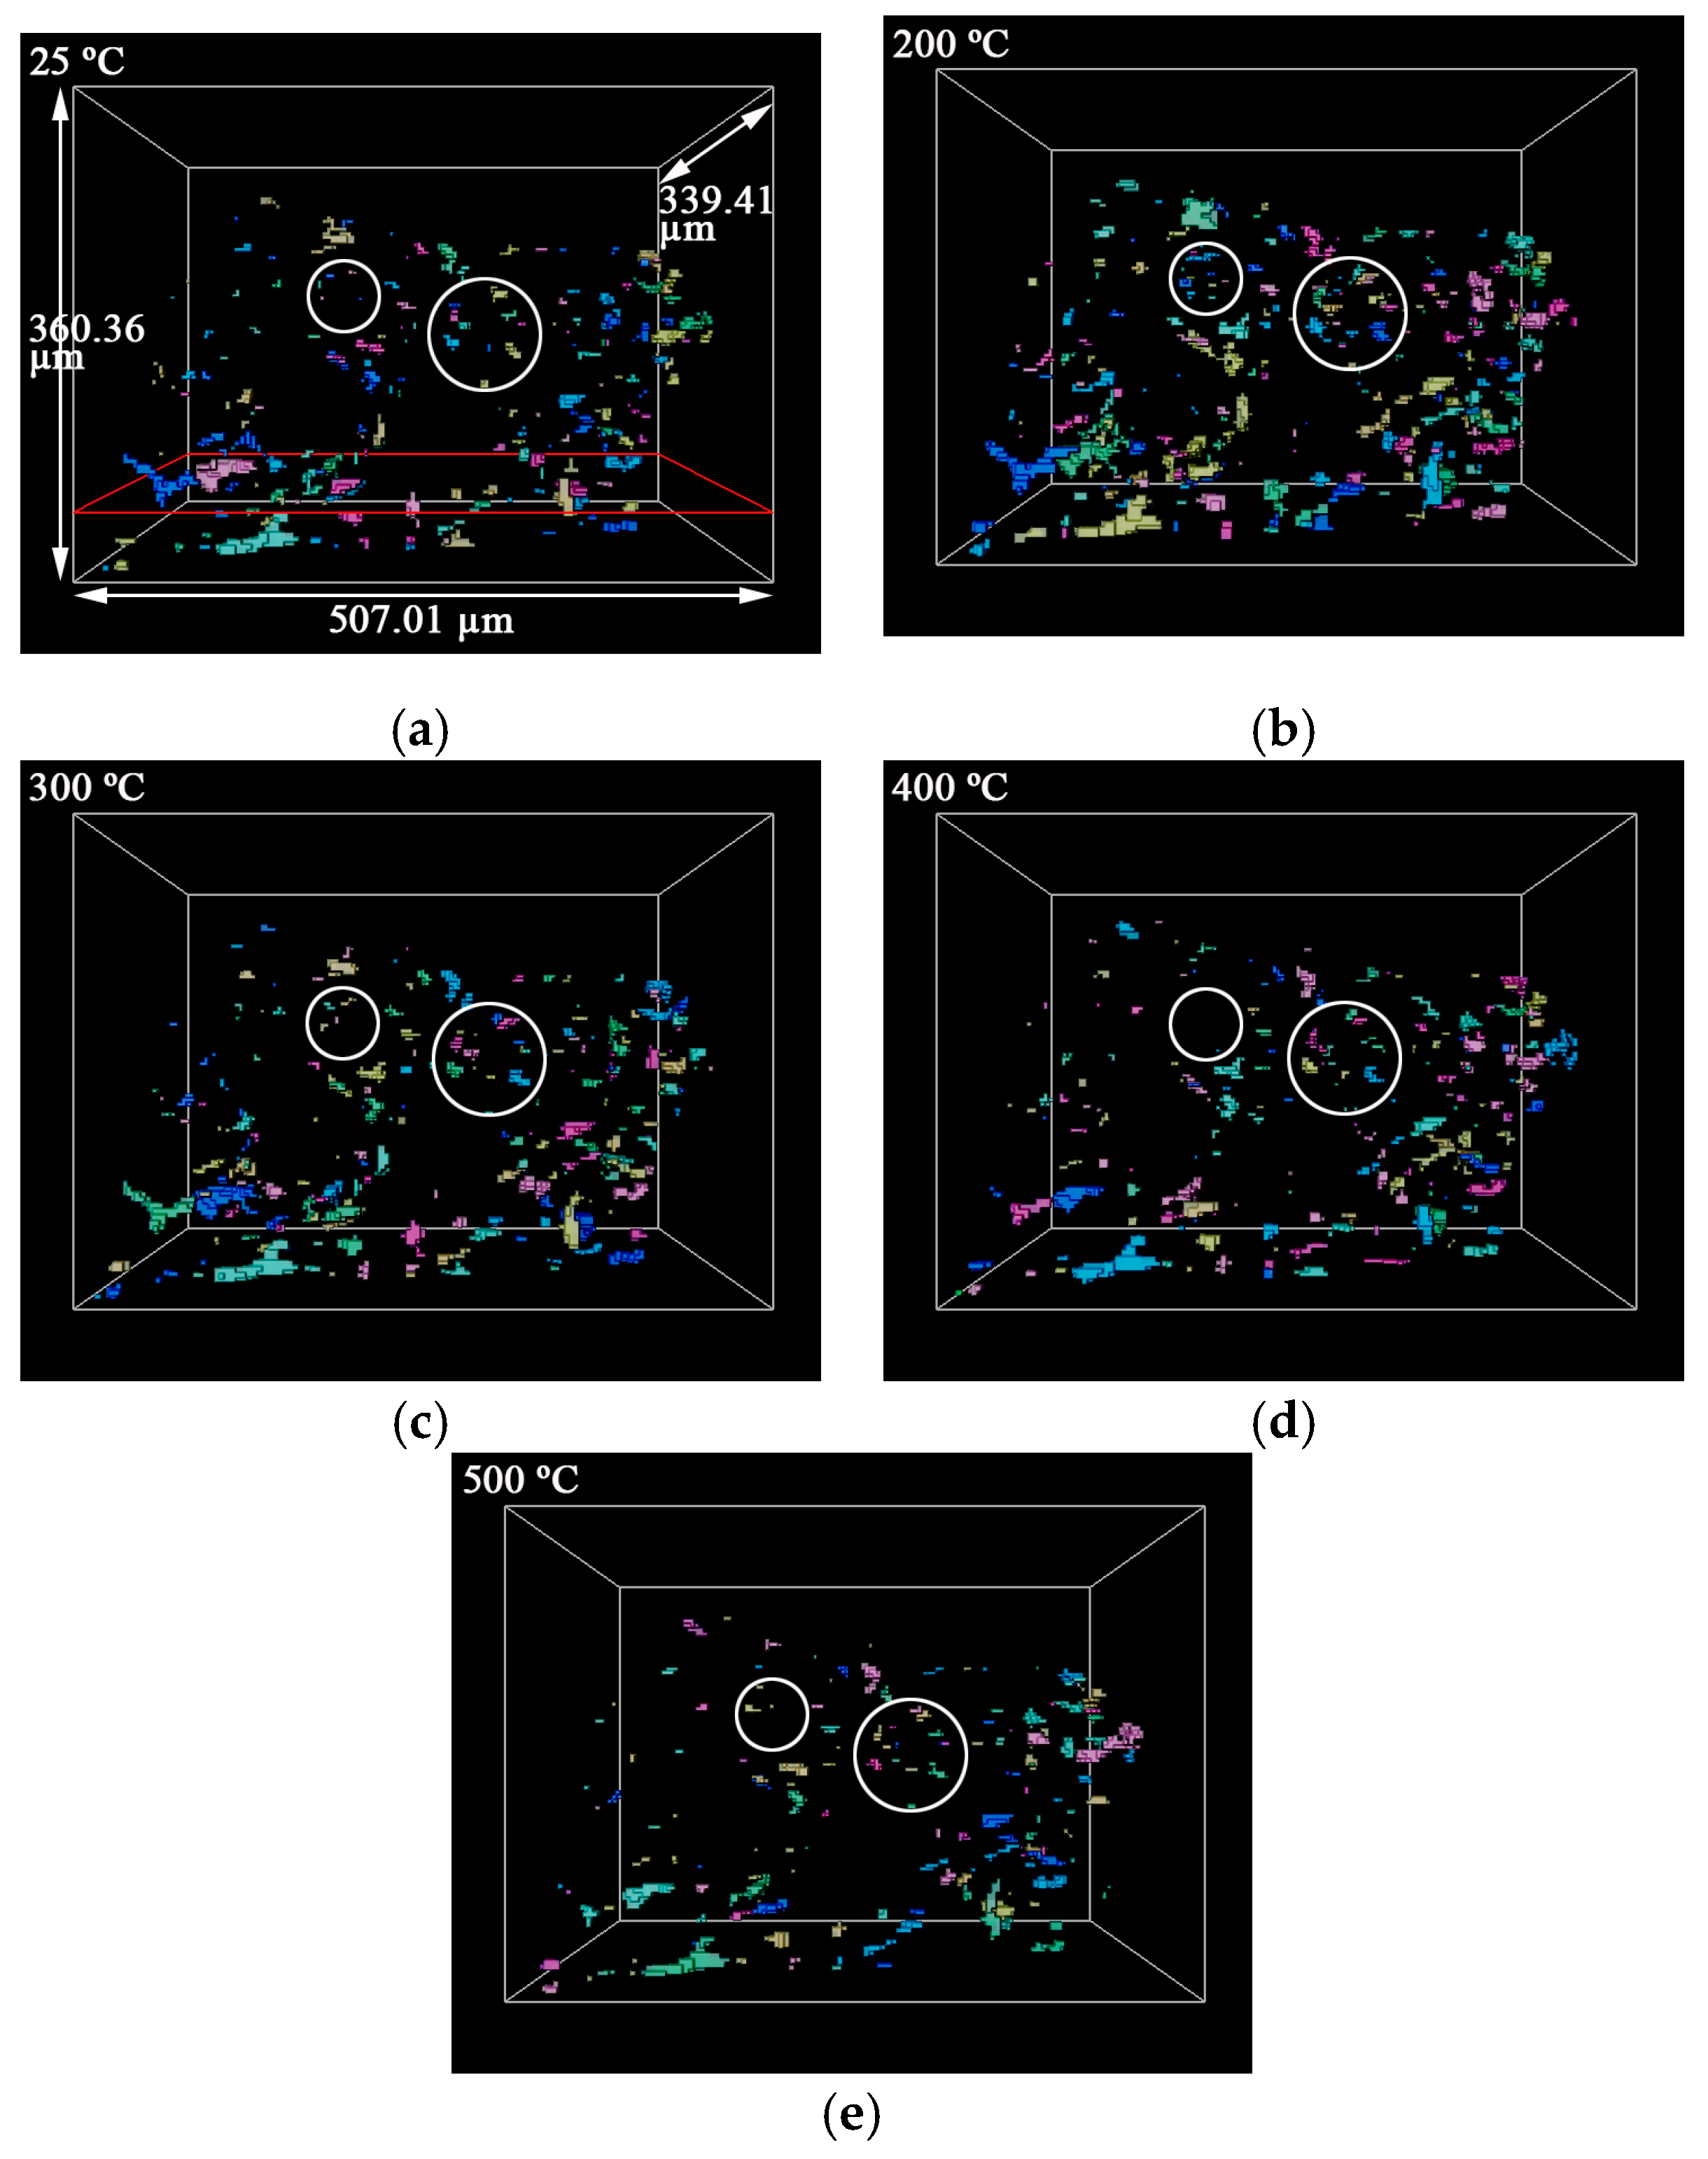
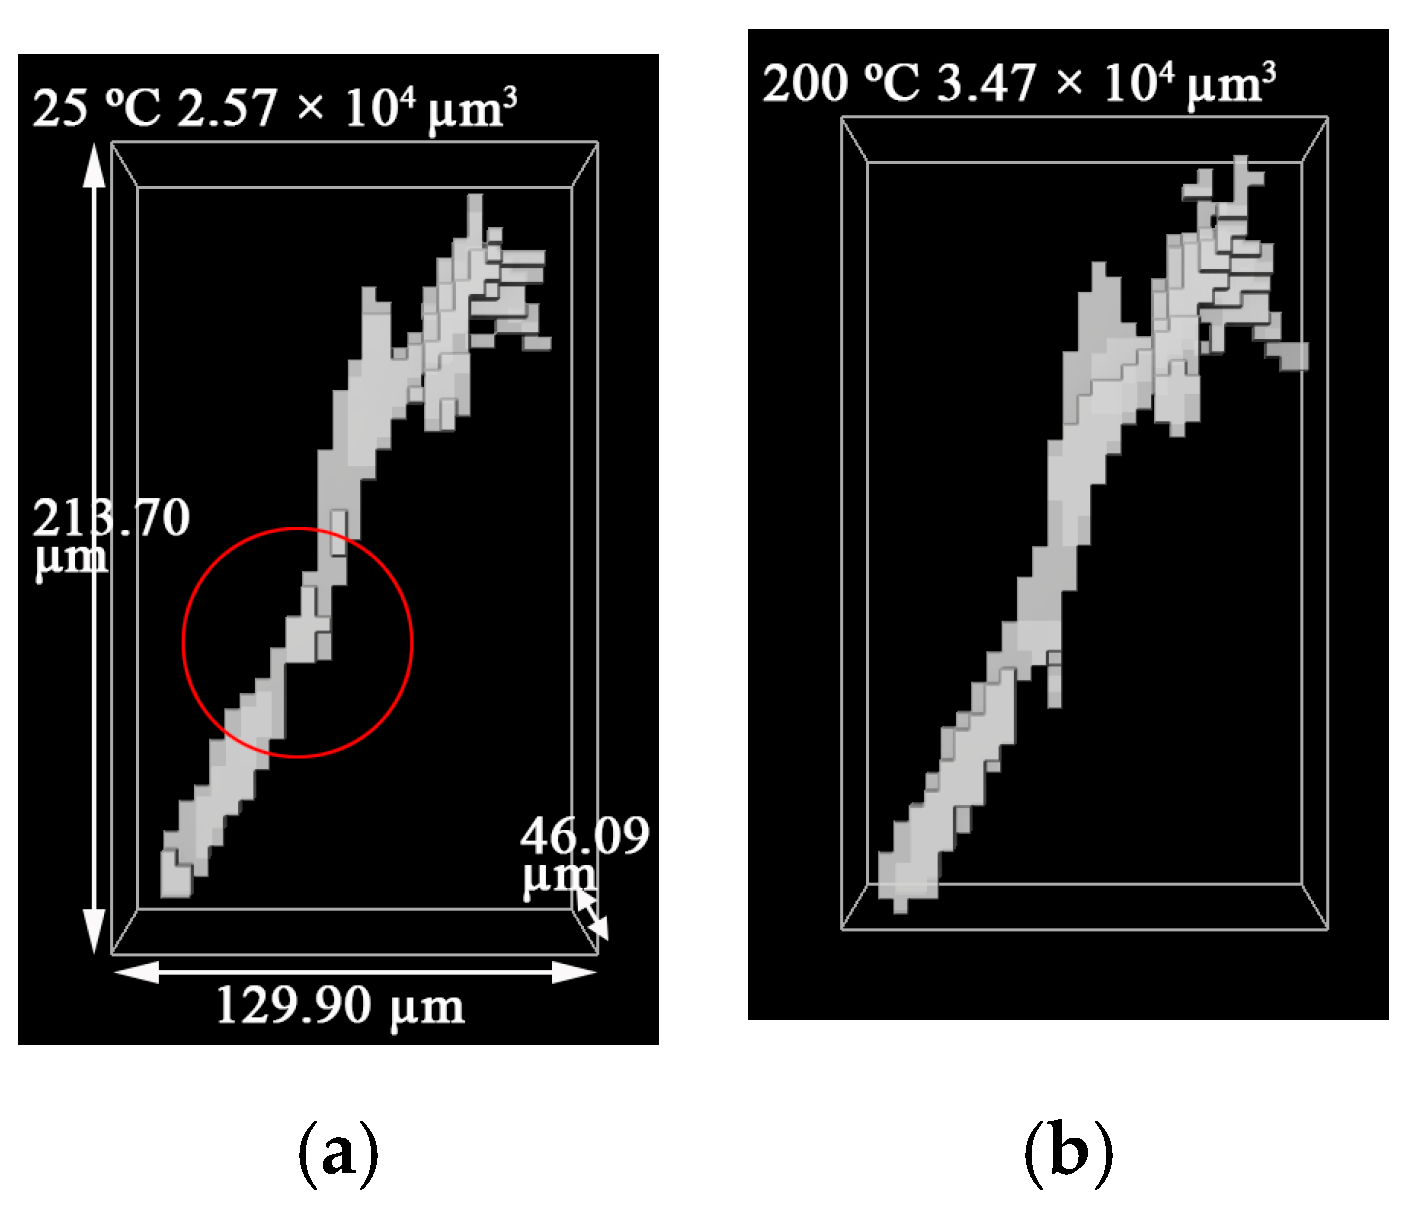
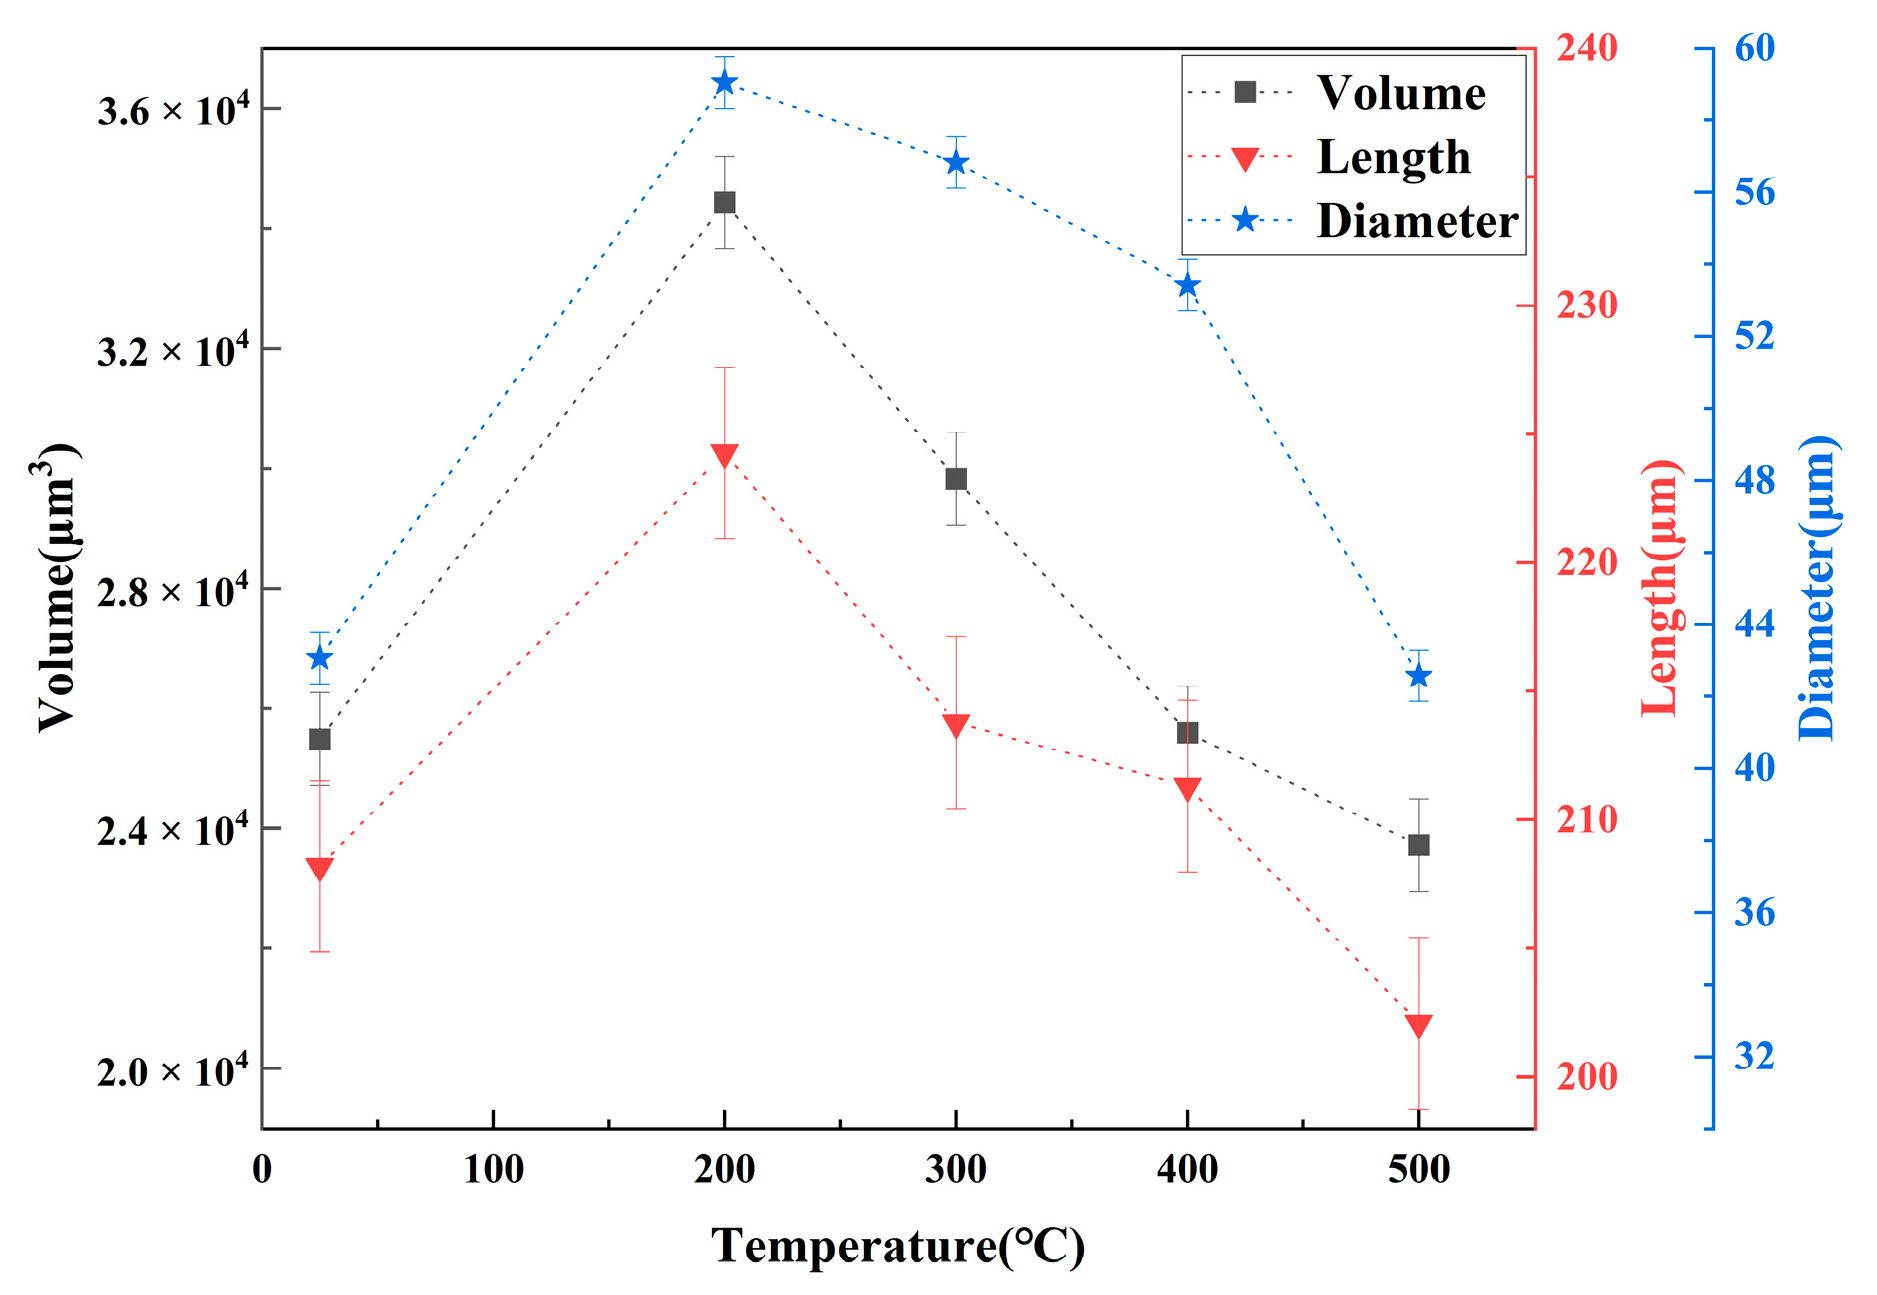
The positions of pores in LiH did not change. The sizes of pores rose in the range of 25–200 °C and fell from 200 °C to 500 °C. Some small round-shaped (Type I) pores with an Equivalent Diameter under 9 μm appeared at 200 °C and disappeared at elevated temperatures. Some adjacent pores of all types connected at 200 °C, and some branched crack-like (Type III) pores gradually disconnected with an increasing temperature.
(3)
The reason for the most significant change of pores at 200 °C might be the expansion of pores caused by the release of residual hydrogen. After 200 °C, the migration and diffusion of some hydrogen in pores, resulting in the contraction of pores, might be the reason for the change in the porosity, amount of pores, total volume of pores and pore size with an increasing temperature.

Author Contributions

Conceptualization, methodology, investigation, data curation, visualization, writing—original draft, Y.S.; funding acquisition, project administration, conceptualization, methodology, supervision, writing—review and editing, L.P.; conceptualization, writing—review and editing, W.Z.; resources, writing—review and editing, Q.L. (Qiang Li), Q.L. (Qishou Li) and L.Y. All authors have read and agreed to the published version of the manuscript.

Funding

This work was supported by the China National Natural Science Foundation—NSAF with Grant No. U1730123 and National Natural Science Foundation of China with Grant No. 11805131.

Data Availability Statement

The datasets that support the results of this study are available from the corresponding author upon reasonable request.

Acknowledgments

The Zeiss Xradia 520 Versa Computed Tomography system was provided by the USTC Center for Micro- and Nanoscale Research and Fabrication.

Conflicts of Interest

The authors declare no conflict of interest.

References

  1. Golubev, V.K.; Rabinovich, K.G.; Polyakov, L.V. The effect of pressing conditions on the strength oflithium hydride upon compre. J. Appl. Mech. Tech. Phys. 1997, 38, 961–962. [Google Scholar] [CrossRef]
  2. Rabinovich, K.G.; Golubev, V.K. Strength and Fracture of Lithium Hydride Crystals underUniaxial Compression. Strength Mater. 1999, 31, 476–478. [Google Scholar] [CrossRef]
  3. Golubev, V.K.; Rabinovich, K.G. Influence of the initial state on the strength of pressed lithium hydride. Strength Mater. 1999, 31, 625–628. [Google Scholar] [CrossRef]
  4. Wang, W.; Li, Q.; Li, Q.; Yang, X.; Le, G. A review of irradiation stability of Lithium hydride neutron shielding material. Mater. Sci. Technol. 2016, 32, 434–437. [Google Scholar] [CrossRef]
  5. Johnson, G.A. Shield design for lunar surface applications. In Proceedings of the AIP Conference Proceedings; pp. 701–706. Available online: https://aip.scitation.org/doi/abs/10.1063/1.2169251 (accessed on 31 August 2021). [CrossRef]
  6. Messer, C.E. A Survey Report on Lithium Hydride, Medium ed.; United States Atomic Energy Commission, Technical Information Service: Washington, DC, USA, 1960; p. 64. [Google Scholar]
  7. Qiu, Z.C.; Huang, H.; Shuai, M.B. Mechanical properties of lithium hydride under different environmental conditions. Ordnance Mater. Sci. Eng. 2006, 29, 43–46. [Google Scholar] [CrossRef]
  8. Qiu, Z.C.; Liu, K.Z.; Wang, X.S. Tensile properties of lithium hydride at high temperature. Rare Met. Mater. Eng. 2006, 35, 1560–1563. [Google Scholar]
  9. Gogotsi, G.A.; Negovskii, A.N. Use of nondestructive testing methods in evaluation of thermal damage for ceramics under conditions of nonstationary thermal effects. Strength Mater. 1985, 17, 52–56. [Google Scholar] [CrossRef]
  10. Gogotsi, G.A.; Negovskii, A.N.; Zubov, V.I.; Dezhkunov, N.V. Controlling surface defects in assessing thermal damage to porous ceramics using the luminescent capillary method. Refractories 1984, 25, 274–277. [Google Scholar] [CrossRef]
  11. Gogotsi, G.A.; Negovskii, A.N.; Zubov, V.I.; Vityuk, P.S.; Glukhovskii, V.P.; Rapoport, Y.M. Using the ultrasonic spectral method for assessing thermal damage to refractory ceramics. Refractories 1984, 25, 219–222. [Google Scholar] [CrossRef]
  12. Konsztowicz, K.J. Crack Growth and Acoustic Emission in Ceramics During Thermal Shock. J. Am. Ceram. Soc. 1990, 73, 502–508. [Google Scholar] [CrossRef]
  13. Sitnikov, A.I.; Tel’Nova, G.B.; Shvorneva, L.I.; Fedotov, A.Y.; Solntsev, K.A. Study of the thermomechanical properties of a ceramic based on sodium polyaluminate with the structure of Na-β-alumina. Refract. Ind. Ceram. 2013, 53, 304–309. [Google Scholar] [CrossRef]
  14. Singh, D.; Singh, J.P.; Wheeler, M.J. Mechanical behavior of SiC(f)/SiC composites and correlation to in situ fiber strength at room and elevated temperatures. J. Am. Ceram. Soc. 1996, 79, 591–596. [Google Scholar] [CrossRef]
  15. Cao, X.; Wang, B.; Ma, X.; Feng, L.; Shen, X.; Wang, C. Oxidation behavior of melt-infiltrated SiC–TiB2 ceramic composites at 500–1300 °C in air. Ceram. Int. 2021, 47, 9881–9887. [Google Scholar] [CrossRef]
  16. Cheng, X.; He, R.; Qu, Z.; Ai, S.; Fang, D. High temperature flexural strength of B4C–ZrB2 ceramic at 1000–1600 °C in air. Ceram. Int. 2015, 41, 14574–14578. [Google Scholar] [CrossRef]
  17. Kong, W.; Wei, Y.; Wang, S.; Chen, J.; Wang, Y. Research progress on cement-based materials by X-ray computed tomography. Int. J. Pavement Res. Technol. 2020, 13, 366–375. [Google Scholar] [CrossRef]
  18. Xu, F.; Hu, X.F.; Niu, Y.; Zhao, J.H.; Yuan, Q.X. In situ observation of grain evolution in ceramic sintering by SR-CT technique. Trans. Nonferrous Met. Soc. China 2009, 19, s684–s688. [Google Scholar] [CrossRef]
  19. Xu, F.; Hu, X.F.; Lu, B.; Zhao, J.H.; Wu, X.P.; Yuan, Q.X. Microstructures-evolution observation of boron carbide ceramic during sintering process by synchrotron radiation X-ray computed tomography. Wuji Cailiao Xuebao/J. Inorg. Mater. 2009, 24, 175–181. [Google Scholar] [CrossRef]
  20. Xu, F.; Hu, X.; Zhao, J.; Yuan, Q. In situ observation of the microstructure-evolution in silicon nitride ceramics sintering by synchrotron radiation X-ray computed tomography. Acta Chim. Sin. 2009, 67, 1205–1210. [Google Scholar]
  21. Xu, F.; Hu, X.F.; Miao, H.; Zhao, J.H. In situ investigation of ceramic sintering by synchrotron radiation X-ray computed tomography. Opt. Lasers Eng. 2010, 48, 1082–1088. [Google Scholar] [CrossRef]
  22. Li, Y.C.; Xu, F.; Hu, X.F.; Qu, H.Y.; Miao, H.; Zhang, Z.; Xiao, T.Q. In situ investigation of SiC powder’s microwave sintering by SR-CT technique. Sci. China Technol. Sci. 2011, 54, 1382–1388. [Google Scholar] [CrossRef]
  23. Okuma, G.; Watanabe, S.; Shinobe, K.; Nishiyama, N.; Takeuchi, A.; Uesugi, K.; Tanaka, S.; Wakai, F. 3D multiscale-imaging of processing-induced defects formed during sintering of hierarchical powder packings. Sci. Rep. 2019, 9, 11595. [Google Scholar] [CrossRef] [Green Version]
  24. Lu, P.; Lannutti, J.J.; Klobes, P.; Meyer, K. X-ray computed tomography and mercury porosimetry for evaluation of density evolution and porosity distribution. J. Am. Ceram. Soc. 2000, 83, 518–522. [Google Scholar] [CrossRef]
  25. Rane, K.; Petrò, S.; Strano, M. Evolution of porosity and geometrical quality through the ceramic extrusion additive manufacturing process stages. Addit. Manuf. 2020, 32, 101038. [Google Scholar] [CrossRef]
  26. Hondo, T.; Kato, Z.; Yasuda, K.; Wakai, F.; Tanaka, S. Coarse pore evolution in dry-pressed alumina ceramics during sintering. Adv. Powder Technol. 2016, 27, 1006–1012. [Google Scholar] [CrossRef]
  27. Hondo, T.; Yasuda, K.; Wakai, F.; Tanaka, S. Influence of binder layer of spray-dried granules on occurrence and evolution of coarse defects in alumina ceramics during sintering. J. Eur. Ceram. Soc. 2018, 38, 1846–1852. [Google Scholar] [CrossRef]
  28. Jia, R.; Wang, C.; Yu, S. Test of apparent porosity and closed porosity of carbon materials—Effective density method. Carbon Tech. 2009, 28, 50–52. [Google Scholar]
  29. Bo, L.; Kaihui, H.; Dongwei, S.; Weicai, Y.; Yonggang, C.; Mei, L.; Jun, S. Research on measurement of residual stresses of hemispherical lithium hydride by blind-hole method. Fusion Eng. Des. 2014, 89, 365–369. [Google Scholar] [CrossRef]
  30. Grigoriev, M.V.; Dyachkova, I.G.; Buzmakov, A.V.; Povolotsky, M.A.; Kokhan, V.V.; Chukalina, M.V.; Uvarov, V.I. μCT Analysis of Porous Cermet Membranes with the Use of Enhanced Filtration and Binarization Algorithms. J. Surf. Investig. 2020, 14, 1294–1303. [Google Scholar] [CrossRef]
  31. Shou, Y.D.; Zhao, Z.; Zhou, X.P. Sensitivity analysis of segmentation techniques and voxel resolution on rock physical properties by X-ray imaging. J. Struct. Geol. 2020, 133, 103978. [Google Scholar] [CrossRef]
  32. Otsu, N. A Threshold Selection Method from Gray-Level Histograms. IEEE Trans. Syst. Man Cybern. 1979, 9, 62–66. [Google Scholar] [CrossRef] [Green Version]
  33. Dias Velasco, F.R. Thresholding Using the ISODATA Clustering Algorithm. IEEE Trans. Syst. Man Cybern. 1980, 10, 771–774. [Google Scholar]
  34. Weickert, J.; Romeny, B.M.H.; Viergever, M.A. Efficient and Reliable Schemes for Nonlinear Diffusion Filtering. IEEE Trans. Image Process. 1998, 7, 398–410. [Google Scholar] [CrossRef] [PubMed] [Green Version]
  35. Yoshida, A.; Naito, S. Facile Hydrogen Release on the Composites of Lithium Hydride with Carbonaceous and Polymer Materials. J. Jpn. Pet. Inst. 2019, 62, 87–96. [Google Scholar] [CrossRef]
Figure 1. The evolution of porosity computed by three kinds of algorithms.
Crystals 11 01093 g001
Figure 2. The 3D images of typical pores (on the left), such as round-shaped (Type I) pores, long strip (Type II) pores and branched crack-like (Type III) pores. The length of Type II and III pores, the diameter of Type II pores and the Equivalent Diameter of Type I pores (on the right).
Crystals 11 01093 g002
Figure 3. The amount of statistical distribution of three kinds of pores at different temperatures. (a) Type I pores. (b) Type II pores. (c) Type III pores.
Crystals 11 01093 g003aCrystals 11 01093 g003b
Figure 4. (a) The amount and (b) volume change of three kinds of pores in the range of 25–500 °C.
Crystals 11 01093 g004
Figure 5. The 3D images of round-shaped (Type I) pores’ evolution with the temperature. (a) 25 °C. (b) 200 °C. (c) 300 °C. (d) 400 °C. (e) 500 °C.
Crystals 11 01093 g005
Figure 6. The CT images at different temperatures. (a) 25 °C. (b) 200 °C. (c) 300 °C. (d) 400 °C. (e) 500 °C.
Crystals 11 01093 g006
Figure 7. The 3D images of the size change of a long strip (Type II) pore with the temperature. (a) 25 °C. (b) 200 °C. (c) 300 °C. (d) 400 °C. (e) 500 °C.
Crystals 11 01093 g007aCrystals 11 01093 g007b
Figure 8. The volume, length and diameter of a long strip (Type II) pore as a function of the temperature.
Crystals 11 01093 g008
Figure 9. The 3D images of the shape and size change of some branched crack-like (Type III) pores with the temperature. (a) 25 °C. (b) 200 °C. (c) 300 °C. (d) 400 °C. (e) 500 °C.
Crystals 11 01093 g009
Figure 10. The CT images corresponding to the layer marked by a red square in Figure 9a–e. (a) 25 °C. (b) 200 °C. (c) 300 °C. (d) 400 °C. (e) 500 °C.
Crystals 11 01093 g010aCrystals 11 01093 g010b
Publisher’s Note: MDPI stays neutral with regard to jurisdictional claims in published maps and institutional affiliations.

