Article

Tailoring α/β Ratio of Pollen-Like Anhydrous Lactose as Ingredient Carriers for Controlled Dissolution Rate

1
Xiangya School of Pharmaceutical Sciences, Central South University, Changsha 410013, China
2
School of Materials Science and Engineering, Central South University, Changsha 410013, China
*
Authors to whom correspondence should be addressed.
These authors contributed equally to this work.
Crystals 2021, 11(9), 1049; https://doi.org/10.3390/cryst11091049
Submission received: 29 July 2021 / Revised: 20 August 2021 / Accepted: 25 August 2021 / Published: 31 August 2021

Abstract

:
Lactose is a commonly used excipient with two isomers. Different isomers have different properties, especially in terms of solubility. This work is mainly to explore the influence of different a/β ratio lactose on drug dissolution. This work has developed novel mesoporous pollen-like lactose anhydrous with tailored α/β ratios as ingredient carriers for controlled dissolution rate. The produced lactose carriers are pollen-like with a particle size of ~15 μm and a mean pore width of ~30 nm. β-lactose anhydrous has a unique FTIR-peak at 948 cm−1, whereas α-lactose anhydrous shows a unique FTIR-peak at 855 cm−1. DSC analysis suggests that the pollen-like α/β-lactose crystals are polymorphs with unique peaks of melting points. XRD analysis suggests that (5:5)α/β-lactose polymorph has high crystalline purity. The loading efficiency (30.6–33.4% w/w) of acetamidophenol within the nanoporous lactose particles is dependent on the surface structure and pore volumes—the pore volumes were found to be 0.0209–0.0380 cm3/g. The release rates of acetamidophenol are lower for lactose with high α/β ratios. The lactose solubility and the first-order release constant can be tailored by changing the proportion of β-lactose in the pollen-like lactose carriers.

1. Introduction

Lactose, namely milk sugar, is isolated from milk after separating fats, proteins (casein and whey), minerals and a few other ingredients. As reported by Young, et al. [1], each 100 g regular milk (aqueous) contains about 4.7 g lactose, 3.2 g protein and 3.6 g fat. Their weight fractions generally change within certain ranges regarding factors of breed, gene, health, environment, management practices and diet [2], where the concentration of lactose keeps relatively constant [3]. Regarding the high and constant concentration of lactose in milk, lactose has been purely isolated in the industry from nanofiltered whey solutions with assistance of activated carbons at adjusted pHs. Lactose has been widely used in food [4] and pharmaceutical applications [5] as an ingredient. Lactose is a versatile pharmaceutical excipient in many forms, which is widely used in many dosage forms. In real life, oral preparations are widely used in clinical preparations. About 80% of oral preparations are tablets, while about 70% of commercially available tablets use lactose as one of the main excipients [6]. As a common pharmaceutical excipient, lactose has many advantages, such as wide sources, low cost, safety, mild taste, low sweetness, stable physical and chemical properties, good compatibility with active ingredients and other excipients, and low hygroscopicity [7,8].
Lactose has amorphous and crystalline forms exhibiting different physical and chemical properties [9]. Most spray-dried dairy products contain amorphous lactose. In amorphous form, lactose is very hygroscopic, showing a high solubility but a low storage stability [10]. Since lactose is more stable in crystalline forms, crystalline lactose (monohydrate or anhydrous) is preferred when used as food additives or pharmaceutical excipients in the industry, considering the manufacturing, storage, and transportation processes for the lowest uncertainty in quality control [11]. Lactose monohydrate is crystalline and known as the most stable form for lactose products [12]. Crystalline anhydrous lactose exhibits good compressibility and can be used for moisture-sensitive chemicals [13].
Moreover, lactose has two stereoisomers (α-lactose and β-lactose), based on the mutarotation of the glucose part (disaccharide composed of glucose and galactose) [14,15]. The difference of configuration of α-lactose and β-lactose shows distinct properties. For example, there are obvious differences in optical rotation and solubility of α-lactose and β-lactose. The specific rotations of α-lactose and β-lactose are +89.4° and +35°, respectively. α-lactose and β-lactose will undergo mutarotation and interconversion in the aqueous solution to reach dynamic equilibrium. When the equilibrium is reached at 20 °C, the specific rotation of lactose is +55.4°. However, the mutarotation of lactose isomers will not happen in dimethyl sulfoxide and ethanol. In addition, α-lactose and β-lactose have different solubilities. The solubilities of α-lactose and β-lactose are 7 g/100 mL and 50 g/100, respectively. With the temperature changes, the two isomers of lactose show different change trends in solubility. When the temperature is below 93.5 °C, the solubility of β-lactose is higher than that of α-lactose. When the temperature exceeds 93.5 °C, the solubility of α-lactose is higher than that of β-lactose. Therefore, α-lactose is generally crystallized in a saturated solution below 93.5 °C, mainly including two forms of α-lactose monohydrate and α-anhydrous lactose, while most of β-lactose crystallizes above 93.5 °C and exists in the form of anhydrous crystals [16].
As shown above, lactose can crystallize into different crystal forms of α,β-lactose under different conditions. It is possible to form co-crystallization of α-lactose and β-lactose with different molar ratios, which is different from a mixture of α-lactose crystals and β-lactose crystals. XRD analysis was used to identify these α/β-lactose co-crystals. The X-ray powder diffraction patterns of lactose crystal types include diffraction patterns of α-lactose monohydrate, anhydrous α-lactose, anhydrous β-lactose, anhydrous forms of α- and β-lactose in molar ratios of 5:3 and 4:1, which are co-crystallizations of α-lactose and β-lactose with different molar ratios and anhydrous β-lactose containing 26% α-lactose monohydrate according to the previously reported literature [17,18,19].
Pollen-like crystalline lactose has been manufactured by spray-drying and antisolvent vapor precipitation of the solution of α-Lactose monohydrate [20]. Compared with traditional lactose, pollen-like lactose has better stability, drug loading and solubility. The product is suggested to have great potential for drug delivery [21] but has not yet been studied for applications. The α/β ratio of the pollen-like lactose can hardly be controlled due to the spontaneous mutarotation in aqueous solutions, especially at high temperatures during spray-drying. It is also unclear if the product is 100% anhydrous. In this work, solution-based antisolvent precipitation has been employed to produce the pollen-like anhydrous lactose, where no water has been used in synthesis to avoid mutarotation of lactose. To explore the applications, the prepared pollen-like lactose with tailored α/β ratio of lactose has been used as ingredient carriers for controlled release. The loading efficiency and dissolution rate have been studied for the effect of α/β ratio of lactose. The findings from this work may benefit the future study on lactose-contained products for considering the release rates of food and pharmaceutical ingredients.

2. Materials and Methods

2.1. Chemicals

α-lactose anhydrous (>99%) and β-lactose anhydrous (≥90%) were pharmaceutical grade and purchased from Jiangsu Dawning Pharmaceutical Co., Ltd., Changzhou, China. Dimethyl sulfoxide (DMSO, >99%), ethanol (>99.9%) and NaCl were AR grade and purchased from Tianjin Hengxing Chemical Reagent Co., Ltd., Tianjin, China. 4-acetamidophenol (>99%, AR grade) was purchased from Shanghai Aladdin Biochemical Technology Co., Ltd., Shanghai, China.

2.2. Preparation of Pollen-Like Anhydrous Lactose with Tailored α/β Ratio

α-lactose anhydrous and β-lactose anhydrous were measured for their accurate purities by a polarimeter (IP-Manual, Shanghai InsMark Instrument Technology Co., Ltd., Shanghai, China.) in DMSO to avoid mutarotation of lactose. Based on the calculated purities, α-lactose anhydrous and β-lactose anhydrous with different ratios were dissolved in DMSO (0.2 g/mL) to yield ratios of α-lactose: β-lactose of 10:0, 7:3, 5:5 and 1:9. Sonication was used to assist the dissolution process. In a typical synthesis of pollen-like lactose, 0.5 mL lactose solution (0.2 g/mL in DMSO) with different α/β-lactose ratios was added with 15 mL ethanol for antisolvent precipitation. After 45 min for stabilization, the precipitated lactose was centrifuged at 4000 rpm (1980× g) using a Cence L400 centrifuge. The obtained lactose was firstly dried by gently blowing N2 gas onto the powder surface for 1 h at room temperature, and vacuum dried at 50 °C for overnight to achieve a constant weight. The dried products were the pollen-like anhydrous lactose.

2.3. Ingredient Loading, Tableting and Release

Acetamidophenol (for pain relief) was dissolved in ethanol with a concentration of 0.2 g/mL for ingredient loading. An amount of 3 mL acetamidophenol solution (in ethanol) was mixed with 0.3 g pollen-like lactose for 15 min at room temperature of 20 °C. The ingredient-loaded lactose was centrifuged at 4000 rpm (1980× g), and dried by N2 blowing and vacuum drying to achieve a constant weight. The dried products were the ingredient-loaded pollen-like lactose, where the α/β-lactose ratio was tailored. The ingredient-loaded pollen-like lactose powders were compressed into tablets for the release study. Tablets with a weight of 0.2 g were prepared by manually introducing powders into the biconvex-faced punch of a hydraulic press with a compression pressure of 5 MPa. A desktop tableting machine (Tianjin Tianguang FW-4, China) was used, and the internal diameter of the equipped tableting die was 10.0 mm (equal to the diameter of the tablets). In the tableting procedure, the dwell time was 60 s for all the samples when the required compression pressures were achieved. The dissolution test of a tablet was performed at 37 °C in 200 mL simulated gastric fluid (SGF), containing 2 g/L NaCl with a pH of 2.0 (adjusted using HCl) [22]. A magnetic bar was used for stirring at 60 rpm. The release rates of acetamidophenol from different formulated tablets were measured as functions of the release time using a UV-Vis spectrophotometer. Prior to the measurement, the samples collected were filtered by a 0.45 mm filter. The release profiles were fitted with the first-order release model.

2.4. Instrumental Analysis

Scanning electron microscopy (SEM):
The pollen-like anhydrous lactose carriers and the acetamidophenol-loaded lactose samples were placed onto carbon tapes on aluminium sample stabs. After Au-coating for 90 s at 15 mA by an CSS-200 Ion Sputter Coater (SHANSHIYIQI, China), the morphologies of the obtained particles were observed using a SS-60-ST Desktop SEM (SHANSHIYIQI, China) with an operating voltage of 15 kV and an operating pressure of 1 Pa. The SEM images were used to determine the morphology differences for the pollen-like lactose before and after acetamidophenol loading (adsorption).
Fourier transform infrared (FTIR) spectroscopy:
FTIR spectroscopy was used to investigate the fingerprint regions for the pollen-like anhydrous lactose carriers and the acetamidophenol-loaded lactose samples. The specimen was mixed with KBr powder, tableted and scanned for transmission sensitivity in a Nicolet 6700 FTIR spectrometer (Thermo Fisher Scientific). The FTIR spectra used a resolution of 1 cm−1 with 64 scans.
Differential Scanning Calorimetry (DSC):
DSC analysis was performed on the pollen-like anhydrous lactose carriers using a HSC-4 DSC (Henven, Beijing hengjiu experimental equipment Co., Ltd., Beijing, China). In a typical analysis, about 10 mg of solid sample was used in a sealed pan with a scanning temperature from room temperature to 280 °C and a ramp rate of 5 °C/min. Heat flow (mW) was recorded as a function of temperature (100–280 °C) for the analysis.
X-Ray diffraction (XRD):
XRD analysis was used to investigate the crystalline characteristics of pollen-like anhydrous lactose with tailored α/β ratio. Solid samples were loaded on powder holders and analysed using a Siemens D5000 diffractometer. During the XRD detection, the samples were scanned from 5° to 30° with a scanning rate of 0.02°/s, a scanning current of 30 mA and a scanning voltage of 40 kV.
Pore features:
Prior to the measurements, degassing of all samples was carried out at 80 °C for overnight. The pore features of the produced pollen-like lactose carriers were measured using a surface area analyser, TriStar II 3020 (Micromeritics Instrument Corporation, Norcross, GA, USA), at the temperature of liquid N2 at 77K. The total surface area (m2/g) was determined using the Brunauer–Emmet–Teller (BET) model, while the adsorption cumulative volume of pores (cm3/g) and the pore size distribution were generated according to the Barrett–Joyner–Halenda (BJH) model.
Ultraviolet (UV)-Visible (Vis) Spectroscopy:
By using the scan function of a Cary 60 UV-Vis spectrophotometer from 200 nm to 600 nm, the UV-Vis absorption spectrum for acetamidophenol in SGF was obtained, showing an absorbance peak at 243 nm. According to the linear-fitted calibration curve of acetamidophenol, the concentrations of acetamidophenol were determined for the release study.

3. Results and Discussion

3.1. Pollen-Like Anhydrous Lactose for Ingredient Loading

The α/β ratio of lactose is important for any food or pharmaceutical applications since the solubility, stability and morphology (in a micro sense) are different for and α-lactose [16,23], affecting the dissolution, taste, storage and inspection of products. After preparation, the angle of optical rotation has been measured to determine the α/β ratio for lactose using the polarimeter. The α/β ratio has been tailored for pollen-like lactose in this work and the yield of the preparation of pollen-like lactose particles is about 70% (w/w). As shown in Figure 1a,c,e,g, the produced anhydrous lactose carriers are pollen-like and similar in size (~15 μm). From their enlarged SEM images, the pollen-like lactose microparticles are composed of aggregated nanocrystals (<1 μm) of α/β-lactose. The aggregation was driven by the surface tension between lactose and ethanol during the antisolvent precipitation [20]. The petal-like lactose nanocrystals with different α/β ratios have different shapes in a micro sense, possibly due to the crystalline characteristics of α/β-lactose [23,24].
After ingredient loading, acetamidophenol has been adsorbed on the surface and in the pores of the pollen-like lactose, making the particle surface denser and smoother (Figure 1b,d,f,h)., which made the SEM image difference between before and after ingredient loading. Related literature reported that the concentration of Actamidophenol drug molecule using the wet adsorption method affects the pore distribution and specific surface area of lactose after drug loading. The drug is deposited inside of the pollen-like lactose particles instead of simply being physically distributed between the lactose molecules. As the drug loading increases, the porosity and specific surface area of the drug-loaded lactose decrease, indicating that more drugs are deposited in the inner structure of the lactose carrier.
Meanwhile, the lactose particles with the largest drug loading still retain the porous structure, further indicating that the drug is adsorbed inside the lactose instead of merely agglomerating on the surface of lactose, resulting in a porous structure coated with lactose. In this study, we also used the wet adsorption method to dissolve the drug in ethanol, adsorbed it in the porous structure of pollen-like lactose, and the concentration of the drug used in all samples remains the same. Therefore, the pore size distribution and diameter of lactose in each sample has no big difference. The effect of the drug on the pore distribution of each sample is the same as that of the diameter [25].
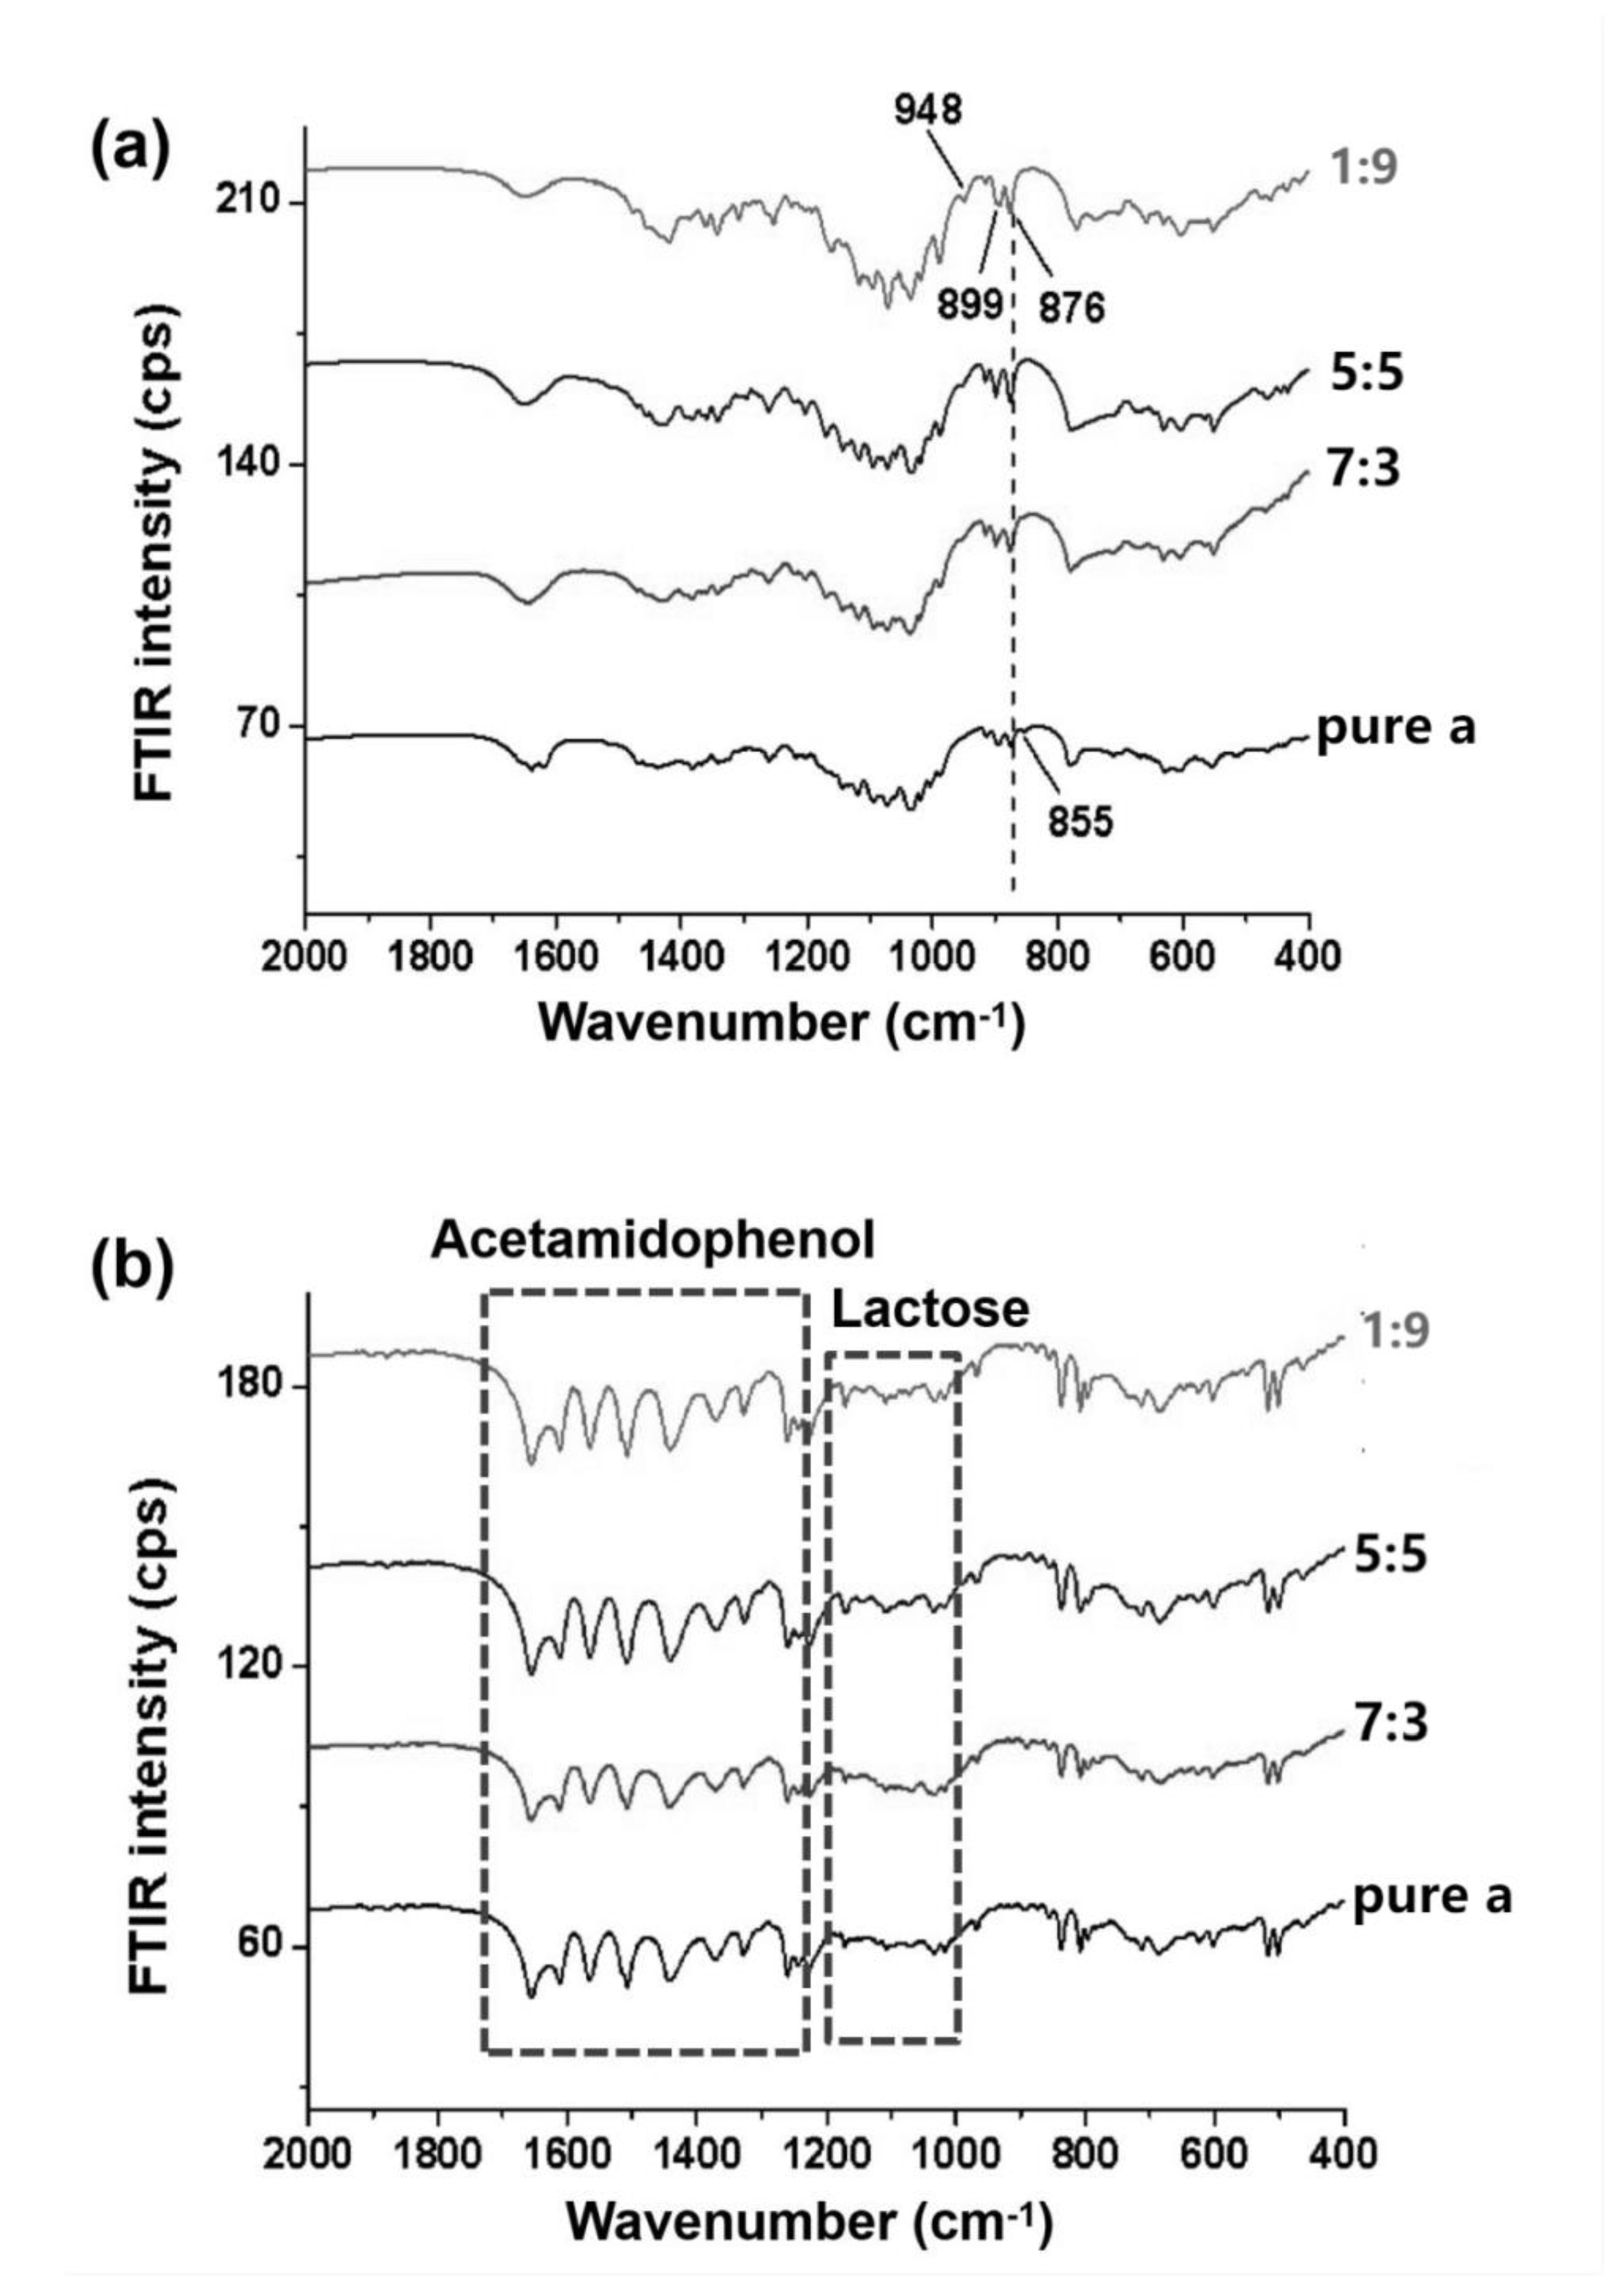
The identification of functional groups for lactose using FTIR has been reported by López-Pablos, et al. [26]. Since α-lactose and β-lactose are anomers, the α/β ratios can mainly be confirmed at the FTIR fingerprint regions (~1500–500 cm−1). From the FTIR spectra (Figure 2a), β-lactose anhydrous has a unique peak at 948 cm−1, where α-lactose anhydrous shows a unique peak at 855 cm−1. Moreover, the FTIR intensities at 899 and 876 cm−1 increase with the β-lactose content. This work suggests that FTIR could be used to roughly (difference in ratio: >20%) determine the ratio of α-lactose anhydrous over β-lactose anhydrous, although FTIR has been generally used to compare α-lactose monohydrate and β-lactose anhydrous [26,27]. Figure 2b shows the FTIR spectra of ingredient-loaded lactose samples, where acetamidophenol has a much higher intensity than lactose [28]. The loading efficiencies (weight ratio of ingredient over carrier, w/w, %) of acetamidophenol on lactose were only 30.6–33.4%, meaning that a large proportion of acetamidophenol had been adsorbed on the particle surfaces. The observation agrees well with the SEM results that surface morphologies of lactose microparticles significantly change after ingredient loading.

3.2. Crystalline Features of α/β-Lactose co-Crystals

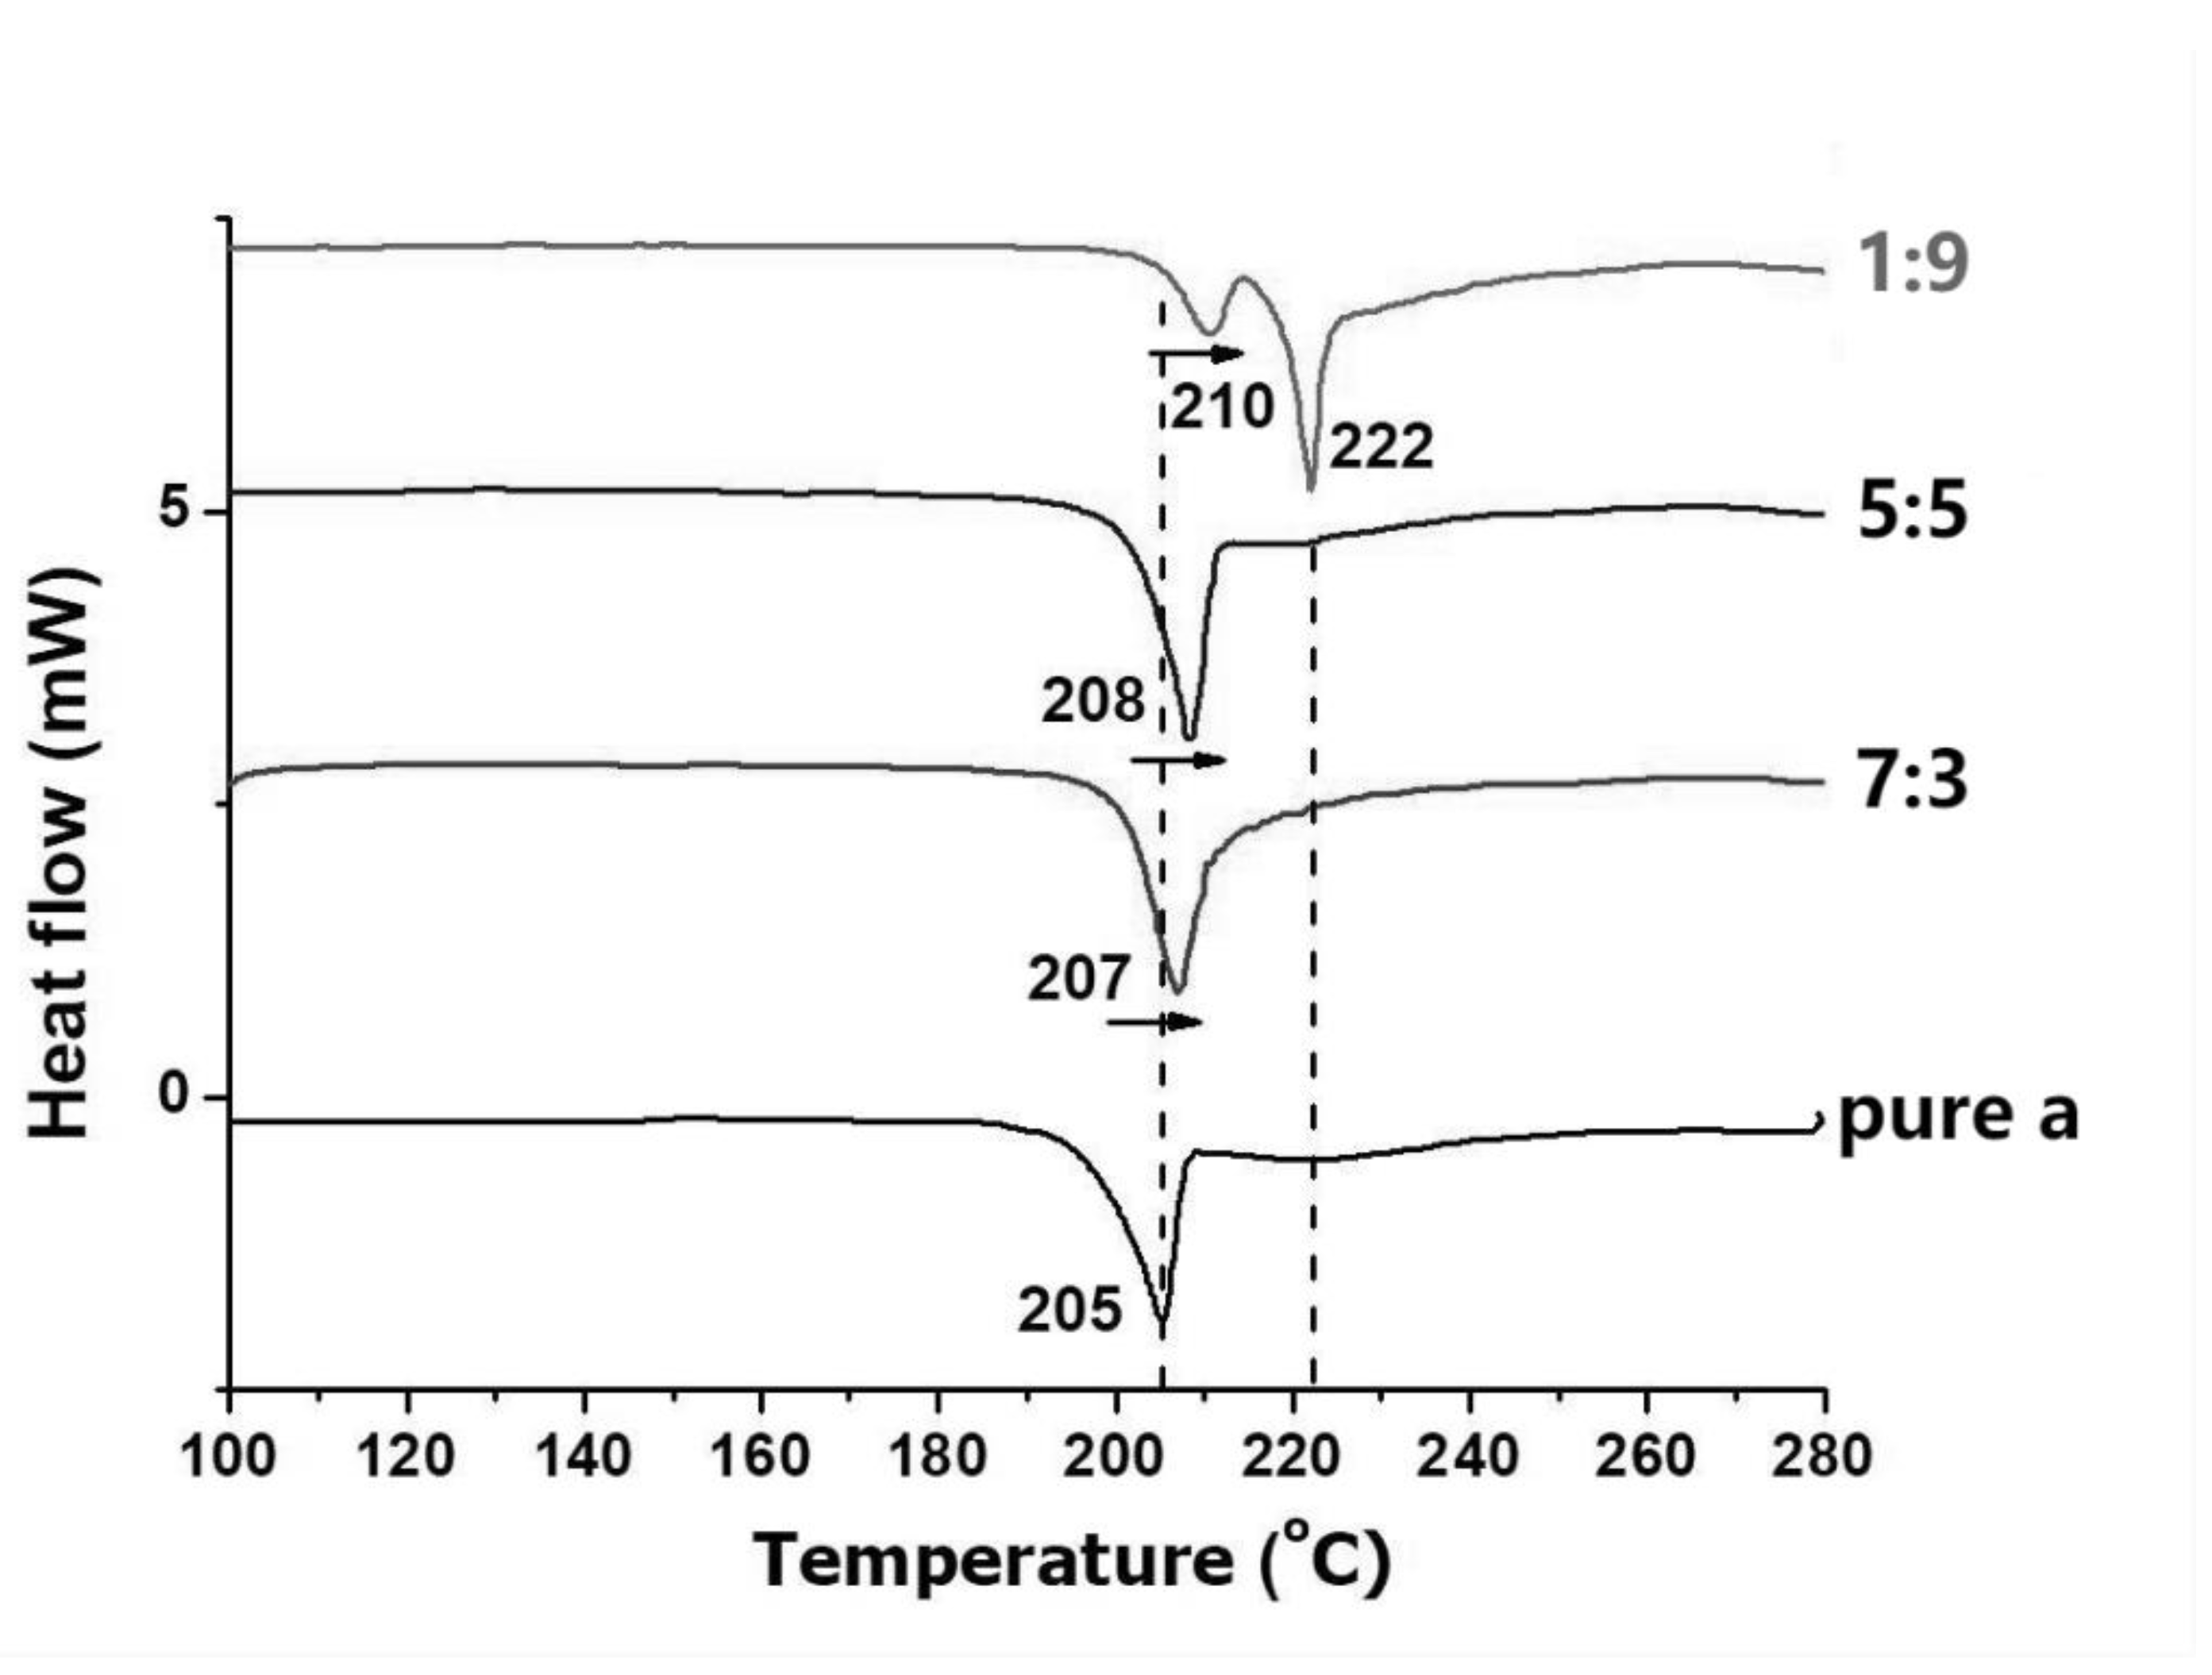
The α/β ratios of lactose have been determined to be pure-α, 7:3, 5:5 and 1:9 by polarimeter and FTIR for the prepared four pollen-like lactose carriers. Figure 3 shows the DSC curve for the pollen-like anhydrous lactose with tailored α/β ratios. The DSC curve of pure α-lactose anhydrous has a melting peak at 205 °C which the pure anhydrous β-lactose is at 237 °C [29]. With decreasing the α/β ratio to 7:3 and 5:5, the melting peak increases to 207 °C and 208 °C, respectively. As shown in the DSC curve reported by Gombas, et al. [30], α/β-lactose monohydrate crystal has two melting peaks at 213 and 224 °C for α-lactose and β-lactose, respectively; α/β-lactose, which has been recrystallized.
The post-glass transition has two melting peaks at 210 and 216 °C for α-lactose and β-lactose, respectively. The single peak is shown on the DSC curve (Figure 3) suggests that the pollen-like anhydrous lactose with an α/β ratio of 7:3 and 5:5 are α/β-lactose co-crystals. It is also suggested that the melting point of α/β-lactose co-crystal increases with the β proportion. When the α/β ratio of lactose is 1:9, two melting peaks are shown at 210 and 222 °C on the DSC curve for α/β-lactose and pure β-lactose, respectively. Based on the findings of α/β-lactose co-crystals, the 210 °C peak possibly cannot present the melting point of α-lactose, but it indicated that lactose molecule might exist in two ways. One was α/β-lactose co-crystal with a higher β ratio, and the peak of melting point appeared at 210 °C. However, due to the heat storage and the low heat transfer efficiency of the lactose co-crystals, another part of the pure β-lactose crystals underwent a slightly delayed endothermic process and reached its peak at 222 °C.
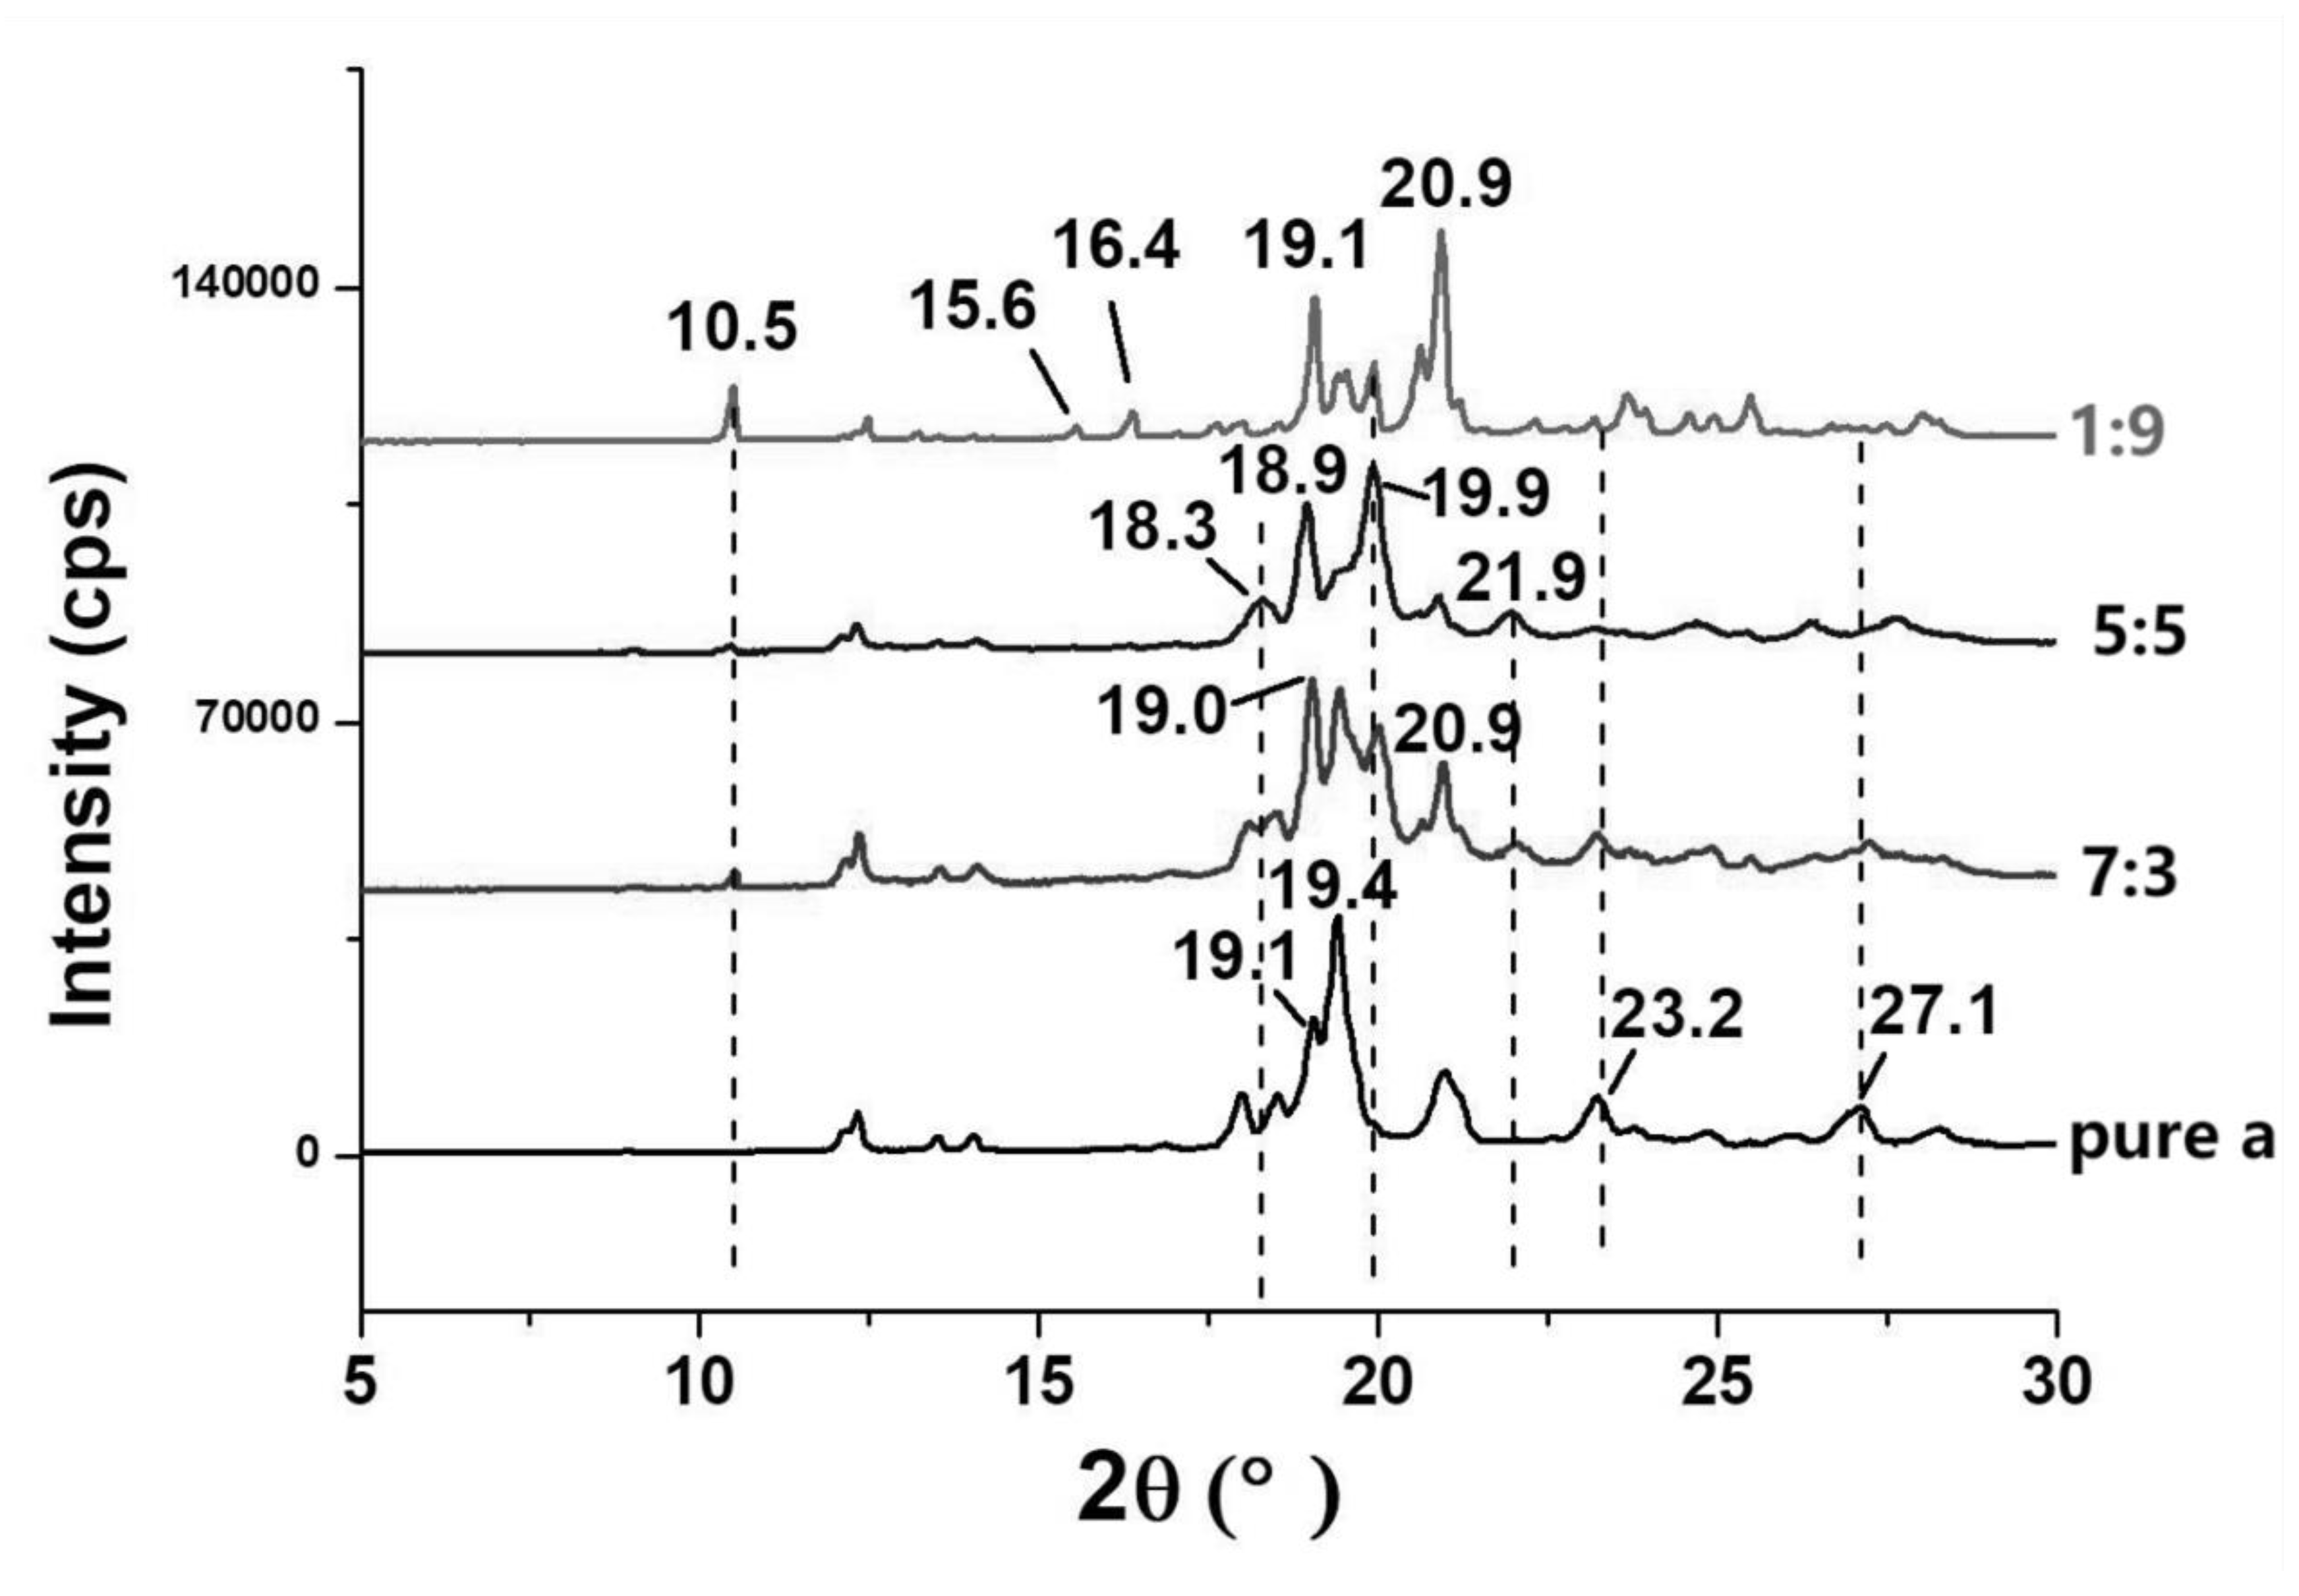
The α/β-lactose co-crystals formed in aqueous solutions have been previously studied via XRD characterization by Barham and Hodnett [18] as well as recently reported by Allan, Grush and Mauer [13]. Figure 4 shows the XRD patterns for the pollen-like anhydrous lactose with tailored α/β ratios. The pure α-lactose and the α/β-lactose of 1:9 (the ratio of α is low) have similar XRD patterns compared with the literature data for α-lactose and β-lactose, respectively. The α/β-lactose polymorphs with α/β ratios of 7:3 and 5:5, however, show different crystalline features on their XRD patterns for the following reason.
The pollen-like anhydrous lactose was synthesized in a DMSO-ethanol solution without mutarotation, possibly having a different crystallization process compared to conventional synthesis in aqueous solutions. At the α/β ratio of 5:5, the pollen-like anhydrous lactose shows the highest peak at 19.9° and a unique peak at 18.3°, suggesting that the crystalline structure is different from the others. The peak of α-lactose at 27.1° and the peaks of β-lactose at 15.6° and 16.4° have not been observed on the XRD pattern of α/β-lactose of 5:5, suggesting a high purity of the 5:5(α/β)-lactose polymorph. At α/β ratio of 7:3, the pollen-like anhydrous lactose has notable peaks at 10.0, 19.0, 19.4, 20.0, 20.9, 21.9, 23.2 and 27.1°, which can also be found on the XRD patterns of the others with different sensitivities. It is suggested that the 7:3(α/β)-lactose polymorph contains α-lactose, 5:5(α/β)-lactose polymorph and β-lactose in its crystal lattice, without showing a separated melting point of any crystalline impurity from the DSC result.

3.3. Loading Efficiency

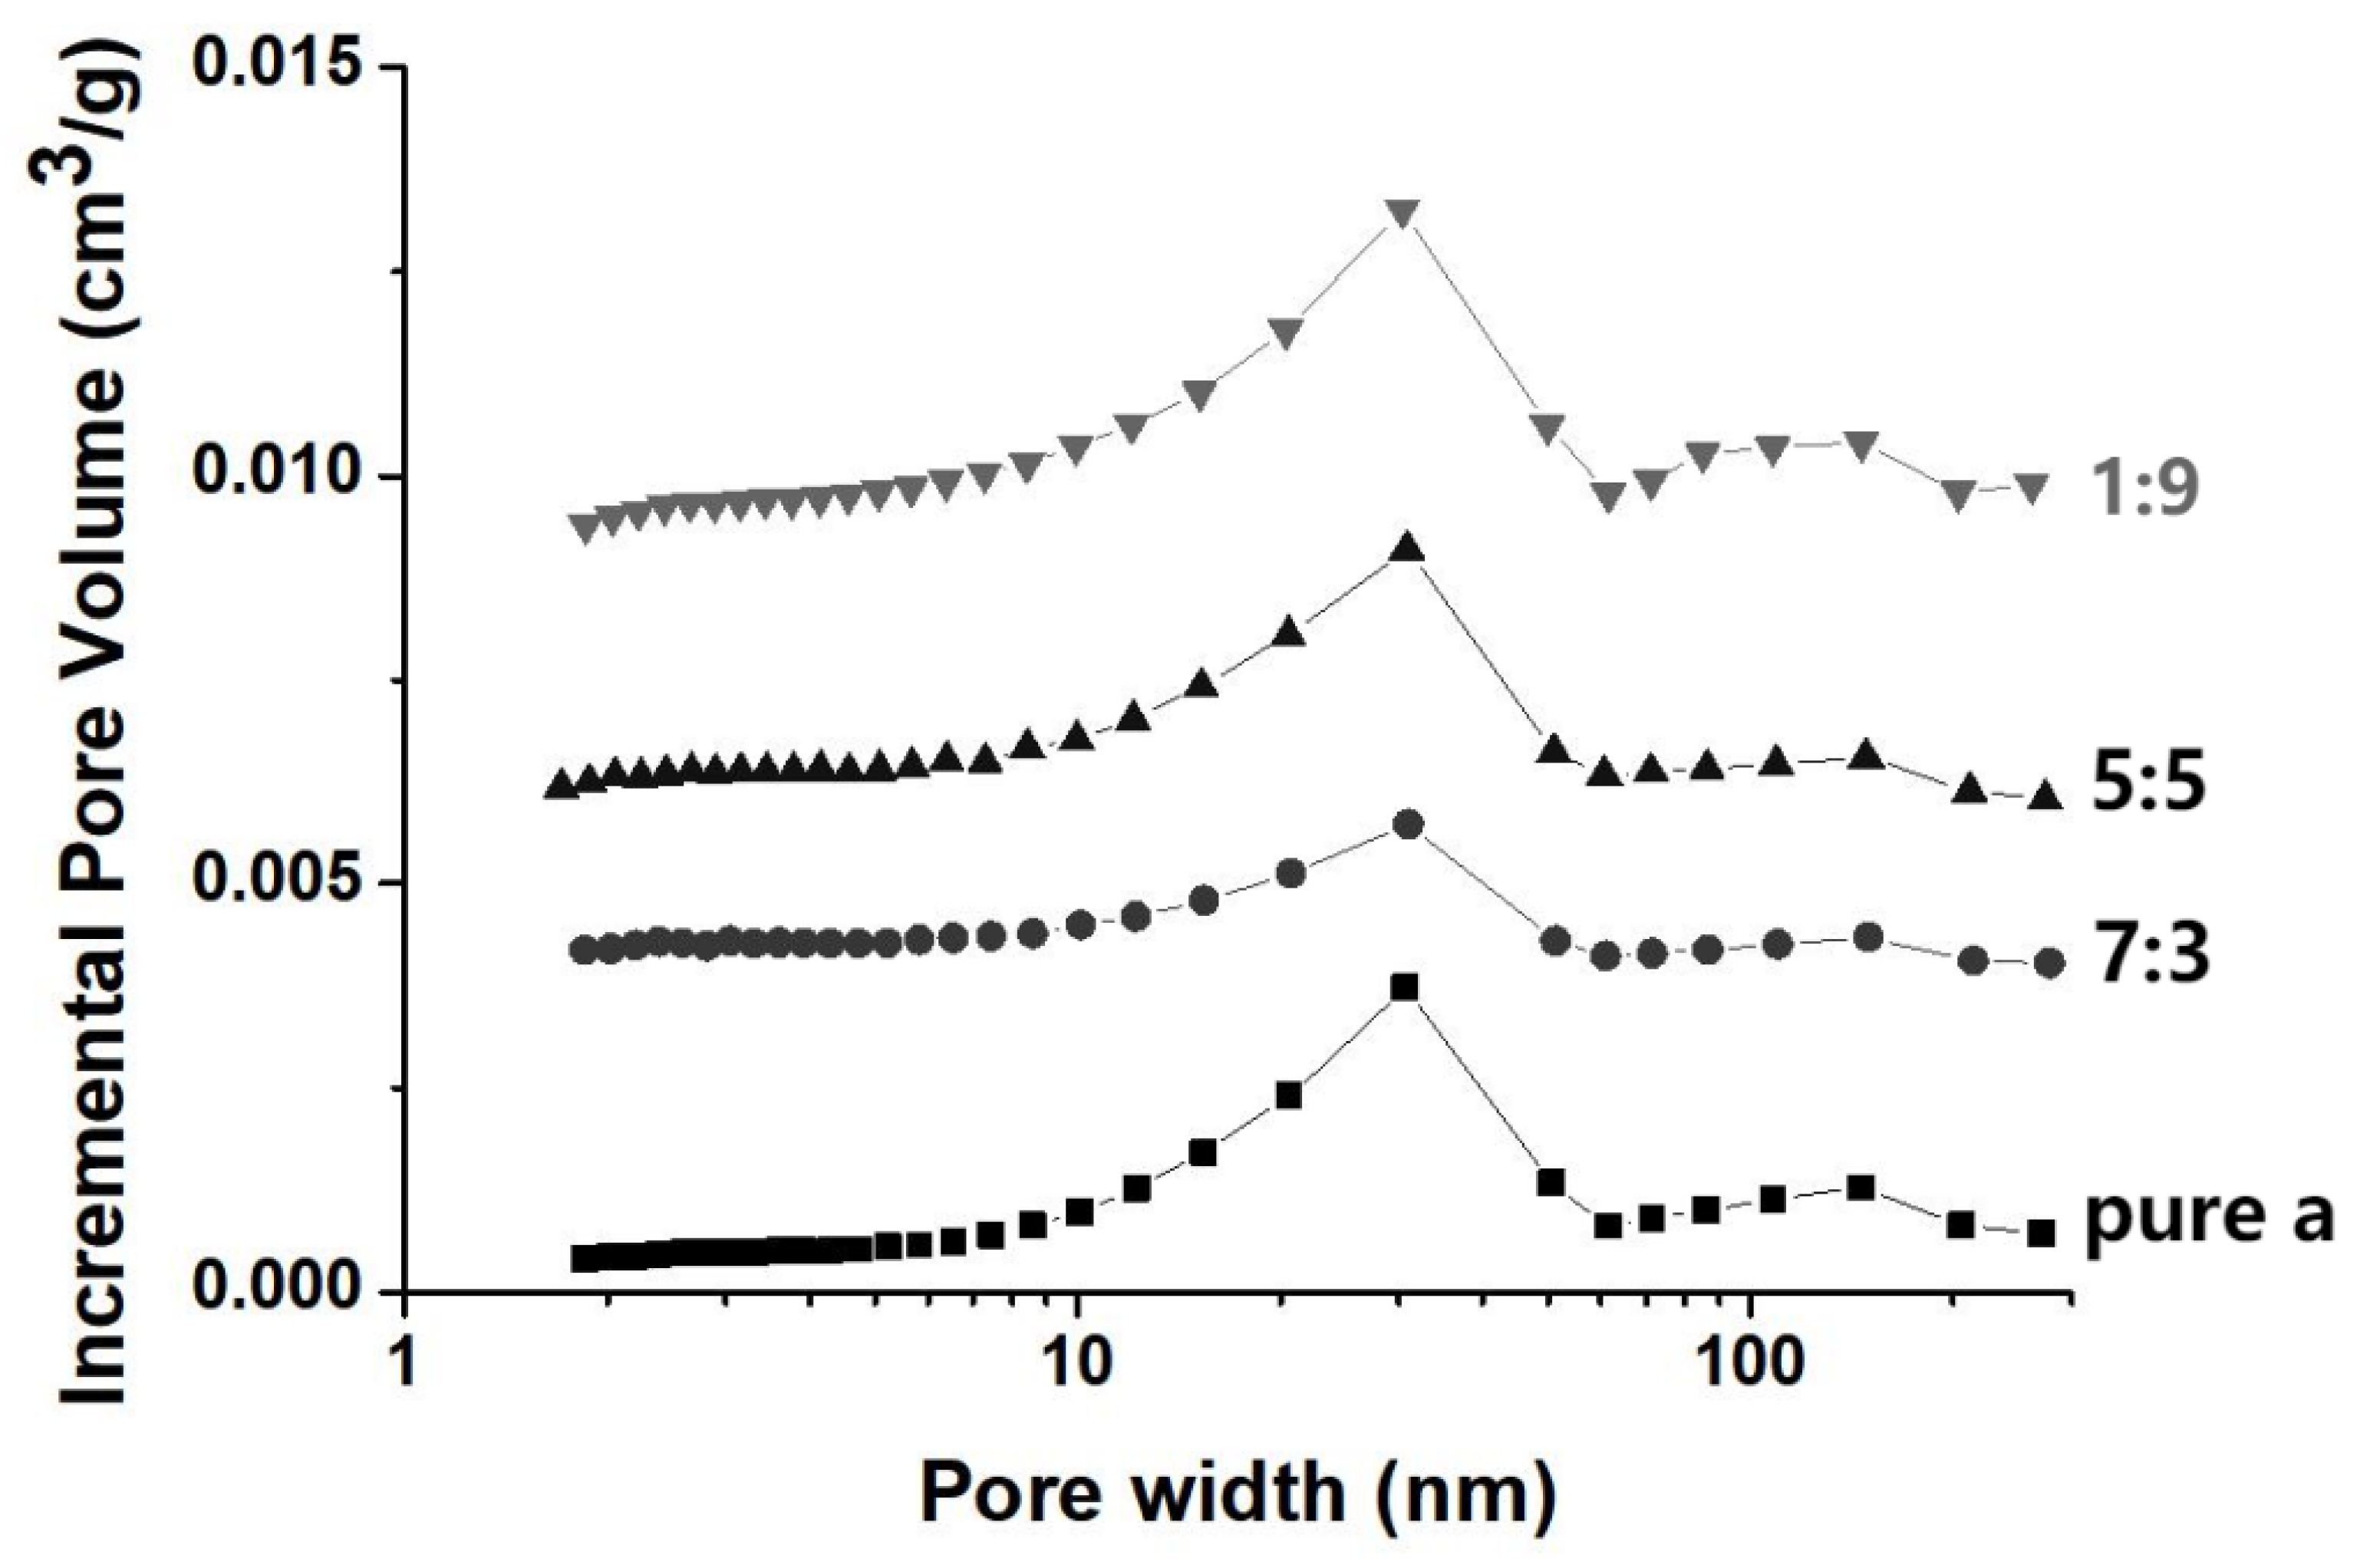
Since ingredients can be adsorbed on the surface and in the pores of the pollen-like lactose microparticles, the loading efficiency of acetamidophenol depends on the surface structure and pore features of the lactose carriers. Overall, the loading efficiencies of acetamidophenol on the lactose carriers are similar (30.6–33.4% w/w). As shown in Table 1, the adsorption cumulative volume of pores were 0.0271, 0.0209, 0.0316 and 0.0380 cm3/g, respectively, for α/β ratios of pure α, 7:3, 5:5, and 1:9. With decreasing the α/β ratio from 7:3 to 1:9, the pore volume increases while the loading efficiency increases from 30.6% to 33.4%. A high loading efficiency of 32.7%, however, has been observed for the pure α-lactose carrier. Although the pore volume of pure α-lactose carrier is relatively low (0.0271 cm3/g), a larger proportion of acetamidophenol is suggested to be adsorbed on the particle surface. The particle surface of the pollen-like α-lactose particle is less dense (Figure 1a), and the change in surface morphology is more significant (Figure 1b) than the others after ingredient loading (adsorption of acetamidophenol). Moreover, Figure 5 shows that all the pollen-like lactose carriers have a similar pore size distribution with typical mesopores around 30 nm and macropores around 150 nm. It is suggested that the α/β ratio does not significantly affect the pore size distribution. The small difference in the pore size distribution possibly results in changes in BET surface area (Table 1), where small pores with the same pore volume have higher surface areas than large pores.

3.4. Tailored α/β Ratio for Controlled Release

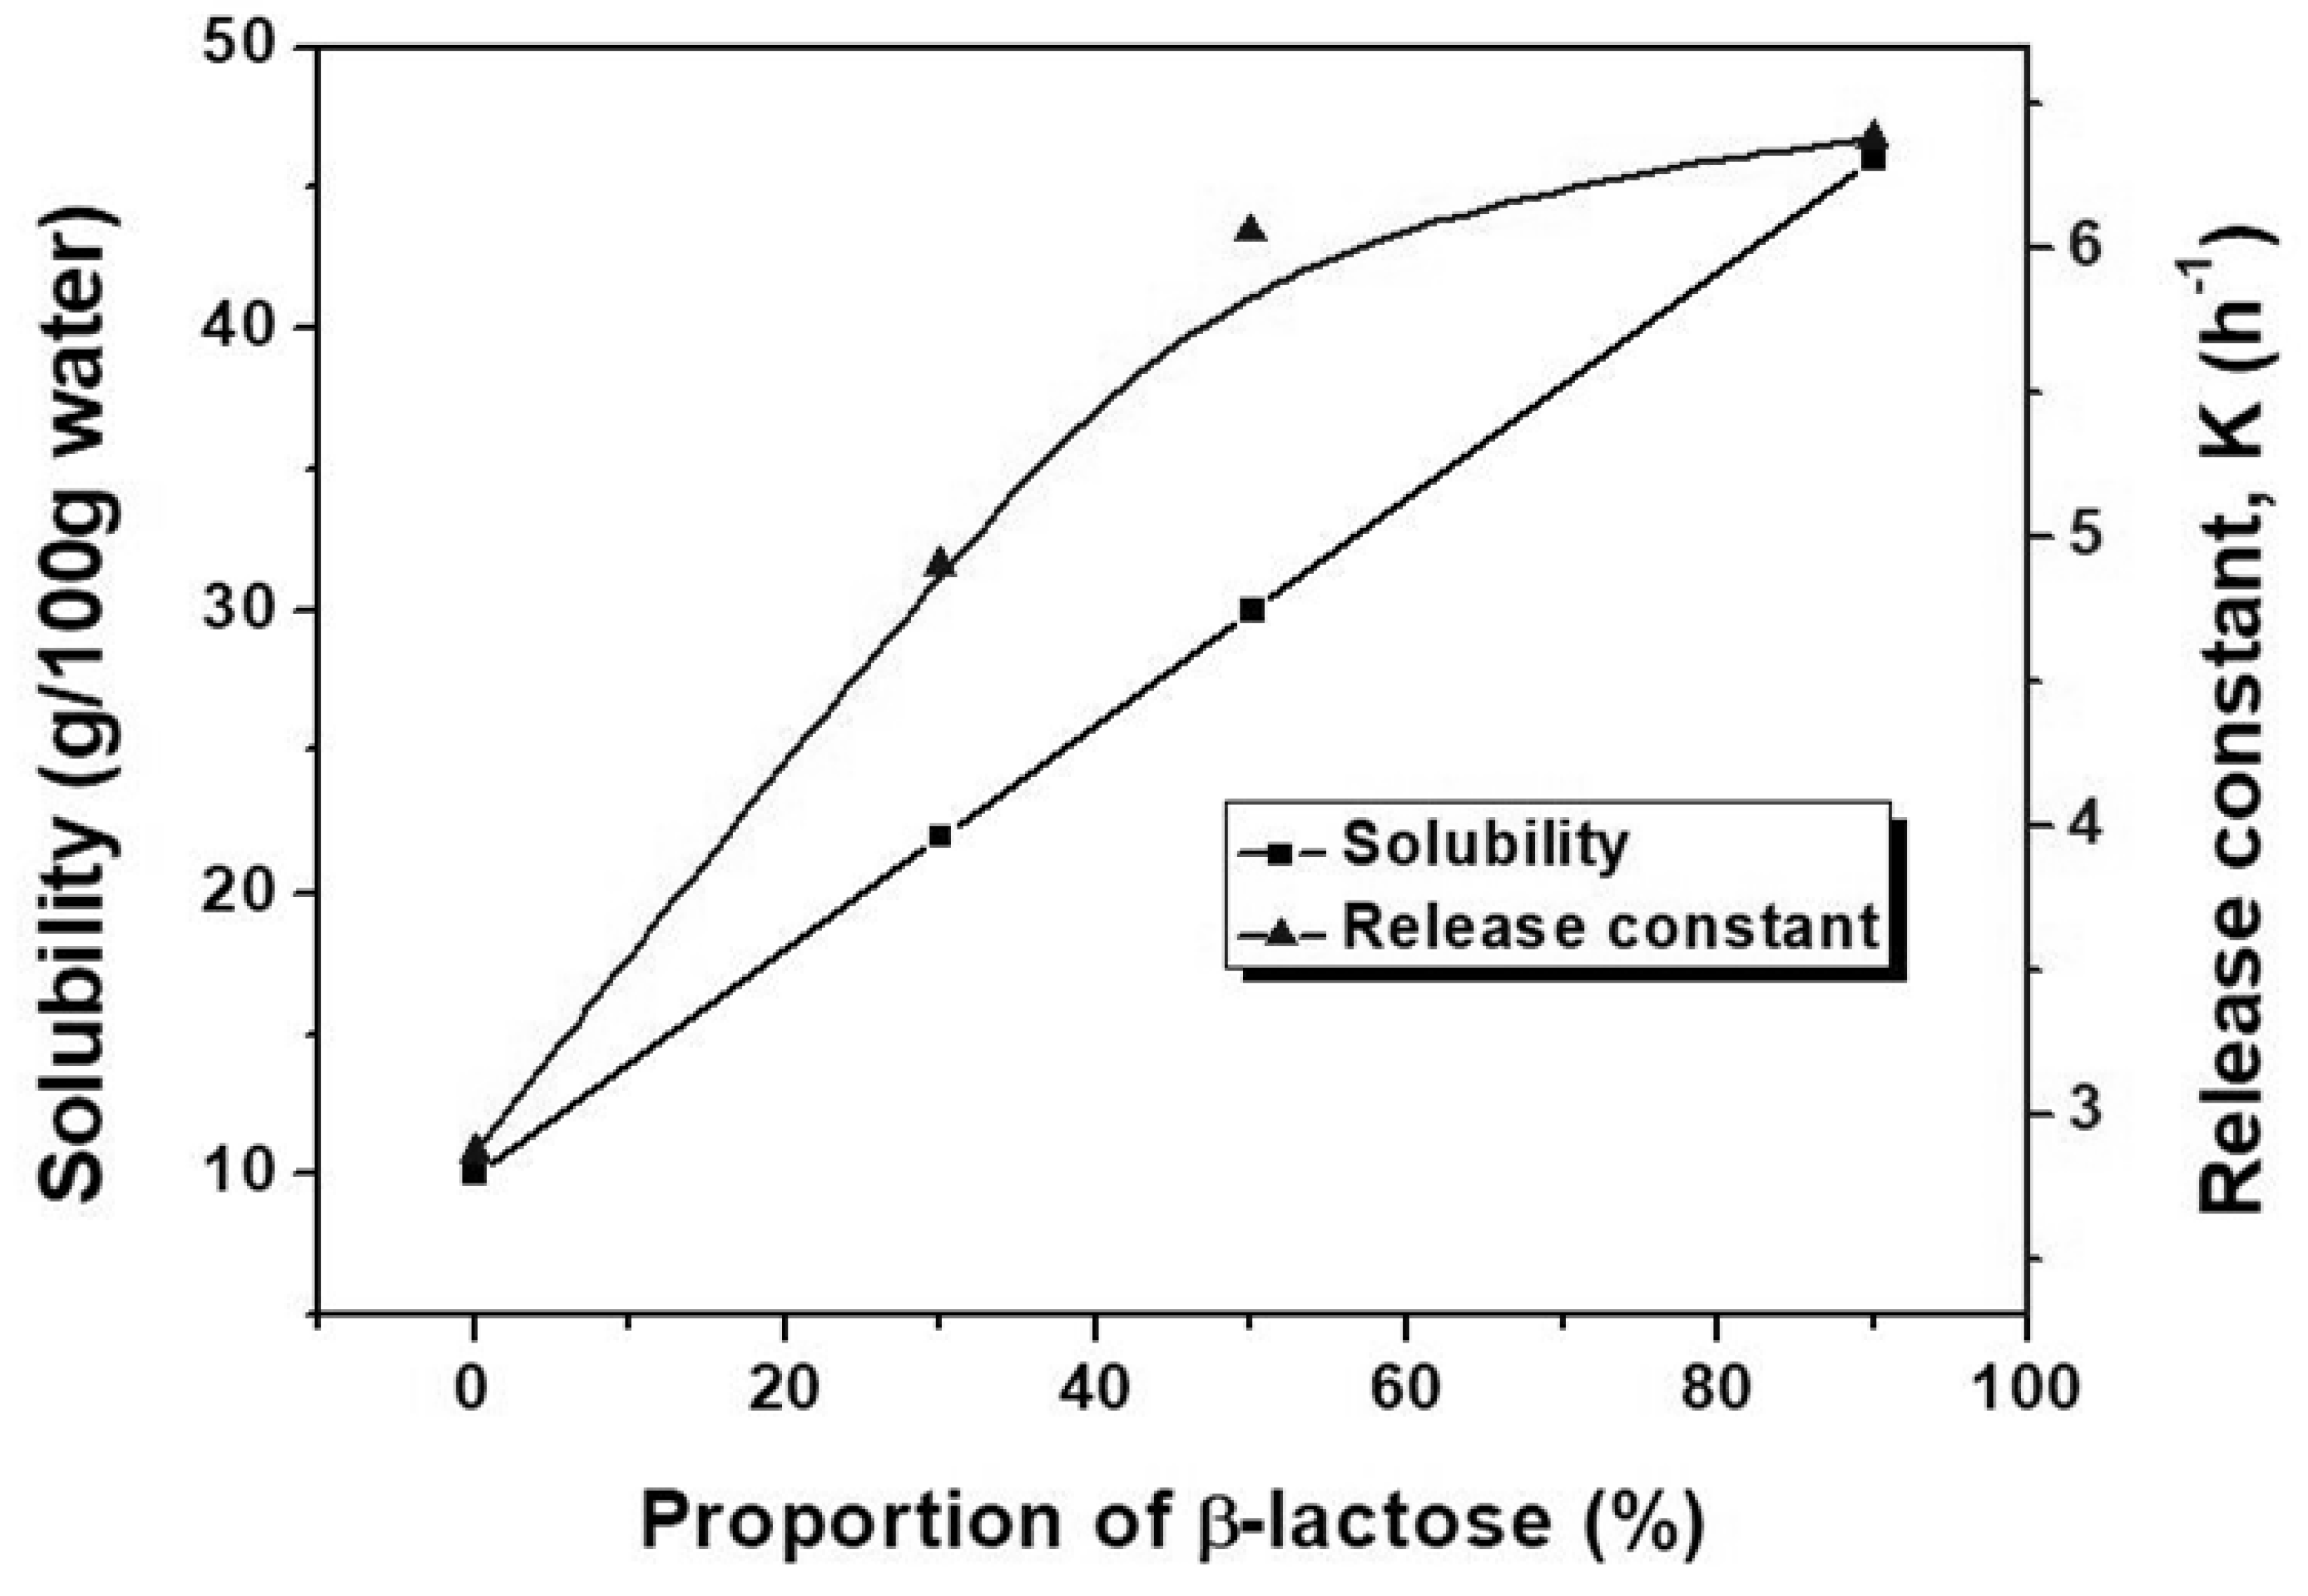
Figure 6a shows the schematic diagram for the mechanism of controlled release by tailoring α/β ratio of lactose. Since the solubility of β-lactose is about five times that of α-lactose at room temperature [16], the dissolution rate of pollen-like lactose relies on the α/β ratio of lactose. High ratio of α-lactose over β-lactose suggests a slow dissolution of the lactose carrier. Figure 6b shows the release profiles of acetamidophenol from the lactose-carried tablets with tailored α/β ratio of lactose. Overall, the release rate of acetamidophenol is lower for tablets of high α/β ratios. Acetamidophenol has been totally released in 1.5 h from the pure α-lactose carrier, whereas the release times are within 1 h for the other carriers. Linear fitting has been performed for the release profiles using the first-order release model [28,31] with intercept fixed at 0 (Figure 6c). Table 2 showed the fitting parameters for the release profiles using the first-order release model.The first-order release constants (k, h−1) for the pollen-like lactose tablets have been determined to be 2.87, 4.91, 6.06 and 6.39, showing an increasing order as the α/β ratio decreases from pure α to 1:9.
High values of R-squared are found (>0.9) for the samples with more β-lactose (>50%), since high solubility results in a fast dissolution of lactose carrier. It is suggested that release profiles of loaded ingredients can fit better with the first-order release model when the lactose carrier has less influence of preventing the tablet from dissolution. Figure 7 shows the changes of lactose solubility (at room temperature) and first-order release constant (k, h−1) as a function of the proportion of β-lactose in pollen-like lactose carrier. The figure benefits future works of designing lactose carriers for controlled release rates by tailoring the optimal α/β ratio of lactose. Moreover, the first-order release constant, k, can also be used to calculate the drug release rate (rt = k·Qo·e−kt) at time ‘t’, the cumulative amount of drug release (Qt = Qo·e−kt), and the fraction of released drug (F = 1 − e−kt) [28].

4. Conclusions

This work presents the development of pollen-like anhydrous lactose with tailored α/β ratio as ingredient carriers for controlled dissolution rate. A method of antisolvent precipitation in DMSO-ethanol was employed to produce the pollen-like anhydrous lactose, where no water was involved in synthesis to avoid mutarotation of lactose. The produced anhydrous lactose carriers were pollen-like and similar in size (~15 μm). FTIR spectra were used to identify α/β-lactose at 948 cm−1 and 855 cm−1. The study of crystalline features showed that the pollen-like α/β-lactose crystals were polymorphs with unique melting points. XRD analysis suggested that (5:5) α/β-lactose polymorph has high crystalline purity. The loading efficiency (30.6–33.4% w/w) of acetamidophenol on lactose was found depending on the surface structure and pore volumes (0.0209–0.0380 cm3/g) of the lactose particles. The release rates of acetamidophenol were lower for lactose carriers of high α/β ratios. The lactose solubility and the first-order release constant could be tailored by changing the proportion of β-lactose in a pollen-like lactose carrier.

Author Contributions

J.X.: Methodology, Investigation, Data curation. B.W.: Formal analysis, Investigation, Software. L.F.: Investigation. C.C.: Investigation. W.L.: Supervision, Writing—Review & Editing. S.T.: Conceptualization, Supervision, Writing—original draft. All authors have read and agreed to the published version of the manuscript.

Funding

This research received no external funding.

Data Availability Statement

Not applicable.

Conflicts of Interest

The authors declare no competing financial interests.

References

  1. Young, C.; Hillers, J.; Freeman, A. Production, consumption, and pricing of milk and its components. J. Dairy Sci. 1986, 69, 272–281. [Google Scholar] [CrossRef]
  2. Linn, J. Factors affecting the composition of milk from dairy cows. In Designing Foods: Animal Product Options in the Market Place; National Academy Press: Washington, DC, USA, 1988; p. 224. [Google Scholar]
  3. Heck, J.M.L.; van Valenberg, H.; Dijkstra, J.; van Hooijdonk, A.C.M. Seasonal variation in the Dutch bovine raw milk composition. J. Dairy Sci. 2009, 92, 4745–4755. [Google Scholar] [CrossRef]
  4. Costa, A.; Lopez-Villalobos, N.; Sneddon, N.; Shalloo, L.; Franzoi, M.; de Marchi, M.; Penasa, M. Invited review: Milk lactose—Current status and future challenges in dairy cattle. J. Dairy Sci. 2019, 102, 5883–5898. [Google Scholar] [CrossRef] [PubMed]
  5. Pishnamazi, M.; Casilagan, S.; Clancy, C.; Shirazian, S.; Iqbal, J.; Egan, D.; Edlin, C.; Croker, D.M.; Walker, G.M.; Collins, M.N. Microcrystalline cellulose, lactose and lignin blends: Process mapping of dry granulation via roll compaction. Powder Technol. 2018, 341, 38–50. [Google Scholar] [CrossRef]
  6. Illanes, A.; Guerrero, C.; Vera, C.; Wilson, L.; Conejeros, R.; Scott, F. Lactose-Derived Prebiotics: A Process Perspective; Academic Press: Cambridge, MA, USA, 2016; pp. 1–31. [Google Scholar]
  7. Rowe, R.C.; Sheskey, P.; Quinn, M. Handbook of Pharmaceutical Excipients; Libros Digitales-Pharmaceutical Press: London, UK, 2009; pp. 359–377. [Google Scholar]
  8. Jivraj, M.; Martini, L.G.; Thomson, C.M. An overview of the different excipients useful for the direct compression of tablets. Pharm. Sci. Technol. Today 2000, 3, 58–63. [Google Scholar] [CrossRef]
  9. Tan, S.; Ebrahimi, A.; Liu, X.; Langrish, T. Role of templating agents in the spray drying and postcrystallization of lactose for the production of highly porous powders. Dry. Technol. 2018, 36, 1882–1891. [Google Scholar] [CrossRef]
  10. Huppertz, T.; Gazi, I. Lactose in dairy ingredients: Effect on processing and storage stability. J. Dairy Sci. 2016, 99, 6842–6851. [Google Scholar] [CrossRef]
  11. Altamimi, M.J.; Wolff, K.; Nokhodch, A.; Martin, G.P.; Royall, P.G. Variability in the α and β anomer content of commercially available lactose. Int. J. Pharm. 2019, 555, 237–249. [Google Scholar] [CrossRef] [Green Version]
  12. Murphy, B.M.; Prescott, S.W.; Larson, I. Measurement of lactose crystallinity using Raman spectroscopy. J. Pharm. Biomed. Anal. 2005, 38, 186–190. [Google Scholar] [CrossRef] [PubMed]
  13. Allan, M.C.; Grush, E.; Mauer, L.J. RH-temperature stability diagram of α- and β-anhydrous and monohydrate lactose crystalline forms. Food Res. Int. 2019, 127, 108717. [Google Scholar] [CrossRef]
  14. Agrawal, S.; Paterson, T.; Jones, J.; McLeod, J.; Bronlund, J. A mathematical model based parametric sensitivity analysis of an evaporative crystallizer for lactose monohydrate. Food Bioprod. Process. 2015, 97, 1–11. [Google Scholar] [CrossRef]
  15. Ramesh, P.; Kritikos, A.; Tsilomelekis, G. Effect of metal chlorides on glucose mutarotation and possible implications on humin formation. React. Chem. Eng. 2018, 4, 273–277. [Google Scholar] [CrossRef]
  16. Fox, P.F.; McSweeney, P.L.H. Lactose. In Dairy Chemistry and Biochemistry; Springer: Cham, Switzerland, 2015; pp. 21–32. [Google Scholar]
  17. Lara-Mota, E.E.; Nicolás–Vázquez, M.I.; López-Martínez, L.A.; Espinosa-Solis, V.; Cruz-Alcantar, P.; Toxqui-Teran, A.; Saavedra-Leos, M.Z. Phenomenological study of the synthesis of pure anhydrous β-lactose in alcoholic solution. Food Chem. 2020, 340, 128054. [Google Scholar] [CrossRef] [PubMed]
  18. Barham, A.S.; Hodnett, B.K. In situ x-ray diffraction study of the crystallization of spray-dried lactose. Cryst. Growth Des. 2005, 5, 1965–1970. [Google Scholar] [CrossRef]
  19. Haque, M.K.; Roos, Y.H. Crystallization and X-ray diffraction of spray-dried and freeze-dried amorphous lactose. Carbohydr. Res. 2005, 340, 293–301. [Google Scholar] [CrossRef] [PubMed]
  20. Mansouri, S.; Chin, G.Q.; Ching, T.W.; Woo, M.W.; Fu, N.; Chen, X.D. Precipitating smooth amorphous or pollen structured lactose microparticles. Chem. Eng. J. 2013, 226, 312–318. [Google Scholar] [CrossRef]
  21. Woo, M.W.; Mansouri, S.; Chen, X.D. Antisolvent vapor precipitation: The future of pulmonary drug delivery particle production? Expert Opin. Drug Deliv. 2014, 11, 307–311. [Google Scholar] [CrossRef] [Green Version]
  22. Hibbins, A.R.; Kumar, P.; Choonara, Y.E.; Kondiah, P.P.D.; Marimuthu, T.; du Toit, L.C.; Pillay, V. Design of a versatile pH-responsive hydrogel for potential oral delivery of gas-tric-sensitive bioactives. Polymers 2017, 9, 74. [Google Scholar] [CrossRef] [Green Version]
  23. Parimaladevi, P.; Srinivasan, K. Influence of supersaturation level on the morphology of α-lactose monohydrate crystals. Int. Dairy J. 2014, 39, 301–311. [Google Scholar] [CrossRef]
  24. Parimaladevi, P.; Srinivasan, K. Achievement of favorable uniform crystal size distribution of alpha-lactose monohydrate (α-LM) through swift cooling process. J. Food Eng. 2015, 151, 1–6. [Google Scholar] [CrossRef]
  25. Ebrahimi, A.; Saffari, M.; Dehghani, F.; Langrish, T. Incorporation of acetaminophen as an active pharmaceutical ingredient into porous lactose. Int. J. Pharm. 2016, 499, 217–227. [Google Scholar] [CrossRef]
  26. López-Pablos, A.L.; Leyva-Porras, C.C.; Silva-Cázares, M.B.; Longoria-Rodríguez, F.E.; Pérez-García, S.A.; Vértiz-Hernández, A.; Saavedra-Leos, M.Z. Preparation and characterization of high purity anhydrous β-lactose from α-lactose monohydrate at mild temperature. Int. J. Polym. Sci. 2018, 2018, 1–10. [Google Scholar] [CrossRef] [Green Version]
  27. Tan, S.; Ebrahimi, A.; Langrish, T. Template-directed flower-like lactose with micro-meso-macroporous structure. Mater. Des. 2017, 117, 178–184. [Google Scholar] [CrossRef]
  28. Tan, S.; Zhong, C.; Langrish, T. Pre-gelation assisted spray drying of whey protein isolates (WPI) for microencapsulation and controlled release. LWT 2020, 117, 108625. [Google Scholar] [CrossRef]
  29. Smith, G.; Hussain, A.; Bukhari, N.I.; Ermolina, I. Quantification of residual crystallinity of ball-milled, commercially available, anhydrous β-lactose by differential scanning calorimetry and terahertz spectroscopy. J. Therm. Anal. Calorim. 2015, 121, 327–333. [Google Scholar] [CrossRef]
  30. Gombás, A.; Szabó-Révész, P.; Kata, M.; Regdon, G., Jr.; Erős, I. Quantitative determination of crystallinity of α-lactose monohydrate by DSC. J. Therm. Anal. Calorim. 2002, 68, 503–510. [Google Scholar] [CrossRef]
  31. Segun, P.; Ajala, O.T.; Aremu, O.I. The effect of formulation variables on the release kinetics of paracetamol tablet formulations. J. Pharm. Health Sci. 2018, 6, 103–111. [Google Scholar]
Figure 1. SEM images of the pollen-like mesoporous lactose particles with α:β ratios of (a,b) 1:0, (c,d) 3:7, (e,f) 5:5 and (g,h) 1:9, before and after ingredient loading. Scale bars: 5 μm (ah) and 1 μm (enlarged images).
Crystals 11 01049 g001
Figure 2. FTIR spectra of the pollen-like mesoporous lactose particles with α:β ratios of 1:0 (pure α), 3:7, 5:5 and 1:9, (a) before and (b) after ingredient loading.
Crystals 11 01049 g002
Figure 3. DSC spectra of the pollen-like anhydrous lactose with tailored α/β ratios.
Crystals 11 01049 g003
Figure 4. XRD patterns of the pollen-like anhydrous lactose with tailored α/β ratios.
Crystals 11 01049 g004
Figure 5. Pore size distribution of the pollen-like anhydrous lactose with tailored α/β ratios.
Crystals 11 01049 g005
Figure 6. (a) Schematic diagram for the mechanism of controlled release by tailoring α/β ratio of lactose. (b) Release profiles of acetamidophenol from the lactose-carried tablets in simulated gastric fluid with tailored α/β ratio of lactose. (c) Linear fitting for the release profiles using the first-order release model.
Crystals 11 01049 g006
Figure 7. The changes of lactose solubility (at room temperature) and first-order release constant as a function of the proportion of β-lactose in pollen-like lactose carrier.
Crystals 11 01049 g007
Table 1. Pore features and loading efficiencies of the pollen-like anhydrous lactose with tailored α/β ratio.
α/β RatioBET Surface Area (m2/g)BJH Pore Volume (cm3/g)Loading Efficiency (%)
Pure α13.00.027132.7
7:313.60.020930.6
5:516.30.031631.8
1:915.40.038033.4
Table 2. The fitting parameters for the release profiles using the first-order release model.
α/β RatioFirst-Order Release Constant, k (h−1)R-Squared
Pure α2.870.688
7:34.910.844
5:56.060.936
1:96.390.925
Publisher’s Note: MDPI stays neutral with regard to jurisdictional claims in published maps and institutional affiliations.