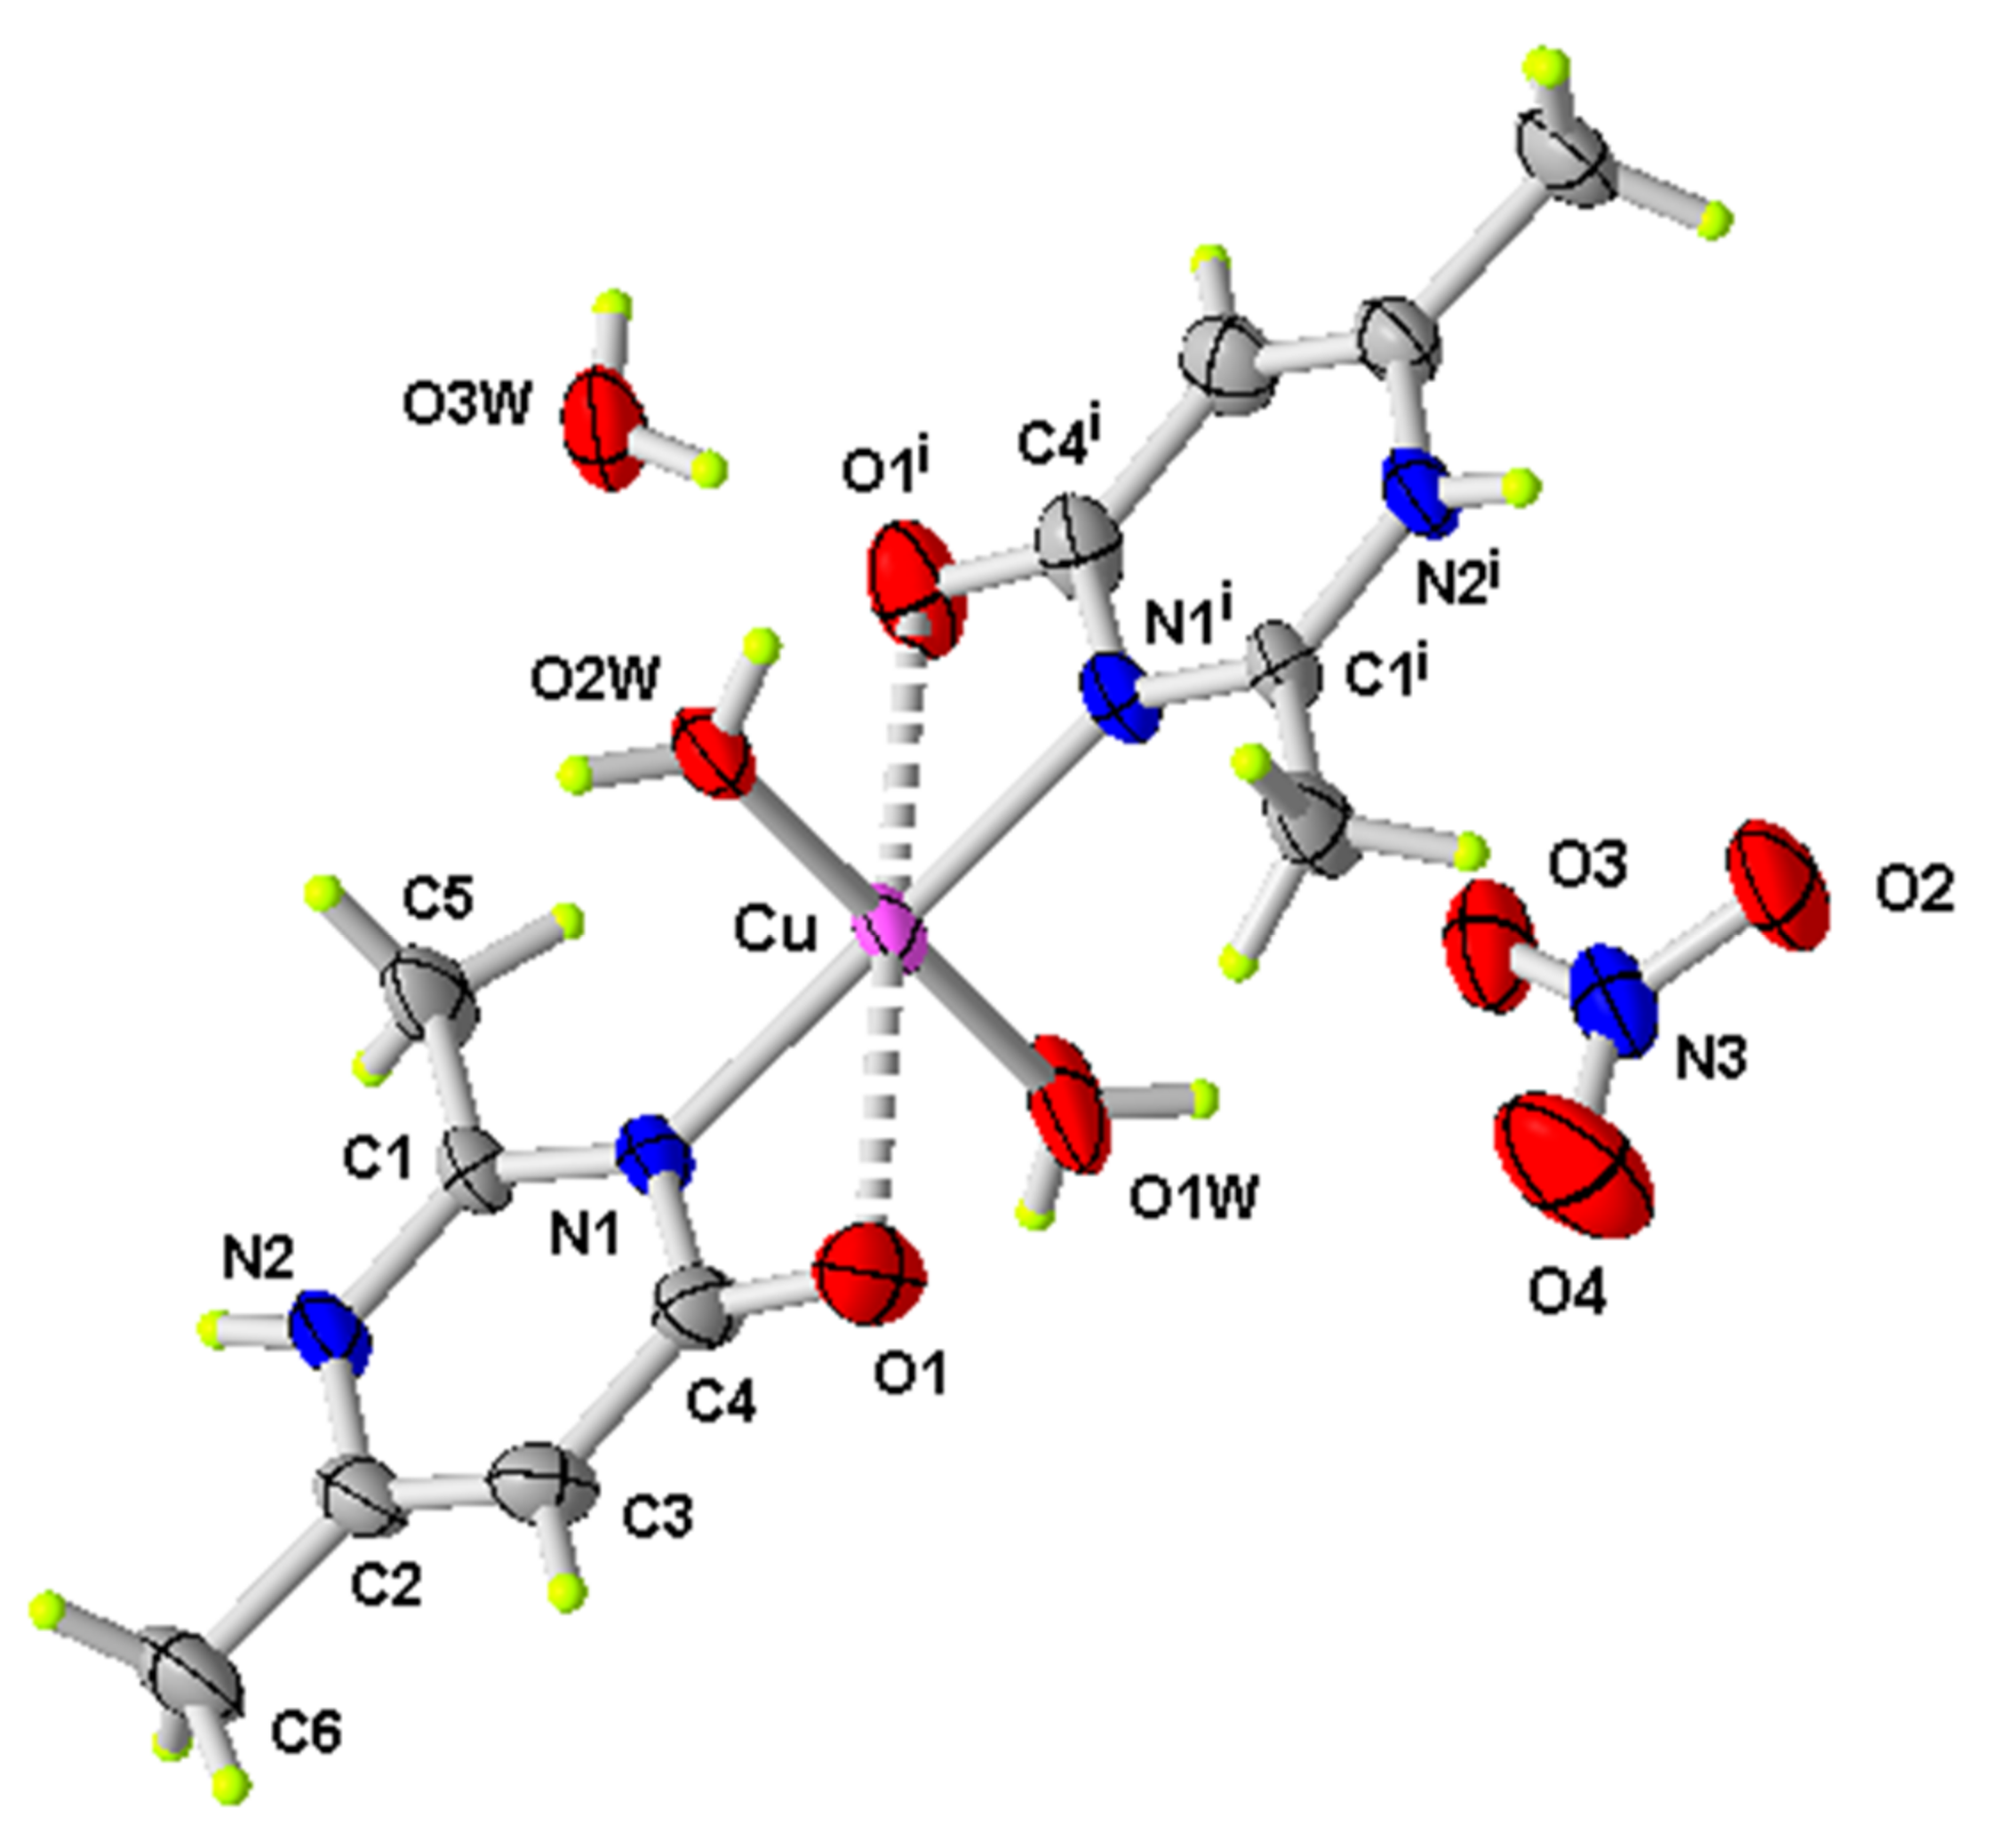
Figure 1.
ORTEP of the structure of (1) with displacement ellipsoids drawn at the 50% probability level (i: −x, y, −z + 1/2).
Figure 1.
ORTEP of the structure of (1) with displacement ellipsoids drawn at the 50% probability level (i: −x, y, −z + 1/2).
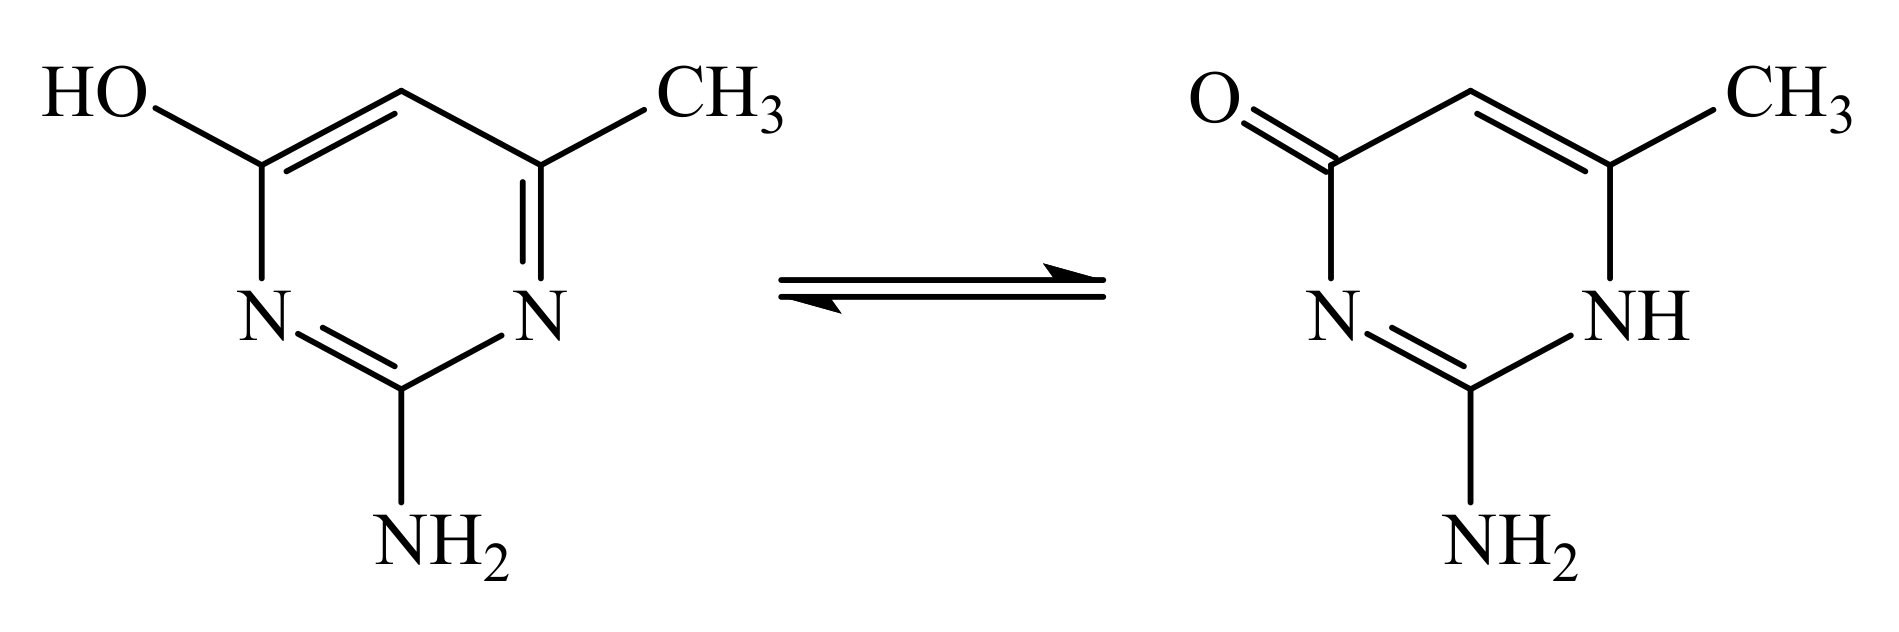
Scheme 1.
Keto-enol equilibrium of the organic ligand.
Scheme 1.
Keto-enol equilibrium of the organic ligand.
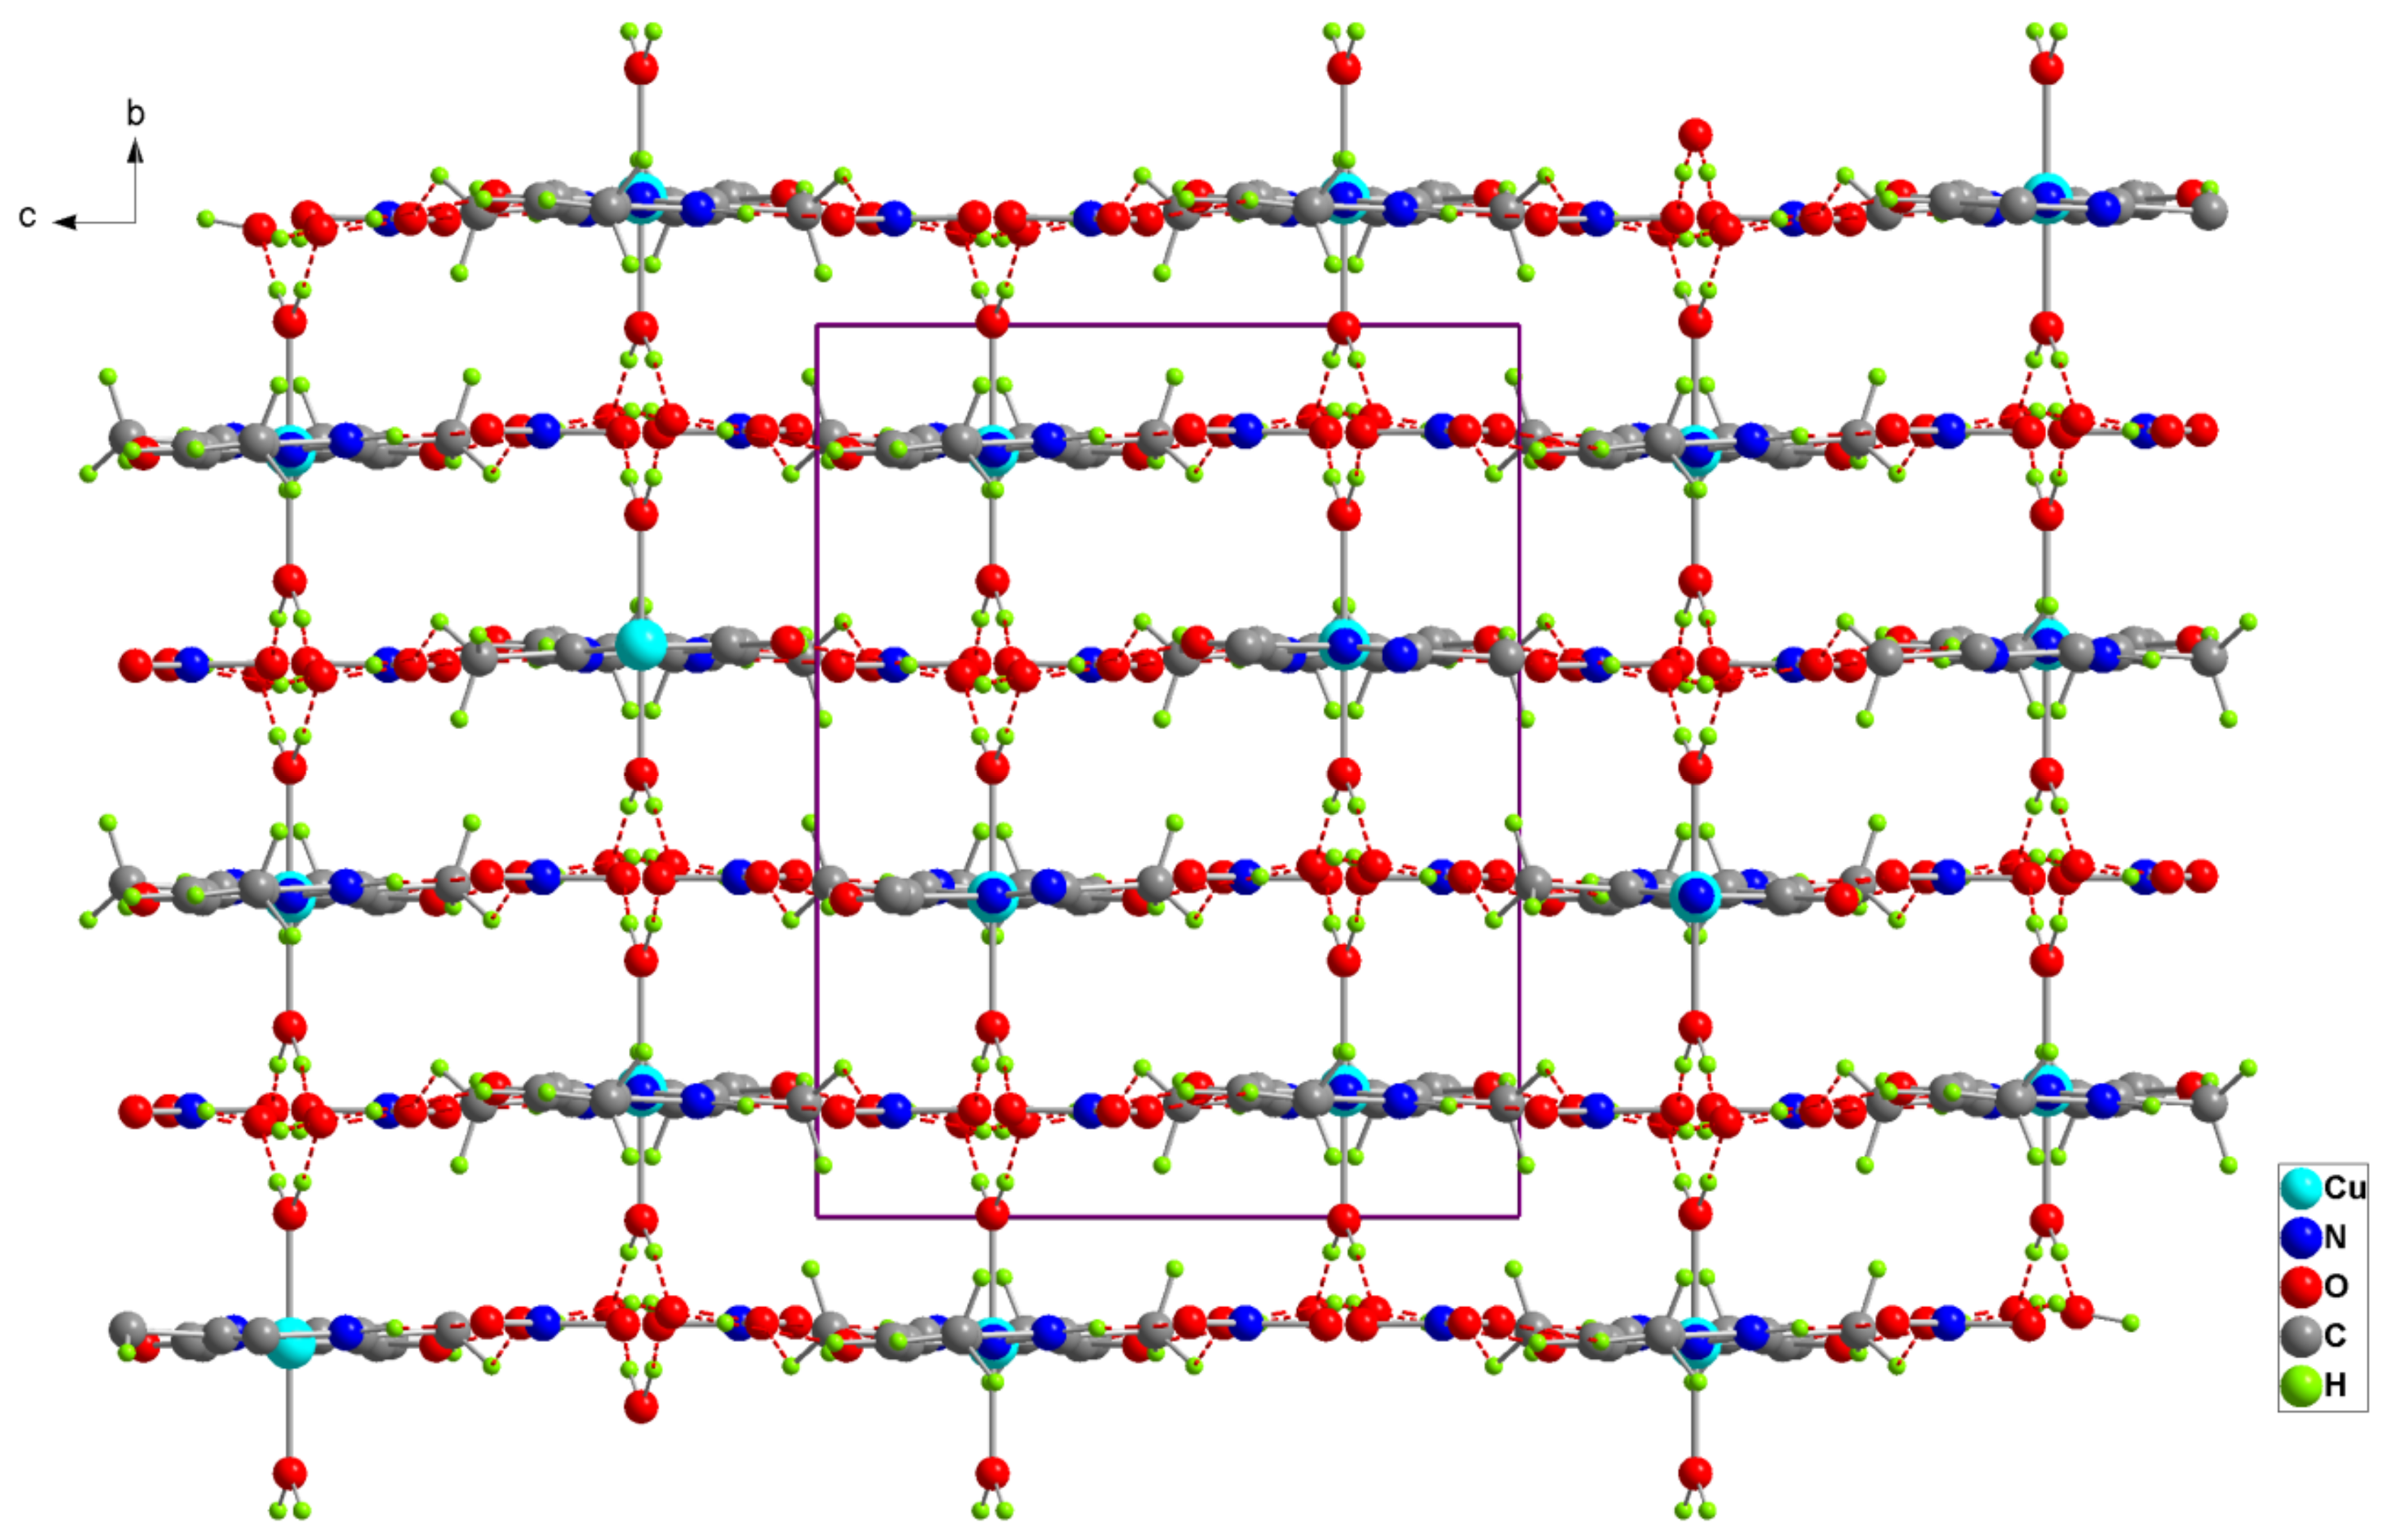
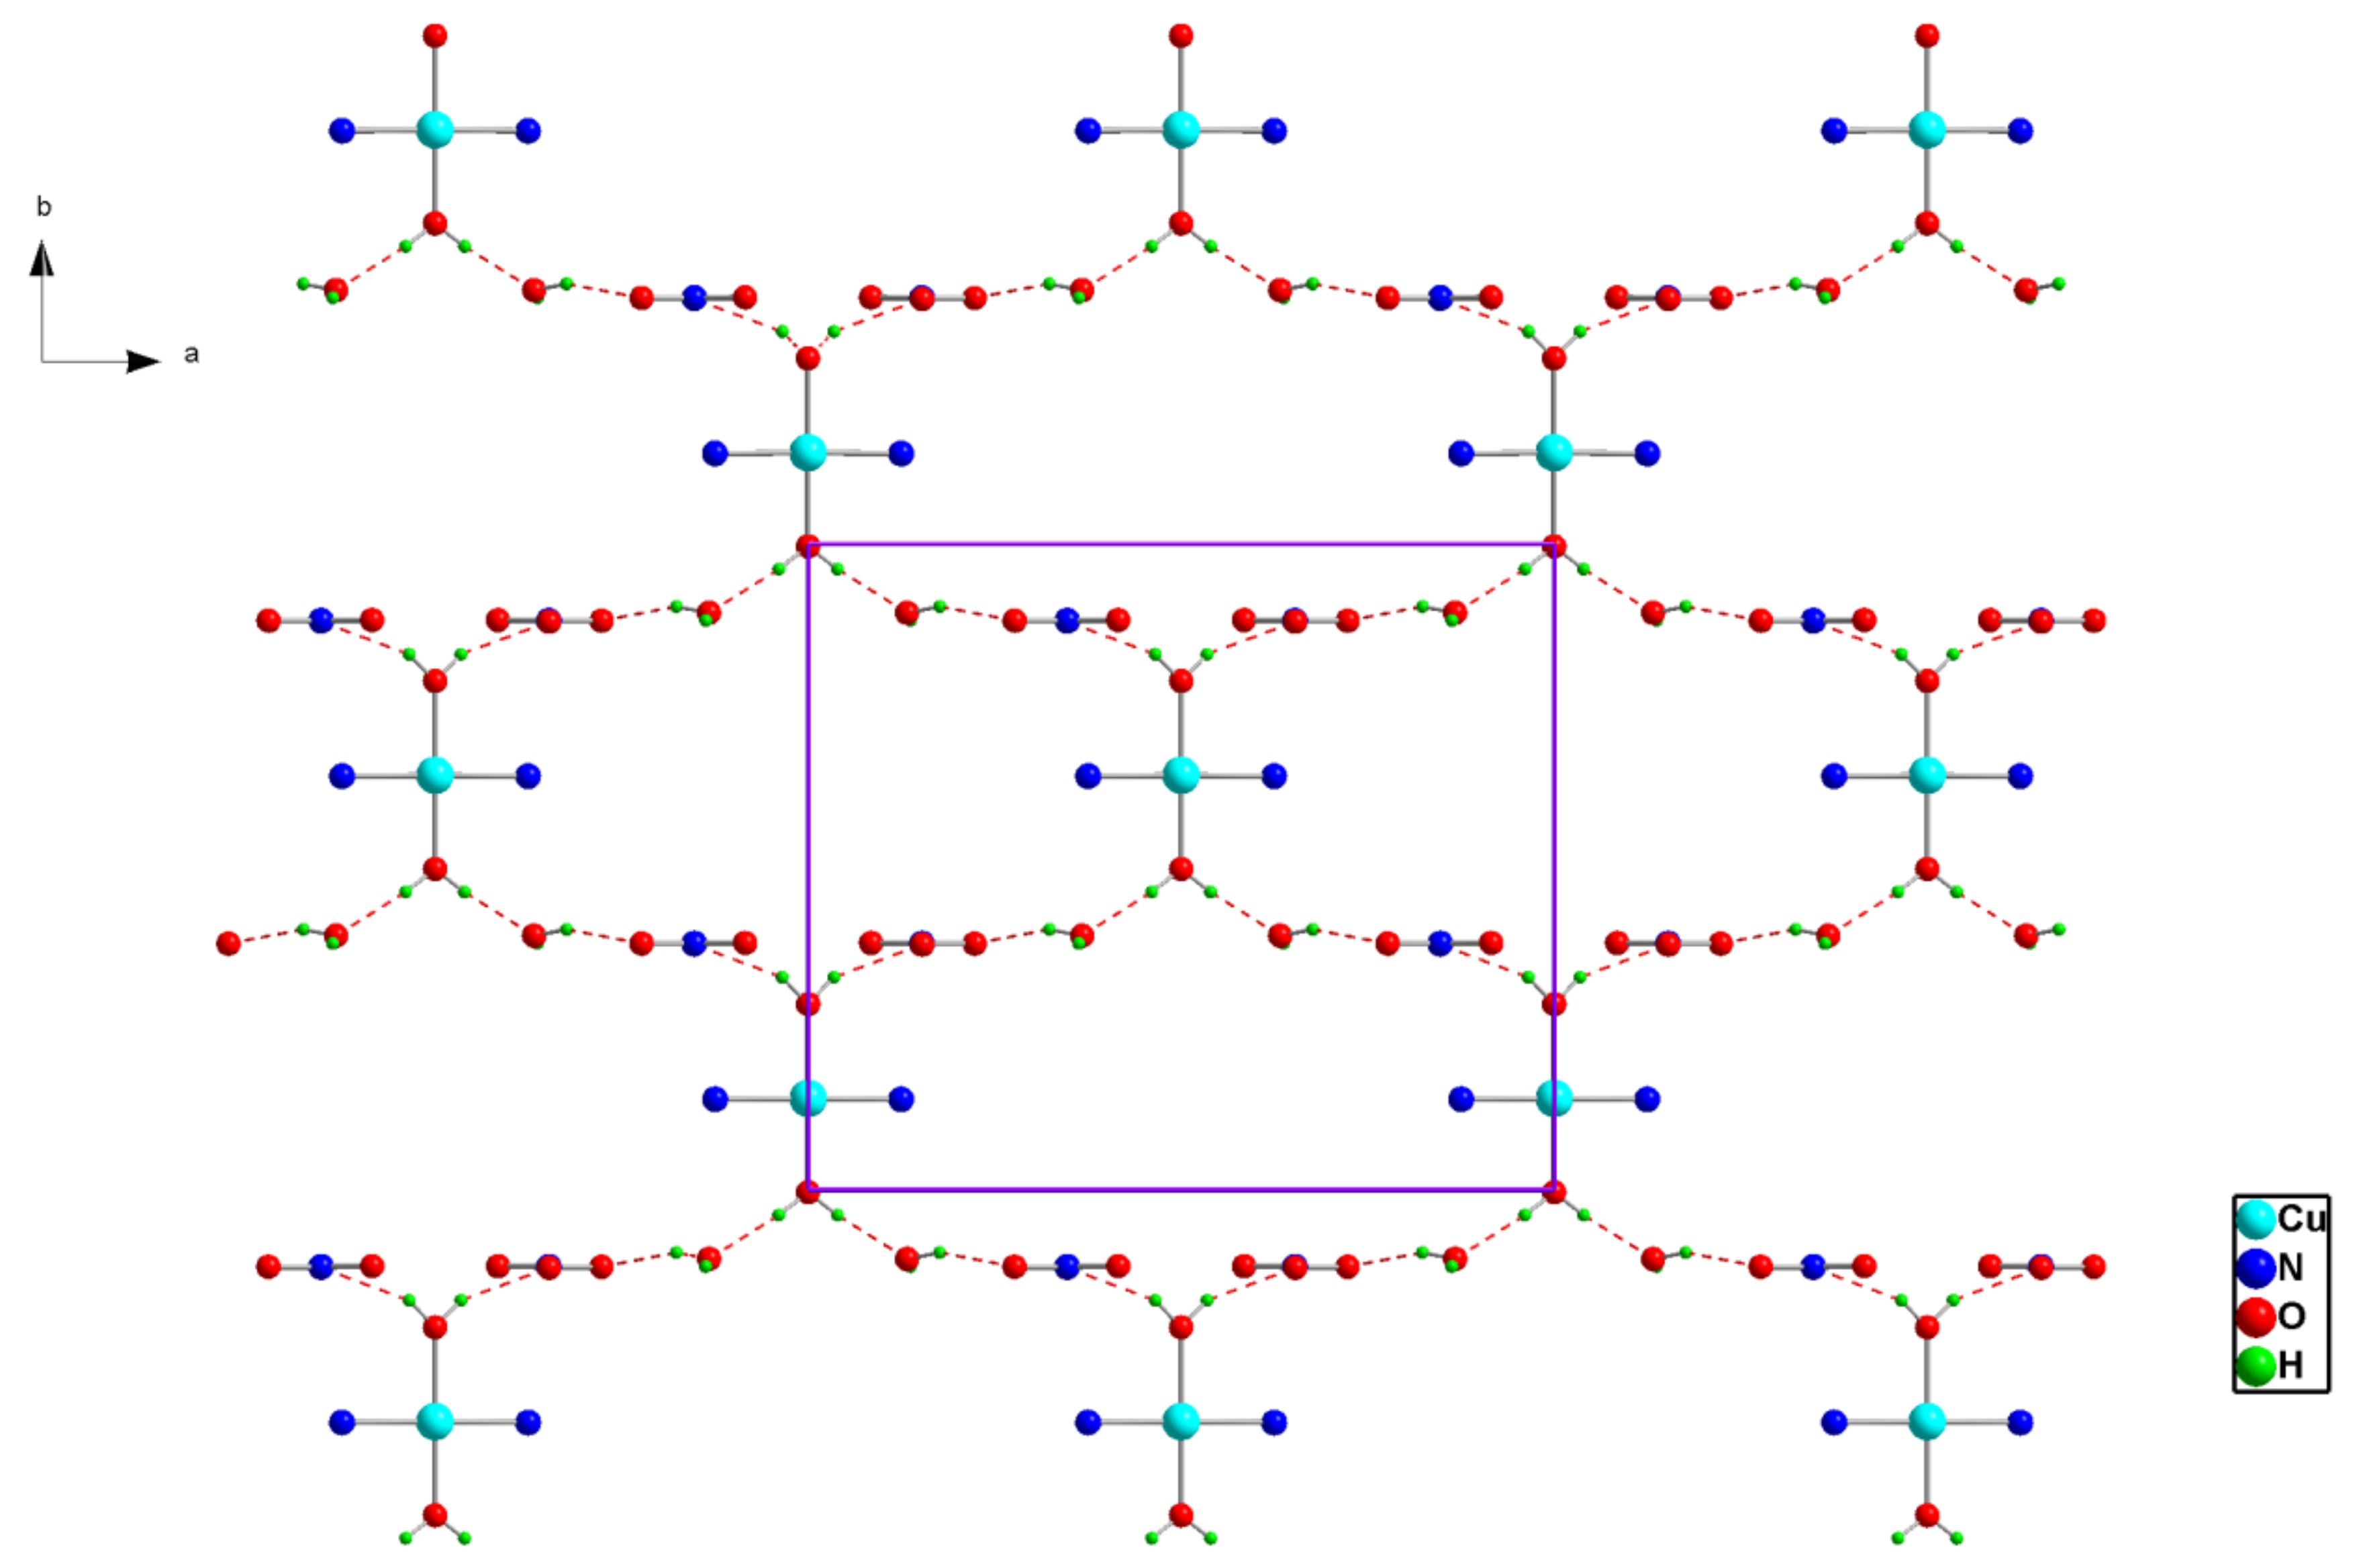
Figure 2.
Projection of an inorganic layer in (1) along the c-axis. Dotted lines indicate hydrogen bonds.
Figure 2.
Projection of an inorganic layer in (1) along the c-axis. Dotted lines indicate hydrogen bonds.
Figure 3.
Projection of the structure of (1) along the a-axis. Dotted lines indicate hydrogen bonds.
Figure 3.
Projection of the structure of (1) along the a-axis. Dotted lines indicate hydrogen bonds.
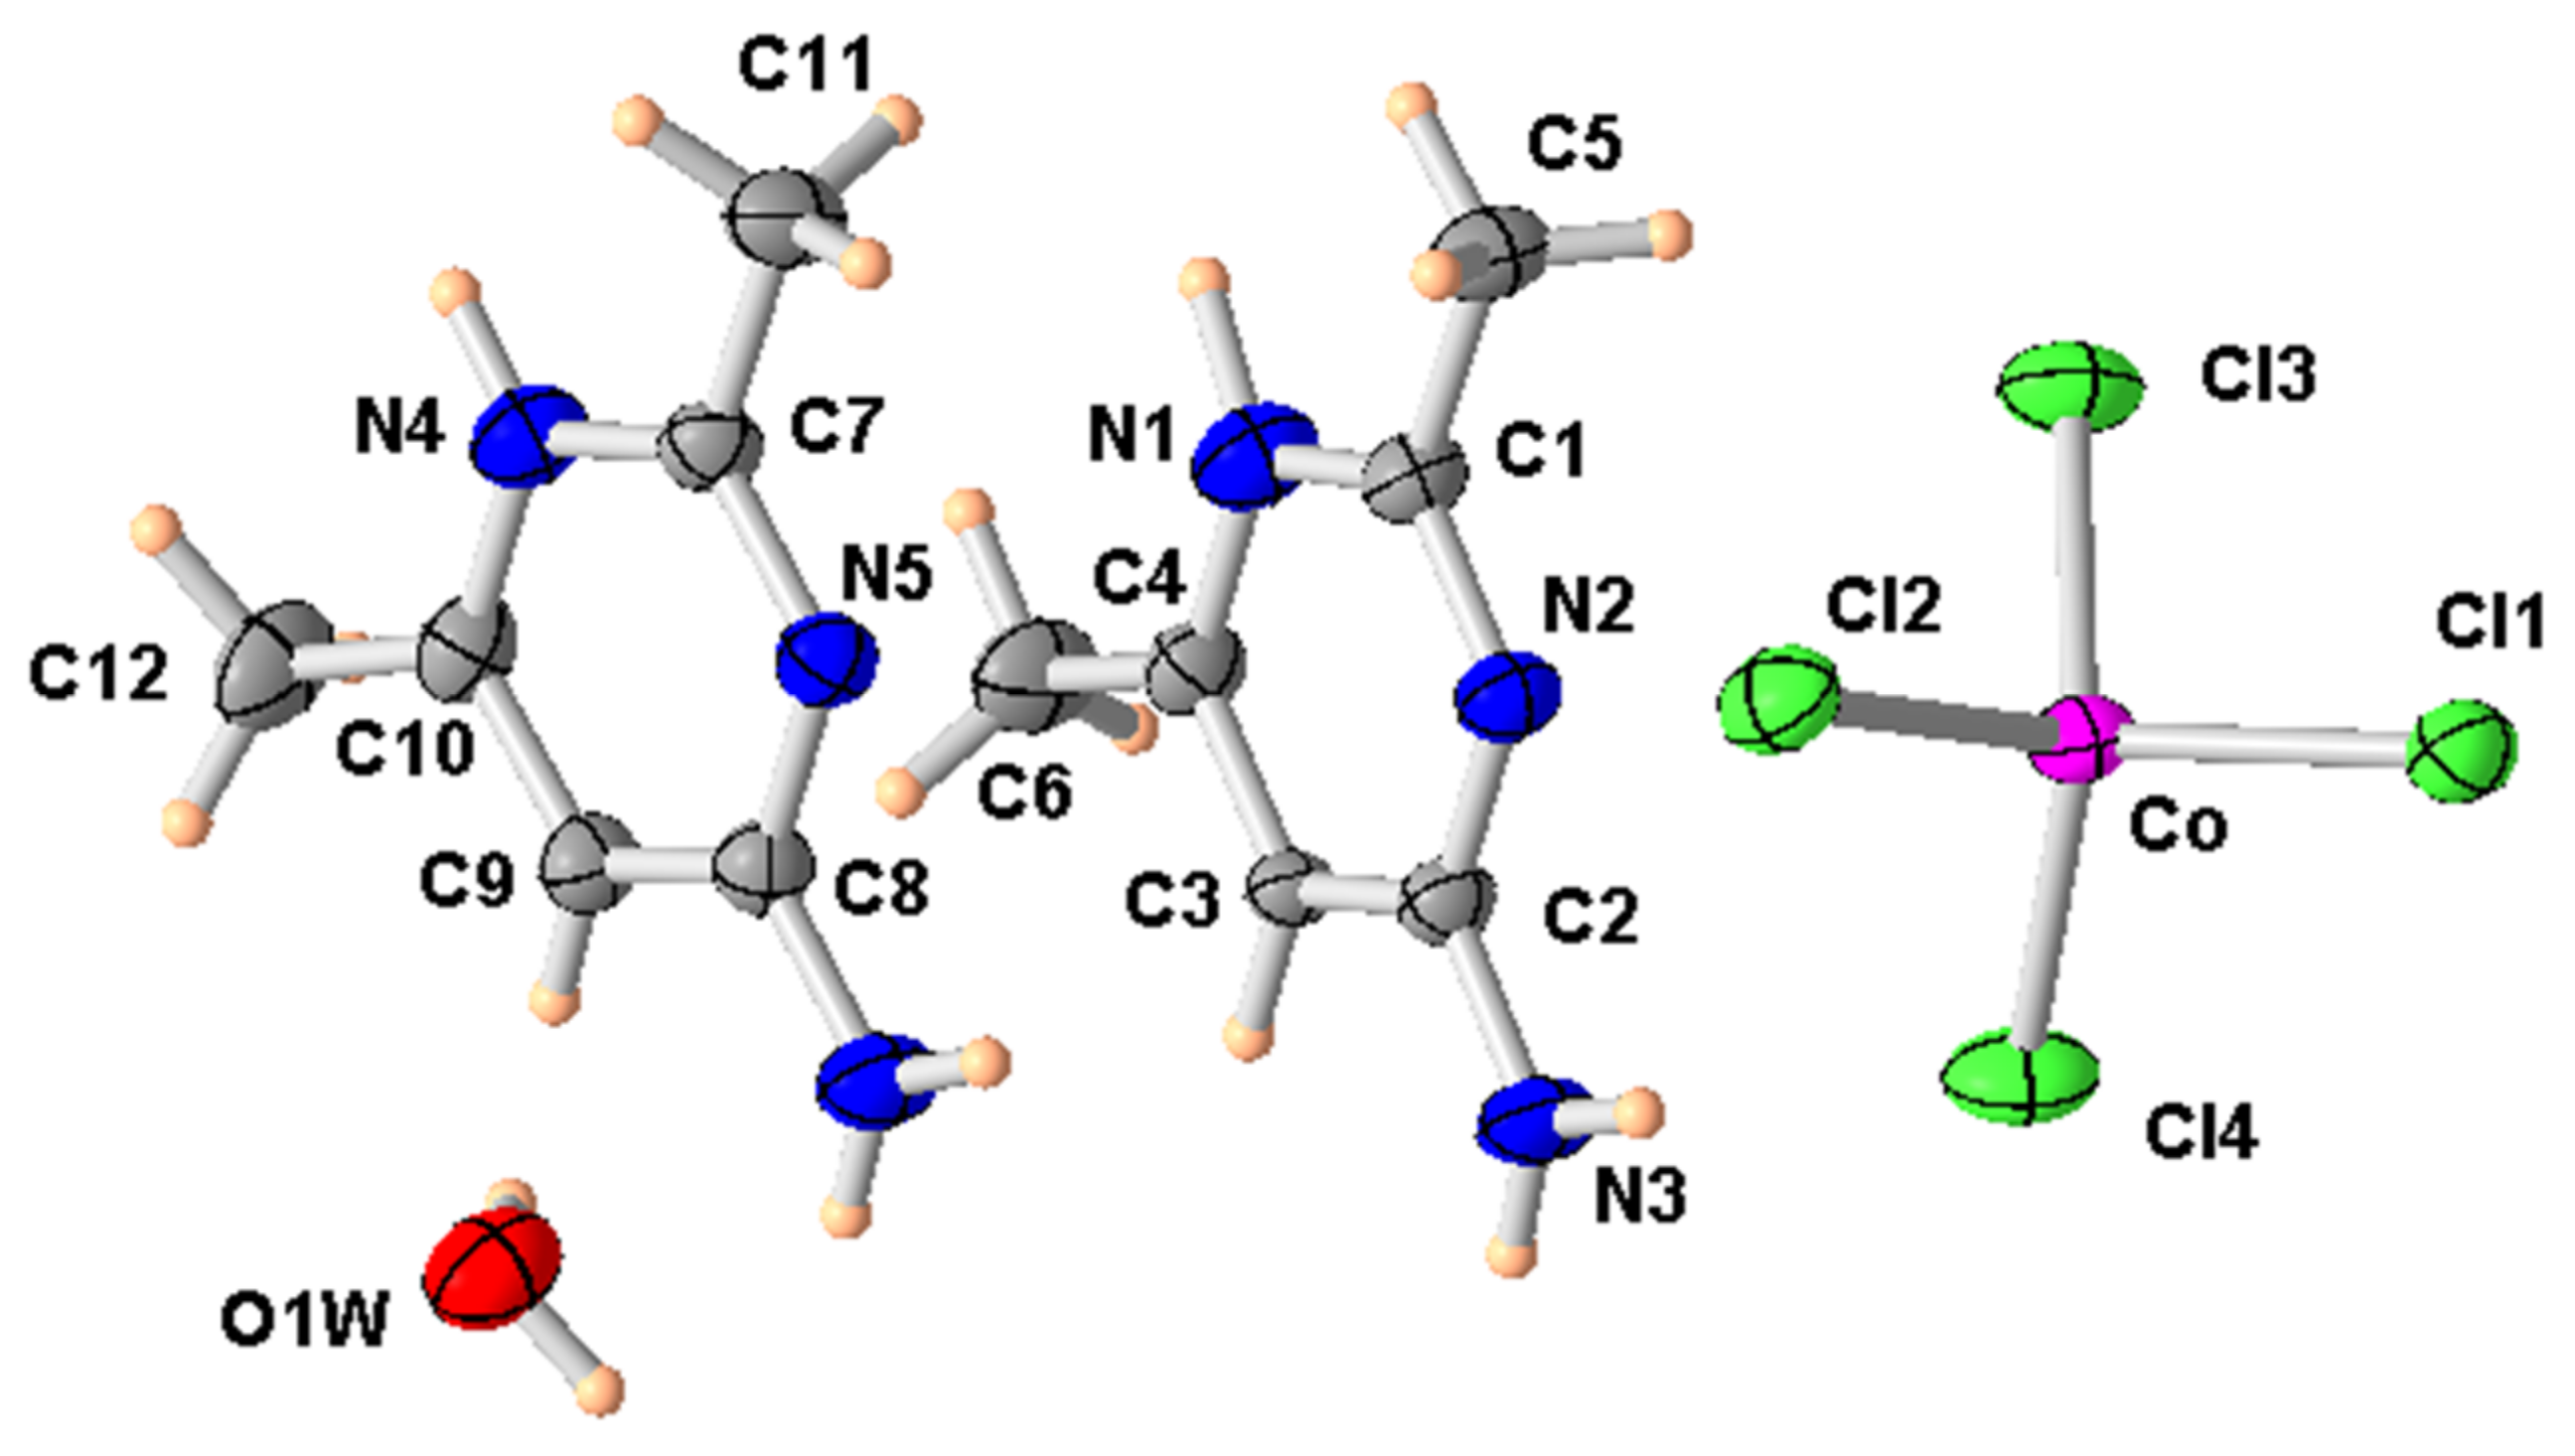
Figure 4.
ORTEP of the structure of (2) with displacement ellipsoids drawn at the 50% probability level.
Figure 4.
ORTEP of the structure of (2) with displacement ellipsoids drawn at the 50% probability level.
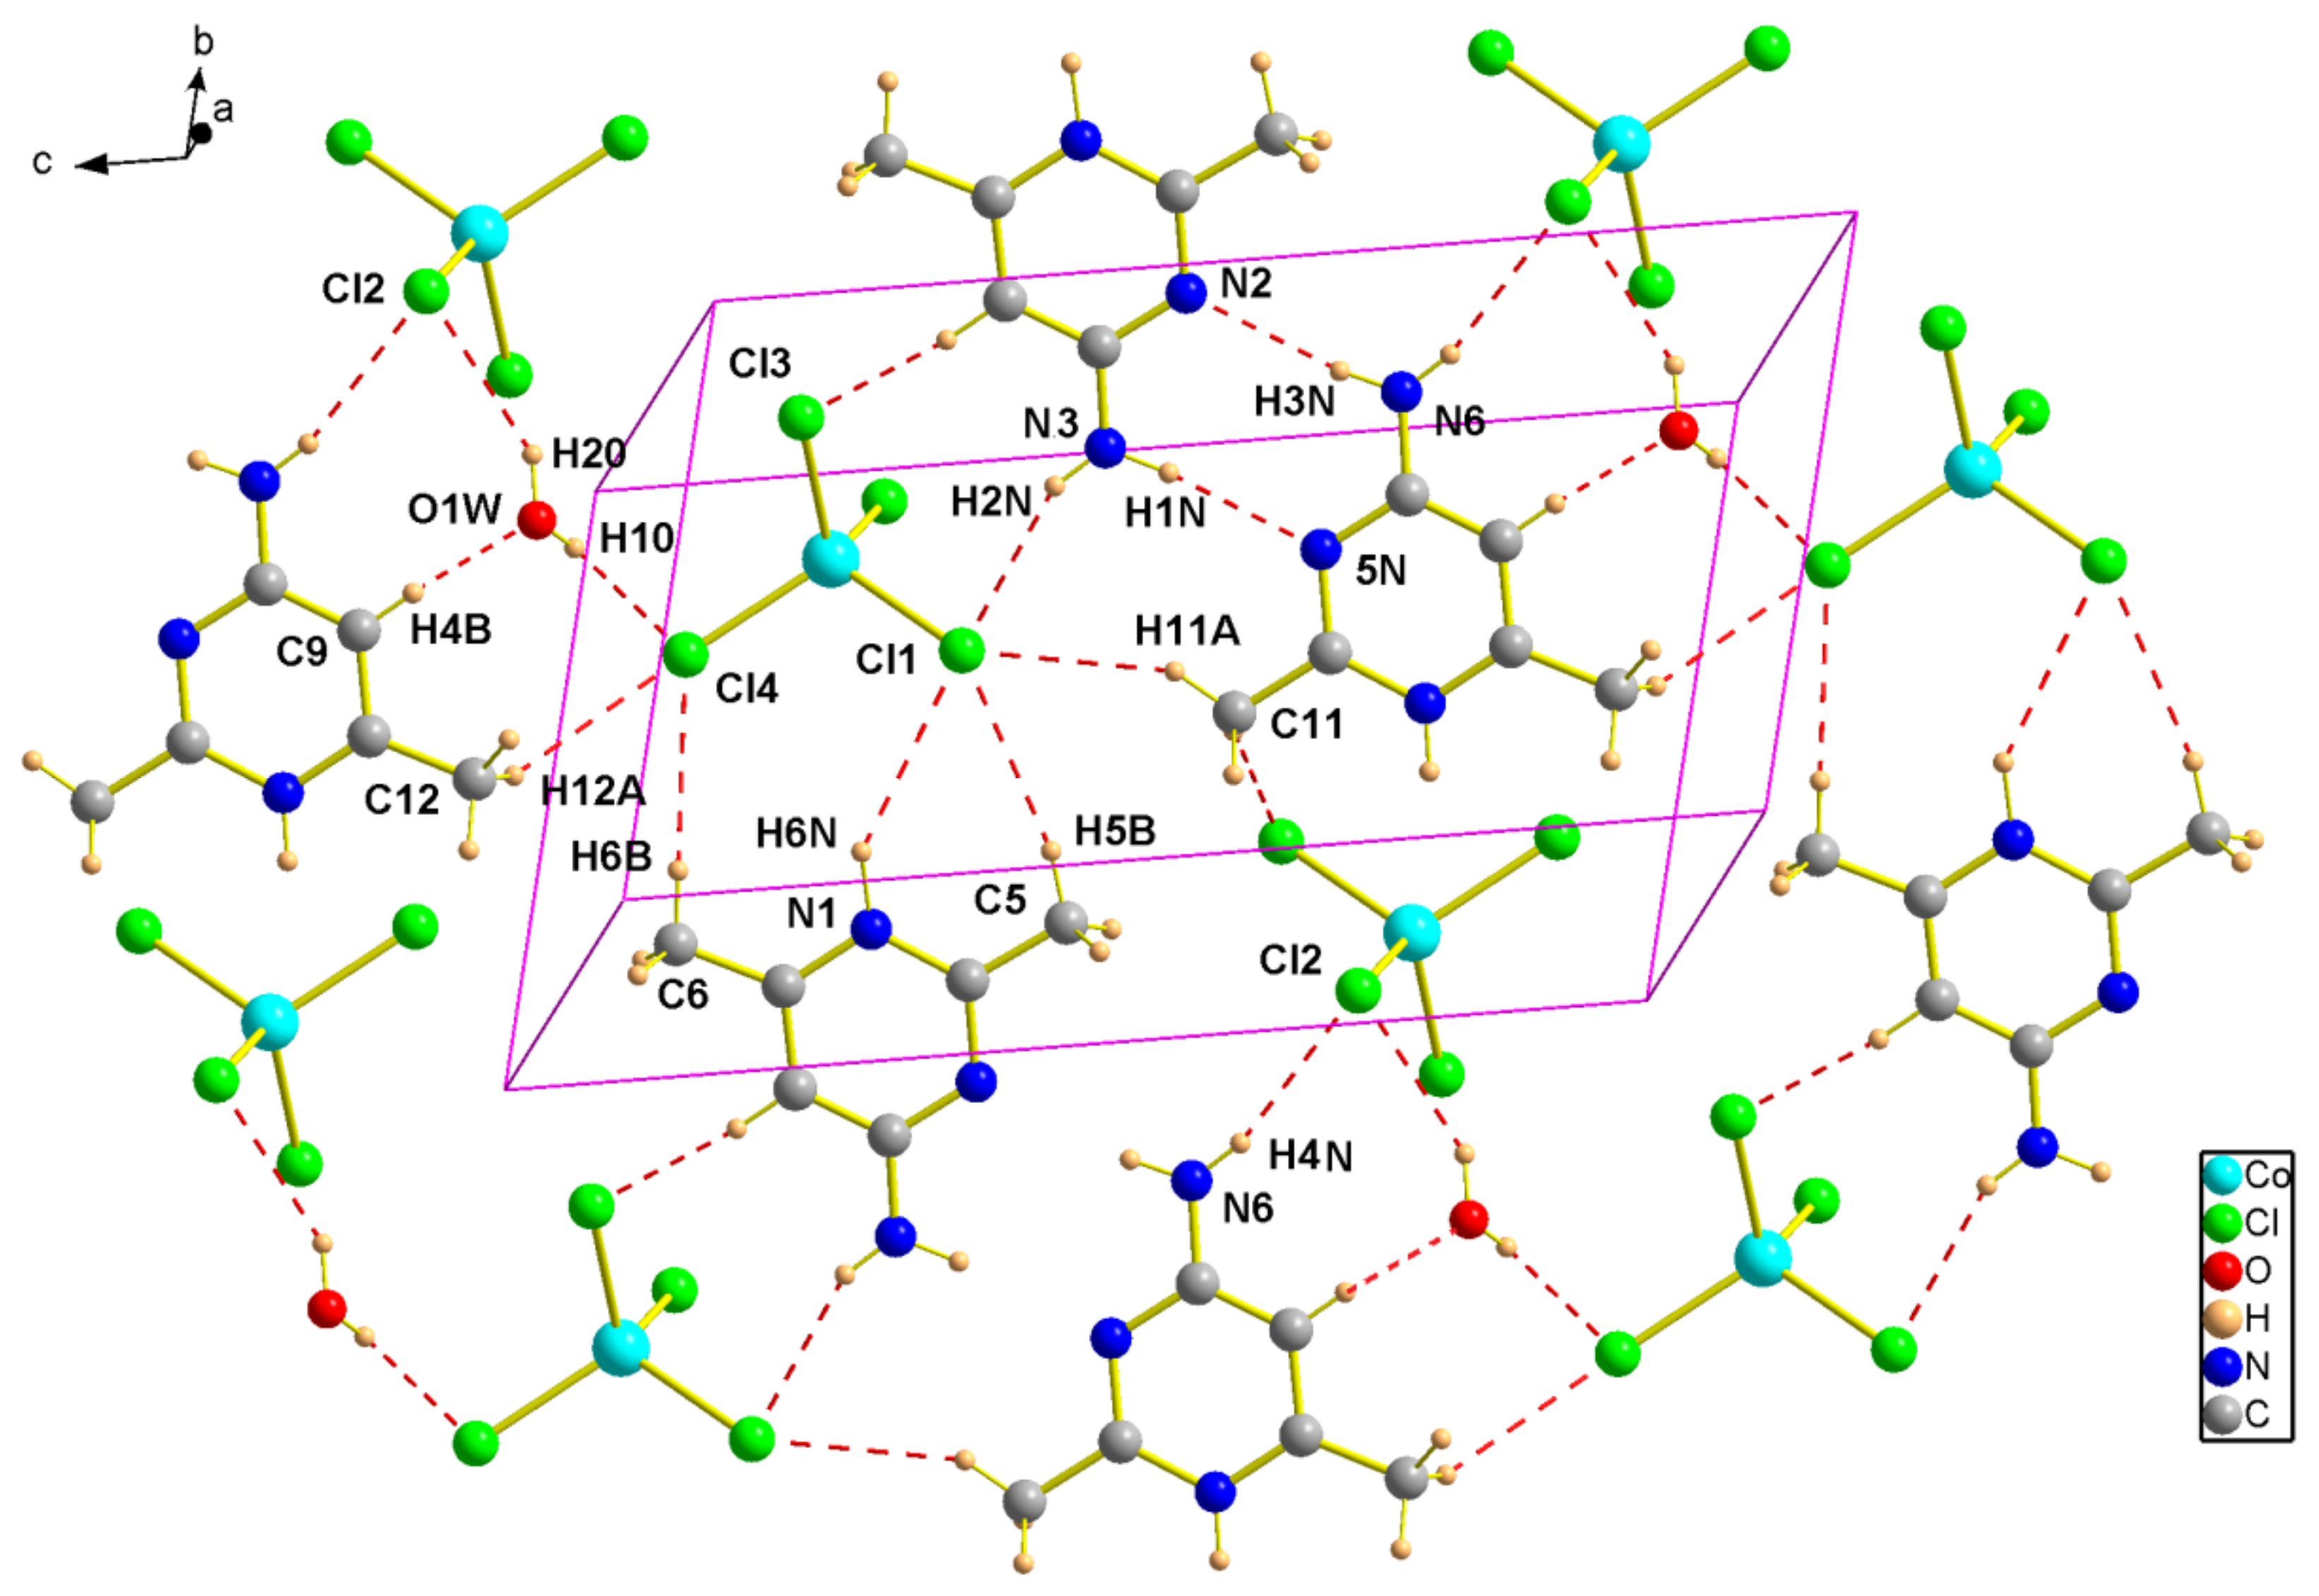
Figure 5.
Representation of hydrogen bonds in the structure of (2).
Figure 5.
Representation of hydrogen bonds in the structure of (2).
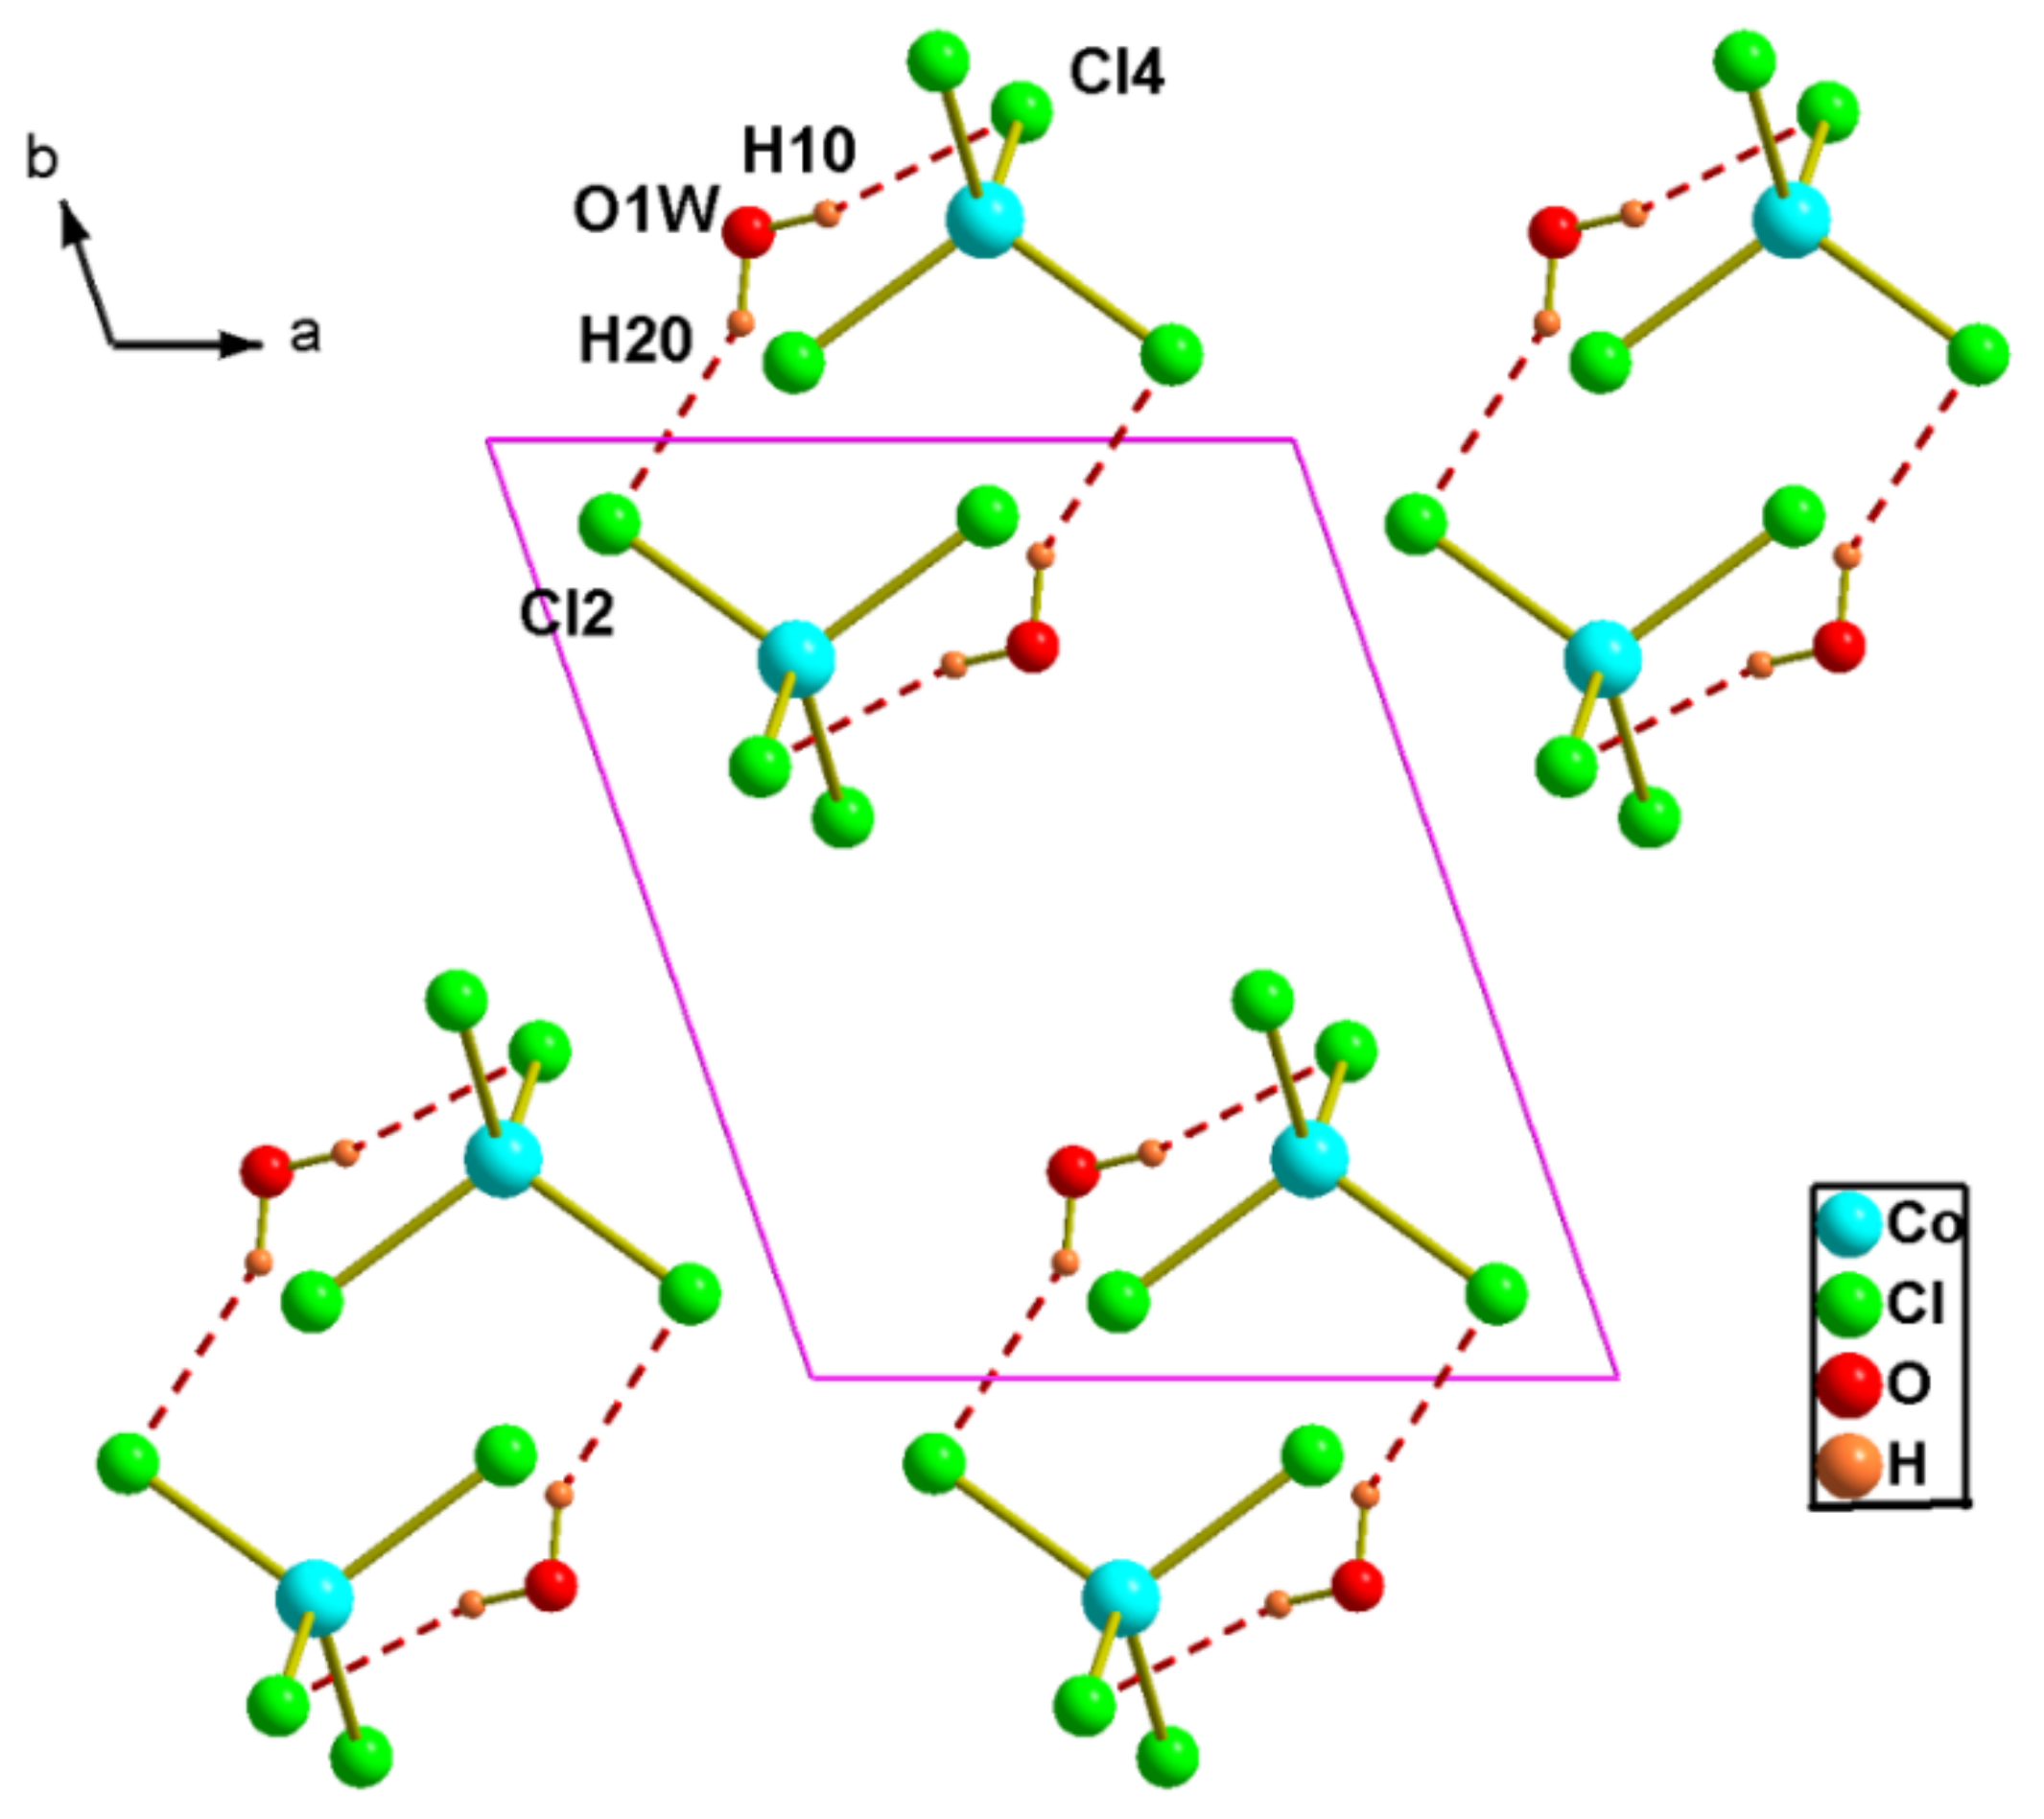
Figure 6.
Projection of an inorganic layer in (2) along the c-axis direction. Dotted lines indicate hydrogen bonds.
Figure 6.
Projection of an inorganic layer in (2) along the c-axis direction. Dotted lines indicate hydrogen bonds.
Figure 7.
View of the dnorm mapped on the Hirshfeld surface of compound (1) (the red spots represents intermolecular contacts between atoms). (a) around the complex ion, (b) around the nitrate anion and (c) around the water molecule.
Figure 7.
View of the dnorm mapped on the Hirshfeld surface of compound (1) (the red spots represents intermolecular contacts between atoms). (a) around the complex ion, (b) around the nitrate anion and (c) around the water molecule.
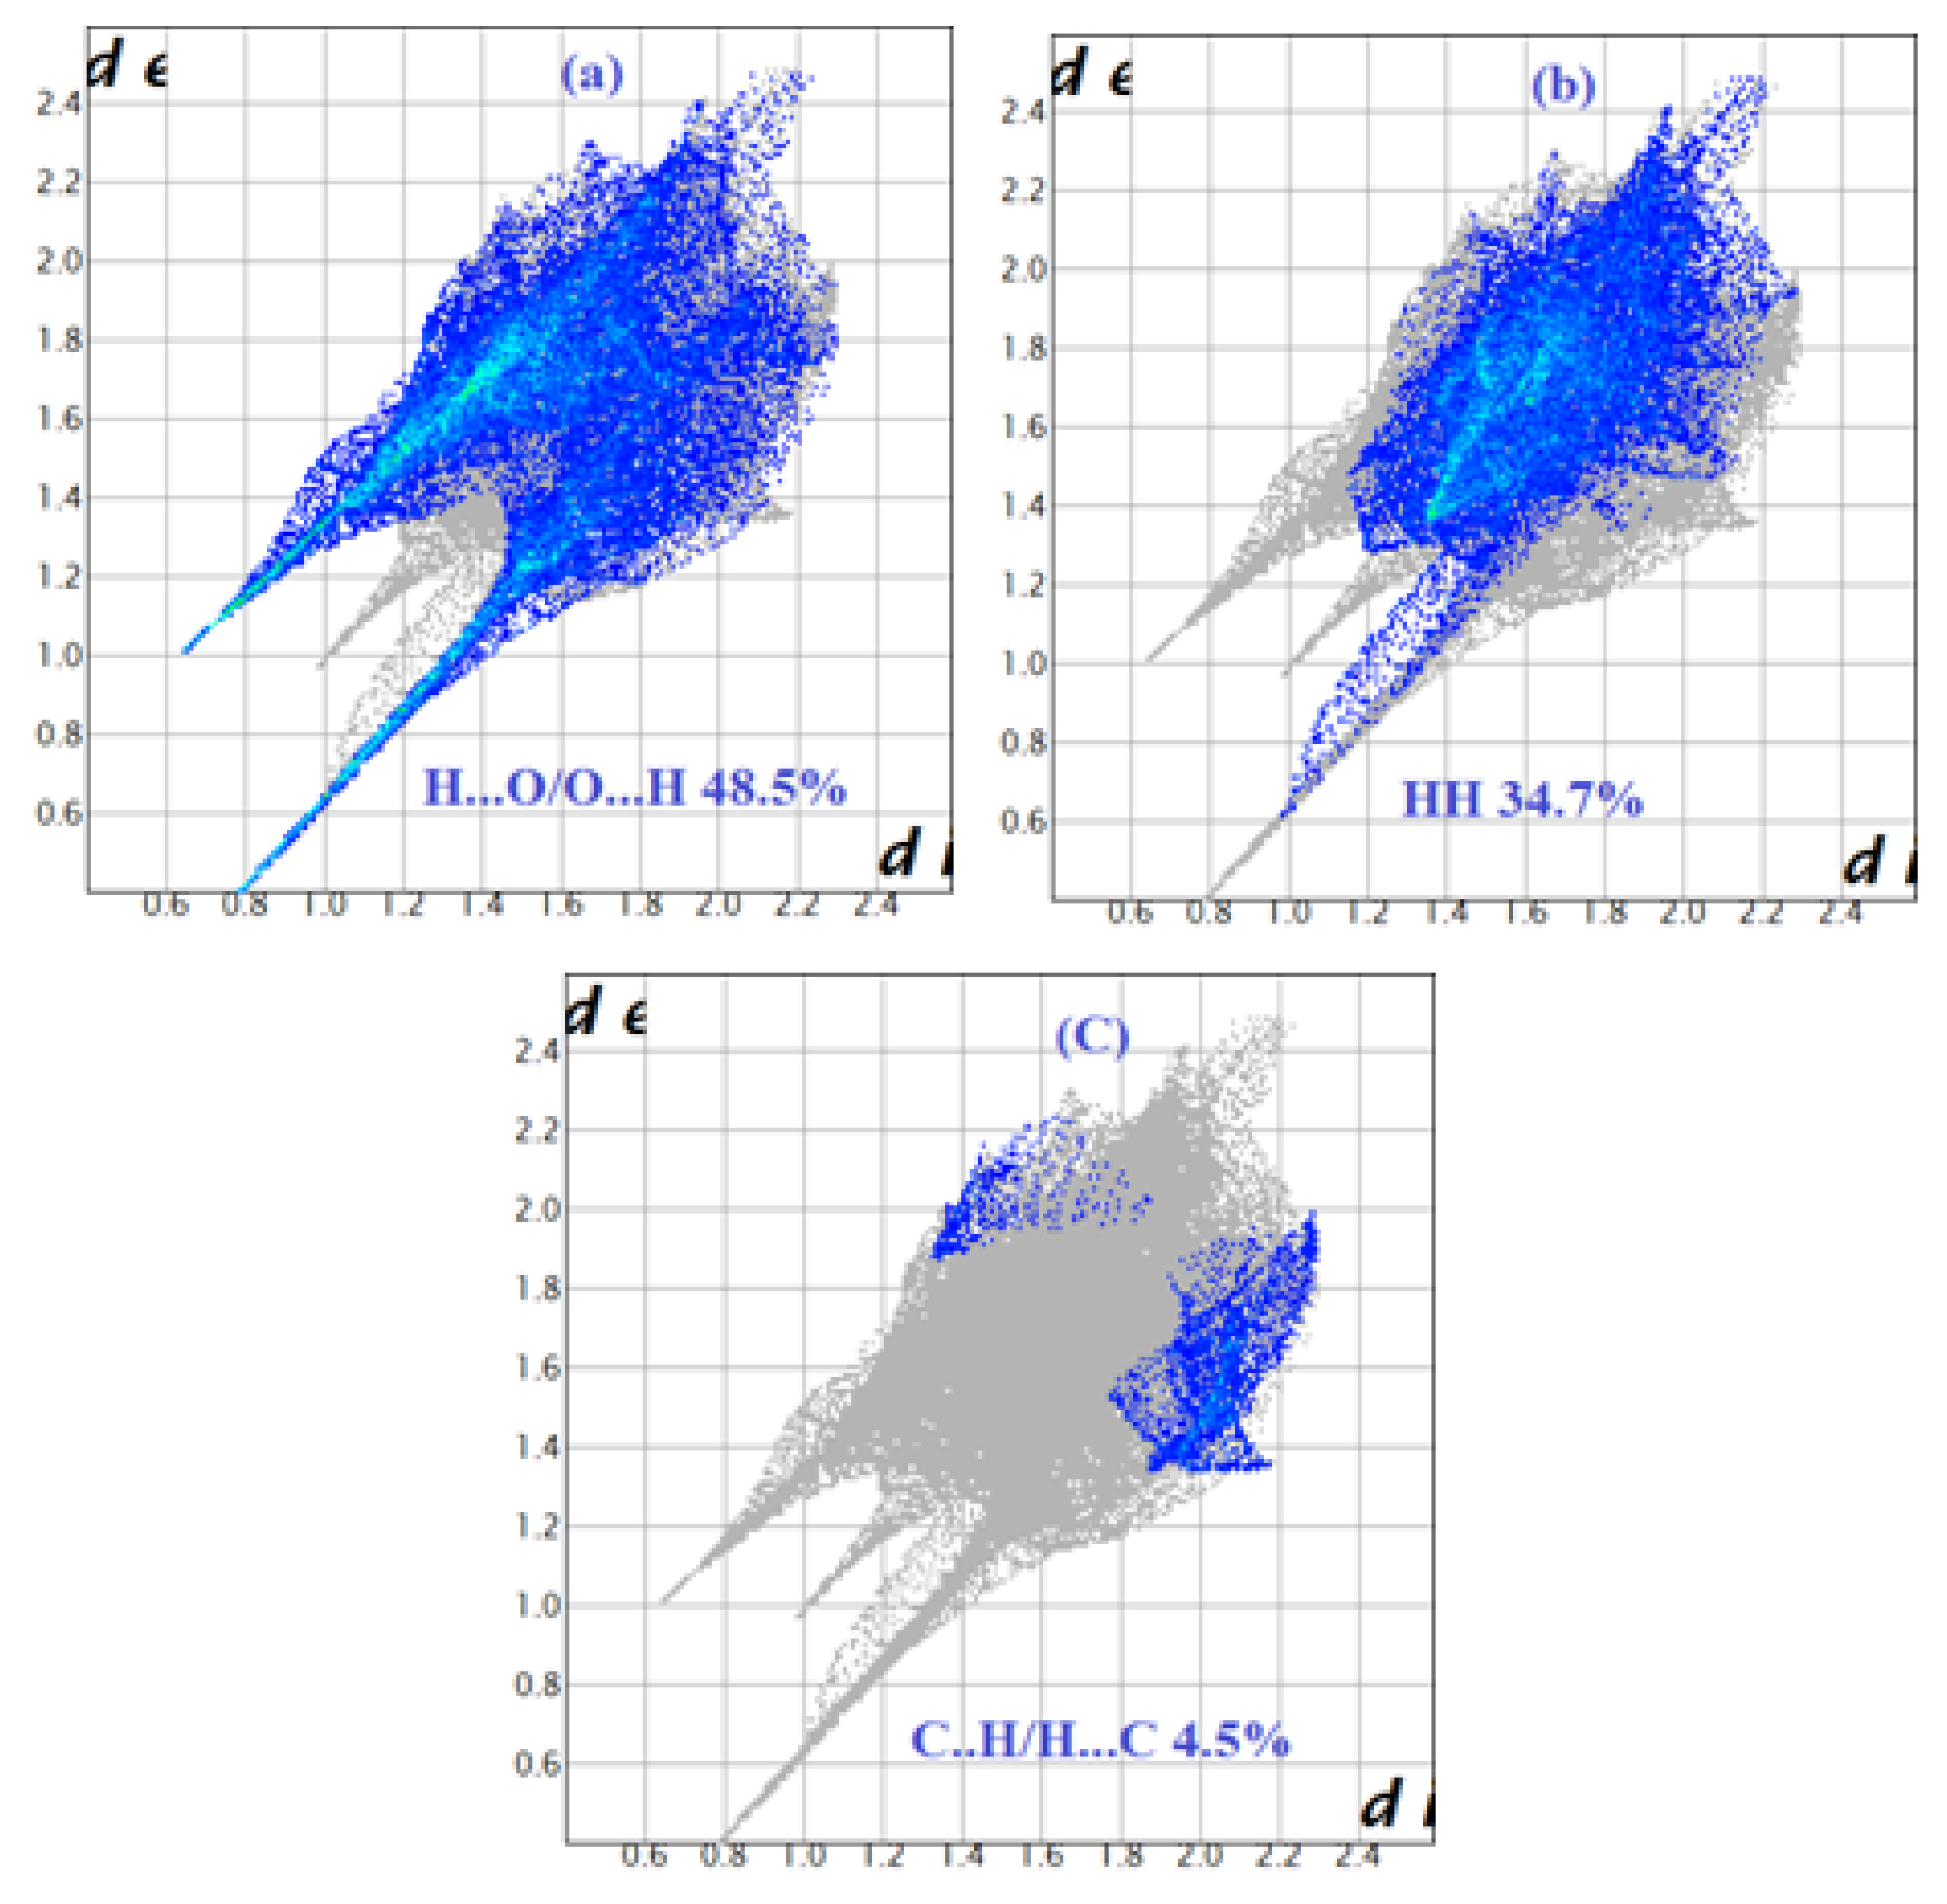
Figure 8.
Decomposed fingerprint plots of the major contacts around Cu(dimpyr)2(H2O)2. (a–c) represent H…O, H…H and C…H contacts, respectively.
Figure 8.
Decomposed fingerprint plots of the major contacts around Cu(dimpyr)2(H2O)2. (a–c) represent H…O, H…H and C…H contacts, respectively.
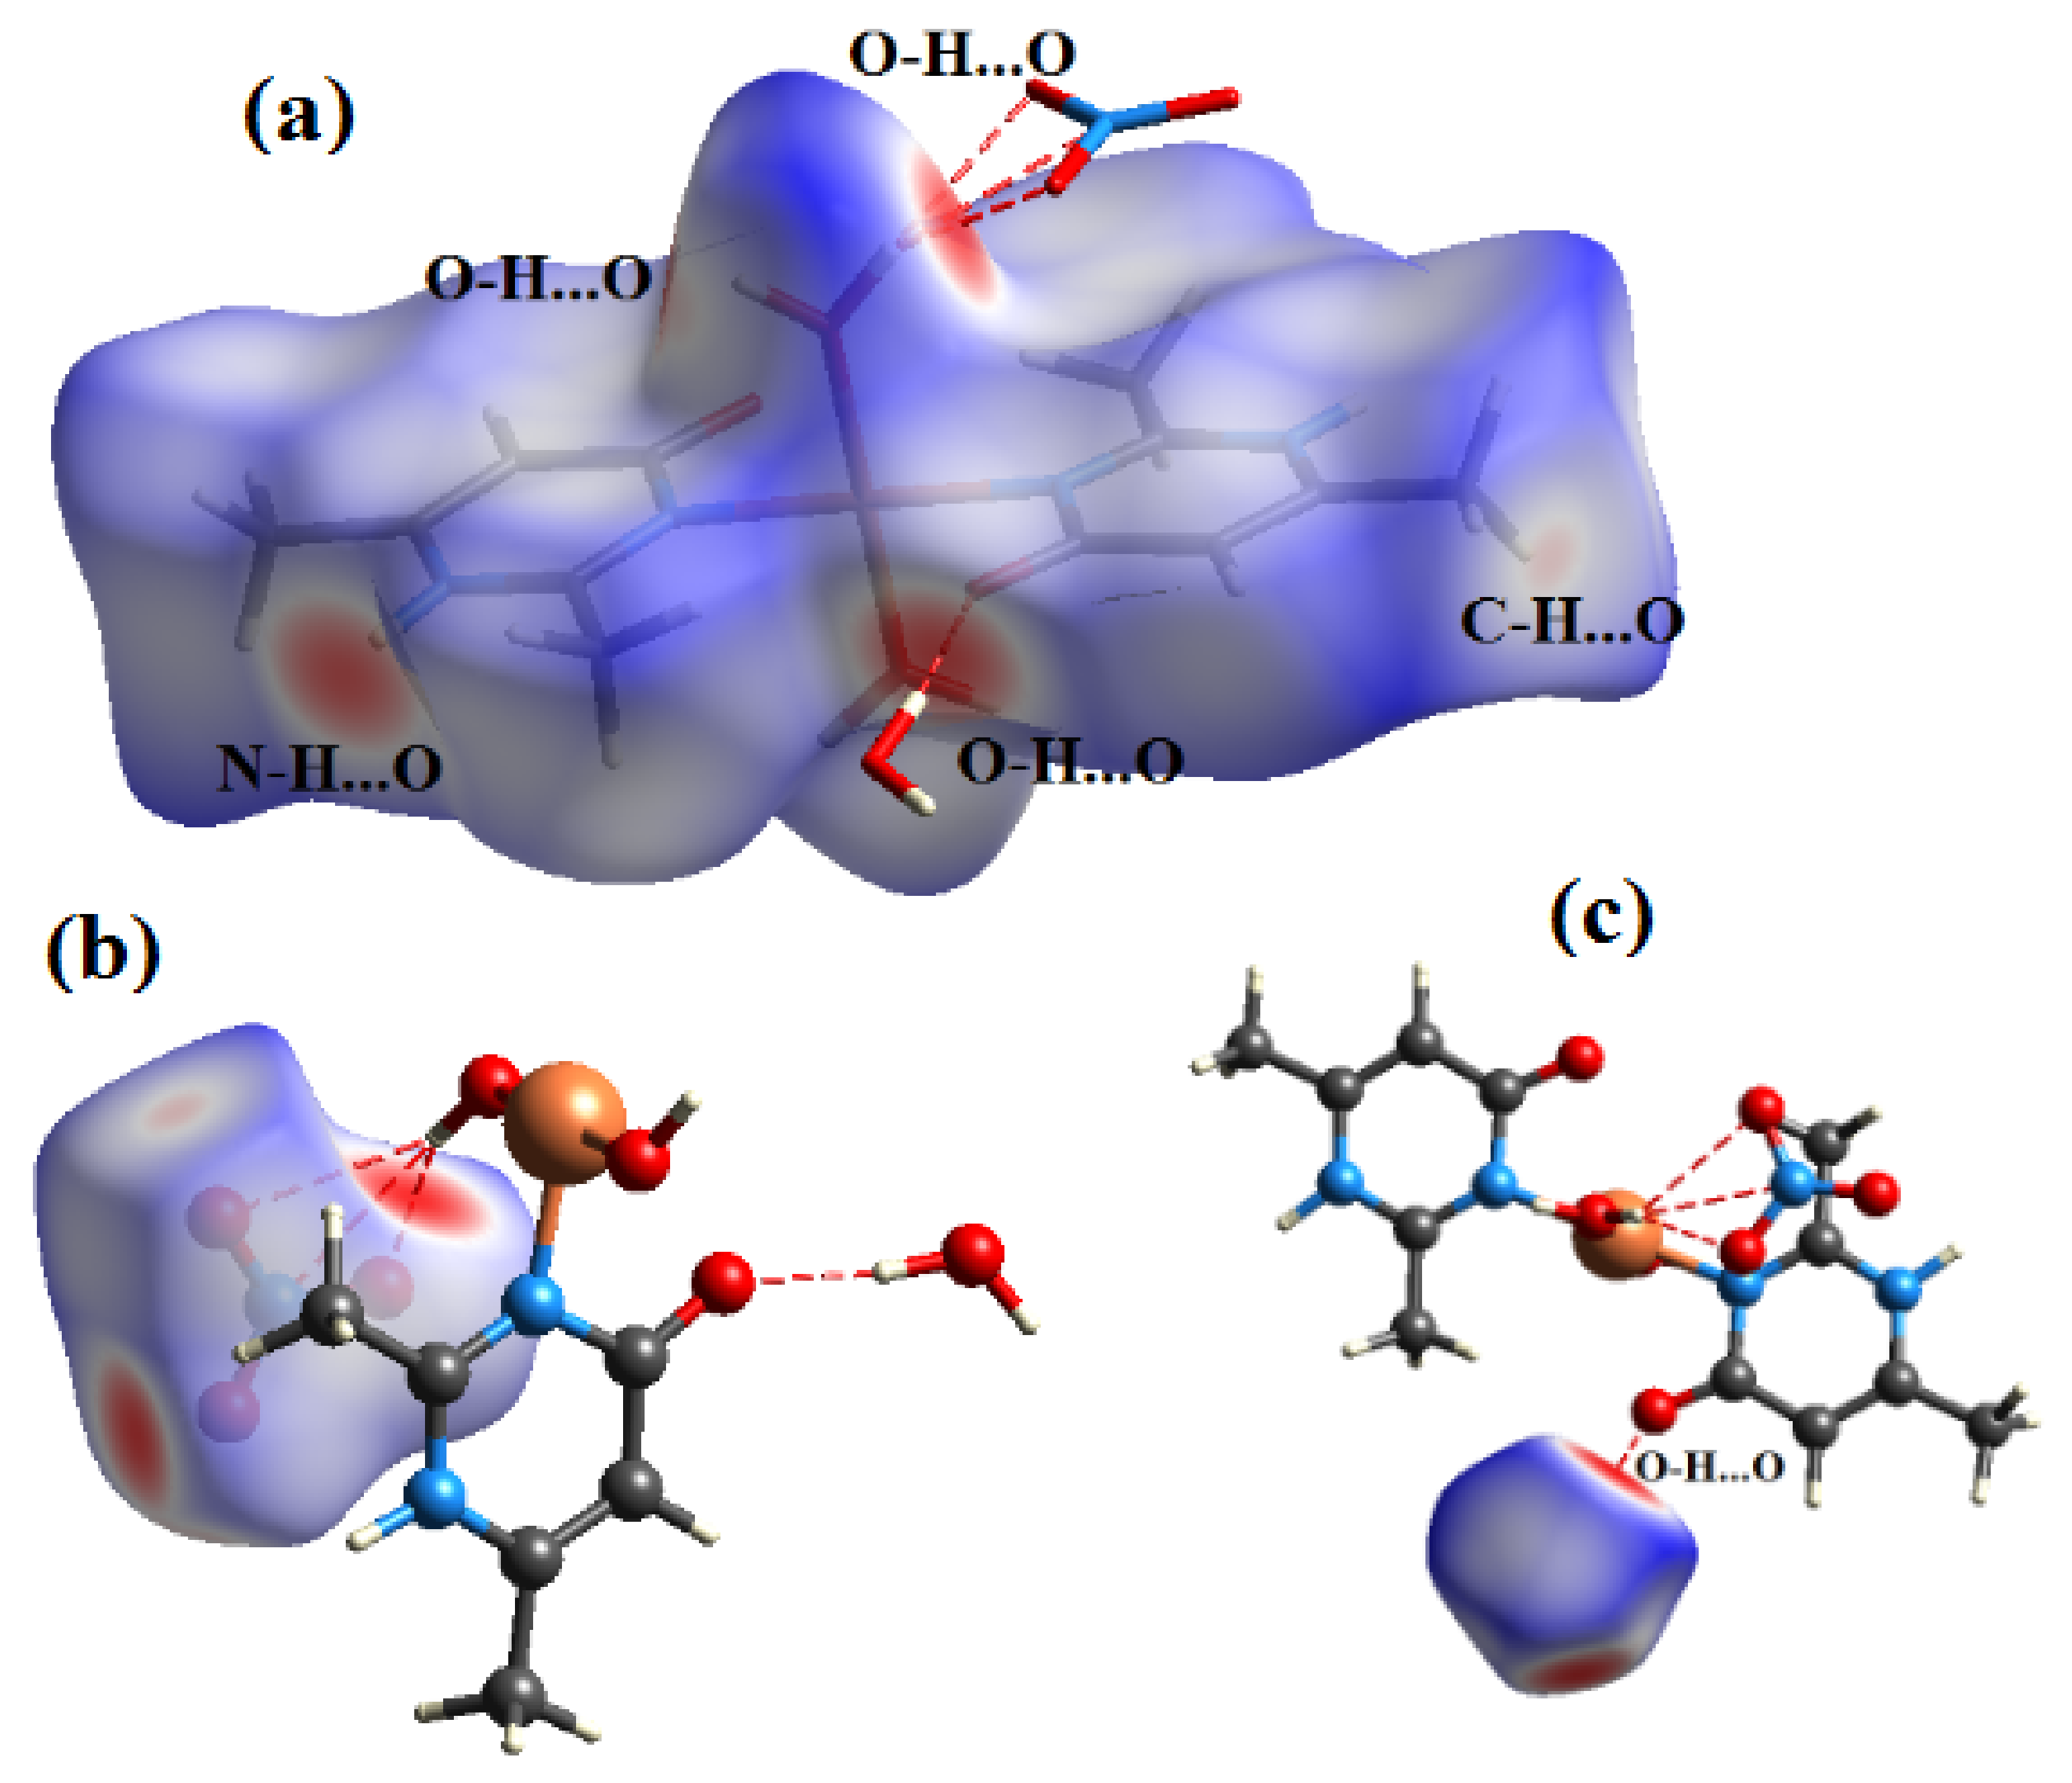
Figure 9.
View of the dnorm mapped on the Hirshfeld surface of compound (2) (the red spots represents intermolecular contacts between atoms). (a) around the organic cation, (b) around the complex anion and (c) around the water molecule.
Figure 9.
View of the dnorm mapped on the Hirshfeld surface of compound (2) (the red spots represents intermolecular contacts between atoms). (a) around the organic cation, (b) around the complex anion and (c) around the water molecule.
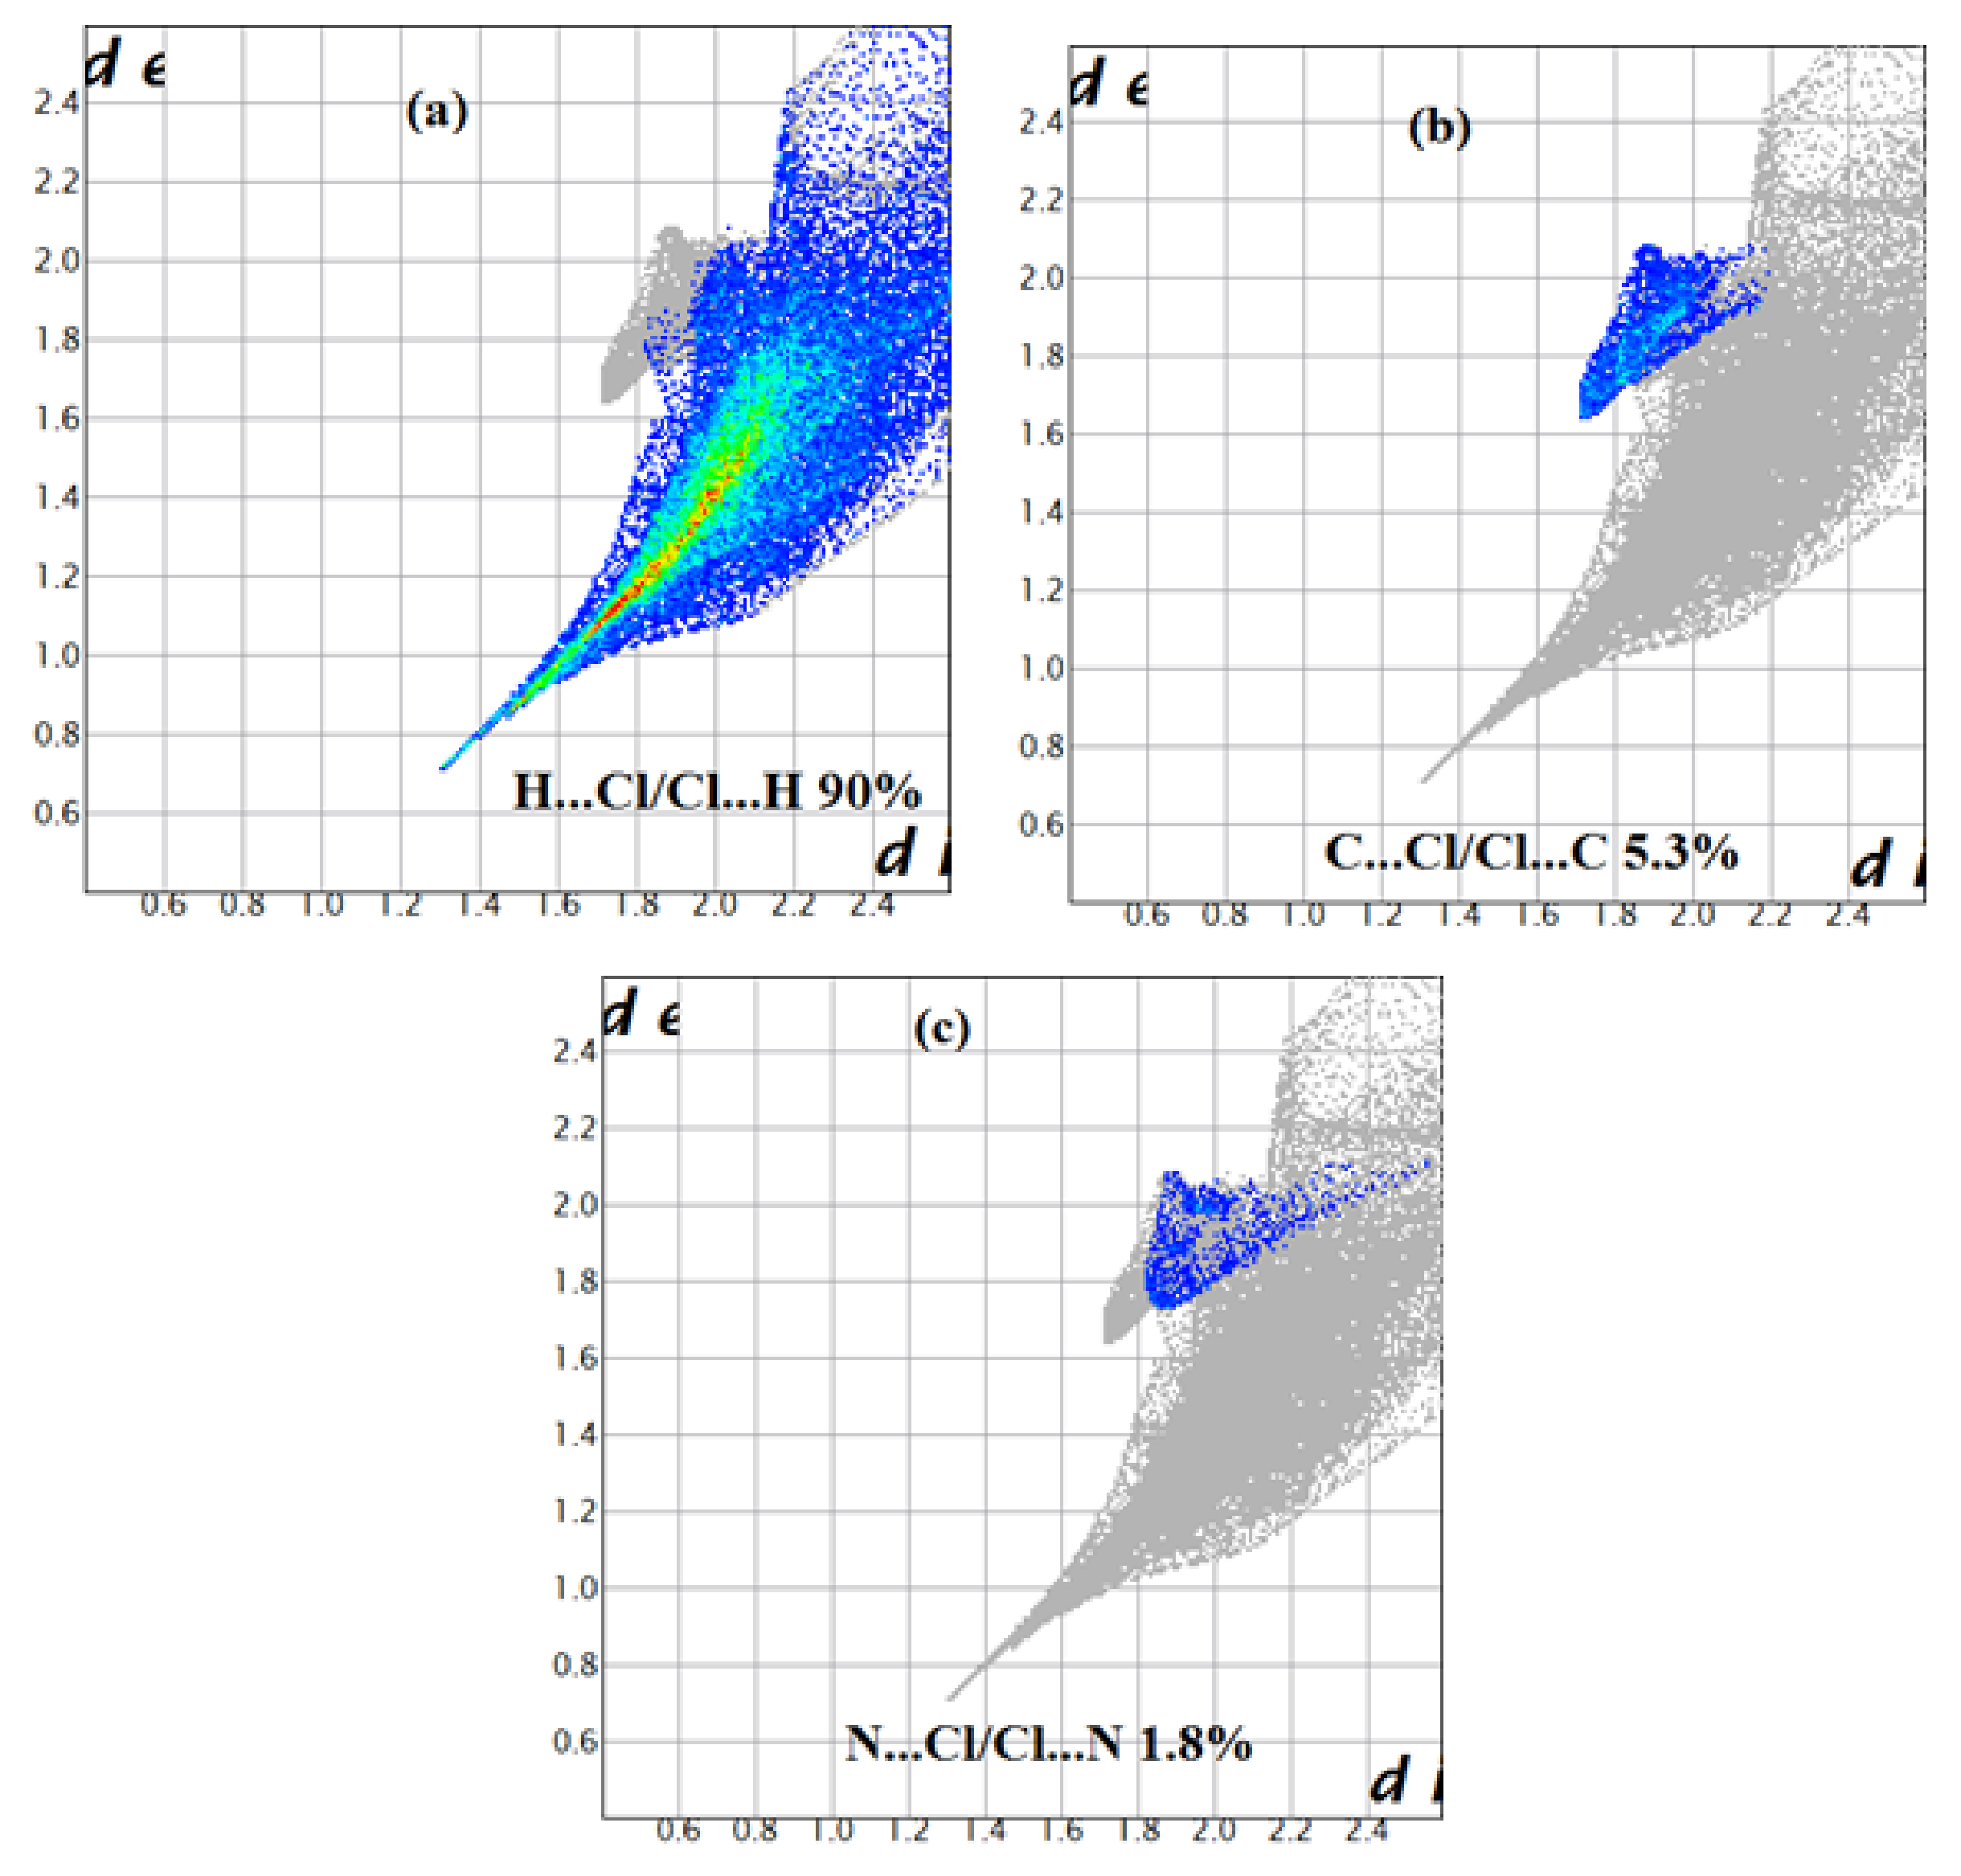
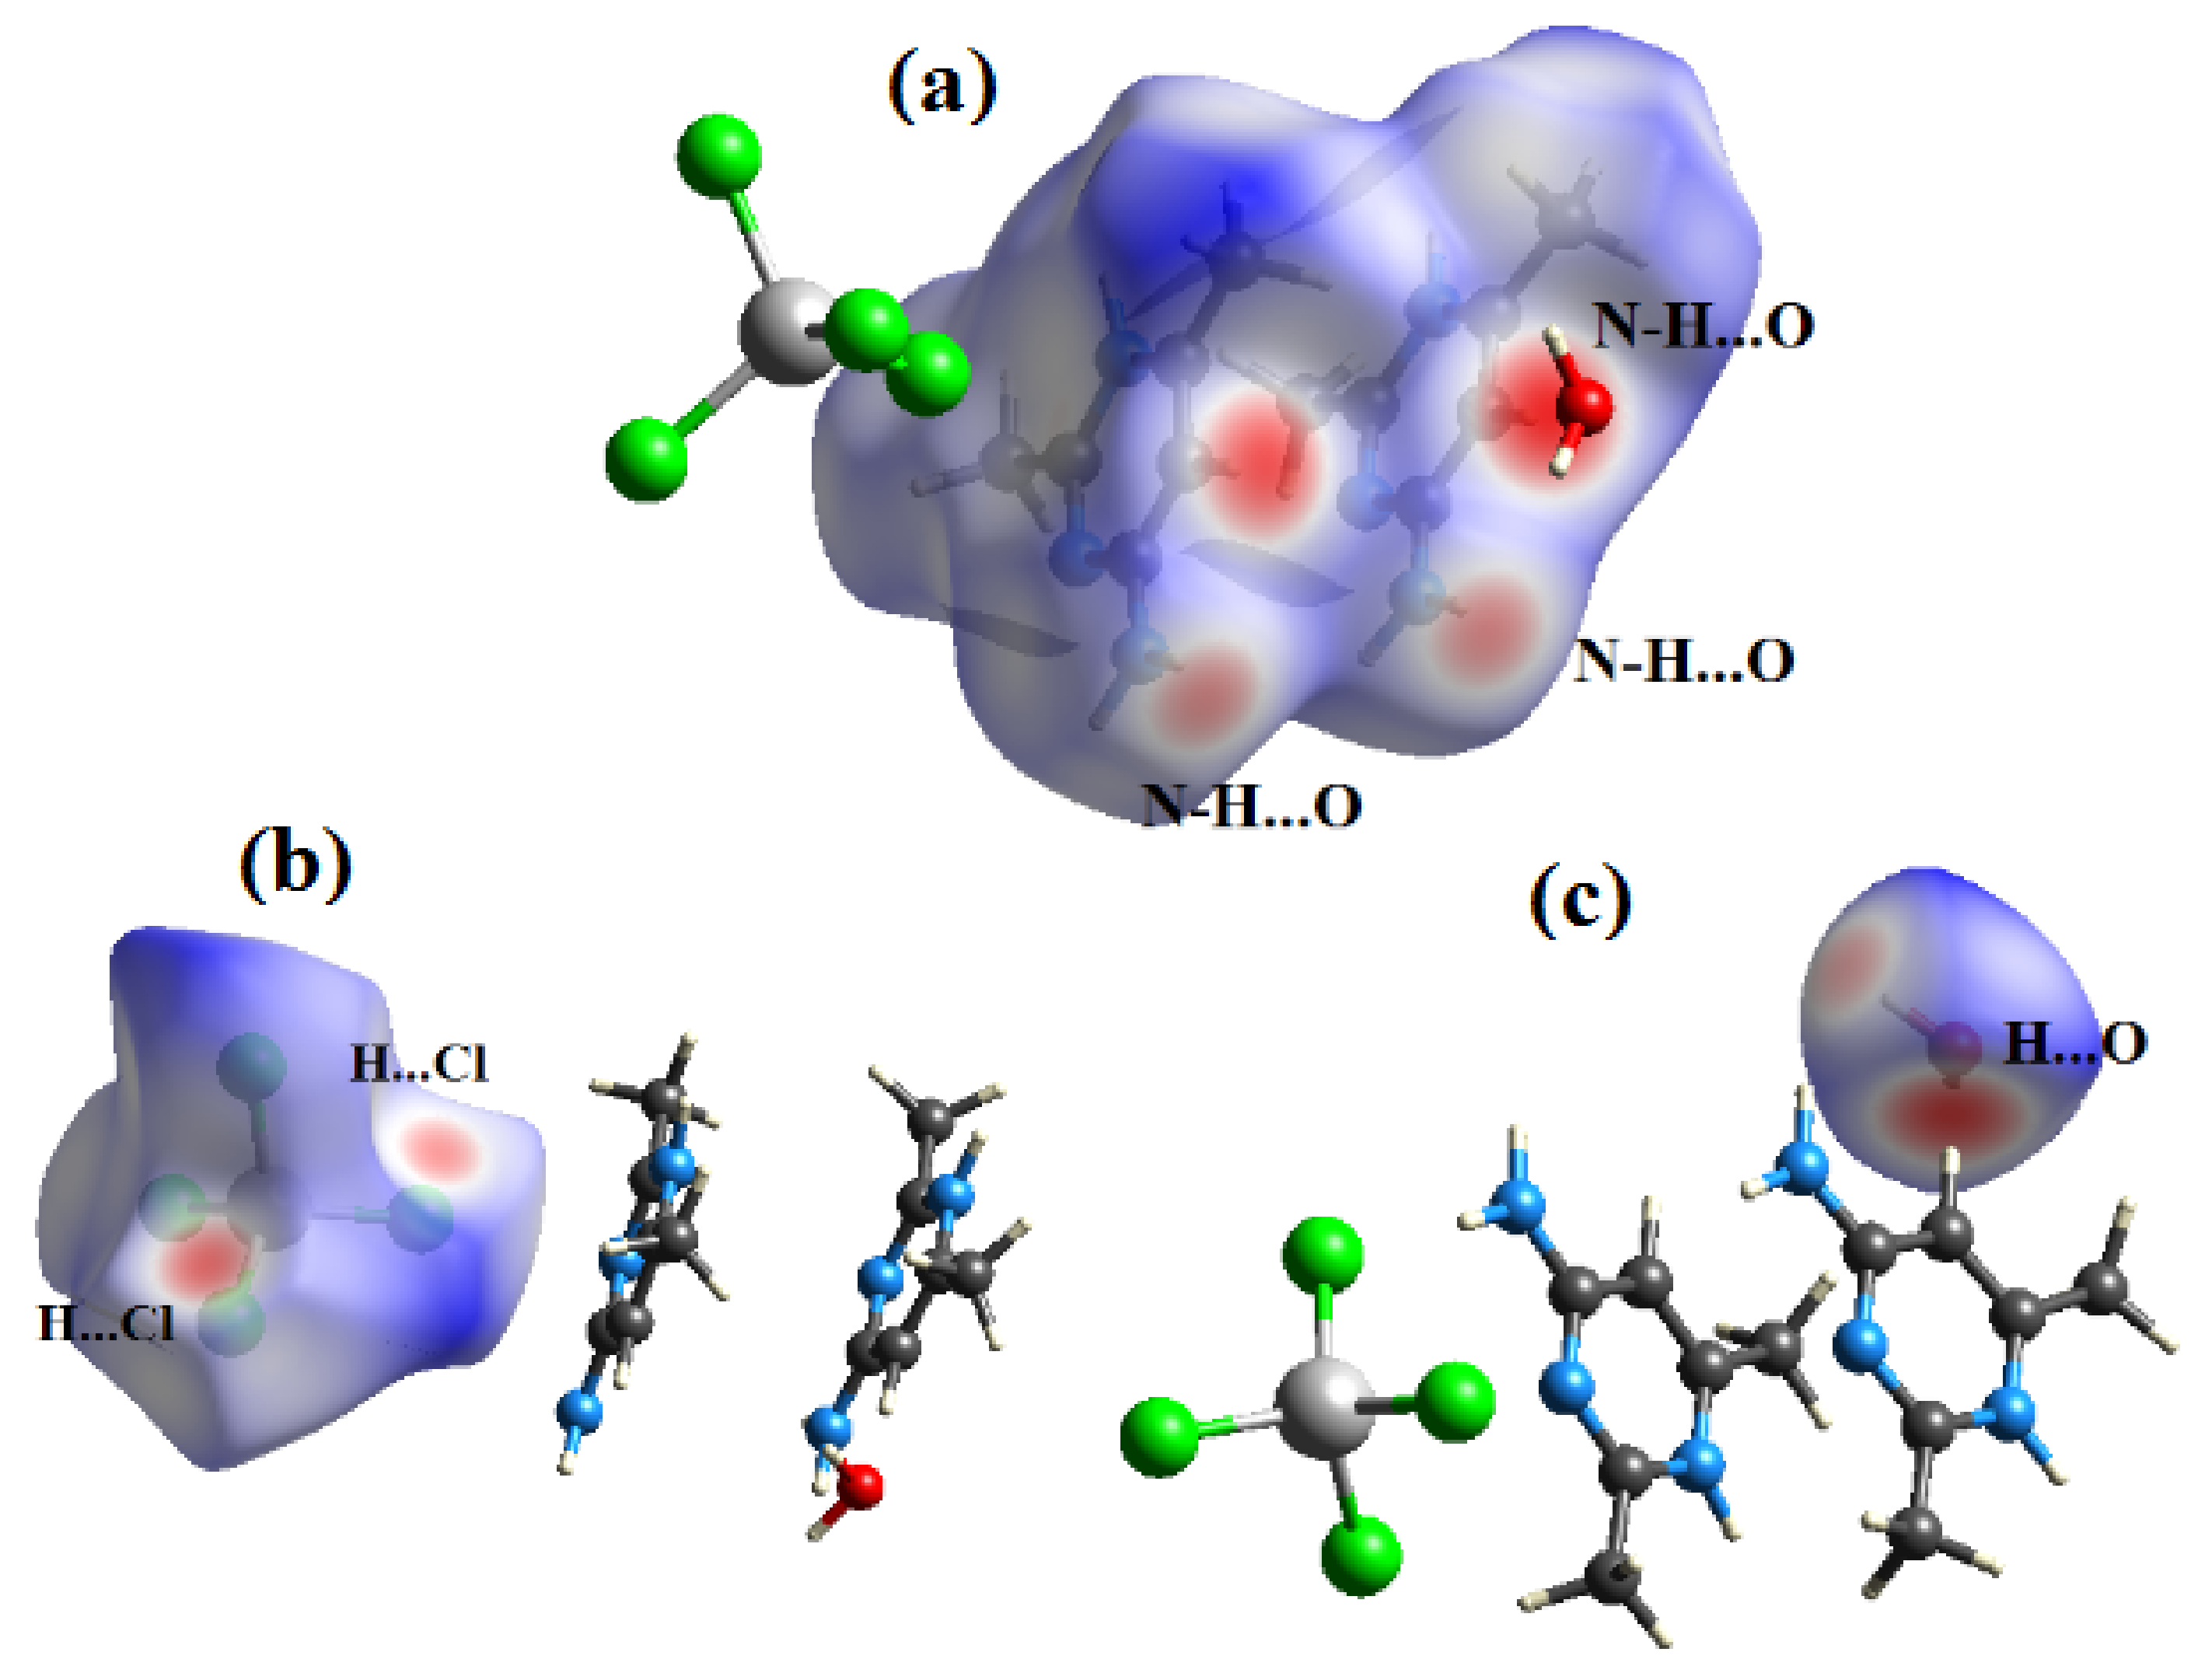
Figure 10.
Decomposed fingerprint plots of the major contacts around the [CoCl4]2− of compound (2). (a–c) represent H…Cl, C…Cl and N…Cl contacts, respectively.
Figure 10.
Decomposed fingerprint plots of the major contacts around the [CoCl4]2− of compound (2). (a–c) represent H…Cl, C…Cl and N…Cl contacts, respectively.
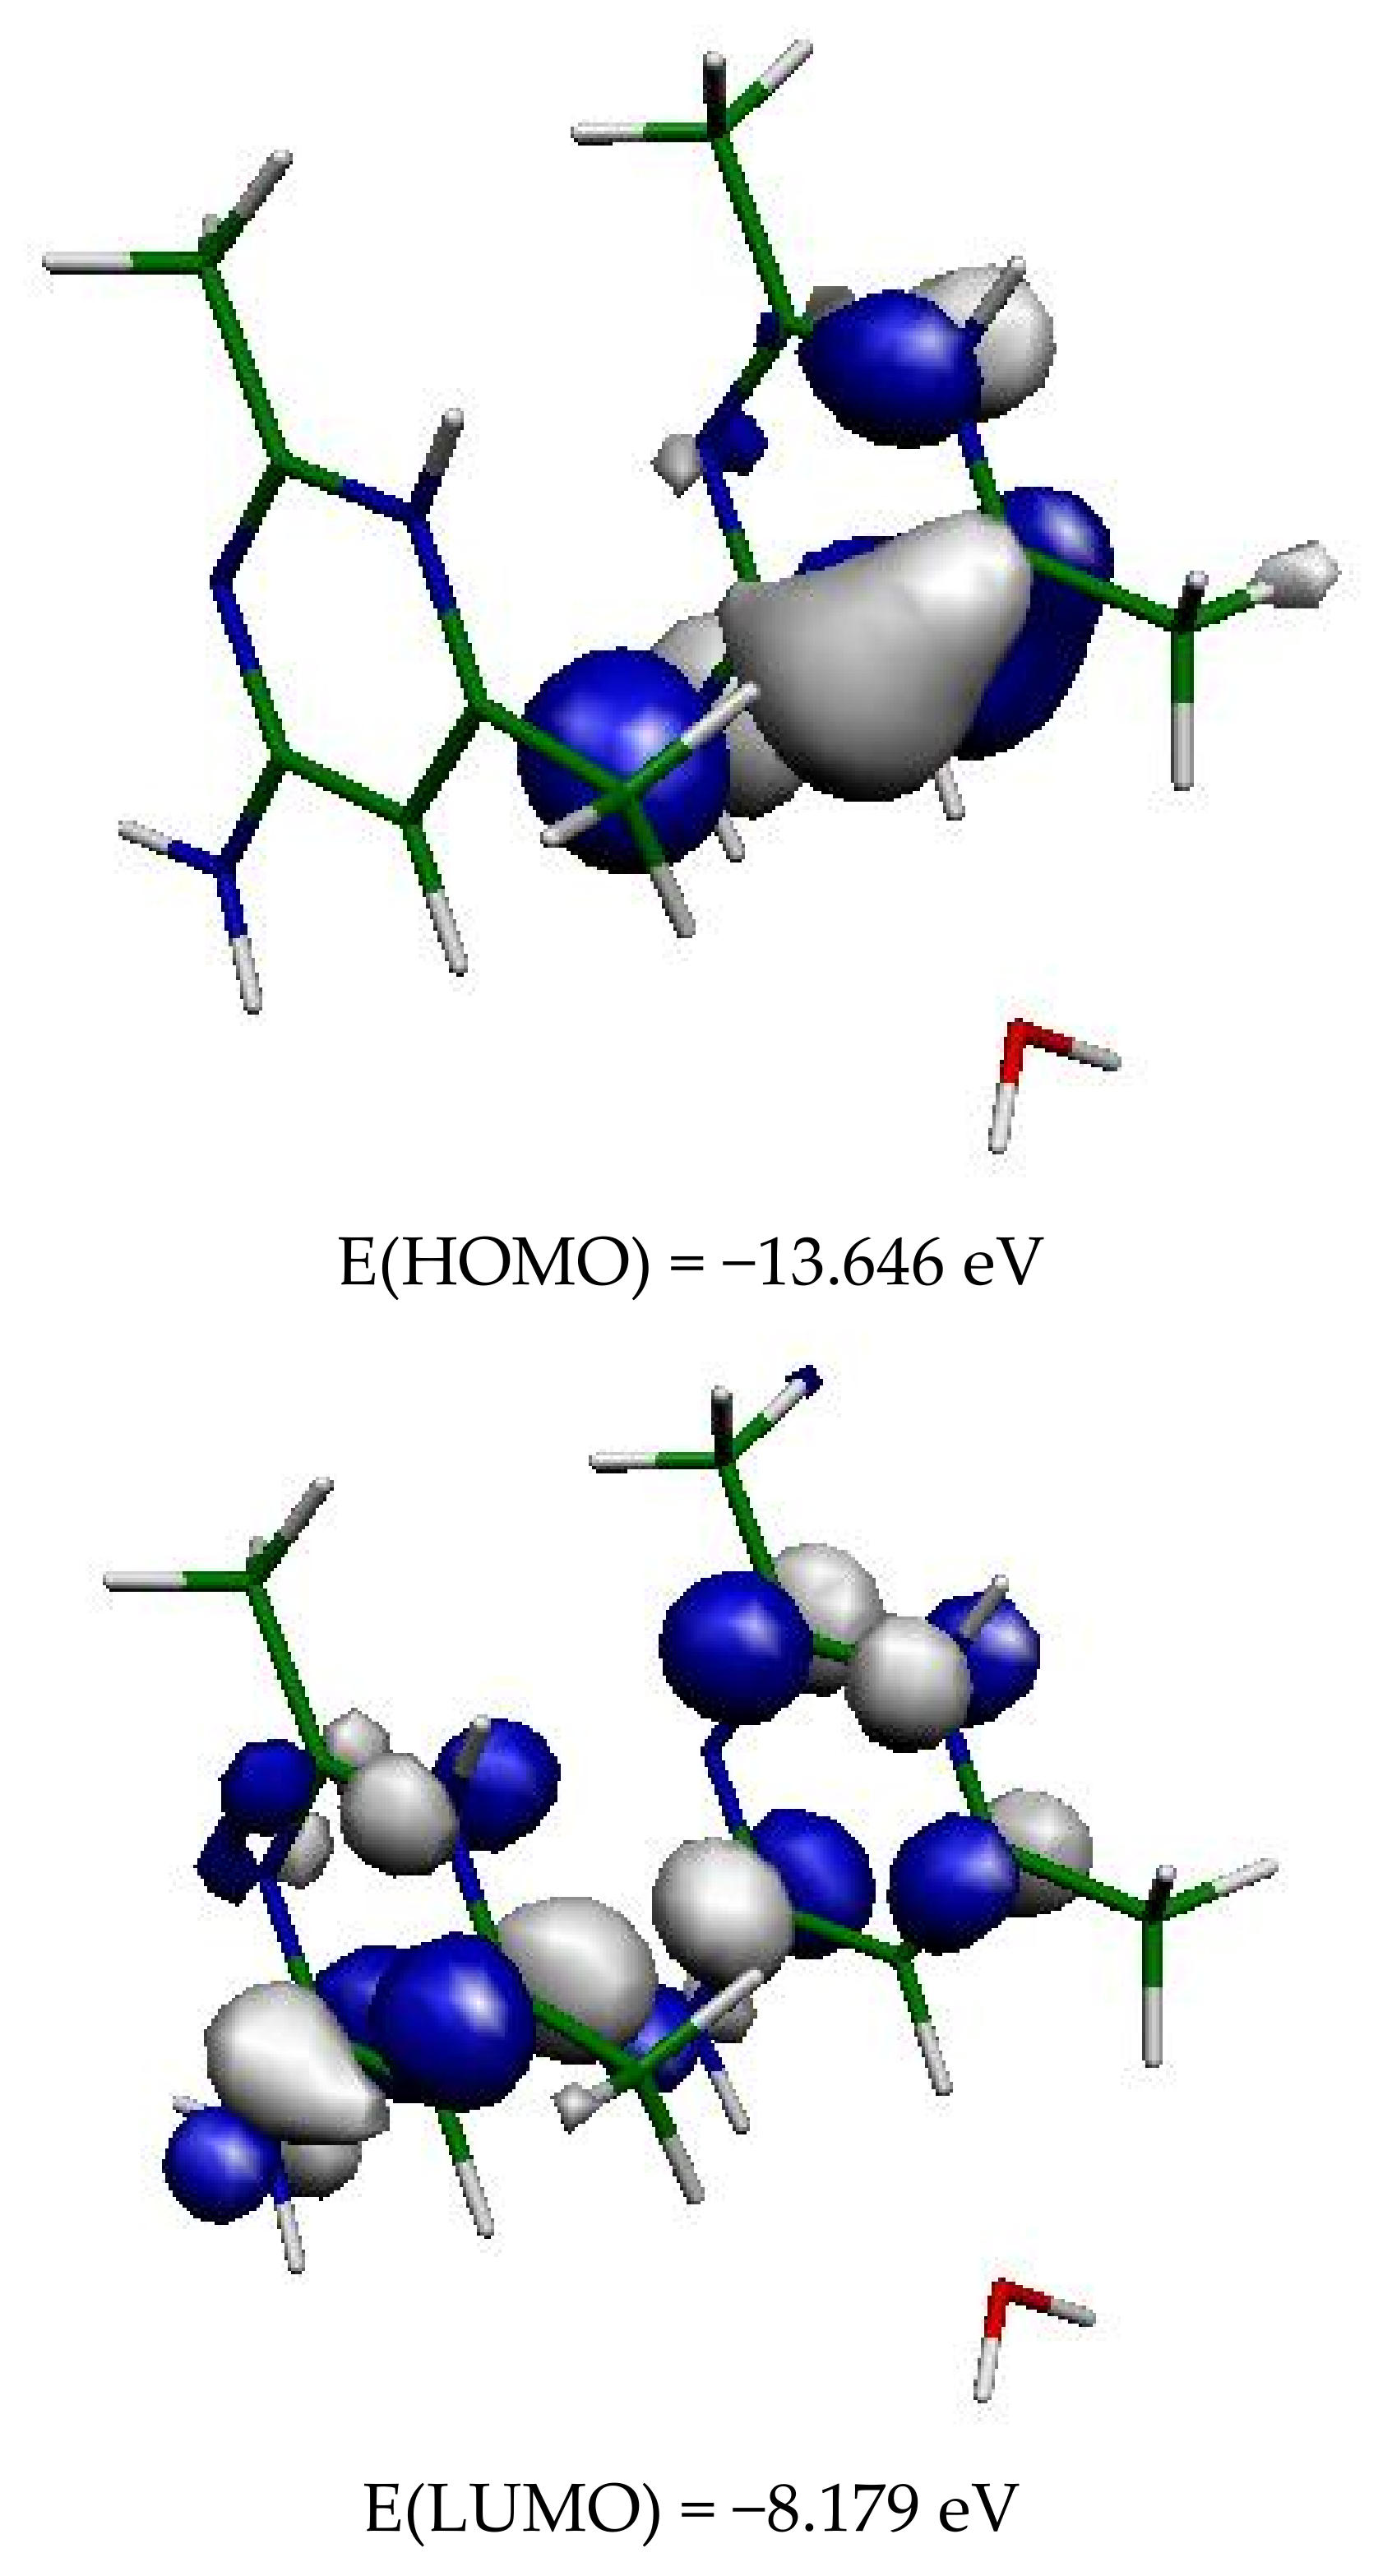
Figure 11.
Frontier orbitals in (1).
Figure 11.
Frontier orbitals in (1).
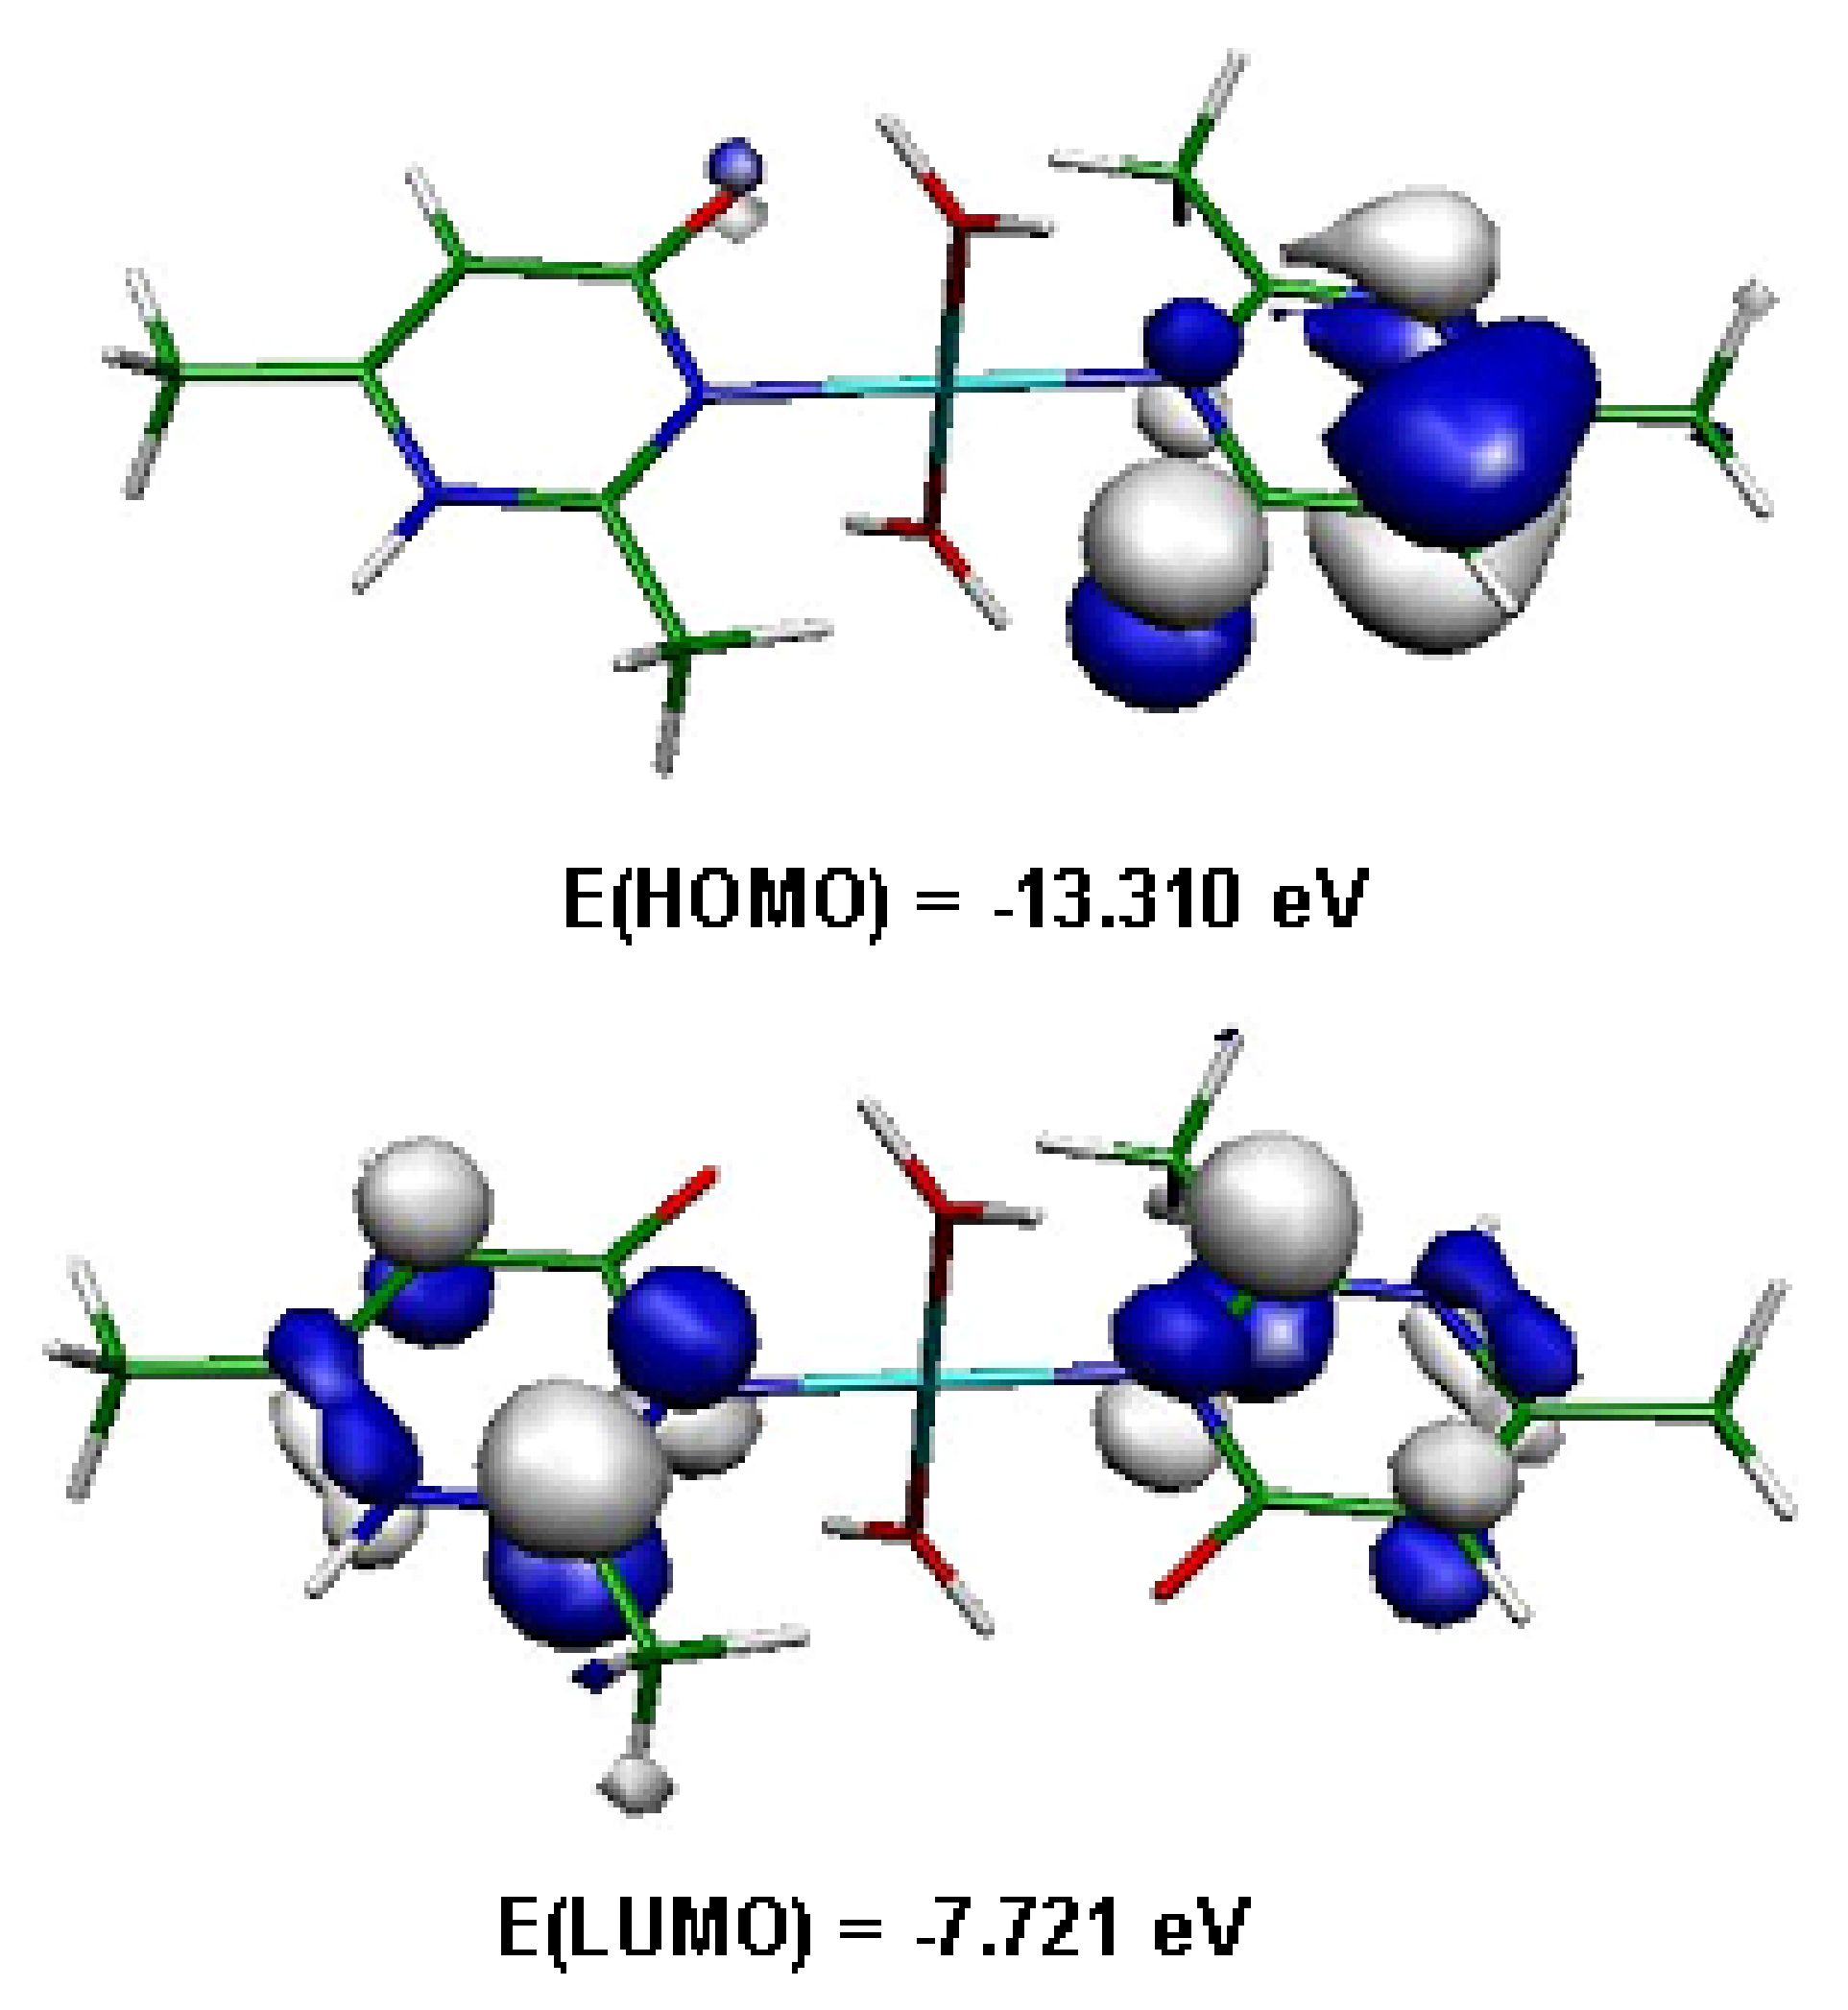
Figure 12.
Frontier orbitals of the two organic cations in (2).
Figure 12.
Frontier orbitals of the two organic cations in (2).
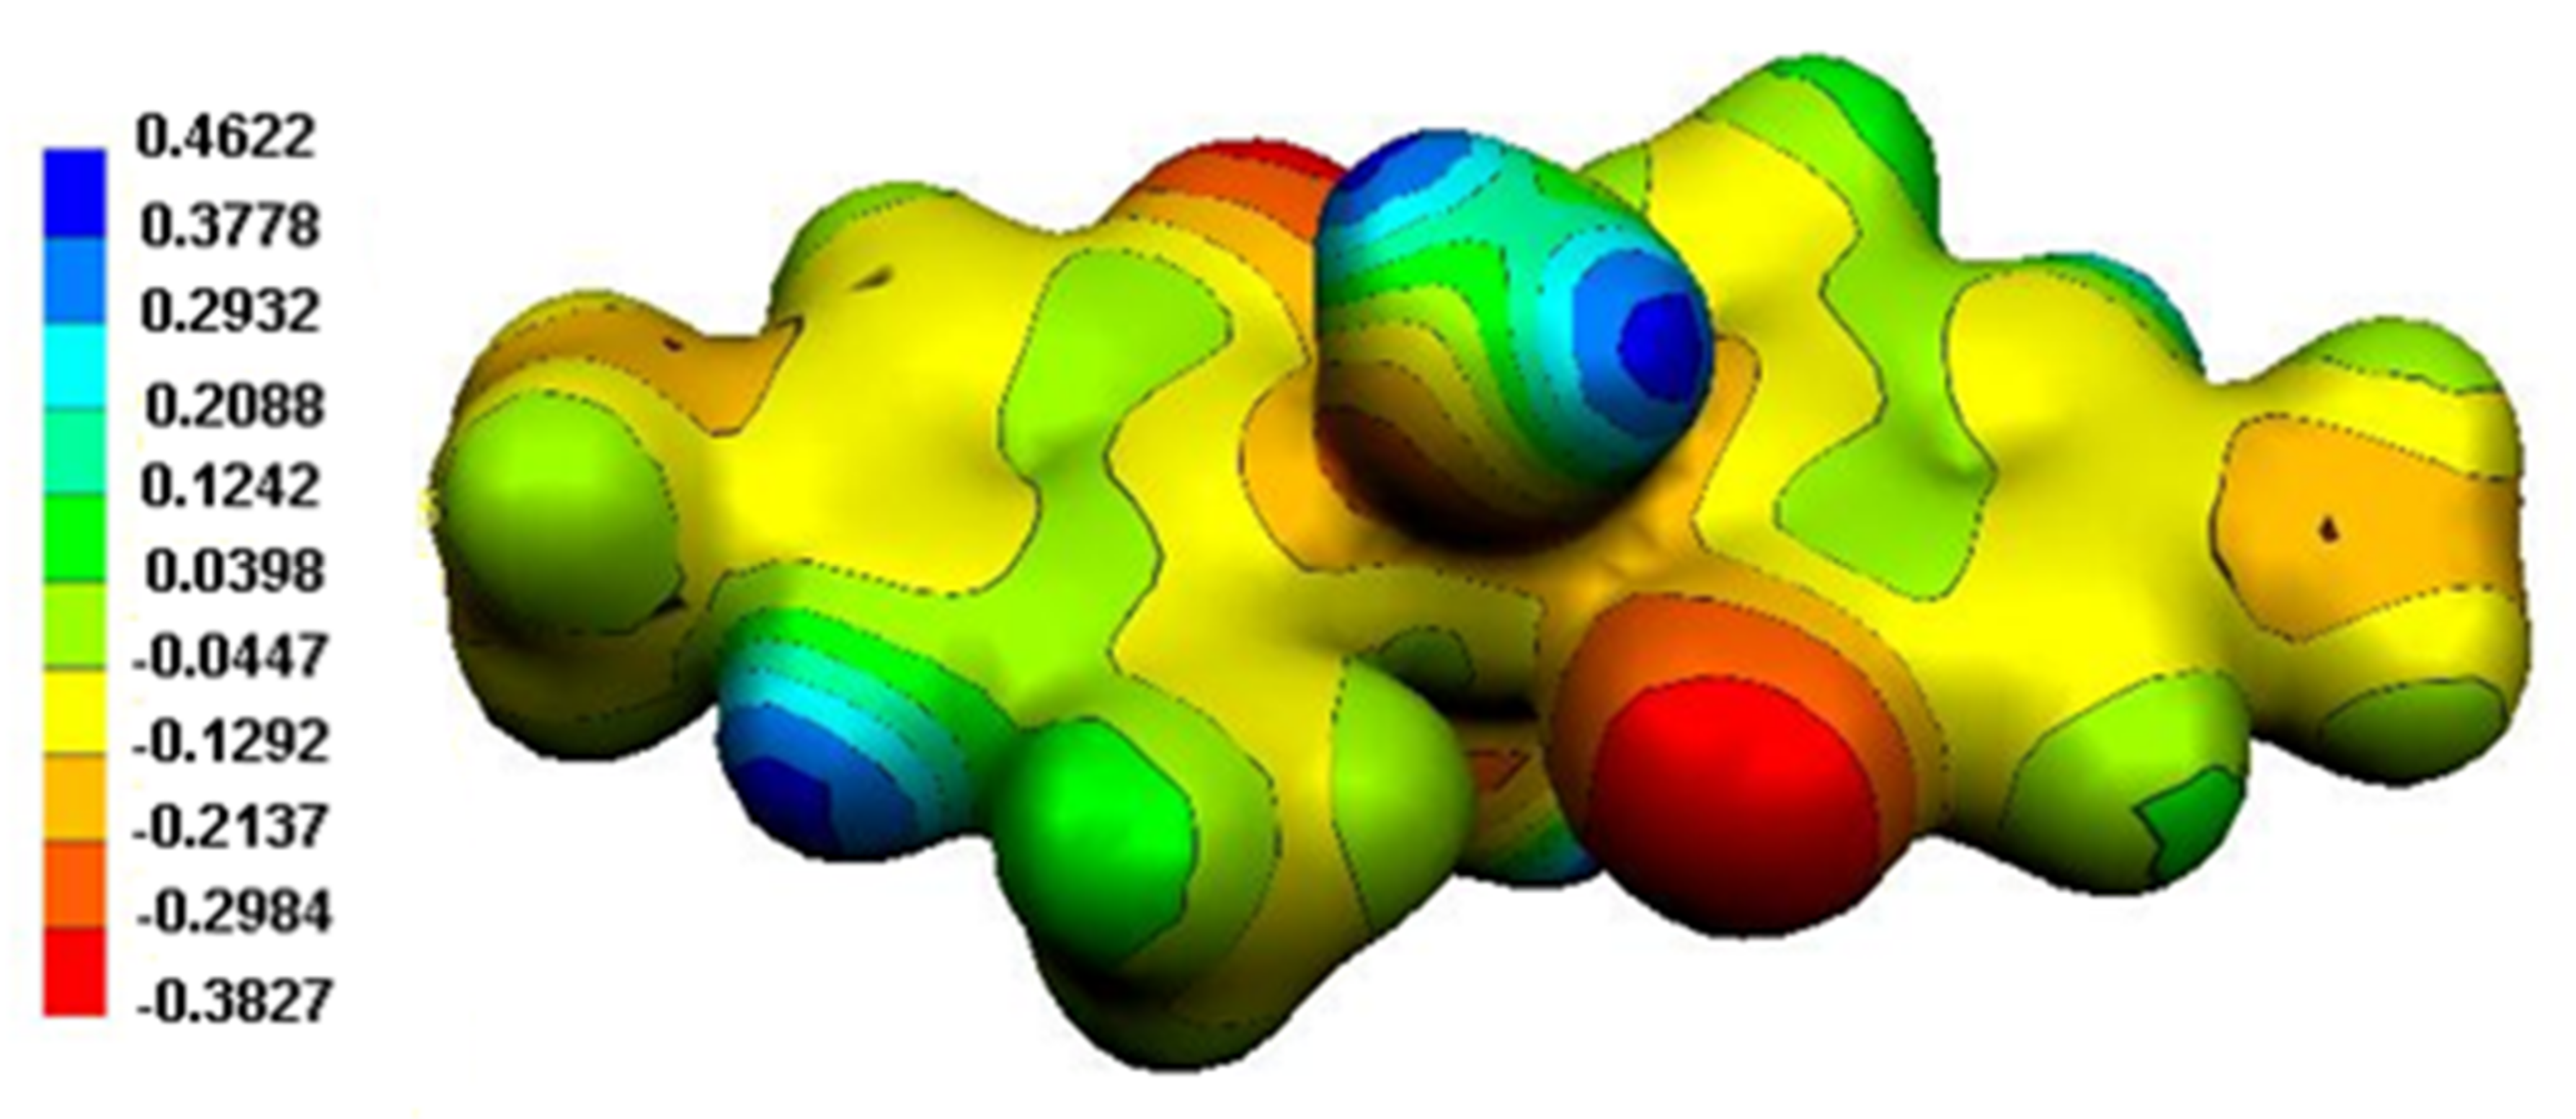
Figure 13.
MEP surface of (1).
Figure 13.
MEP surface of (1).
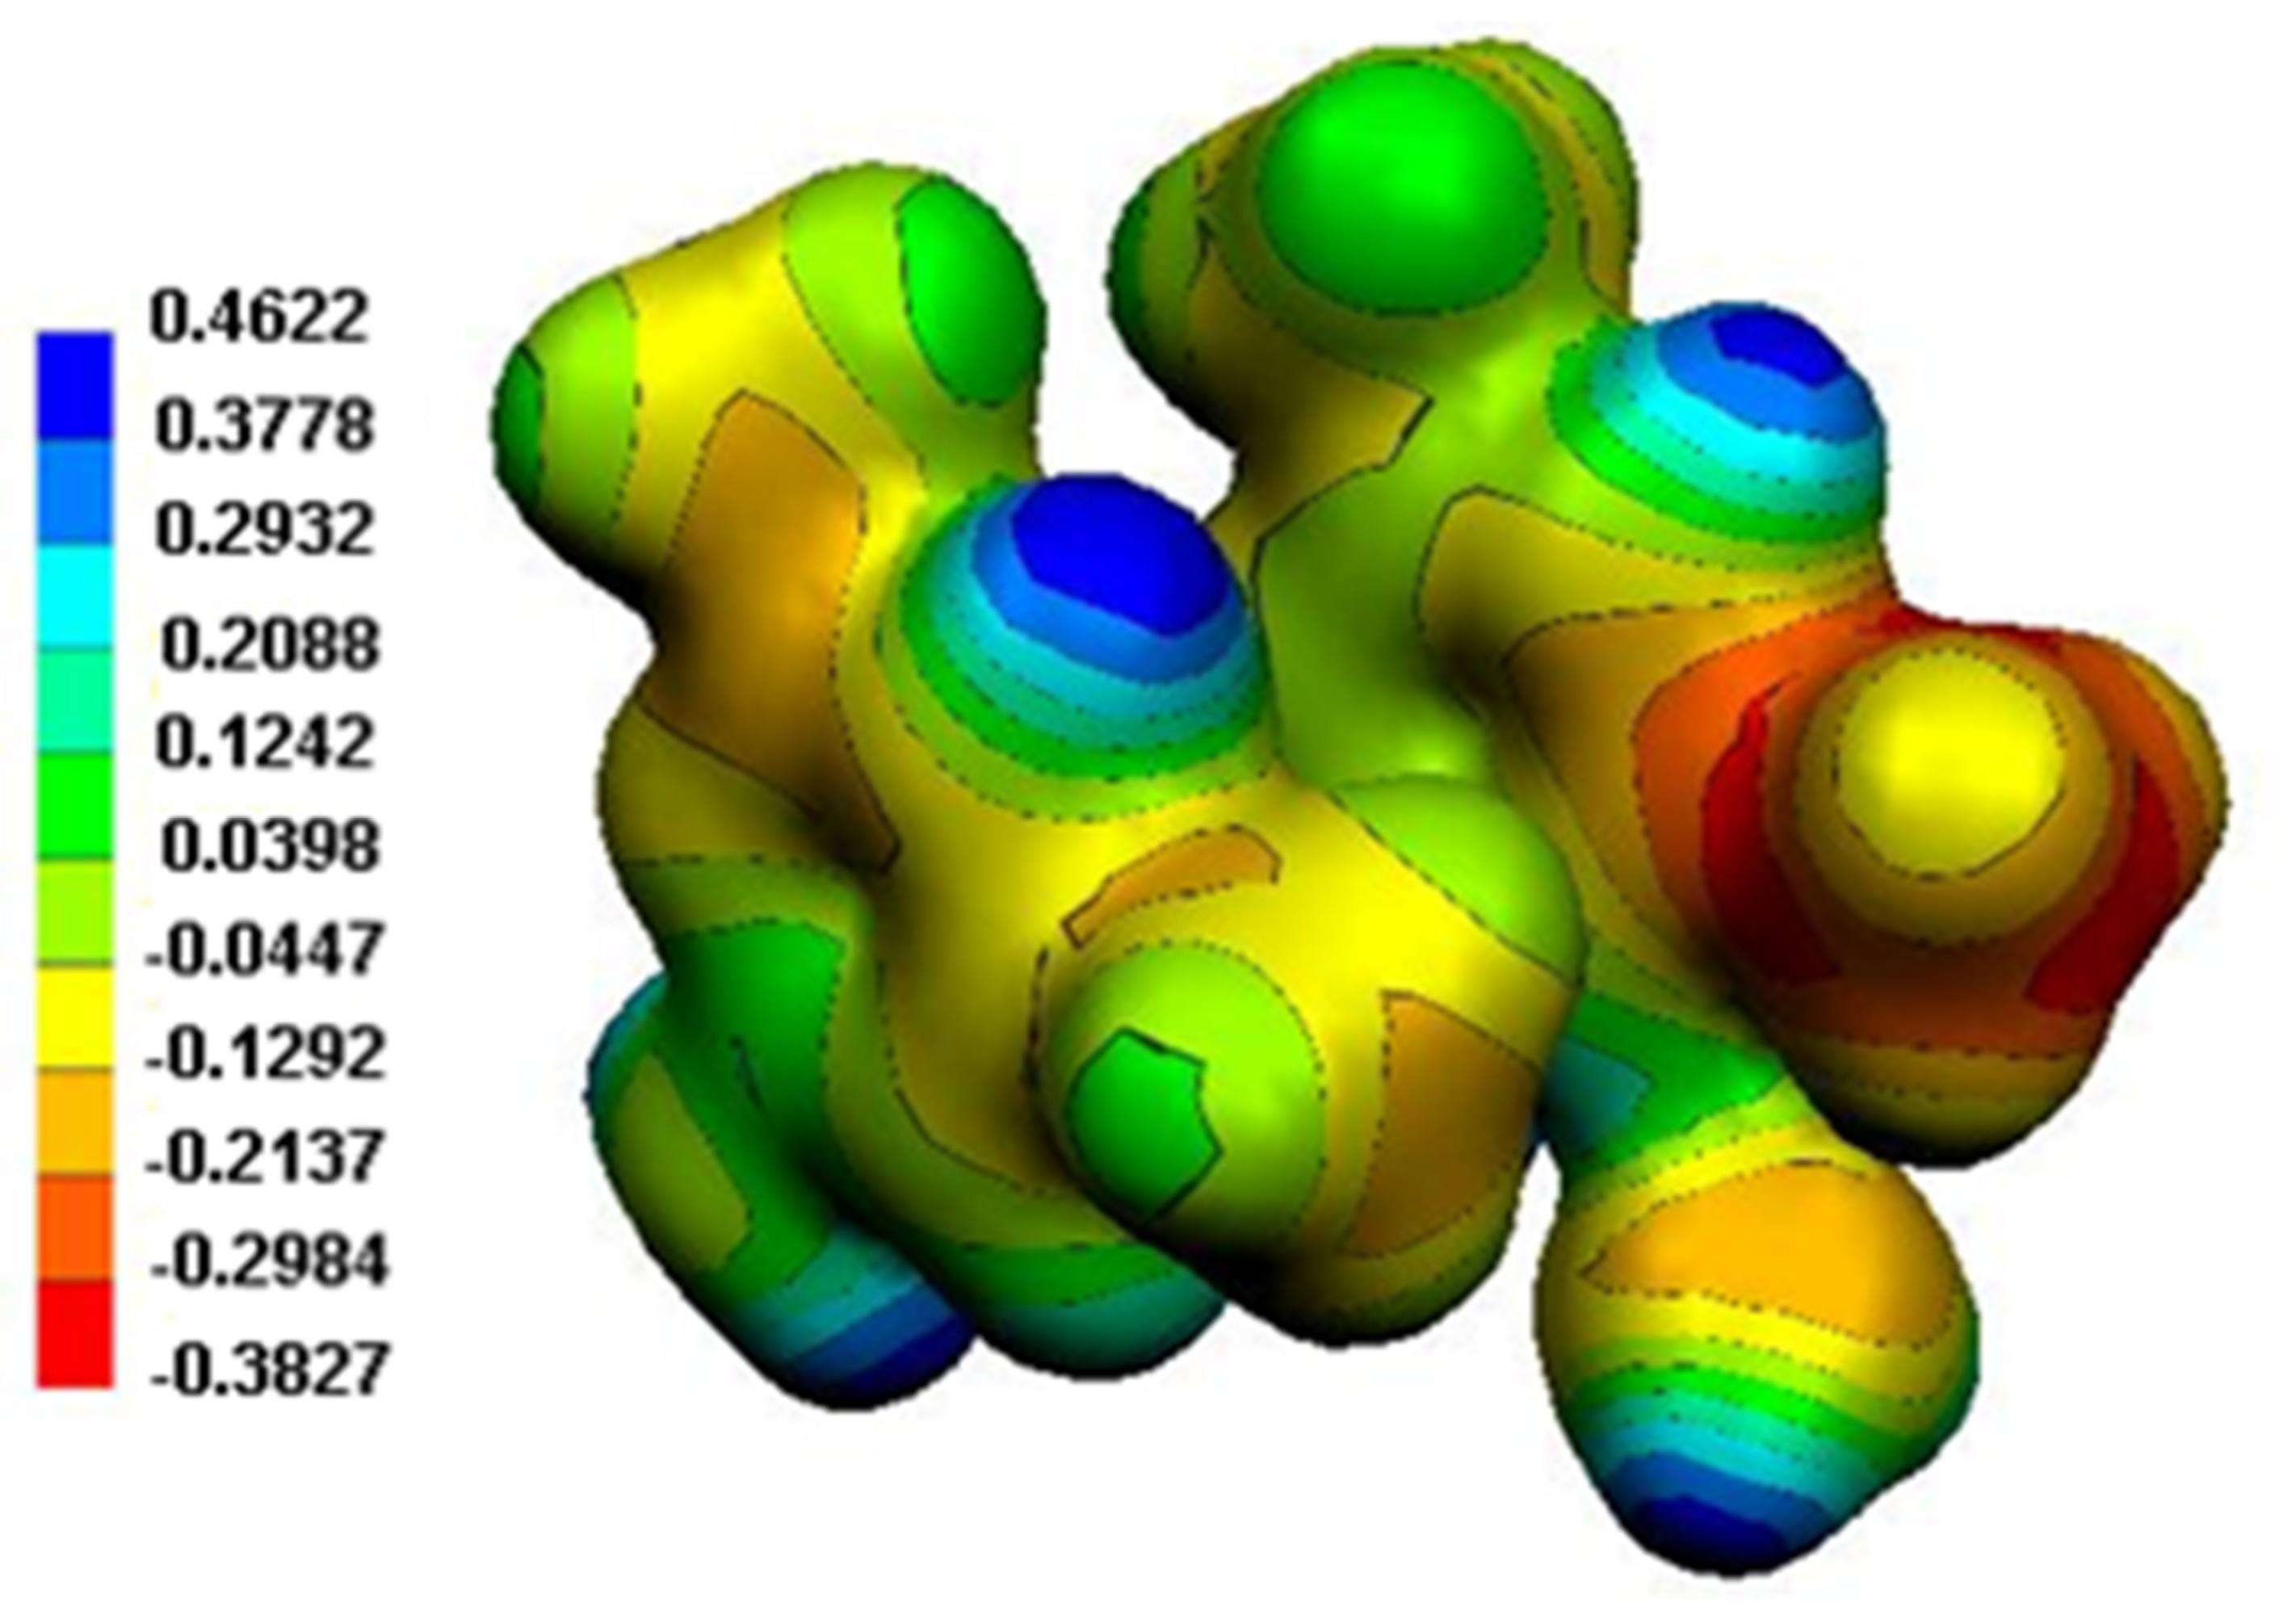
Figure 14.
MEP surface of the two organic cations in (2).
Figure 14.
MEP surface of the two organic cations in (2).
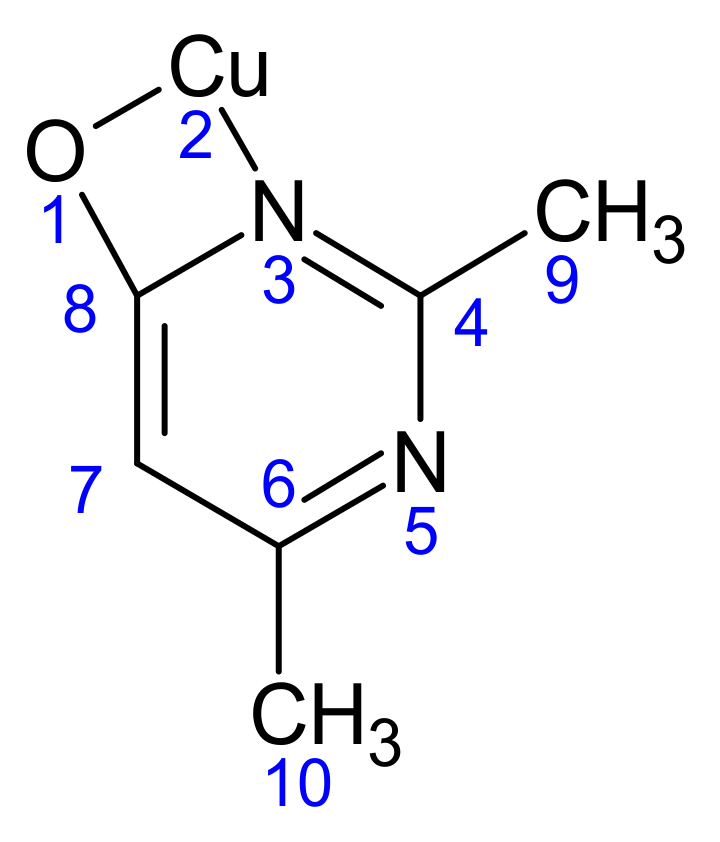
Scheme 2.
The atomic numbering used for Mulliken charge calculation of (1).
Scheme 2.
The atomic numbering used for Mulliken charge calculation of (1).
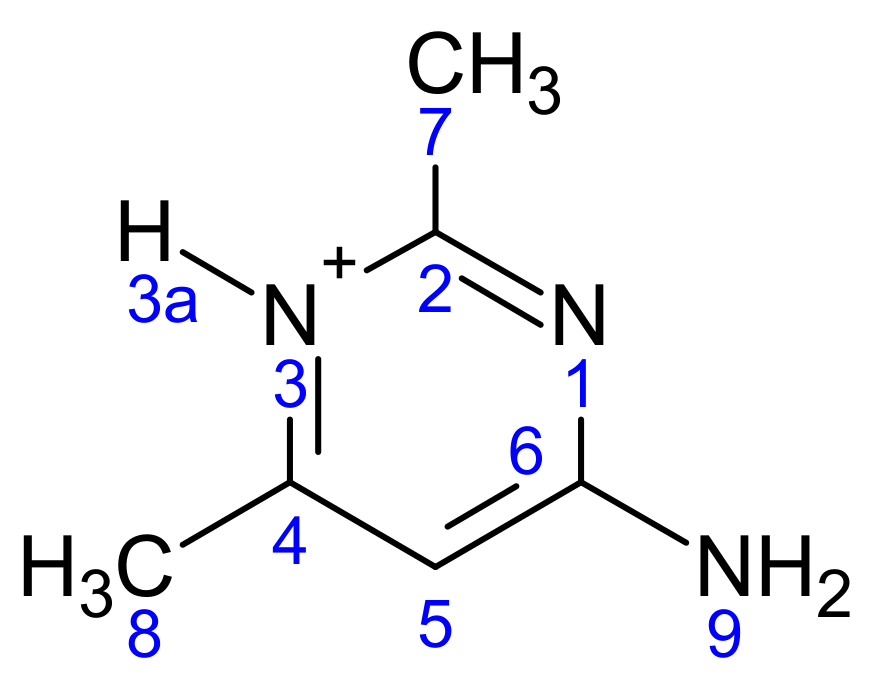
Scheme 3.
The atomic numbering used for Mulliken charge calculation of (2).
Scheme 3.
The atomic numbering used for Mulliken charge calculation of (2).
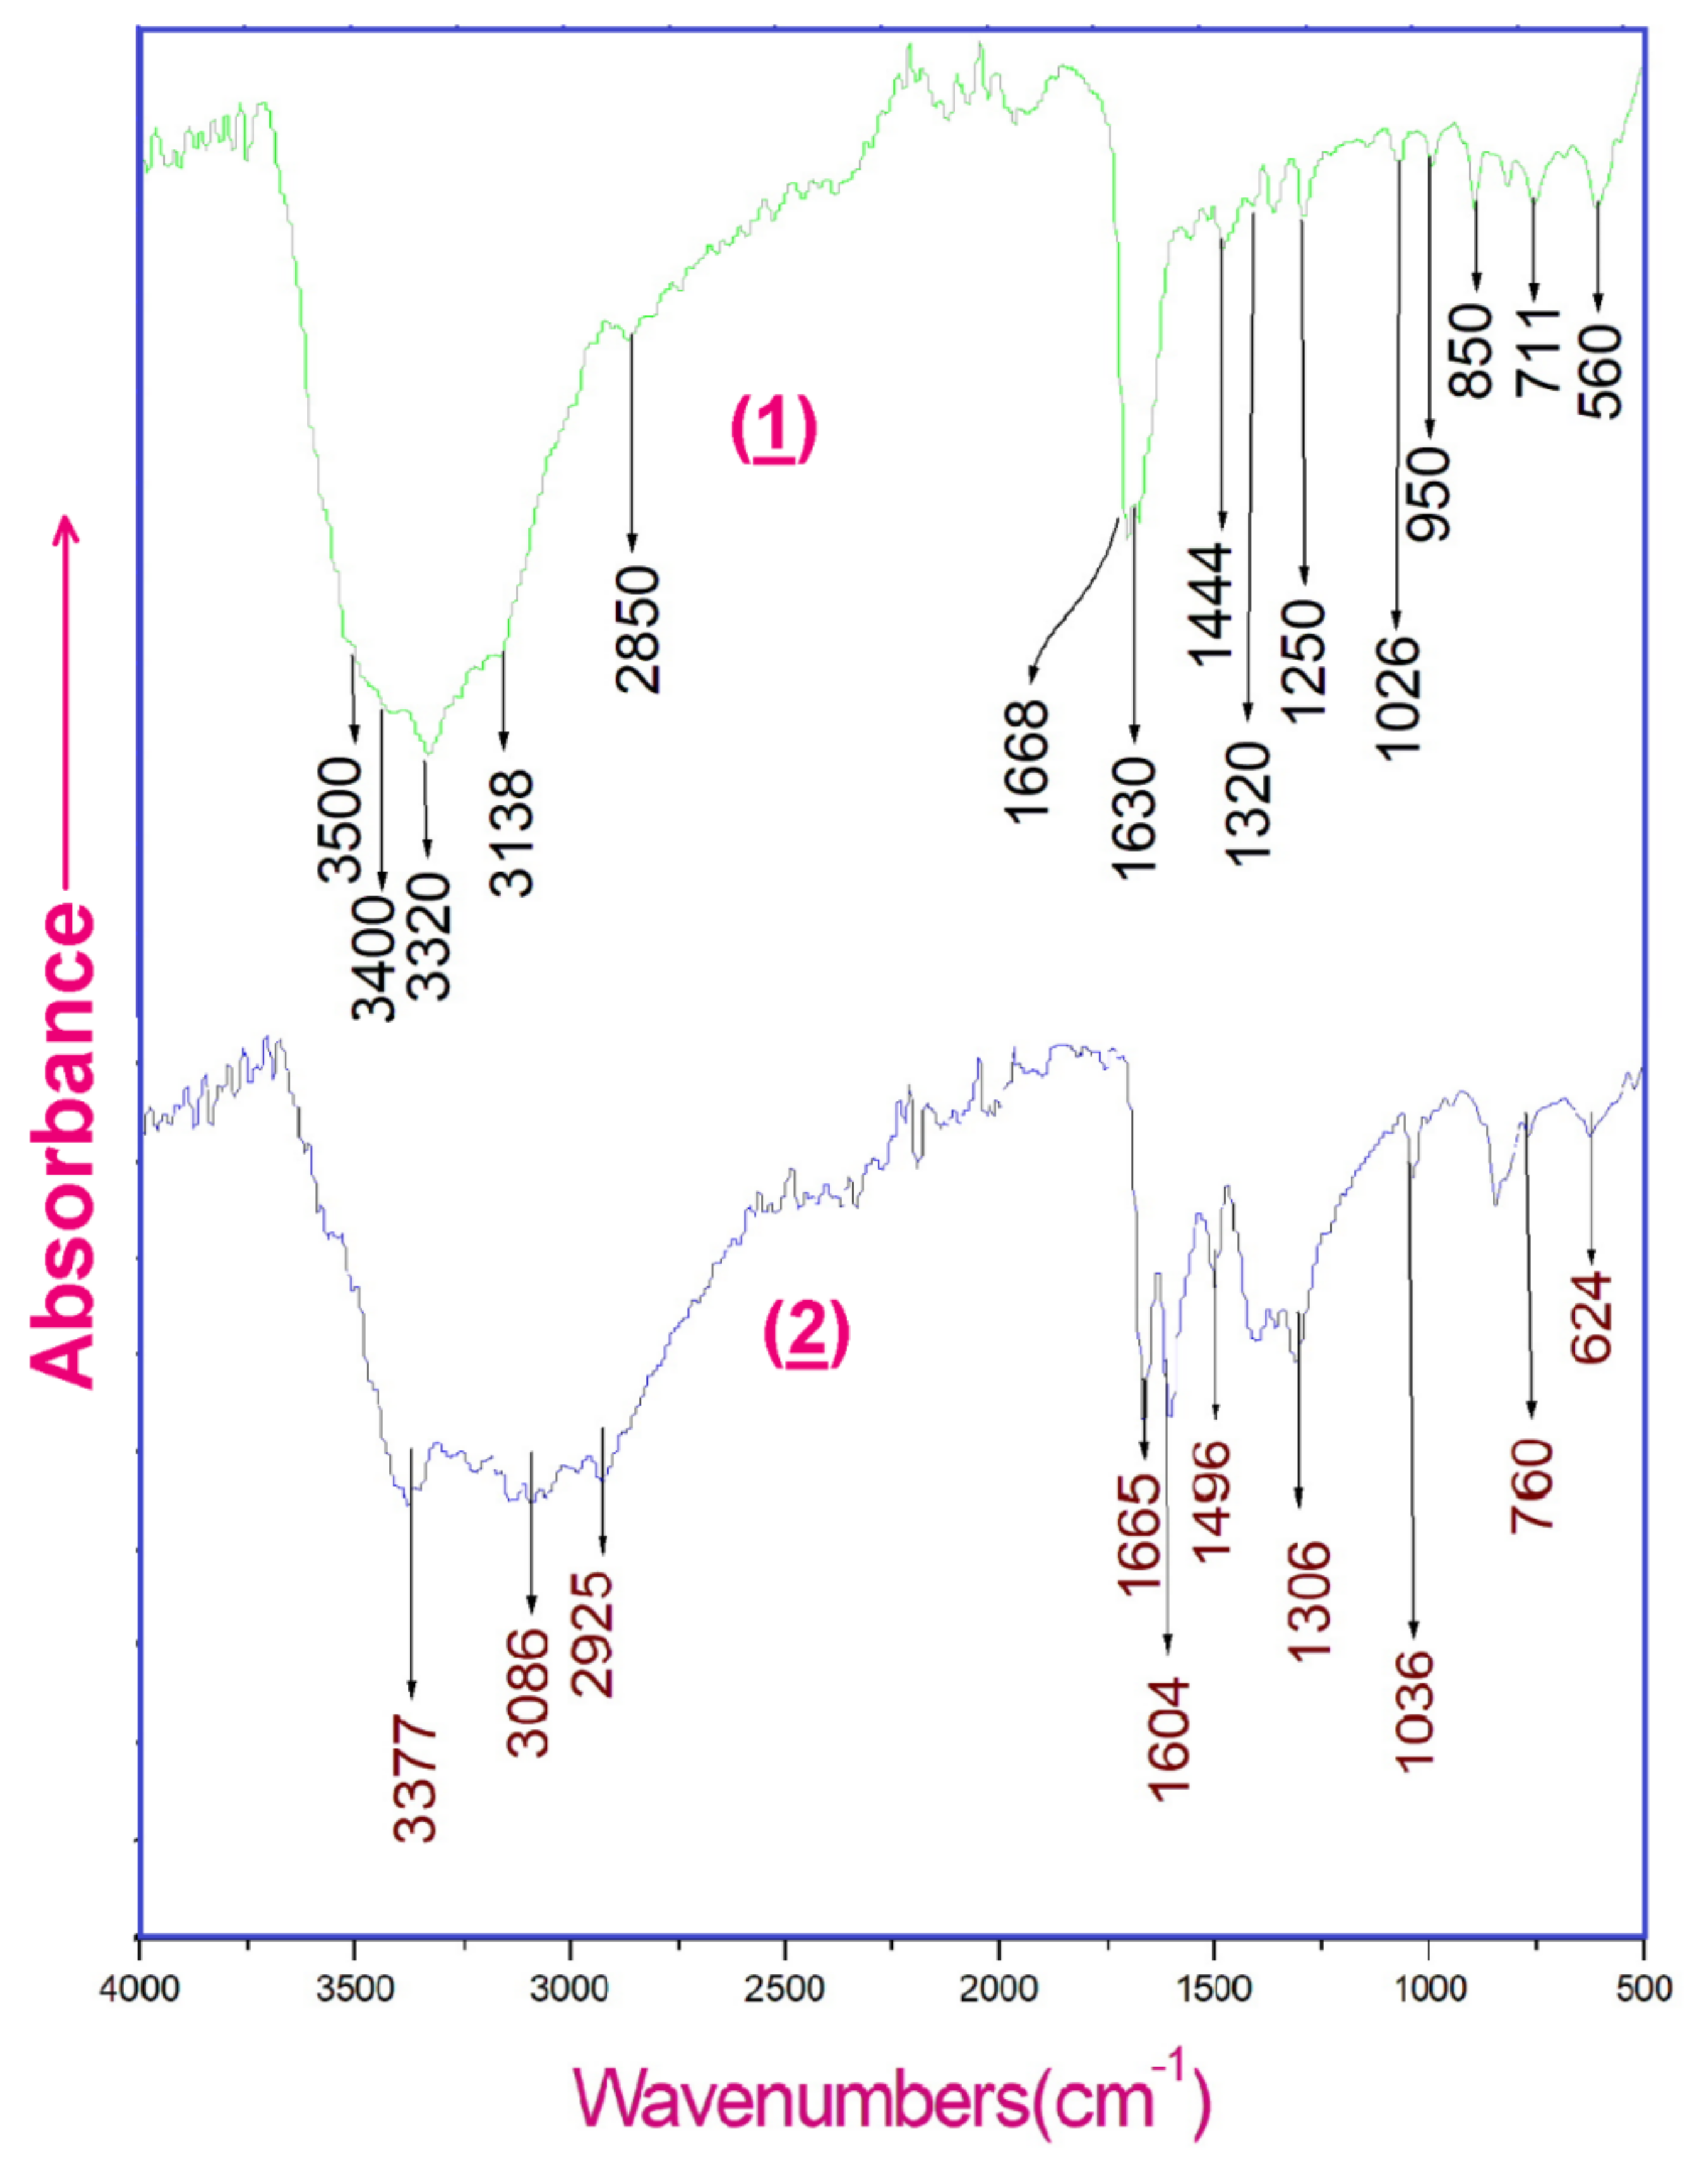
Figure 15.
Experimental infrared absorption spectra of (1) and (2).
Figure 15.
Experimental infrared absorption spectra of (1) and (2).
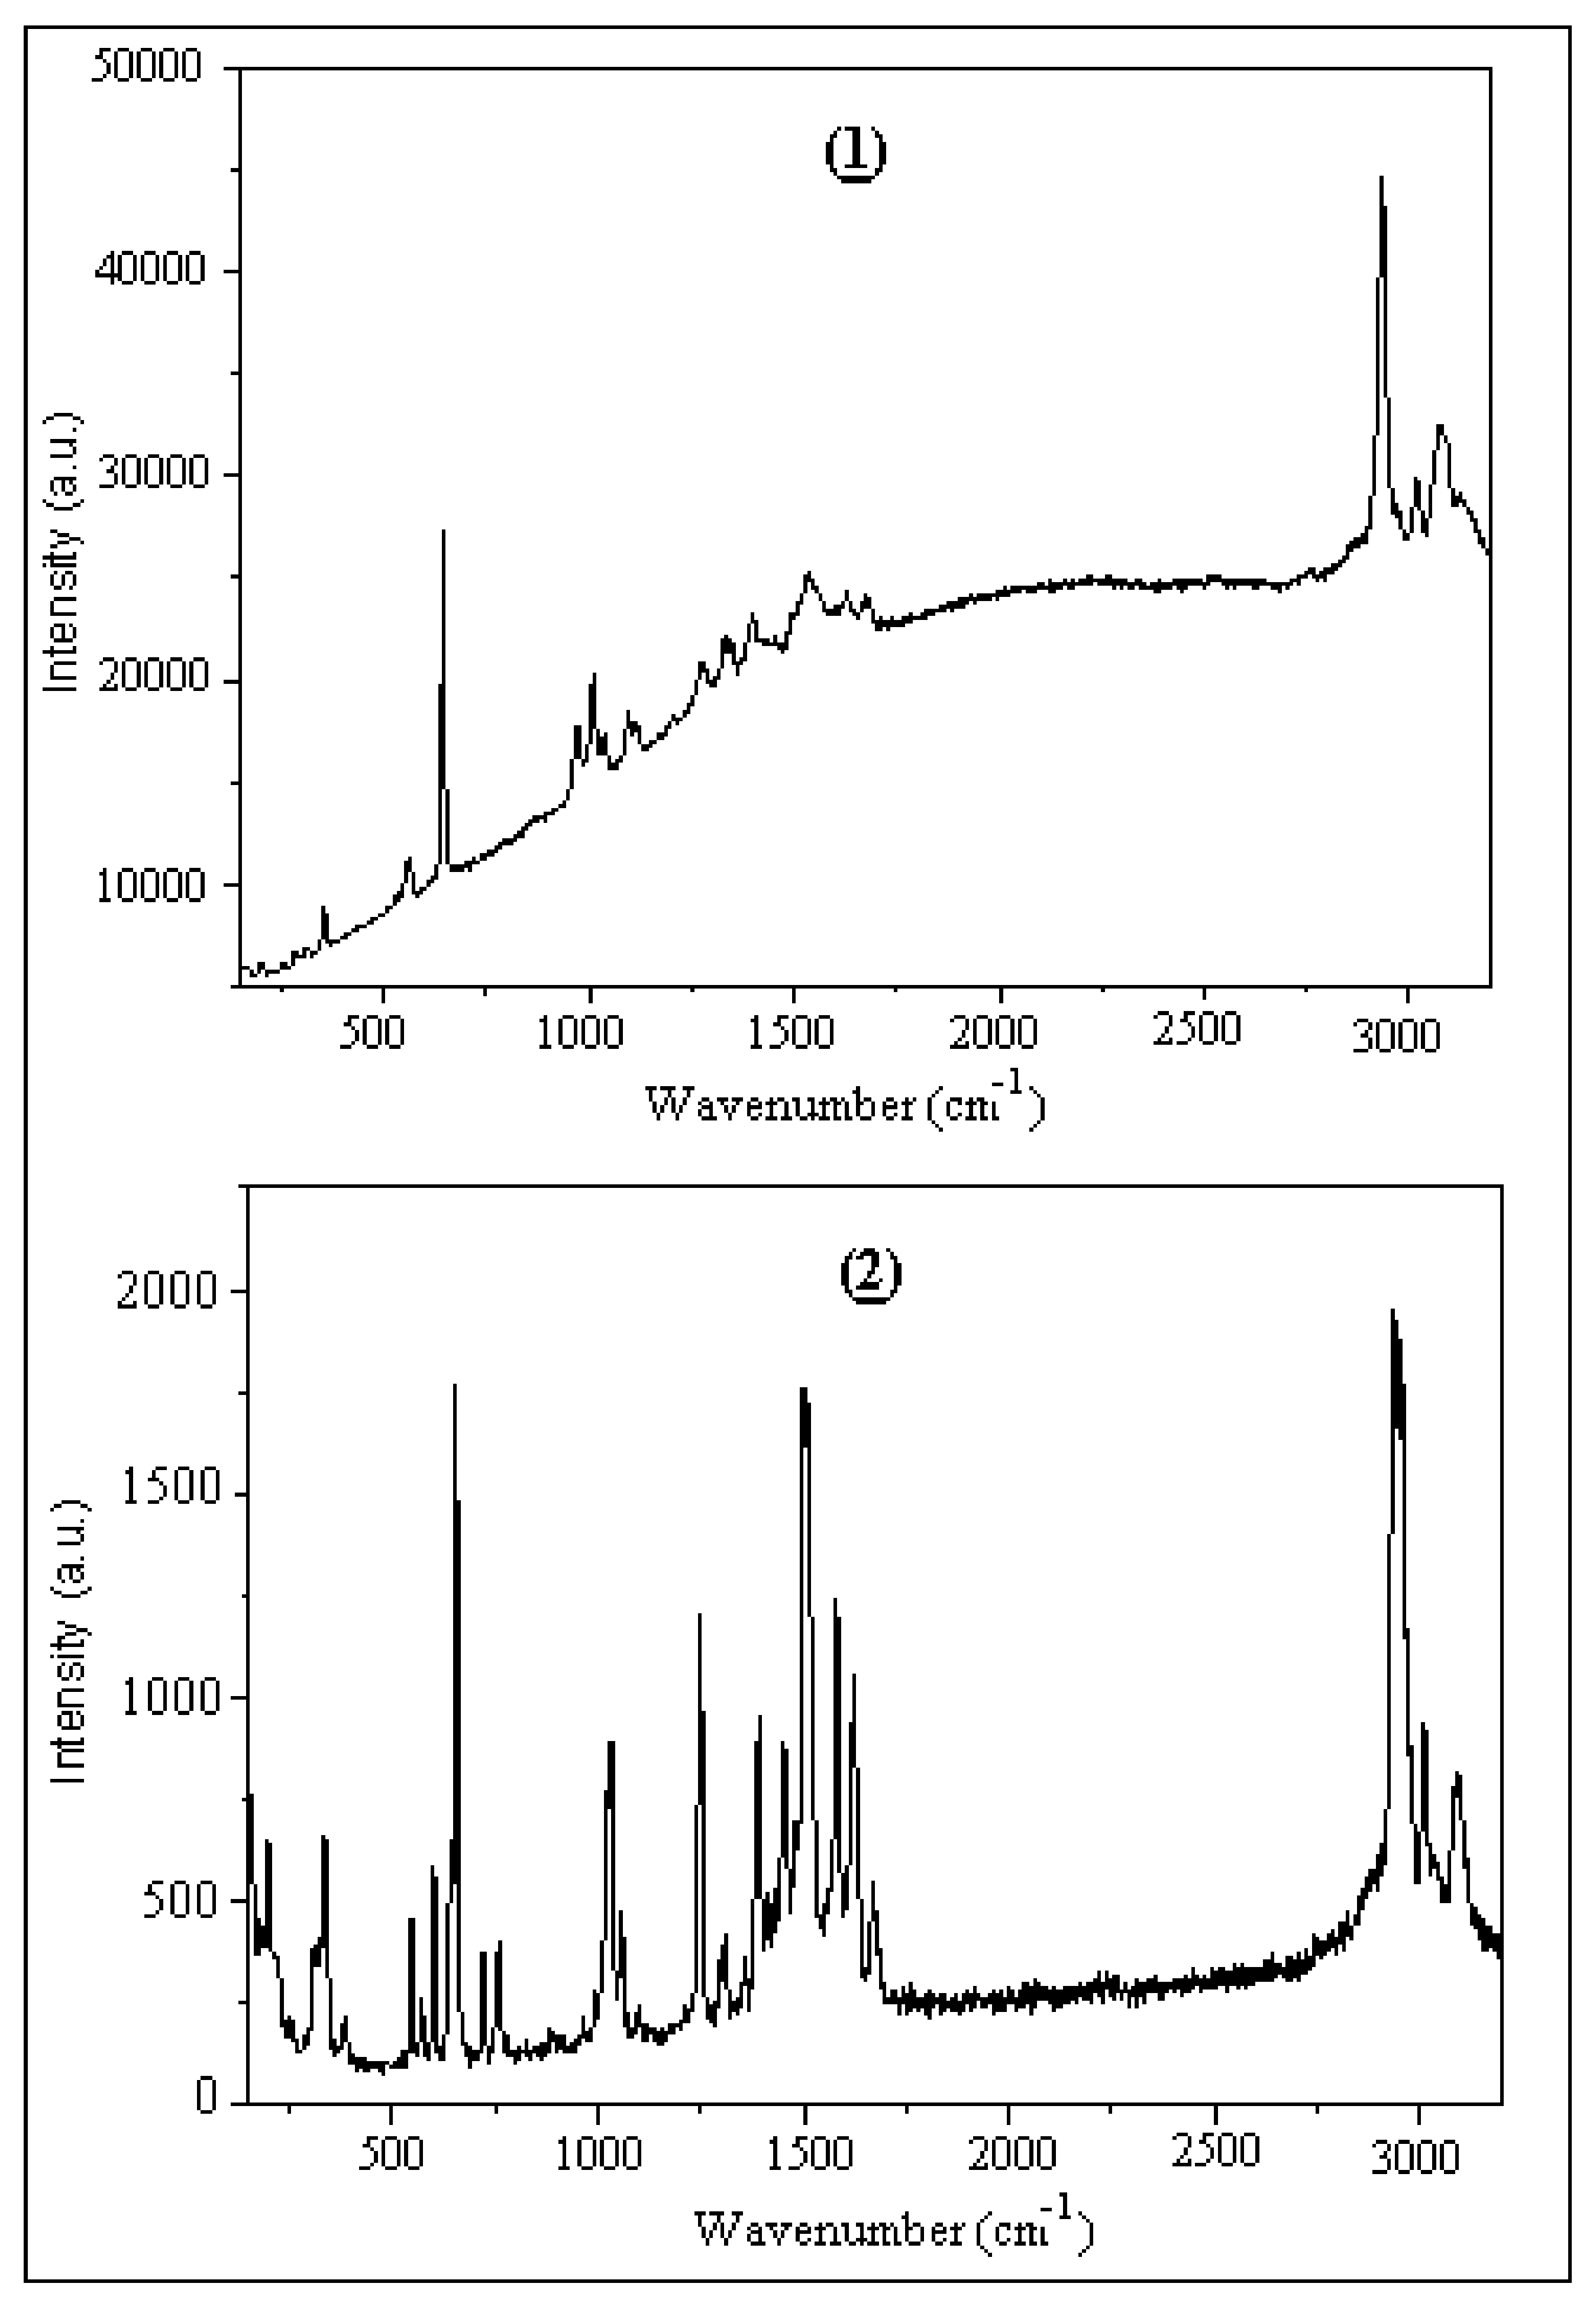
Figure 16.
Experimental Raman spectra of (1) and (2).
Figure 16.
Experimental Raman spectra of (1) and (2).
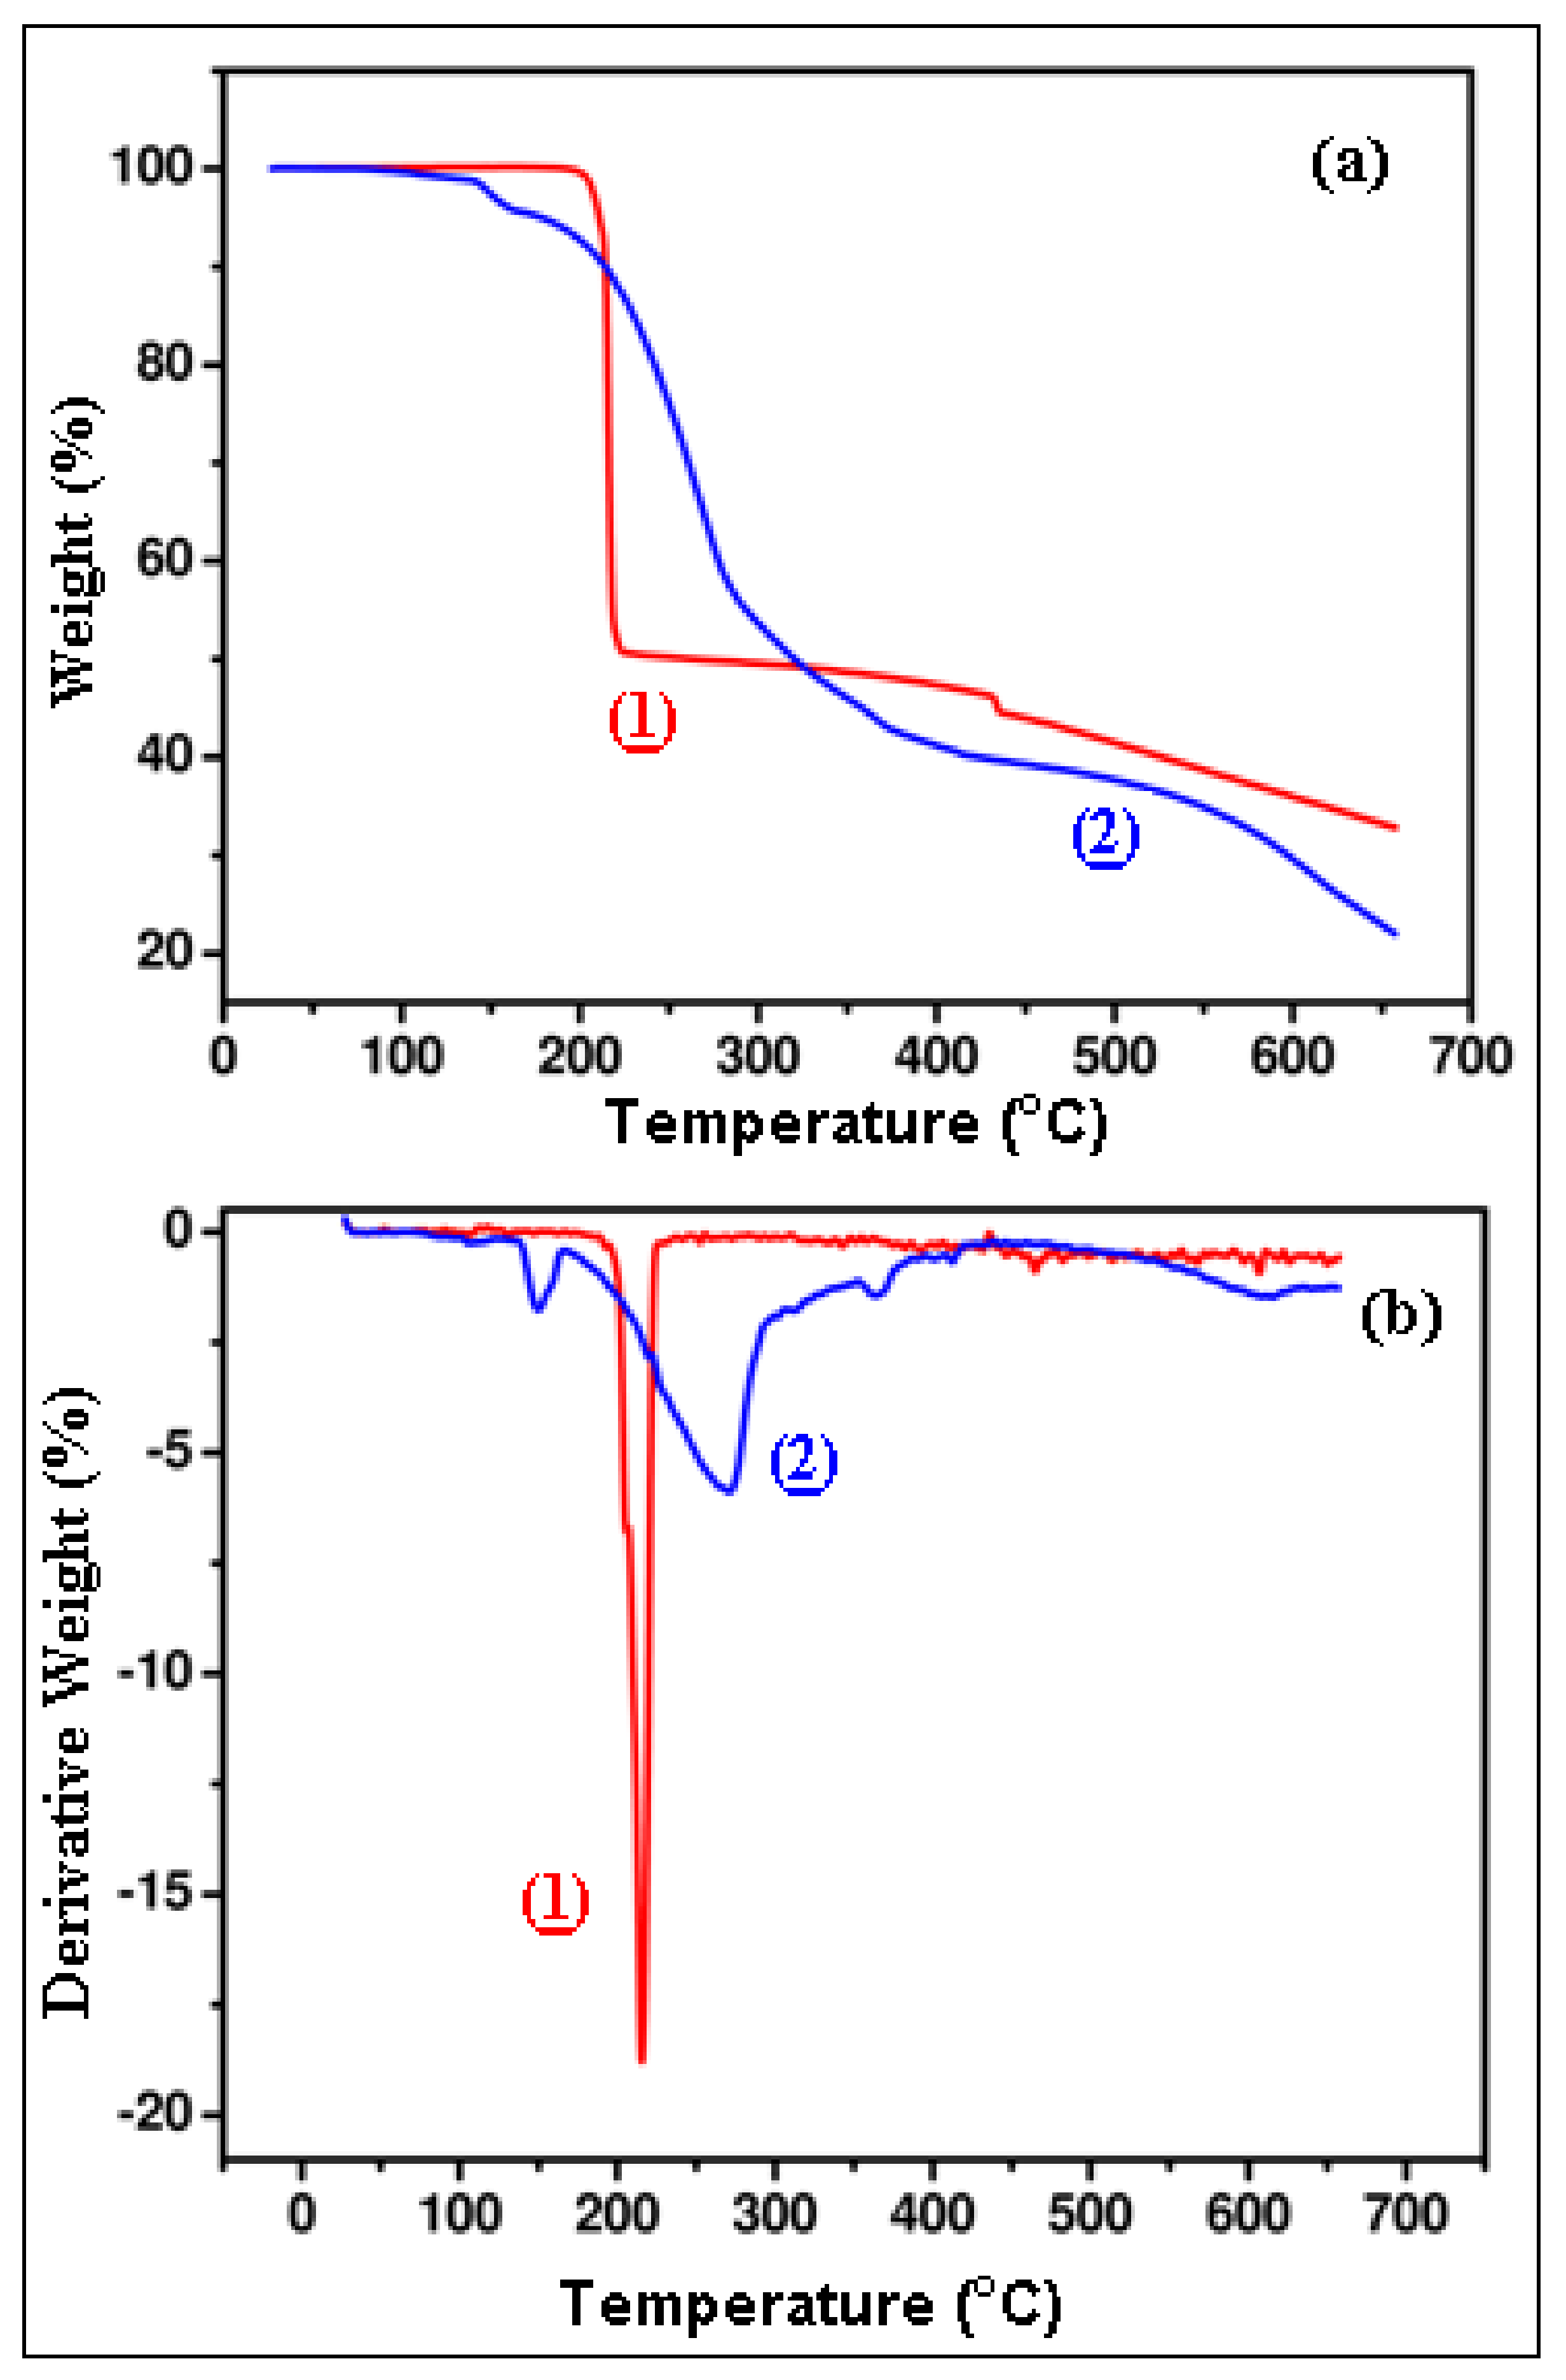
Figure 17.
TGA (a) and DTG (b) curve of complexes (1) and (2).
Figure 17.
TGA (a) and DTG (b) curve of complexes (1) and (2).
Table 1.
Experimental details of compounds (1) and (2).
Table 1.
Experimental details of compounds (1) and (2).
| | (1) | (2) |
|---|
| Crystal Data | |
| Chemical formula | [Cu(C6H8N2O)2(H2O)2](NO3)2.2H2O | (C6H10N3)2[CoCl4].H2O |
| Mr | 507.91 | 467.08 |
| Crystal system, space group | Monoclinic, C2/c | Triclinic,
|
| Temperature (K) | 295 | 295 |
| a, b, c (Å) | 15.7637 (5), 13.2632 (6), 10.7707 (4) | 7.9579 (3), 9.5893 (3), 14.7692 (4) |
| α, β, γ (°) | 90, 104.185 (2), 90 | 98.820 (2), 105.398 (2), 105.6600 (19) |
| V (Å3) | 2183.24 (15) | 1015.06 (6) |
| Z | 4 | 2 |
| Radiation type | Mo Kα | Mo Kα |
| µ (mm−1) | 1.07 | 1.38 |
| Crystal size (mm) | 0.23 × 0.16 × 0.12 | 0.47 × 0.23 × 0.15 |
| Data collection | |
| Diffractometer | Nonius Kappa CCD | Nonius Kappa CCD |
| Absorption correction | Multi-scan | Multi-scan |
| Tmin, Tmax | 0.759, 0.860 | 0.612, 0.832 |
No. of measured, independent and
observed [I > 2σ(I)] reflections | 12,522, 3187, 2231 | 13,967, 4362, 3804 |
| Rint | 0.045 | 0.070 |
| (sin θ/λ)max (Å−1) | 0.704 | 0.639 |
| Refinement | |
| R[F2 > 2σ(F2)], wR(F2), S | 0.044, 0.136, 1.03 | 0.050, 0.148, 1.06 |
| No. of reflections | 3187 | 4362 |
| No. of parameters | 163 | 249 |
| No. of restraints | 5 | 3 |
| Δρmax, Δρmin (e Å−3) | 0.42, −0.46 | 0.94, −0.61 |
Table 2.
Selected bond distances and angles (Å, °) in complex (1).
Table 2.
Selected bond distances and angles (Å, °) in complex (1).
| Cu1—O2W | 1.924 (2) | O2W—Cu1—O1W | 180.0 |
| Cu1—O1W | 1.936 (3) | O2W—Cu1—N1 | 89.48 (5) |
| Cu1—N1 | 1.970 (2) | O1W—Cu1—N1 | 90.52 (5) |
| N1—C1 | 1.312 (3) | O1—C4—N1 | 116.0 (2) |
| N1—C4 | 1.386 (3) | C1—N1—C4 | 121.5 (2) |
| N2—C1 | 1.337 (3) | C1—N2—C2 | 121.7 (2) |
| N2—C2 | 1.372 (3) | N1—C1—N2 | 121.0 (2) |
| O1—C4 | 1.244 (3) | O1—C4—C3 | 127.2 (2) |
| C1—C5 | 1.484 (3) | N1—C4—C3 | 116.8 (2) |
| C2—C3 | 1.347 (4) | N1—C1—C5 | 119.6 (2) |
| C2—C6 | 1.501 (3) | N2—C1—C5 | 119.4 (2) |
| C3—C4 | 1.427 (4) | C3—C2—N2 | 118.6 (2) |
| | | C3—C2—C6 | 125.5 (3) |
| | | N2—C2—C6 | 115.9 (3) |
| | | C2—C3—C4 | 120.3 (2) |
Table 3.
Hydrogen bonding parameters (Å, °) in complex (1).
Table 3.
Hydrogen bonding parameters (Å, °) in complex (1).
| D-H…A | D-H | D…A | H…A | D-H…A |
|---|
| O1W-H…O3 | 0.82(3) | 2.775(3) | 2.00(3) | 155(3) |
| O3W-H…O1 | 0.86(3) | 2.725(3) | 1.87(2) | 173(2) |
| N2-H…O2 i | 0.86(3) | 2.828(3) | 1.98(3) | 166(3) |
| C6-H…O4 ii | 0.96 | 3.357(4) | 2.54 | 141 |
| O3W-H…O2 iii | 0.81(2) | 2.821(3) | 2.04(2) | 160(3) |
| O2W-H…O3W iv | 0.83(3) | 2.634(3) | 1.80(3) | 173(3) |
Table 4.
Selected bond distances and angles (Å, °) in complex (2).
Table 4.
Selected bond distances and angles (Å, °) in complex (2).
| Co1—Cl4 | 2.2437 (8) | Cl4—Co1—Cl1 | 110.97 (3) |
| Co1—Cl1 | 2.2719 (7) | Cl4—Co1—Cl3 | 109.39 (3) |
| Co1—Cl3 | 2.2783 (8) | Cl1—Co1—Cl3 | 107.12 (3) |
| Co1—Cl2 | 2.2843 (8) | Cl4—Co1—Cl2 | 112.39 (4) |
| N1—C4 | 1.368 (4) | Cl1—Co1—Cl2 | 109.06 (3) |
| N1—C1 | 1.404 (4) | Cl3—Co1—Cl2 | 107.72 (3) |
| N2—C2 | 1.335 (3) | C4—N1—C1 | 118.6 (2) |
| N2—C1 | 1.336 (3) | C2—N2—C1 | 118.1 (2) |
| N3—C2 | 1.325 (3) | C10—N4—C7 | 119.2 (3) |
| N4—C10 | 1.353 (4) | C7—N5—C8 | 117.8 (2) |
| N4—C7 | 1.398 (4) | N2—C1—N1 | 122.1 (2) |
| N5—C7 | 1.341 (3) | N5—C7—N4 | 121.9 (3) |
| N5—C8 | 1.343 (4) | N5—C7—C11 | 117.5 (2) |
| N6—C8 | 1.329 (4) | N4—C7—C11 | 120.6 (2) |
| C1—C5 | 1.493 (4) | N5—C8—C9 | 121.7 (2) |
| C2—C3 | 1.353 (3) | C8—C9—C10 | 121.2 (2) |
| C3—C4 | 1.358 (3) | N4—C10—C9 | 118.1 (2) |
| C7—C11 | 1.482 (4) | N4—C10—C12 | 125.0 (3) |
| C8—C9 | 1.352 (3) | C9—C10—C12 | 116.9 (3) |
| C9—C10 | 1.366 (4) | | |
| C10—C12 | 1.485 (4) | | |
Table 5.
Hydrogen-bond geometry (Å, °) in complex (2).
Table 5.
Hydrogen-bond geometry (Å, °) in complex (2).
| D—H···A | D—H | H···A | D···A | D—H···A |
|---|
| C3—H3···Cl3 i | 0.93 | 2.18 | 3.107 (2) | 174 |
| C5—H5B···Cl1 ii | 0.96 | 2.83 | 3.761 (3) | 164 |
| C6—H6B···Cl4 ii | 0.96 | 2.86 | 3.776 (3) | 160 |
| C9—H4B···O1W | 0.86 | 1.85 | 2.709 (3) | 172 |
| N4B—H4B···O1W | 0.86 | 1.85 | 2.709 (3) | 172 |
| C11—H11A···Cl1 iii | 0.96 | 2.88 | 3.660 (3) | 139 |
| C11—H11C···Cl1 ii | 0.96 | 2.94 | 3.855 (3) | 160 |
| C12—H12A···Cl4 iv | 0.96 | 2.92 | 3.695 (3) | 138 |
| C12—H12B···Cl3 v | 0.96 | 2.95 | 3.742 (4) | 140 |
| N3—H1N···N5 vi | 0.88 (5) | 2.20 (5) | 3.080 (3) | 175 (4) |
| N3—H2N···Cl1 i | 0.82 (4) | 2.53 (4) | 3.301 (3) | 156 (3) |
| N6—H3N···N2 vi | 0.85 (4) | 2.21 (4) | 3.054 (3) | 168 (4) |
| N6—H4N···Cl2 i | 0.82 (4) | 2.53 (4) | 3.333 (3) | 165 (3) |
| N1—H6N···Cl1 ii | 1.06 (4) | 2.90 (4) | 3.794 (3) | 141 (2) |
| O1W—H1O···Cl4 iv | 0.88 (2) | 2.43 (2) | 3.288 (3) | 167 (5) |
| O1W—H2O···Cl2 i | 0.86 (2) | 2.57 (3) | 3.295 (3) | 142 (4) |
Table 6.
Chemical proportions on the Hirshfeld surface and major interactions of the compound (1): (a) around the Cu(dimpyr)2(H2O)2, (b) around the nitrate group, and (c) around the water molecule.
Table 6.
Chemical proportions on the Hirshfeld surface and major interactions of the compound (1): (a) around the Cu(dimpyr)2(H2O)2, (b) around the nitrate group, and (c) around the water molecule.
| (a) |
| % surface | C | H | Cu | N | O | |
| 3.9 | 63.2 | 1.8 | 3.65 | 27.45 |
| % contacts (Major contacts) | H…C | H…H | H…O | Cu…O | Cu…N | C…N |
| 4.5 | 34.7 | 48.5 | 0.9 | 1.7 | 0.9 |
| Enrichment (x,y) | 0.91 | 0.86 | 1.39 | 0.91 | 12.93 | 3.16 |
| (b) | |
| % surface | O | H | N | Cu | C |
| 47.9 | 44.8 | 4.15 | 0 | 3.15 |
| % contacts (Major contacts) | H…O | C…O | O…N | N…H | C…N |
| 86.9 | 3.8 | 3.1 | 2.7 | 2.5 |
| Enrichment (x,y) | 2.024 | 0.12 | 0.77 | 0.72 | 9.56 |
| (c) |
| % surface | O | H | N | Cu | C |
| 32.55 | 62.55 | 1.55 | 0 | 3.35 |
| % contacts (Major contacts) | H…O | C…H | H…N | C…0 | H…H |
| 64.1 | 5.7 | 3.1 | 1 | 26.1 |
| Enrichment (x,y) | 1.57 | 1.36 | 1.59 | 0.04 | 0.66 |
Table 7.
Chemical proportions on the Hirshfeld surface and major interactions of the compound (2): (a) around the both organic cations, (b) around the [CoCl4]2− and (c) around the water molecule.
Table 7.
Chemical proportions on the Hirshfeld surface and major interactions of the compound (2): (a) around the both organic cations, (b) around the [CoCl4]2− and (c) around the water molecule.
| (a) |
| % surface | C | H | Cl | Co | N | O |
| 3.35 | 71.75 | 15.5 | 0.35 | 7.05 | 2 |
| % contacts (Major contacts) | H…C | H…H | H…Cl | H…N | H…O | C…Cl |
| 3.7 | 47.4 | 27.1 | 13.2 | 4 | 3.0 |
| Enrichment (x,y) | 0.76 | 0.92 | 1.21 | 1.30 | 1.39 | 2.88 |
| (b) | |
| % surface | O | H | Cl | Co | C |
| 0 | 45.85 | 49.75 | 0.85 | 2.65 |
| % contacts (Major contacts) | H…Co | C…Cl | H…Cl | N…Cl | Cl…Cl |
| 1.7 | 5.3 | 90 | 1.8 | 1.2 |
| Enrichment (x,y) | 2.18 | 2.01 | 1.97 | 2.01 | 0.04 |
| (c) |
| % surface | O | H | Cl | Co | |
| 1.75 | 66.35 | 18.3 | 0.25 |
| % contacts (Major contacts) | H…O | H…H | H…Cl | H…Co | |
| 30.4 | 32.6 | 36.6 | 0.5 |
| Enrichment (x,y) | 1.50 | 0.74 | 1.50 | 1.50 | |
Table 8.
Mulliken charge distribution of all atoms in (1).
Table 8.
Mulliken charge distribution of all atoms in (1).
| Atom | Ligand 1 | Ligand 2 |
|---|
| Cu | 0.407335 | |
| O(H2O) | −0.955452 | −0.942977 |
| H(H2O) | 0.571069 | 0.571055 |
| 0.571090 | 0.571056 |
| O1 | −0.469507 | −0.469515 |
| N3 | −0.284973 | −0.284893 |
| C4 | 0.398537 | 0.398420 |
| N5 | −0.481902 | −0.481840 |
| H(N5) | 0.478716 | 0.478724 |
| C6 | 0.348863 | 0.348852 |
| C7 | −0.380229 | −0.380187 |
| H(C7) | 0.258462 | 0.258462 |
| C8 | 0.596716 | 0.596699 |
| C9 | −0.728109 | −0.728081 |
| H(C9) | 0.283773 | 0.283764 |
| 0.273563 | 0.273566 |
| 0.288628 | 0.288631 |
| C10 | −0.772044 | −0.772060 |
| H(C10) | 0.263820 | 0.263822 |
| 0.266023 | 0.266025 |
| 0.263049 | 0.263051 |
Table 9.
Mulliken charge distribution of organic atoms and water in (2).
Table 9.
Mulliken charge distribution of organic atoms and water in (2).
| Atom | Ligand 1 | Ligand 2 |
|---|
| N1 | −0.083517 | −0.059330 |
| C2 | 0.056605 | 0.300591 |
| N3 | −0.403974 | −0.412695 |
| H(N3) | 0.478801 | 0.476501 |
| C4 | 0.225706 | −0.010665 |
| C5 | −0.211047 | 0.274921 |
| H(C5) | 0.217385 | 0.322349 |
| C6 | 0.572397 | 0.031016 |
| C7 | −0.712512 | −0.755072 |
| H(C7) | 0.286429 | 0.272446 |
| 0.227082 | 0.291717 |
| 0.298176 | 0.246250 |
| C8 | −0.834715 | −1.000509 |
| H(C8) | 0.296738 | 0.252751 |
| 0.239734 | 0.285858 |
| 0.245535 | 0.281142 |
| N9 | −0.793196 | −0.734756 |
| H(N9) | 0.458123 | 0.454368 |
| 0.433036 | 0.442267 |
| O(H2O) | −0.979320 | |
| H(H2O) | 0.511459 | |
| 0.511926 |
Table 10.
Results of thermal decomposition of the two compounds.
Table 10.
Results of thermal decomposition of the two compounds.
| Complex | T10 * (°C) | T50 * (°C) | R * (%) |
|---|
| (1) | 214.5 | 264 | 32.7 |
| (2) | 214.3 | 320 | 21.9 |
Table 11.
DSC data of the two compounds.
Table 11.
DSC data of the two compounds.
| Complex | Peak | Temperature Range (°C) | Peak Temperature (°C) | Nature of Peak |
|---|
| (1) | 1 | 183–245 | 212 | egzo |
| (2) | 2 | 71–128 | 121 | endo |
| 135–173 | 150 | endo |


 ,
, 


