
High Pressure Behavior of Mascagnite from Single Crystal Synchrotron X-ray Diffraction Data

 and
and
Abstract
:1. Introduction
2. Materials and Methods
3. Results
3.1. Compressibility
3.2. Crystal Structure Evolution with Pressure
4. Discussion
- (1)
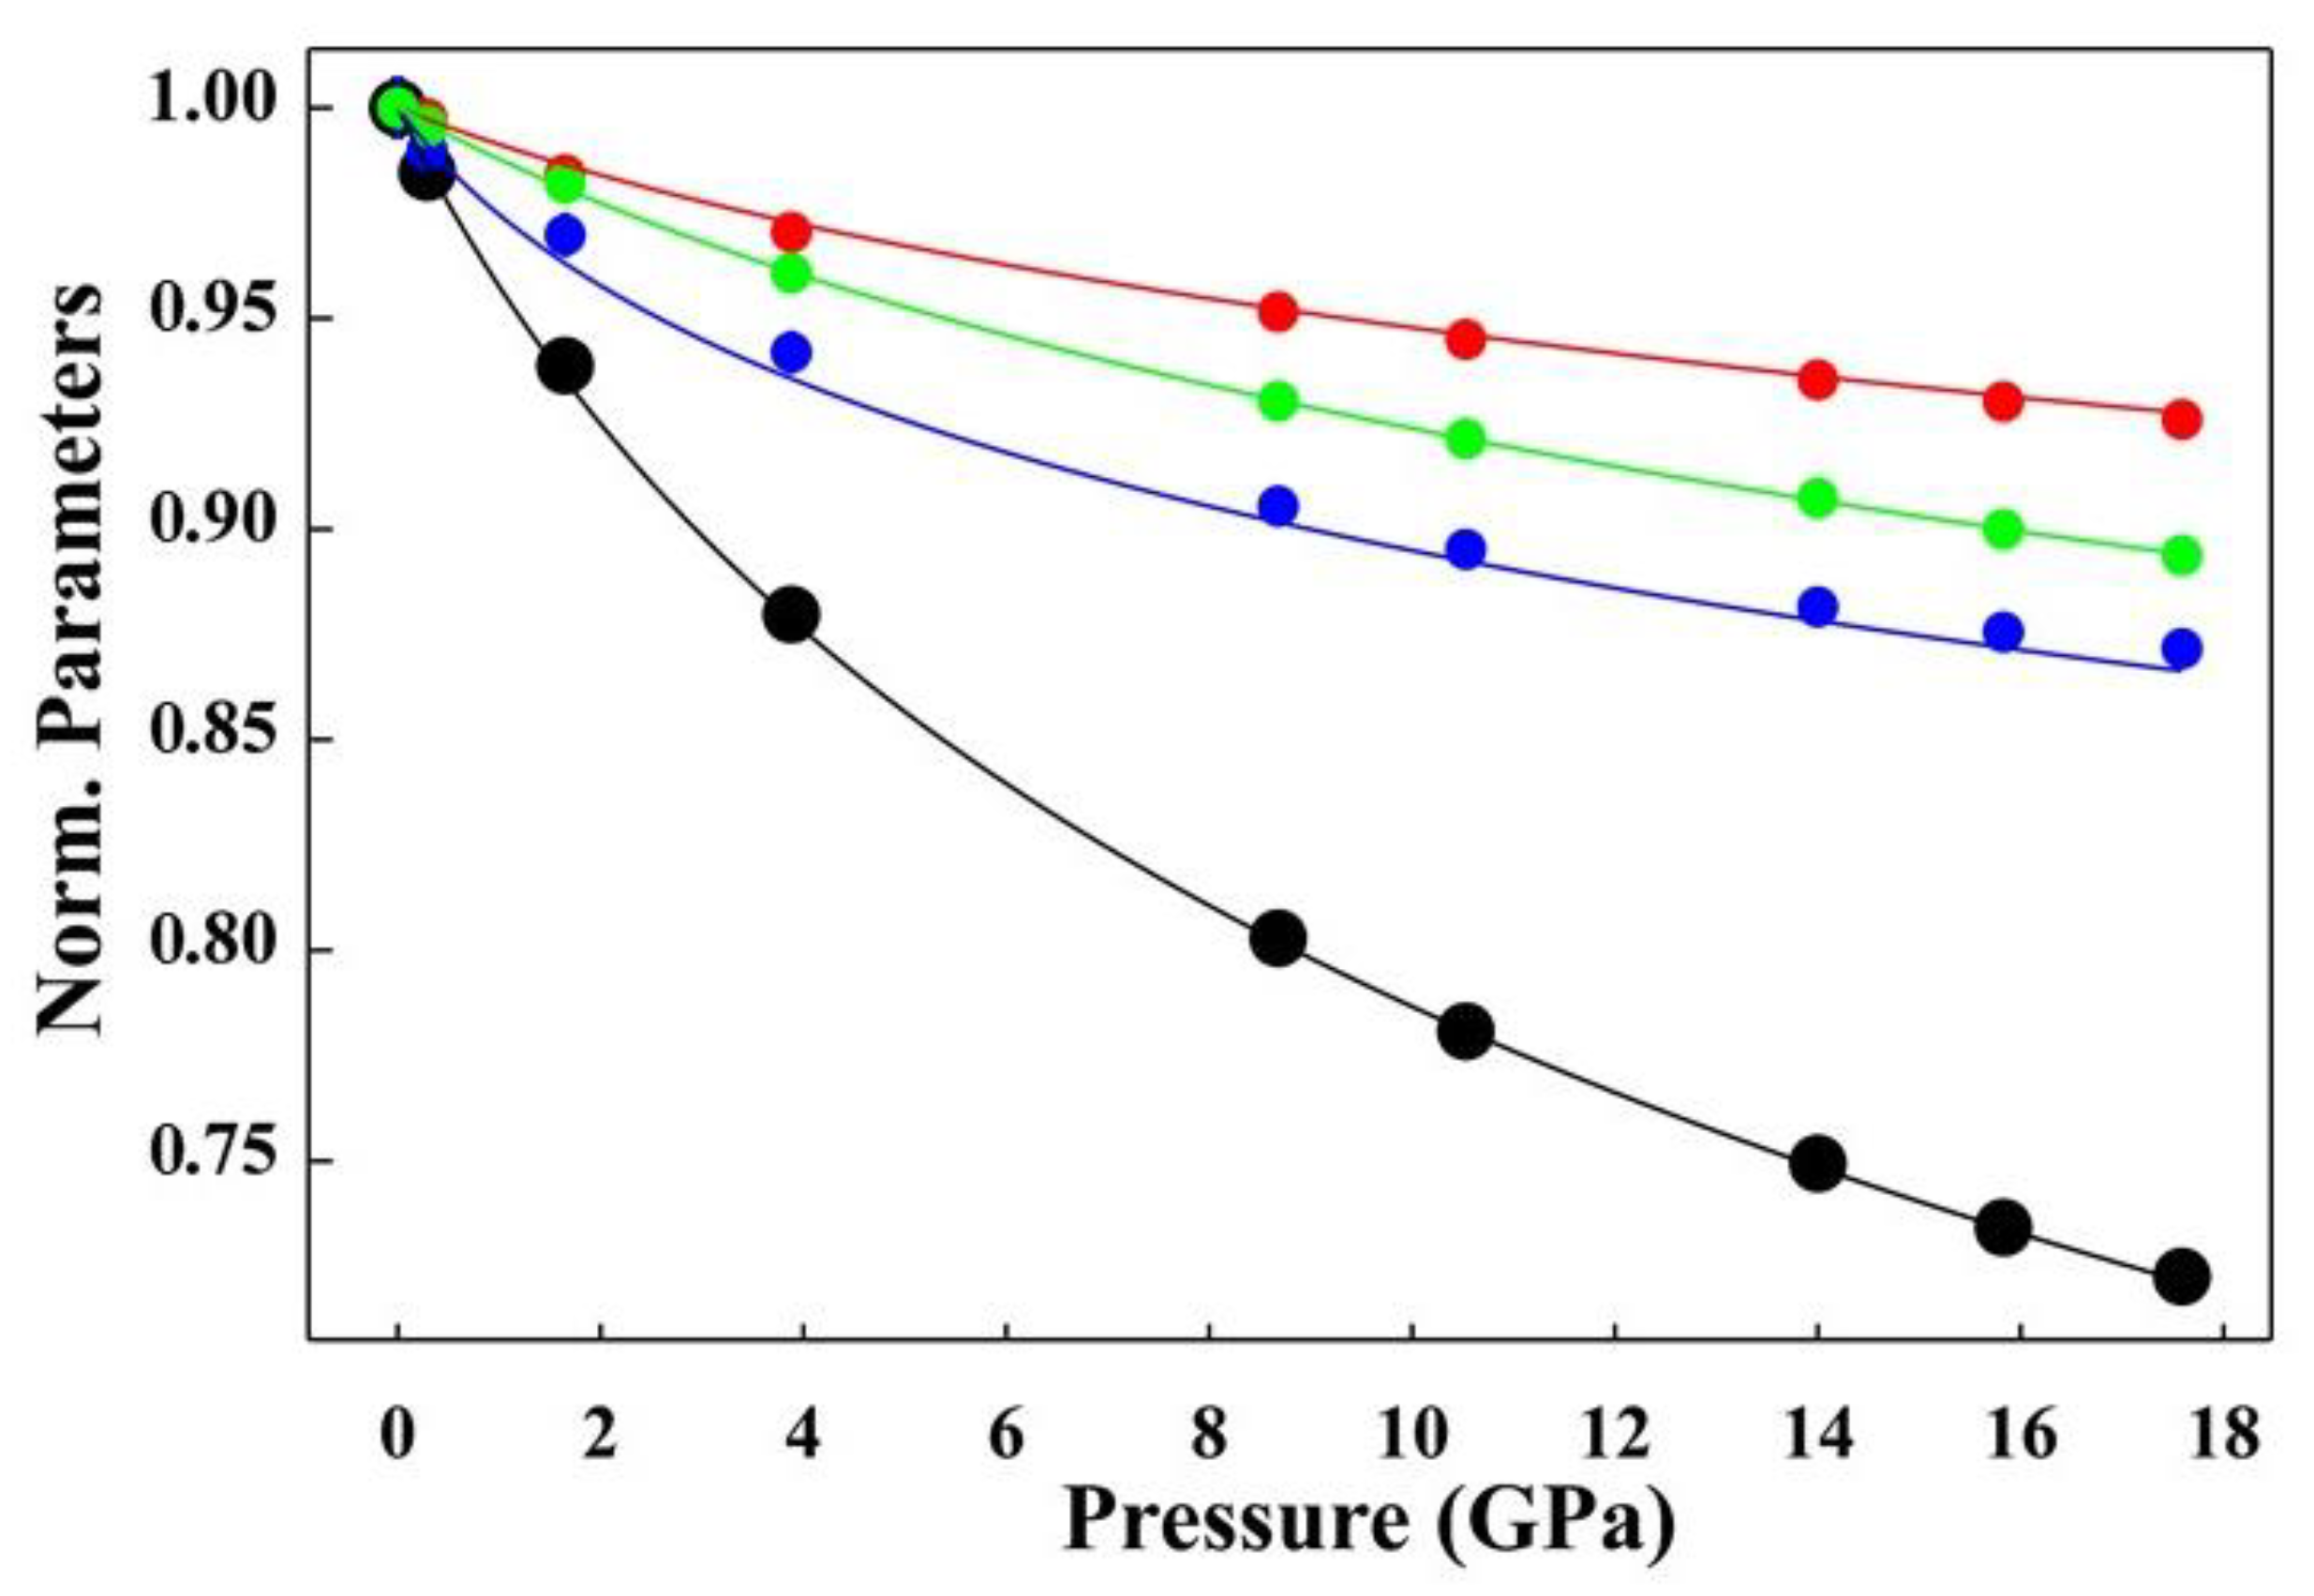
- A strong increase in the density of mascagnite was found in the investigated change in the pressure density from 1.656 g/cm3 at room pressure to 2.288 g/cm3 at 17.6 GPa, which represents an increase of approximately 30%. The strong anisotropic contraction was observed in the evolution of the lattice parameters, with the a axis the least sensitive parameter and b the most sensitive parameter. The comparison between the structures refined at room temperature and those under 233 K [1] showed that the a parameter slightly increases, whereas b and c decrease. Shmyt’ko et al. [29] reported an anomalous increase in the lattice parameter a and the unit cell volume at temperatures below the ferroelectric phase transition point (Tc = 223 K).
- (2)
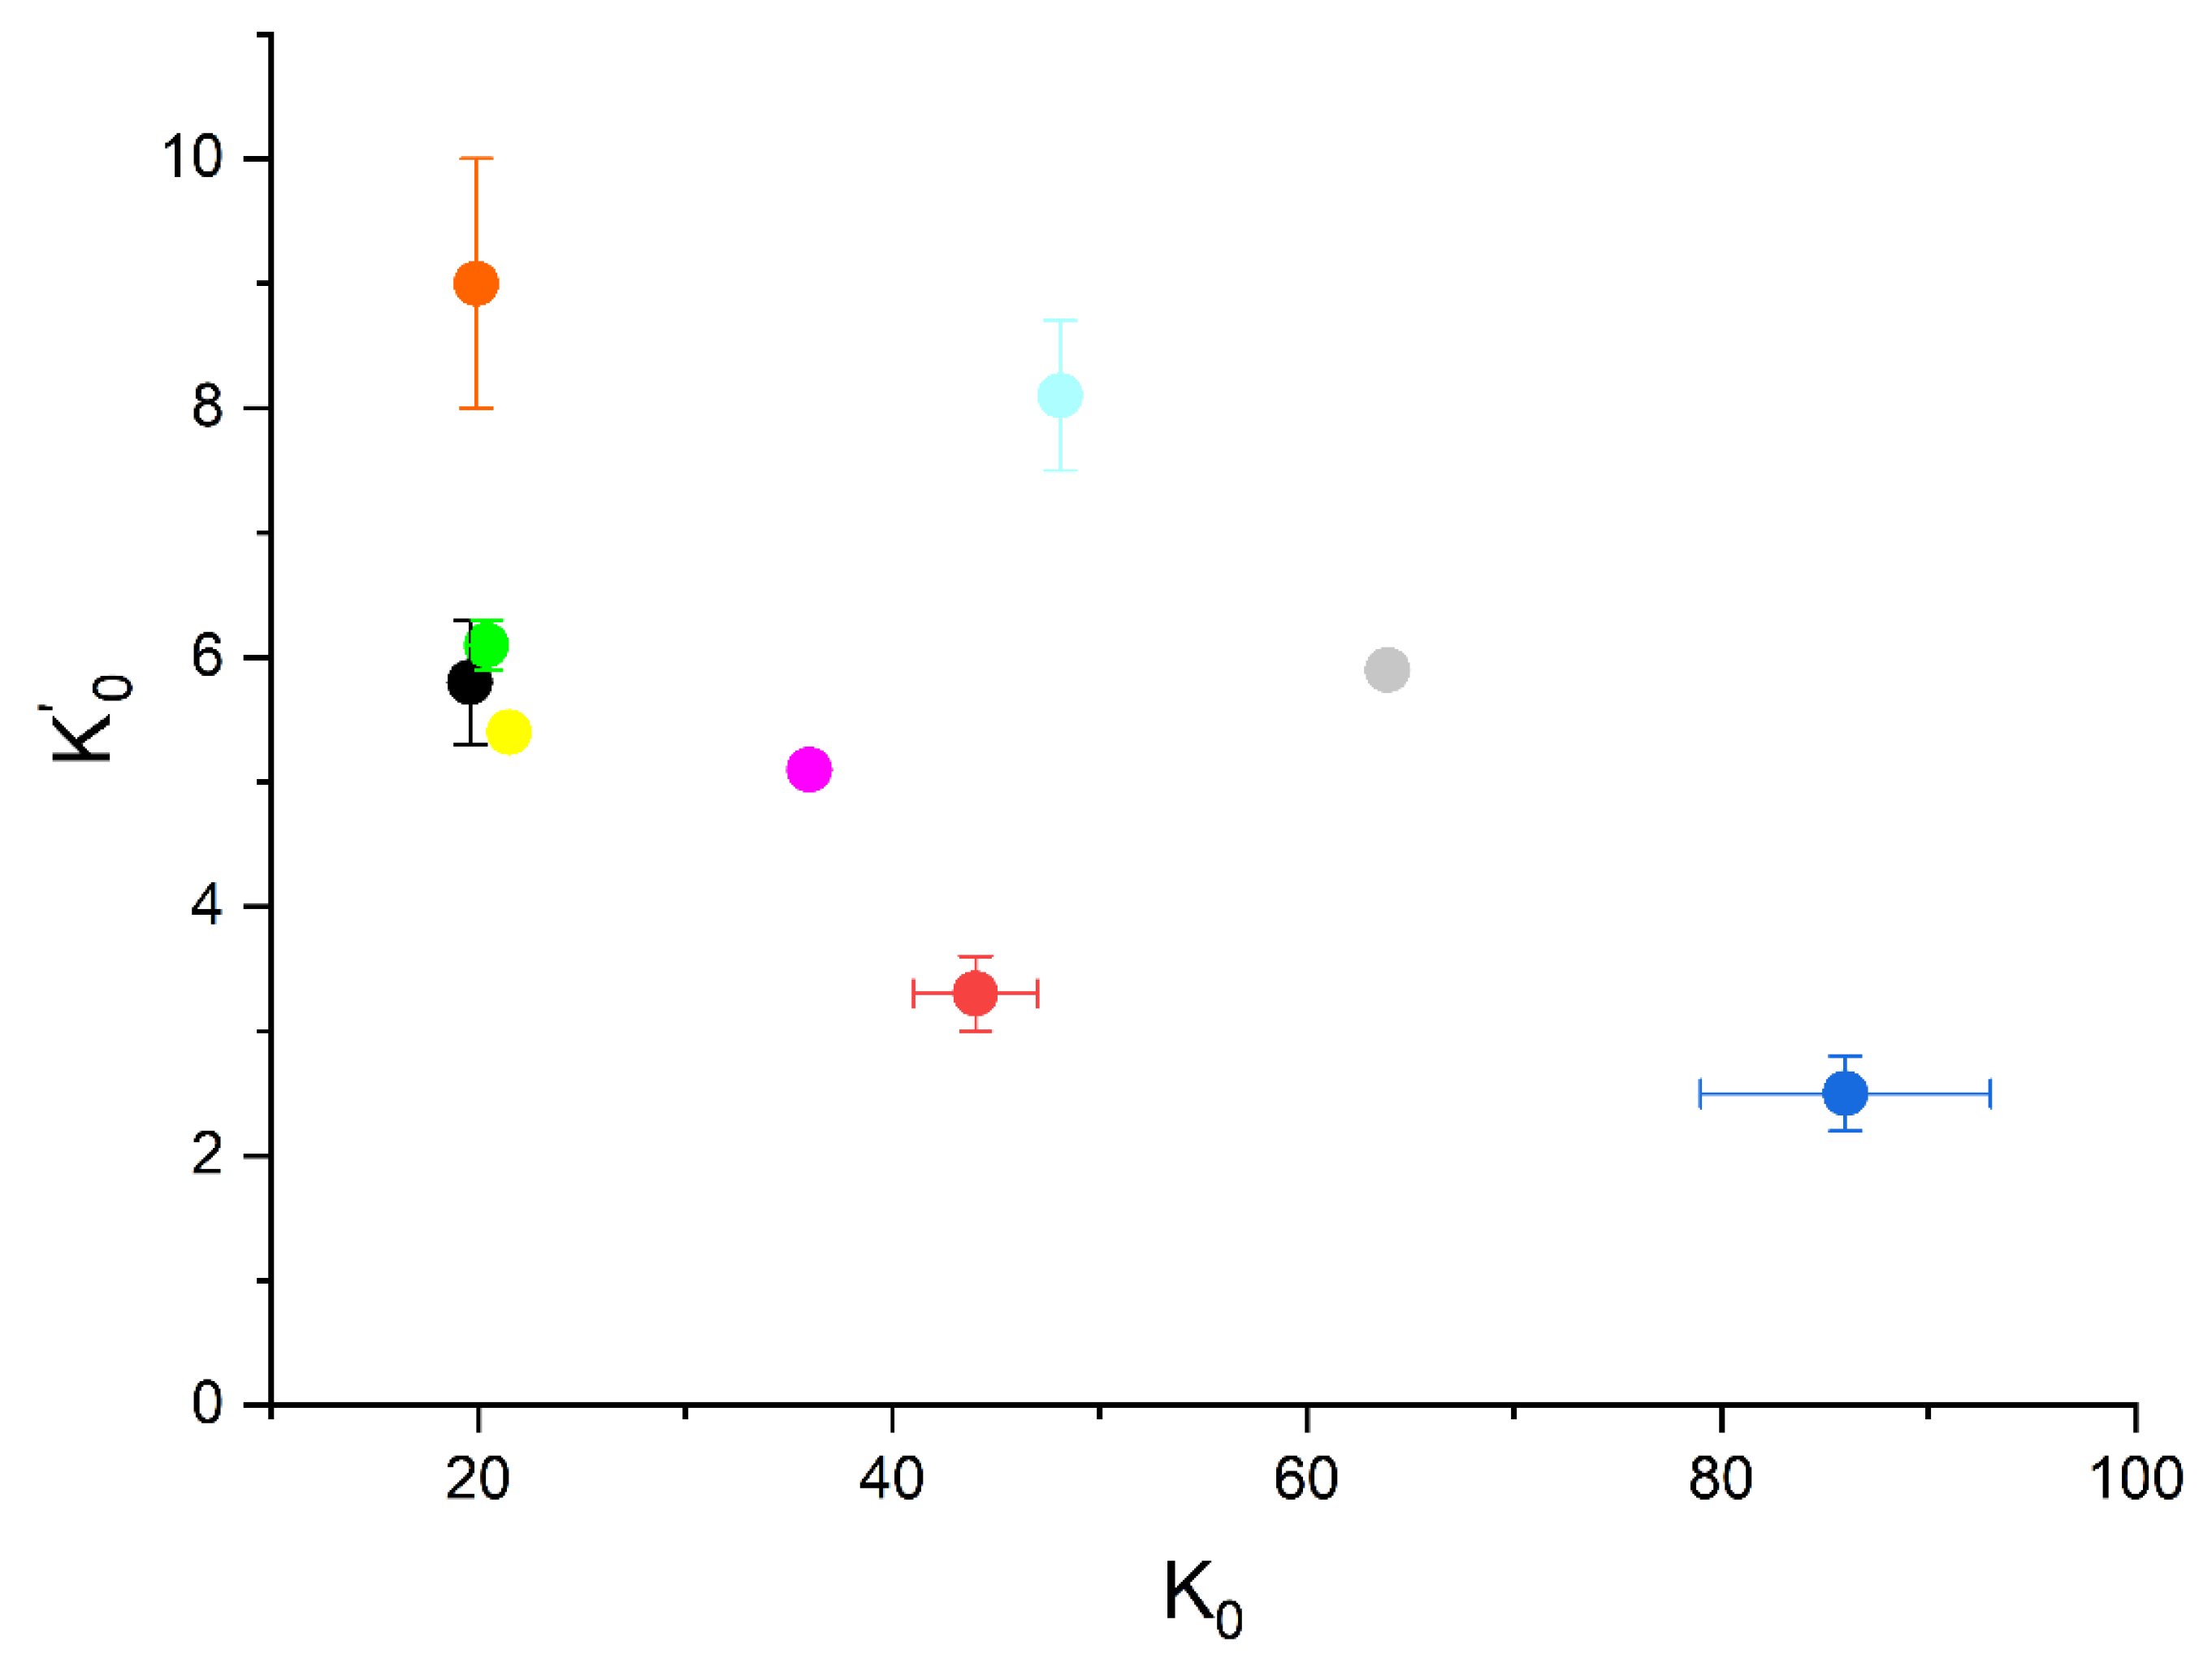
- The bulk modulus of mascagnite was compared with those of other sulfates in combination with different metals, Na, Ca, and Mg, and a different amount of water molecules (Table 5 and Figure 6). Specifically, the K0 and K’0 of mirabilite, gypsum, bassanite, anhydrite, and other hydrated magnesium-sulfates, such as kiesertite, epsomite, and meridianiite, were compared. An inverse relationship between K’ and K0 is evident, which usually occurs in materials with a large range of bulk moduli values. High K’ values are found in soft materials, where the compressibility decreases drastically with the increase in pressure. In contrast, hard materials, with high K0 values, usually have low K’ values. In addition, we observed that sulfates with large monovalent cations (NH4+ and Na+: mascagnite and mirabilite) have a lower bulk modulus with respect to sulfates with small earth alkaline cations, namely, Ca and Mg. (e.g., gypsum and kieserite). Verma and Kumar [30] found a linear relation between the cation charges and the bulk modulus in a large suite series of cubic perovskites. Moreover, the number of water molecules appears to affect the bulk moduli, as observed in the Mg-sulfates suite of kieserite, epsomite, and meridianiite, with 1, 7, and 11 water molecules, respectively. The same results were observed by Comodi et al. [31] in a suite of amphiboles with different numbers of water molecules, where the bulk moduli increased as the oxo-component increased, thus reducing the OH content.
- (3)
- The SO4 tetrahedral group is almost incompressible. The reduction in the average bond distances and volumes are not significant, in agreement with those observed in other sulfates. The distortion parameters do not indicate any relevant changes, and the polyhedra are quite regular at room and high pressures. Nonetheless, the different evolutions of the S-O bond distance along the a and b axes partially explain the different compressibility of the lattice parameters: the S-O1 bond length along the a axis slightly increases with P, whereas the S-O2 bond distance directed along the b axis decreases with P.
- (4)
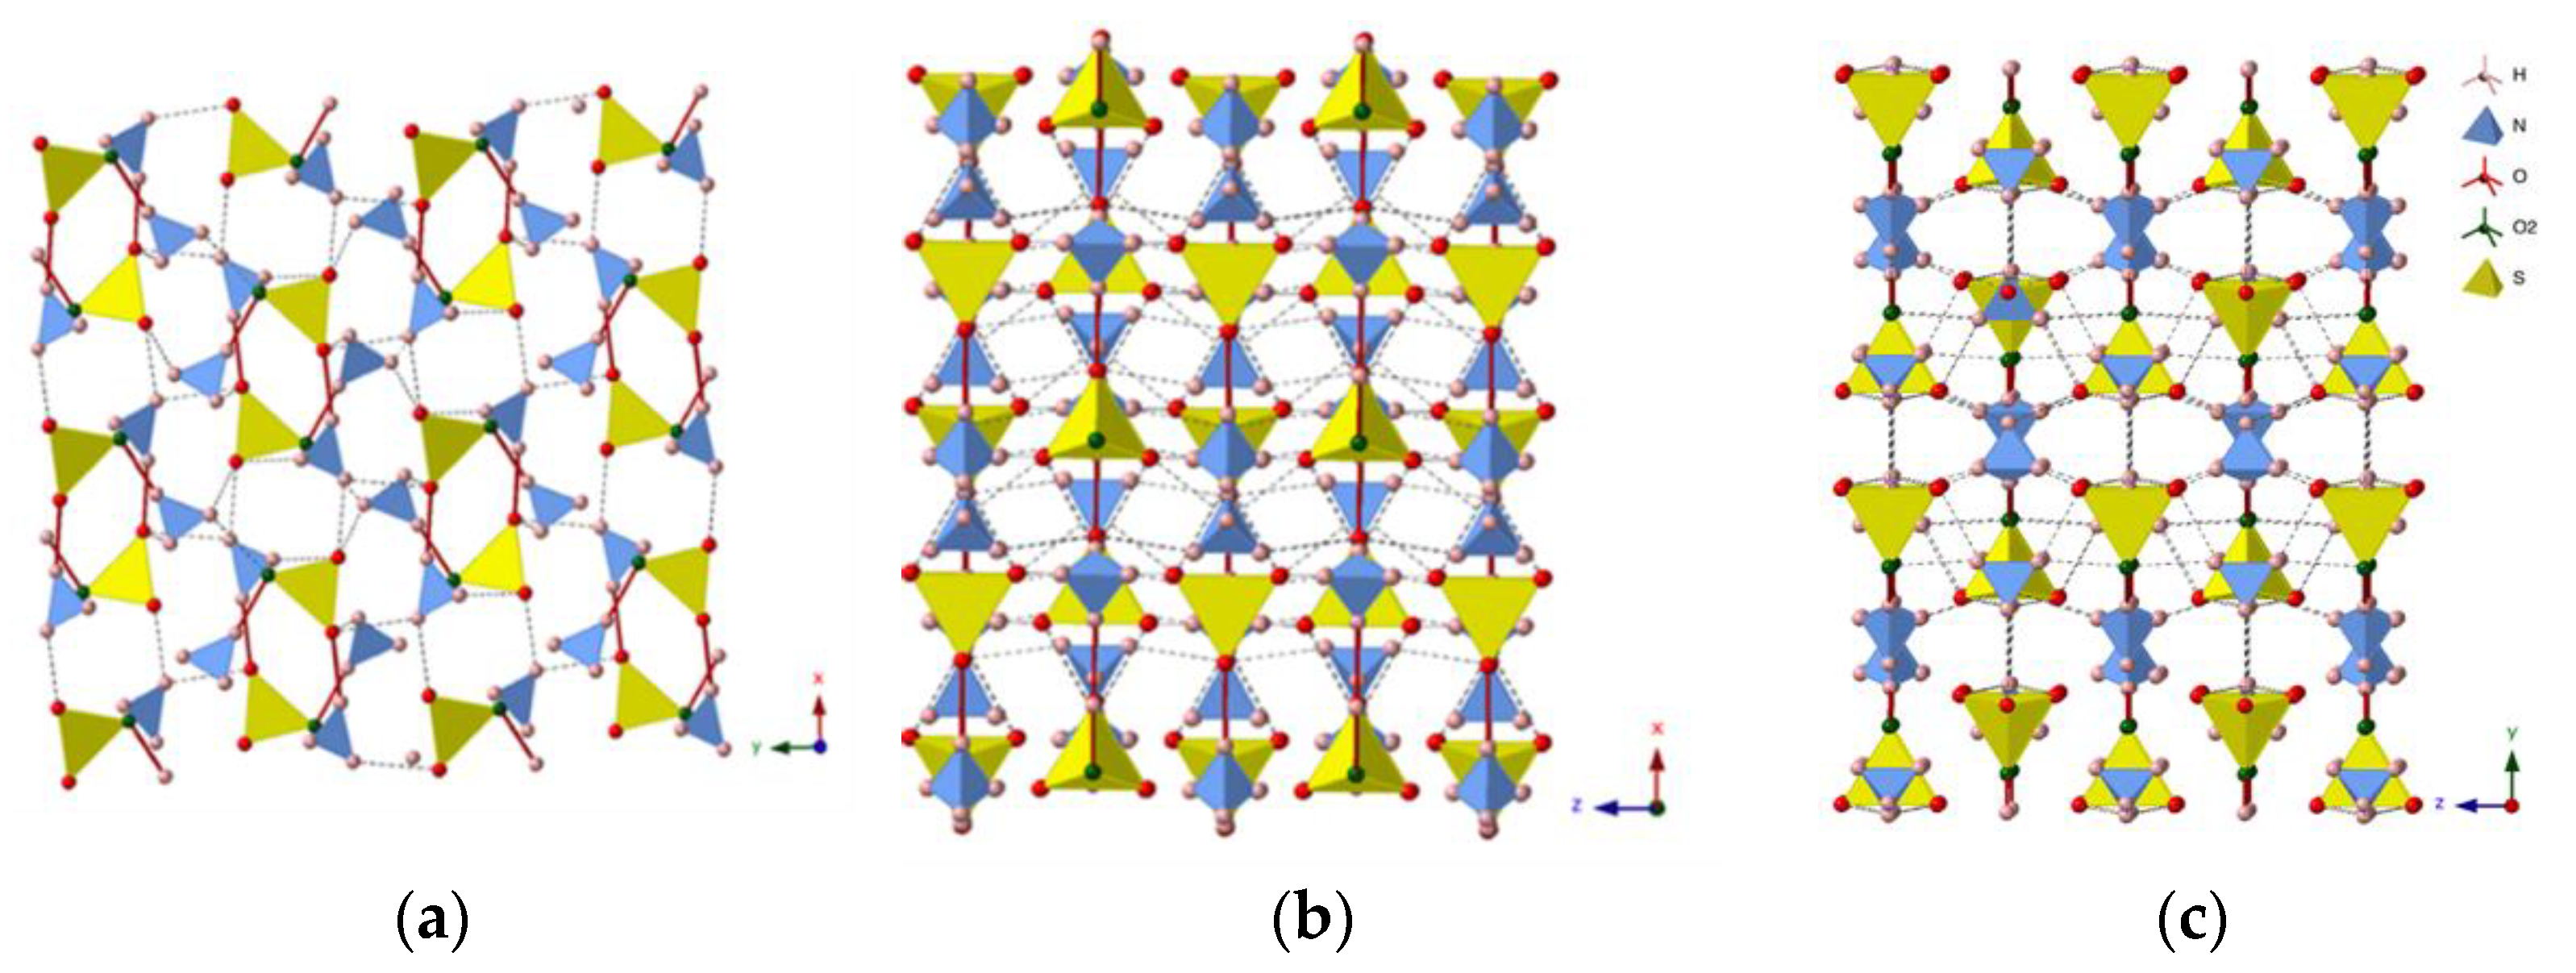
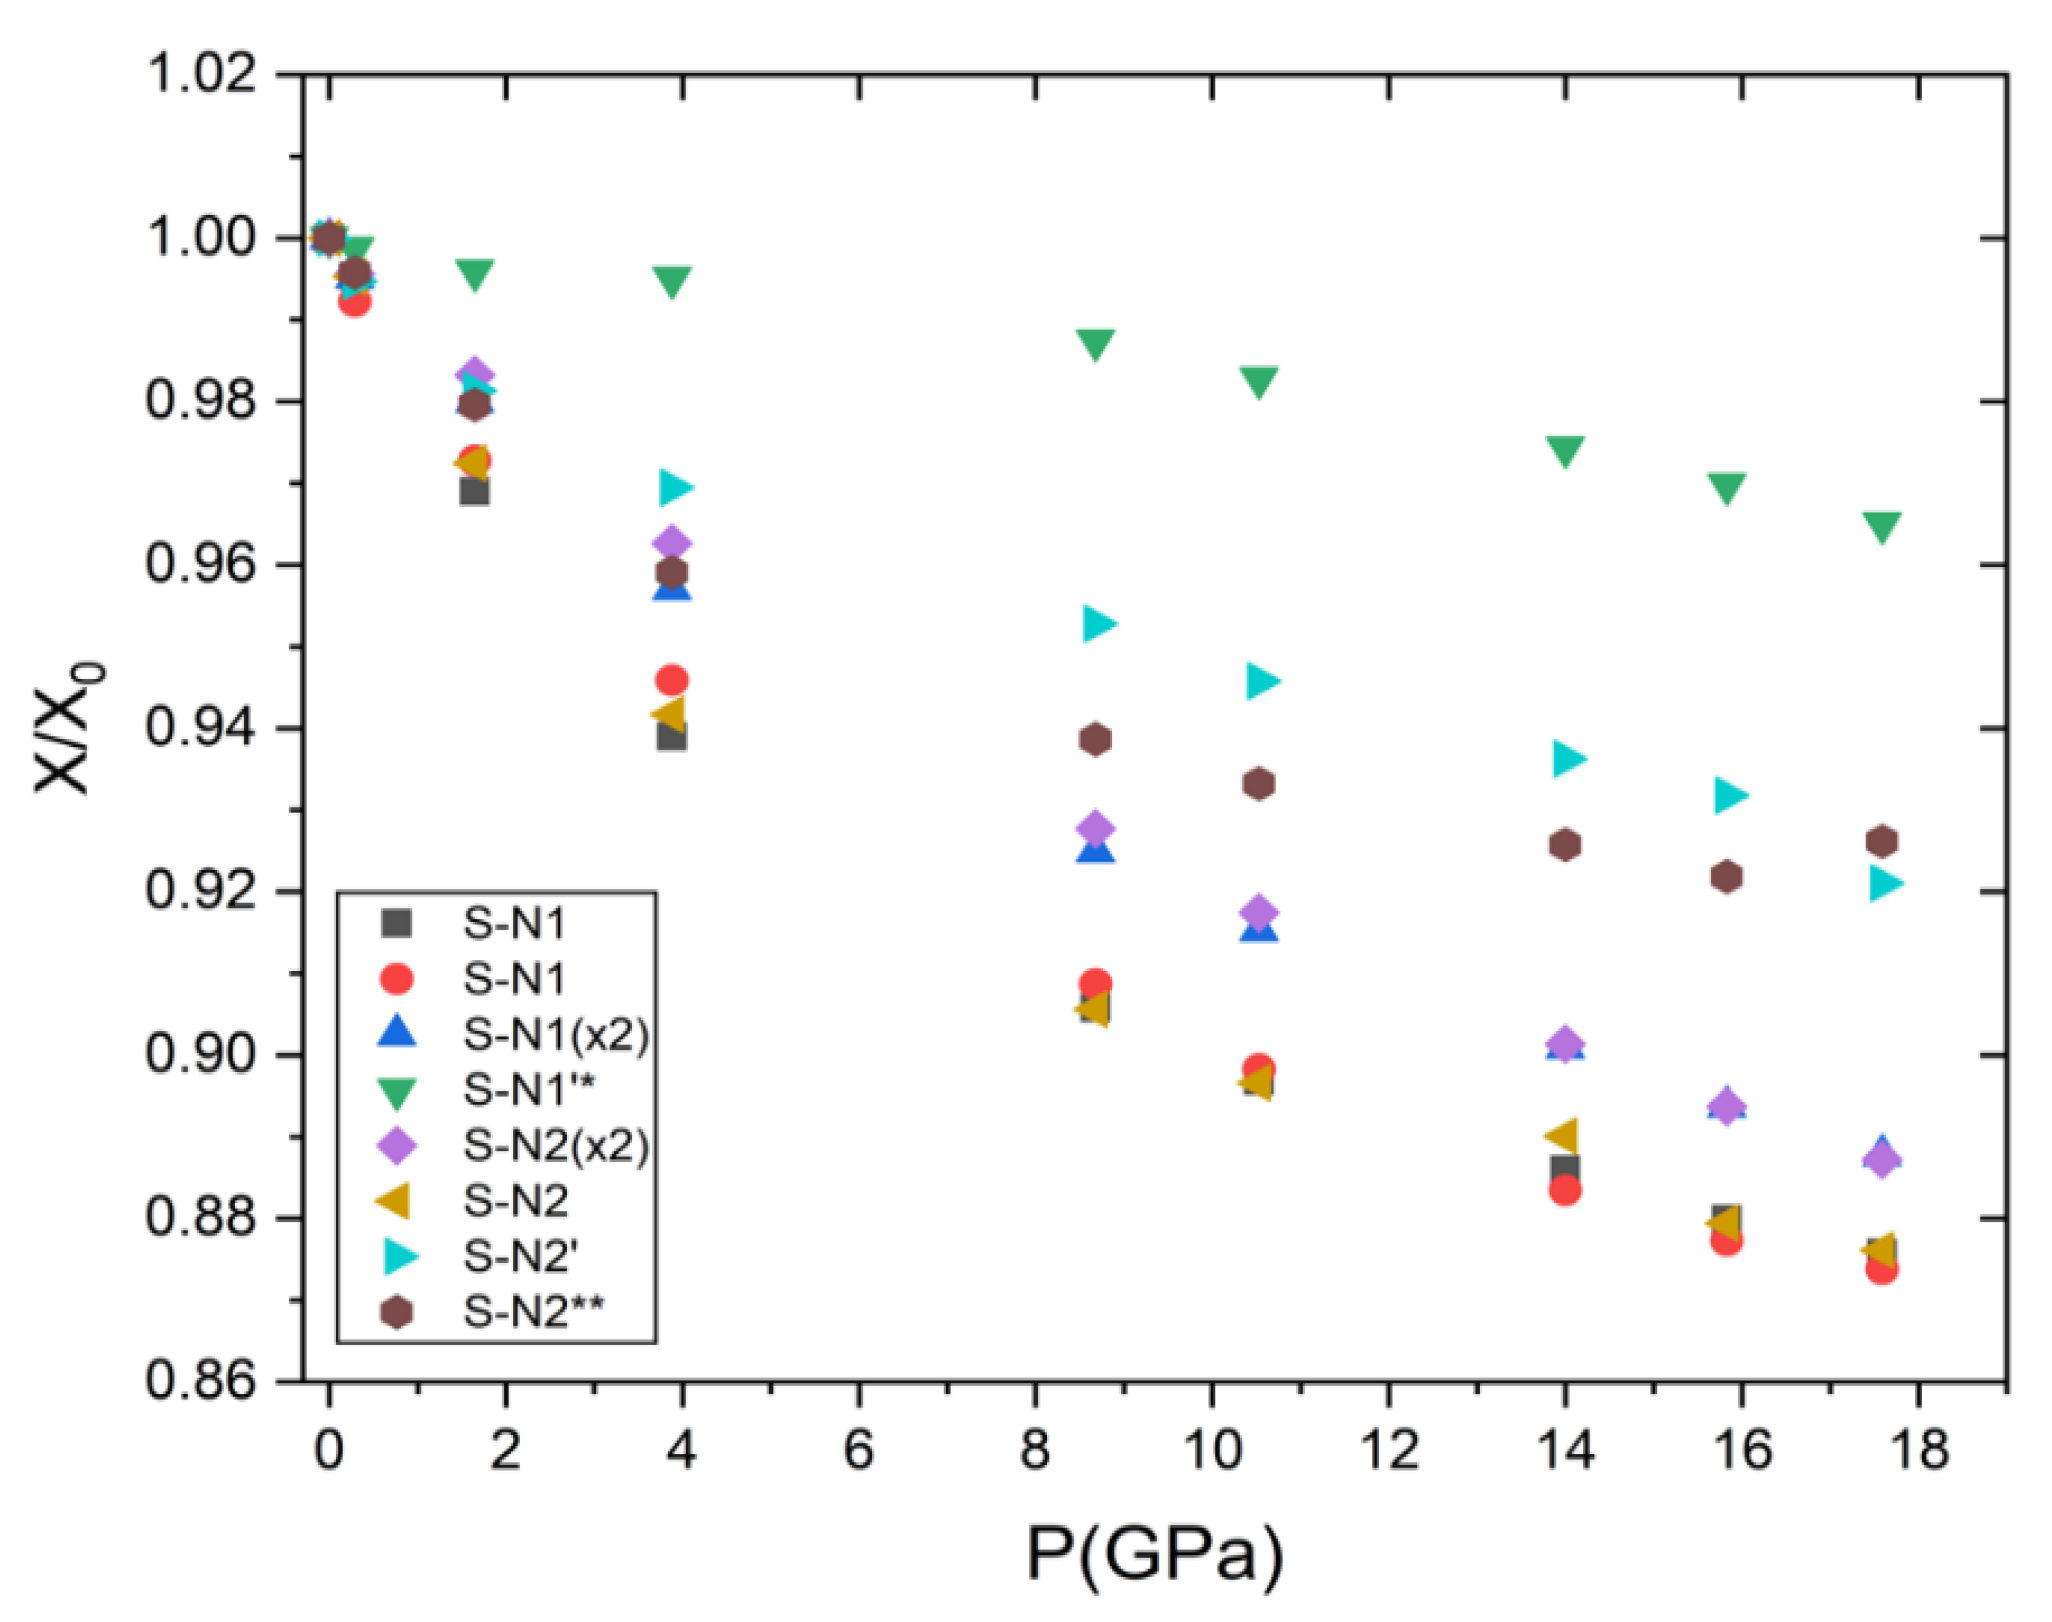
- The representation of the mascagnite structure can be simplified with the [010] layer formed by lamellas, which consists of two layers of tetrahedra: layers with SO4 and N1H4 tetrahedra are alternated with layers containing only N2H4 groups. The interlayer connections, determined by measuring the S-N distances along the b axis, are softer than the connections along a and c axes. Indeed, the strongest hydrogen bonds, with distances below 2 Å, are along the a axis, thus explaining the anisotropic behavior of mascagnite.
- (5)
- The evolution of bonds and intermolecular distances, as already described for lattice parameters, did not show any discontinuity within the investigated pressure range. This was a definitively different behavior than that observed at low temperature by Malec et al. [4,7], who, with a series of single crystal X-ray diffraction measurements in the temperature range of 273–163 K, showed a dynamical effect at the ferrielectric phase transition. A strong discontinuity in the evolution of tetrahedral bond lengths and angles, and in those intermolecular distances at 233 K, was described by Iqbal and Christoe [2]. The characterization of the transition as a mix of displacive and order-disorder natures involving an H-bond system reorganization, as reported by Iqbal and Christoe [2], could not be verified at high pressure. It is likely that, at ambient temperature compression, the pressure did not affect the order-disorder and the displacive effects were too small to be detected by X-ray diffraction analysis.
- (6)
- In ammonium silicate buddingtonite collected by infrared spectroscopy under pressure, Vennari et al. [16] found that the increased hydrogen bonds between the ammonium group and the silicate framework does not occur under compression and the NH4+ group only appears as a guest ion in the aluminosilicate framework. They concluded that this lack of interaction may have an impact on the stability of ammoniated minerals and may favor nitrides of fluid phases as the N carrier in the deep mantle. However, they suggested that, in cold environments, specifically, at low temperature and high pressure, ammonium may be retained and thus play a primary role in the processing of N in the mantle through the subduction zone.
5. Conclusions
Supplementary Materials
Author Contributions
Funding
Acknowledgments
Conflicts of Interest
References
- Schlemper, E.O.; Hamilton, W.C. Neutron-Diffraction Study of the Structures of Ferroelectric and Paraelectric Ammonium Sulfate. Int. J. Chem. Phys. 1966, 44, 4498–4509. [Google Scholar] [CrossRef]
- Iqbal, Z.; Christoe, C.W. Raman scattering study of ferroelectric phase transition in ammonium sulphate. Solid State Commun. 1976, 18, 269–273. [Google Scholar] [CrossRef]
- Malcherek, T. Displacive Phase Transitions in Mineral Behavior at Extreme Conditions. In European Mineralogical Union Notes in Mineralogy; Miletich, R., Ed.; EMU Notes, Eötvös University Press: Budapest, Hungary, 2005; Volume 7. [Google Scholar]
- Malec, L.M.; Brela, M.Z.; Stadnicka, K.M. Displacive or Order-Disorder Phase Transition? The H-bond Dynamics in Multicaloric Ammonium Sulfate. Acta Mater. 2021, 209, 116782. [Google Scholar] [CrossRef]
- Lim, A.R. Paraelectric-Ferroelectric Phase Transition of (NH4)2SO4 Single Crystals by 14N NMR. J. Korean Magn. Reson. Soc. 2017, 21, 63–66. [Google Scholar] [CrossRef]
- Mikhaleva, E.A.; Flerov, I.N.; Gorev, M.V.; Bondarev, V.S.; Bogdanov, E.V. Features of the Behaviour of the Barocaloric Effect near Ferroelectric Phase Transition Close to the Tricritical Point. Crystals 2020, 10, 51. [Google Scholar] [CrossRef] [Green Version]
- Malec, L.M.; Gryl, M.; Stadnicka, K.M. Unmasking the mechanism of structural para-to ferroelectric phase transition in (NH4)2SO4. Inorg. Chem. 2018, 57, 4340–4351. [Google Scholar] [CrossRef]
- Dixit, C.K.; Tauqeer, M. Electrical Properties and Phase Transitions of Ammonium Sulphate Ferroelectrics. Adv. Mater. 2014, 2, 59. [Google Scholar] [CrossRef] [Green Version]
- Neish, C.D.; Somogyi, Á.; Lunine, J.I.; Smith, M.A. Low temperature hydrolysis of laboratory tholins in ammonia-water solutions: Implications for prebiotic chemistry on Titan. Icarus 2009, 201, 412–421. [Google Scholar] [CrossRef]
- Furukawa, Y.; Nakazawa, H.; Sekine, T.; Kobayashi, T.; Kakegawa, T. Nucleobase and amino acid formation through impacts of meteorites on the early ocean. Earth Planet. Sci. Lett. 2015, 429, 216–222. [Google Scholar] [CrossRef]
- Ojwang, J.G.O.; Stewart McWilliams, R.; Ke, X.; Goncharov, A.F. Melting and dissociation of ammonia at high pressure and high temperature. J. Chem. Phys. 2012, 137, 064507. [Google Scholar] [CrossRef] [PubMed]
- Cruikshank, D.P.; Grundy, W.M.; DeMeo, F.E.; Buie, M.W.; Binzel, R.P.; Jennings, D.E.; Weaver, H.A. The surface compositions of Pluto and Charon. Icarus 2015, 246, 82–92. [Google Scholar] [CrossRef] [Green Version]
- Neveu, M.; Desch, S.J.; Castillo-Rogez, J.C. Aqueous geochemistry in icy world interiors: Equilibrium fluid, rock, and gas compositions, and fate of antifreezes and radionuclides. Geochim. Cosmochim. Acta 2017, 212, 324–371. [Google Scholar] [CrossRef]
- Dalle Ore, C.M.; Cruikshank, D.P.; Protopapa, S.; Scipioni, F.; McKinnon, W.B.; Cook, J.C.; Ennico, K. Detection of ammonia on Pluto’s surface in a region of geologically recent tectonism. Sci. Adv. 2019, 5, eaav5731. [Google Scholar] [CrossRef] [PubMed] [Green Version]
- Cook, J.C.; Dalle Ore, C.M.; Protopapa, S.; Binzel, R.P.; Cartwright, R.; Cruikshank, D.P.; Young, L.A. Composition of Pluto’s small satellites: Analysis of New Horizons spectral images. Icarus 2018, 315, 30–45. [Google Scholar] [CrossRef]
- Vennari, C.E.; O’Bannon, E.F.; Williams, Q. The ammonium ion in a silicate under compression: Infrared spectroscopy and powder X-ray diffraction of NH4AlSi3O8—buddingtonite to 30 GPa. Phys. Chem. Miner. 2017, 44, 149–161. [Google Scholar] [CrossRef]
- Boehler, R.; De Hantsetters, K. New anvil designs in diamond-cells. High Press. Res. 2004, 24, 391–396. [Google Scholar] [CrossRef]
- Oxford Diffraction. CrysAlis(Pro); Oxford Diffraction Ltd.: Abingdon, UK, 2006. [Google Scholar]
- Hübschle, C.B.; Sheldrick, G.M.; Dittrich, B. ShelXle: A Qt graphical user interface for SHELXL. J. Appl. Crystallogr. 2011, 44, 1281–1284. [Google Scholar] [CrossRef] [Green Version]
- Palmer, D.C. CrystalMaker; CrystalMaker Software Ltd.: Oxfordshire, UK, 2014. [Google Scholar]
- Angel, R.J. Equation of State. In High Temperature and High Pressure Crystal Chemistry; Hazen, R.M., Downs, R.T., Eds.; Reviews in Mineralogy and Geochemistry; Mineralogical Society of America: Chantilly, VA, USA, 2000; Volume 41, pp. 117–211. [Google Scholar]
- Angel, R.J.; Alvaro, M.; Gonzalez-Platas, J. EosFit7c and a Fortran module (library) for equation of state calculations. Z. Kristallogr. Cryst. Mater. 2014, 229, 405–419. [Google Scholar] [CrossRef]
- Angel, R.J.; Finger, L.W. SINGLE: A program to control single-crystal diffractometers. J. Appl. Crystallogr. 2011, 44, 247–251. [Google Scholar] [CrossRef]
- Comodi, P.; Stagno, V.; Zucchini, A.; Fei, W.; Prakapenka, V. The compression behaviour of blodite at low and high temperature up to 10 GPa: Implications for the stability of hydrous sulfates on icy planetary bodies. Icarus 2017, 285, 137–144. [Google Scholar] [CrossRef] [Green Version]
- Comodi, P.; Nazzareni, S.; Zanazzi, P.F.; Speziale, S. High-pressure behavior of gypsum: A single-crystal X-ray study. Am. Mineral. 2008, 93, 1530–1537. [Google Scholar] [CrossRef]
- Robinson, K.; Gibbs, G.V.; Ribbe, P.H. Quadratic elongation: A quantitative Measure of distorsion in coordination Polyedra. Science 1971, 172, 567–570. [Google Scholar] [CrossRef]
- Zucchini, A.; Prencipe, M.; Belmonte, D.; Comodi, P. Ab initio study of the dolomite to dolomite II high pressure phase transition. Eur. J. Mineral. 2017, 29, 227–238. [Google Scholar] [CrossRef]
- Zucchini, A.; Comodi, P.; Nazzareni, S.; Hanfland, M. The effect of cation ordering and temperature on the high-pressure behavior if dolomite. Phys. Chem. Miner. 2014, 41, 783–793. [Google Scholar] [CrossRef]
- Shmyt’Ko, I.M.; Afonikova, N.S.; Torgashev, V.I. Anomalous states of the structure of (NH4)2SO4 crystals in the temperature range 4.2–300 K. Solid State Phys. 2002, 44, 2309–2317. [Google Scholar] [CrossRef]
- Verma, A.S.; Kumar, A. Bulk modulus of cubic perovskites. J. Alloys Compd. 2012, 541, 210–214. [Google Scholar] [CrossRef]
- Comodi, P.; Boffa Ballaran, T.; Zanazzi, P.F.; Capalbo, C.; Zanetti, A.; Nazzareni, S. The effect of oxo-component of the high-pressure behaviour of amphiboles. Am. Mineral. 2010, 95, 1042–1051. [Google Scholar] [CrossRef]
- Gracia, L.; Beltrán, A.; Errandonea, D.; Andrés, J. CaSO4 and its pressure-induced phase transitions. A density functional theory study. Inorg. Chem. 2012, 51, 1751–1759. [Google Scholar] [CrossRef] [PubMed]
- Comodi, P.; Nazzareni, S.; Dubrovinsky, L.; Merlini, M. The high-pressure–high-temperature behavior of bassanite. Am. Mineral. 2009, 94, 1596–1602. [Google Scholar] [CrossRef]
- Comodi, P.; Nazzareni, S.; Balić-Žunić, T.; Zucchini, A.; Hanfland, M. The high-pressure behavior of bloedite: A synchrotron single-crystal X-ray diffraction study. Am. Mineral. 2014, 99, 511–518. [Google Scholar] [CrossRef]
- Meusburger, J.M.; Ende, M.; Matzinger, P.; Talla, D.; Miletich, R.; Wildner, M. Polymorphism of Mg-monohydrate sulfate kieserite under pressure and its occurrence on giant icy Jovian satellites. Icarus 2020, 36, 113459. [Google Scholar] [CrossRef]
- Fortes, A.D.; Wood, I.G.; Alfredsson, M.; Vocadlo, L.; Knight, K.S. The thermoelastic properties of MgSO4·7D2O (epsomite) from powder neutron diffraction and ab initio calculation. Eur. J. Mineral. 2006, 18, 449–462. [Google Scholar] [CrossRef]
- Fortes, A.D.; Fernandez-Alonso, F.; Tucker, M.; Wood, I.G. Isothermal equation of state and high-pressure phase transitions of synthetic meridianiite (MgSO4·11D2O) determined by neutron powder diffraction and quasi elastic neutron spectroscopy. Acta Crystallogr. Sect. B 2017, 73, 33–46. [Google Scholar] [CrossRef] [Green Version]
- Fortes, A.D.; Brand, H.E.A.; Vočadlo, L.; Lindsay-Scott, A.; Fernandez-Alonso, F.; Wood, I.G. P–V–T equation of state of synthetic mirabilite (Na2SO4·10D2O) determined by powder neutron diffraction. J. App. Cryst. 2013, 46, 448–460. [Google Scholar] [CrossRef]
- Balić-Žunić, T.; Birkedal, R.; Katerinopolou, A.; Comodi, P. Deydration of bloedite, Na2Mg(SO4)2(H2O)4 and leonite K2Mg(SO4)2(H2O)4. Eur. J. Mineral. 2016, 28, 33–42. [Google Scholar] [CrossRef]


| P (GPa) | P0 (0.0001) | P1 0.29 (2) | P2 1.65 (2) | P3 3.88 (2) | P4 8.68 (2) | P5 10.53 (2) | P6 14.0 (1) | P7 15.83 (2) | P8 17.59 (2) |
|---|---|---|---|---|---|---|---|---|---|
| Space group | Pnma | Pnma | Pnma | Pnma | Pnma | Pnma | Pnma | Pnma | Pnma |
| a(Å) | 7.7915 (6) | 7.7584 (7) | 7.6550 (5) | 7.5489 (3) | 7.4019 (2) | 7.3509 (4) | 7.2762 (3) | 7.2360 (5) | 7.2029 (7) |
| b(Å) | 10.6522 (9) | 10.595 (2) | 10.379 (1) | 10.0809 (6) | 9.6899 (7) | 9.580 (1) | 9.434 (8) | 9.370 (1) | 9.328 (2) |
| c(Å) | 5.9972 (5) | 5.972 (1) | 5.891 (1) | 5.7630 (6) | 5.5806 (6) | 5.527 (1) | 5.4425 (7) | 5.398 (1) | 5.361 (2) |
| V(Å3) | 497.74 (7) | 490.88 (15) | 468.01 (10) | 438.56 (5) | 400.26 (5) | 389.24 (9) | 373.59 (6) | 365.99 (10) | 360.20 (13) |
| Density (g/cm3) | 1.656 | 1.679 | 1.761 | 1.879 | 2.059 | 2.117 | 2.206 | 2.252 | 2.288 |
| maximum 2θ | 26 | 26 | 26 | 26 | 26 | 26 | 26 | 26 | 26 |
| all reflections | 1689 | 1057 | 989 | 936 | 815 | 776 | 758 | 738 | 716 |
| unique reflections | 1274 | 834 | 830 | 811 | 764 | 709 | 716 | 687 | 634 |
| refine number parameters | 41 | 41 | 41 | 41 | 41 | 41 | 41 | 41 | 41 |
| R1 (|F0| > 4σ) | 0.0439 | 0.0407 | 0.0366 | 0.0385 | 0.0263 | 0.0394 | 0.0302 | 0.0340 | 0.0497 |
| wR2, all reflections | 0.1261 | 0.1094 | 0.087 | 0.0945 | 0.0778 | 0.1031 | 0.0795 | 0.0904 | 0.1402 |
| wR2, all reflections | 0.1136 | 0.0993 | 0.0815 | 0.0889 | 0.0738 | 0.0995 | 0.0761 | 0.0853 | 0.1339 |
| goodness of fit | 1.105 | 1.102 | 1.158 | 1.127 | 1.109 | 1.161 | 1.118 | 1.102 | 1.092 |
| Residues (e-/Å3) max | 0.45 | 0.29 | 0.29 | 0.33 | 0.38 | 0.51 | 0.41 | 0.44 | 0.84 |
| Residues (e-/Å3) min | −0.49 | −0.35 | −0.28 | −0.34 | −0.36 | −0.43 | −0.37 | −0.47 | −0.95 |
| Sites | P | x | y | z | Ueq |
|---|---|---|---|---|---|
| S | P0 | 0.24417 (4) | 0.41921 (3) | 0.25 | 0.0218 (1) |
| P1 | 0.24502 (4) | 0.41931 (4) | 0.25 | 0.0205 (2) | |
| P2 | 0.24859 (3) | 0.41925 (3) | 0.25 | 0.0168 (1) | |
| P3 | 0.25380 (4) | 0.41816 (4) | 0.25 | 0.0146 (1) | |
| P4 | 0.26095 (3) | 0.41695 (3) | 0.25 | 0.0104 (1) | |
| P5 | 0.26310 (5) | 0.41701 (4) | 0.25 | 0.0093 (2) | |
| P6 | 0.26632 (4) | 0.41720 (4) | 0.25 | 0.0088 (1) | |
| P7 | 0.26801 (4) | 0.41750 (4) | 0.25 | 0.0088 (1) | |
| P8 | 0.26933 (7) | 0.41784 (7) | 0.25 | 0.0093 (2) | |
| N1 | P0 | 0.6895 (2) | 0.4033 (1) | 0.25 | 0.0302 (3) |
| P1 | 0.6887 (2) | 0.4034 (2) | 0.25 | 0.0285 (4) | |
| P2 | 0.6863 (2) | 0.4031 (1) | 0.25 | 0.0234 (3) | |
| P3 | 0.6840 (2) | 0.4036 (2) | 0.25 | 0.0206 (3) | |
| P4 | 0.6842 (1) | 0.4035 (1) | 0.25 | 0.0148 (2) | |
| P5 | 0.6851 (2) | 0.4032 (2) | 0.25 | 0.0133 (3) | |
| P6 | 0.6874 (2) | 0.4024 (1) | 0.25 | 0.0121 (2) | |
| P7 | 0.6885 (2) | 0.4018 (2) | 0.25 | 0.0119 (3) | |
| P8 | 0.6902 (3) | 0.4014 (3) | 0.25 | 0.0119 (4) | |
| N2 | P0 | 0.9690 (2) | 0.7045 (1) | 0.25 | 0.0325 (3) |
| P1 | 0.9686 (2) | 0.7040 (2) | 0.25 | 0.0303 (4) | |
| P2 | 0.9704(2) | 0.7009 (1) | 0.25 | 0.0245 (3) | |
| P3 | 0.9722 (2) | 0.6943 (1) | 0.25 | 0.0198 (3) | |
| P4 | 0.9684 (1) | 0.6832 (1) | 0.25 | 0.0145 (2) | |
| P5 | 0.9664 (2) | 0.6803 (2) | 0.25 | 0.0129 (3) | |
| P6 | 0.9628 (1) | 0.6760 (1) | 0.25 | 0.0120 (2) | |
| P7 | 0.9613 (2) | 0.6739 (2) | 0.25 | 0.0116 (3) | |
| P8 | 0.9597 (2) | 0.6725 (2) | 0.25 | 0.0129 (4) | |
| O1 | P0 | 0.0618 (2) | 0.3888 (2) | 0.25 | 0.0598 (5) |
| P1 | 0.0609 (2) | 0.3911 (2) | 0.25 | 0.0537 (6) | |
| P2 | 0.0596 (1) | 0.3970 (2) | 0.25 | 0.0382 (4) | |
| P3 | 0.0602 (1) | 0.4018 (2) | 0.25 | 0.0265 (3) | |
| P4 | 0.0626 (1) | 0.3996 (1) | 0.25 | 0.0158 (2) | |
| P5 | 0.0635 (1) | 0.3981 (2) | 0.25 | 0.0142 (3) | |
| P6 | 0.0653 (1) | 0.3953 (1) | 0.25 | 0.0126 (2) | |
| P7 | 0.0662 (1) | 0.3939 (1) | 0.25 | 0.0125 (3) | |
| P8 | 0.0676 (2) | 0.3925 (2) | 0.25 | 0.0136 (4) | |
| O2 | P0 | 0.2697 (2) | 0.5566 (2) | 0.25 | 0.0453 (4) |
| P1 | 0.2732 (2) | 0.5571 (2) | 0.25 | 0.0419 (5) | |
| P2 | 0.2857 (2) | 0.5587 (1) | 0.25 | 0.0322 (3) | |
| P3 | 0.2992 (2) | 0.5602 (1) | 0.25 | 0.0244 (3) | |
| P4 | 0.3070 (1) | 0.5645 (1) | 0.25 | 0.0159 (2) | |
| P5 | 0.3075 (2) | 0.5661 (2) | 0.25 | 0.0149 (3) | |
| P6 | 0.3073 (1) | 0.5690 (1) | 0.25 | 0.0131 (2) | |
| P7 | 0.3071 (2) | 0.5704 (2) | 0.25 | 0.0132 (3) | |
| P8 | 0.3061 (3) | 0.5720 (2) | 0.25 | 0.0142 (4) | |
| O3 | P0 | 0.3238 (1) | 0.3662 (1) | 0.0490 (2) | 0.0479 (3) |
| P1 | 0.3242 (1) | 0.3653 (1) | 0.0484 (3) | 0.0436 (4) | |
| P2 | 0.3257 (1) | 0.3613 (1) | 0.0448 (2) | 0.0344 (3) | |
| P3 | 0.3287 (1) | 0.3555 (1) | 0.0414 (2) | 0.0253 (3) | |
| P4 | 0.33650 (7) | 0.35124 (8) | 0.0349 (2) | 0.0162 (2) | |
| P5 | 0.3395 (1) | 0.3510 (1) | 0.0333 (2) | 0.0142 (2) | |
| P6 | 0.3446 (8) | 0.35107 (9) | 0.0305 (2) | 0.0129 (2) | |
| P7 | 0.34716 (9) | 0.3513 (1) | 0.0293 (2) | 0.0124 (2) | |
| P8 | 0.3495 (2) | 0.3518 (2) | 0.0276 (3) | 0.0120 (3) |
| P (GPa) | P0 (0.0001) | P1 0.29 (2) | P2 1.65 (2) | P3 3.88 (2) | P4 8.68 (2) | P5 10.53 (2) | P6 14.0 (1) | P7 15.83 (2) | P8 17.59 (2) |
|---|---|---|---|---|---|---|---|---|---|
| S-O1 | 1.458 (2) | 1.459 (2) | 1.465 (1) | 1.470 (1) | 1.4779 (8) | 1.479 (1) | 1.478 (1) | 1.477 (1) | 1.472 (2) |
| S-O2 | 1.477 (2) | 1.477 (2) | 1.475 (1) | 1.472 (2) | 1.470 (1) | 1.465 (2) | 1.462 (1) | 1.460 (2) | 1.462 (3) |
| S-O3 (x2) | 1.469 (1) | 1.468 (2) | 1.474 (1) | 1.471 (1) | 1.4693 (9) | 1.466 (1) | 1.463 (1) | 1.460 (1) | 1.461 (2) |
| <S-O> | 1.468 | 1.467 | 1.471 | 1.471 | 1.4715 | 1.469 | 1.466 | 1.464 | 1.464 |
| V | 1.623 | 1.622 | 1.636 | 1.634 | 1.635 | 1.627 | 1.618 | 1.611 | 1.610 |
| Dist. index | 0.0035 | 0.003 | 0.0022 | 0.0004 | 0.0022 | 0.0032 | 0.0038 | 0.0043 | 0.0028 |
| Quad. elongation | 1.0002 | 1.0001 | 1.0001 | 1.0000 | 1.0000 | 1.0000 | 1.0000 | 1.0000 | 1.0001 |
| P (GPa) | P0 (0.0001) | P1 0.29 (2) | P2 1.65 (2) | P3 3.88 (2) | P4 8.68 (2) | P5 10.53 (2) | P6 14.0 (1) | P7 15.83 (2) | P8 17.59 (2) |
|---|---|---|---|---|---|---|---|---|---|
| S-N1 | 3.46209 | 3.446 | 3.3548 | 3.2508 | 3.13572 | 3.10492 | 3.06735 | 3.04636 | 3.03189 |
| S-N1 | 3.47368 | 3.44678 | 3.37908 | 3.28566 | 3.15655 | 3.12033 | 3.06881 | 3.04745 | 3.03536 |
| S-N1 (x2) | 3.58222 | 3.56501 | 3.51059 | 3.4284 | 3.31328 | 3.27882 | 3.22738 | 3.20152 | 3.18018 |
| S-N1′ (*) | 4.32525 | 4.31984 | 4.30769 | 4.30396 | 4.27089 | 4.25089 | 4.21437 | 4.19469 | 4.17423 |
| S-N2 (x2) | 3.67258 | 3.65642 | 3.61096 | 3.53532 | 3.40715 | 3.36928 | 3.31028 | 3.28208 | 3.2584 |
| S-N2 | 3.71909 | 3.70159 | 3.61655 | 3.5023 | 3.36808 | 3.33443 | 3.31028 | 3.27069 | 3.25832 |
| S-N2′ | 4.37438 | 4.35128 | 4.29272 | 4.24069 | 4.16793 | 4.1372 | 4.09556 | 4.076 | 4.02893 |
| S-N2 (x2) (**) | 4.38355 | 4.36508 | 4.29407 | 4.20418 | 4.11473 | 4.09088 | 4.05802 | 4.04095 | 4.05984 |
| Mineral | Chemical Formula | K0 (GPa) | K’ | Density (g/cm3) | Reference |
|---|---|---|---|---|---|
| Anhydrite | CaSO4 | 63.9 | 5.9 | 2.96 | Gracia et al. [32] |
| Bassanite | CaSO4·1/2 H2O | 86 (7) | 2.5 (3) | 2.77 | Comodi et al. [33] |
| Gypsum | CaSO4·2 H2O | 44 (3) | 3.3 (3) | 2.318 | Comodi et al. [25] |
| Bloedite | Na2Mg(SO4)2·4 H2O | 36 (1) | 5.1 (1) | 1.196 | Comodi et al. [34] |
| Kieserite | MgSO4·H2O | 48.1 (5) | 8.1 (6) | 2.58 | Meusburger et al. [35] |
| Epsomite | MgSO4·7 H2O | 21.5 (1) | 5.4 | 1.68 | Fortes et al. [36] |
| Meridianiite | MgSO4·11 H2O | 19.9 (4) | 9 (1) | 1.50 | Fortes et al. [37] |
| Mirabilite | Na2SO4·10 H2O | 19.6 (1) | 5.8 (5) | 1.47 | Fortes et al. [38] |
| Mascagnite | NH4SO4 | 20.4 (7) | 6.1 (2) | 1.77 | Present paper |
Publisher’s Note: MDPI stays neutral with regard to jurisdictional claims in published maps and institutional affiliations. |
© 2021 by the authors. Licensee MDPI, Basel, Switzerland. This article is an open access article distributed under the terms and conditions of the Creative Commons Attribution (CC BY) license (https://creativecommons.org/licenses/by/4.0/).
Share and Cite
Comodi, P.; Fastelli, M.; Criniti, G.; Glazyrin, K.; Zucchini, A. High Pressure Behavior of Mascagnite from Single Crystal Synchrotron X-ray Diffraction Data. Crystals 2021, 11, 976. https://doi.org/10.3390/cryst11080976
Comodi P, Fastelli M, Criniti G, Glazyrin K, Zucchini A. High Pressure Behavior of Mascagnite from Single Crystal Synchrotron X-ray Diffraction Data. Crystals. 2021; 11(8):976. https://doi.org/10.3390/cryst11080976
Chicago/Turabian StyleComodi, Paola, Maximiliano Fastelli, Giacomo Criniti, Konstantin Glazyrin, and Azzurra Zucchini. 2021. "High Pressure Behavior of Mascagnite from Single Crystal Synchrotron X-ray Diffraction Data" Crystals 11, no. 8: 976. https://doi.org/10.3390/cryst11080976
APA StyleComodi, P., Fastelli, M., Criniti, G., Glazyrin, K., & Zucchini, A. (2021). High Pressure Behavior of Mascagnite from Single Crystal Synchrotron X-ray Diffraction Data. Crystals, 11(8), 976. https://doi.org/10.3390/cryst11080976