
Heterogeneous Crystal Nucleation from the Melt in Polyethylene Oxide Droplets on Graphite: Kinetics and Microscopic Structure


Abstract
:1. Introduction
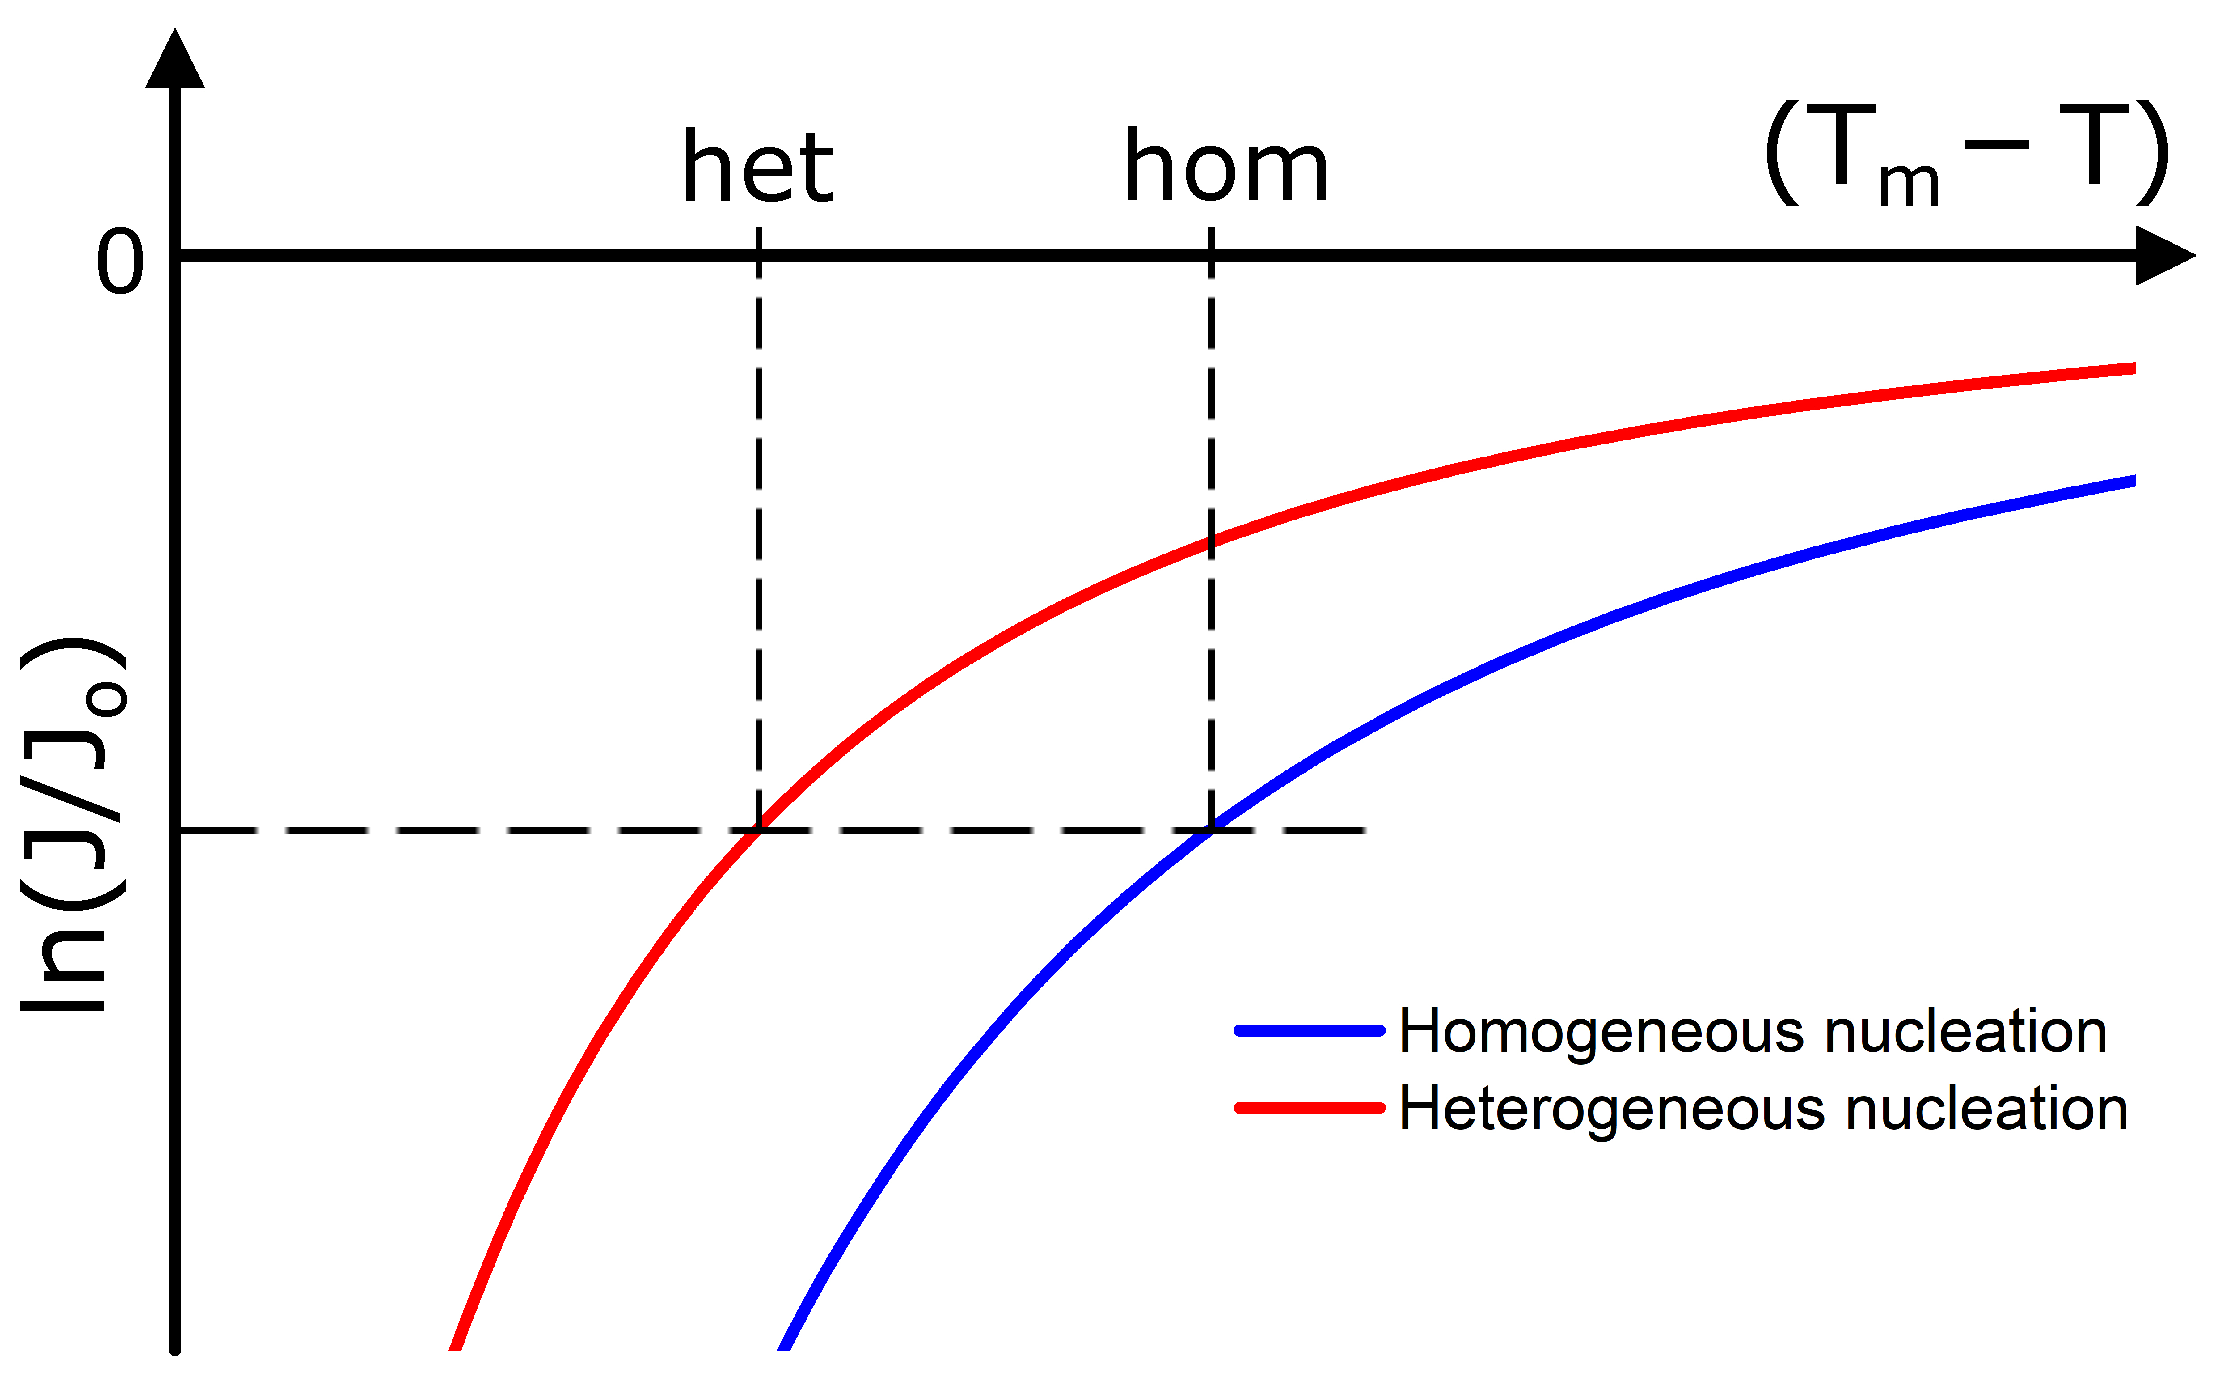
2. Theory
3. Materials and Methods
3.1. Materials
3.2. Sample Preparation
3.3. Optical Microscopy
3.4. Atomic Force Microscopy
3.5. X-ray Scattering
4. Results and Discussion
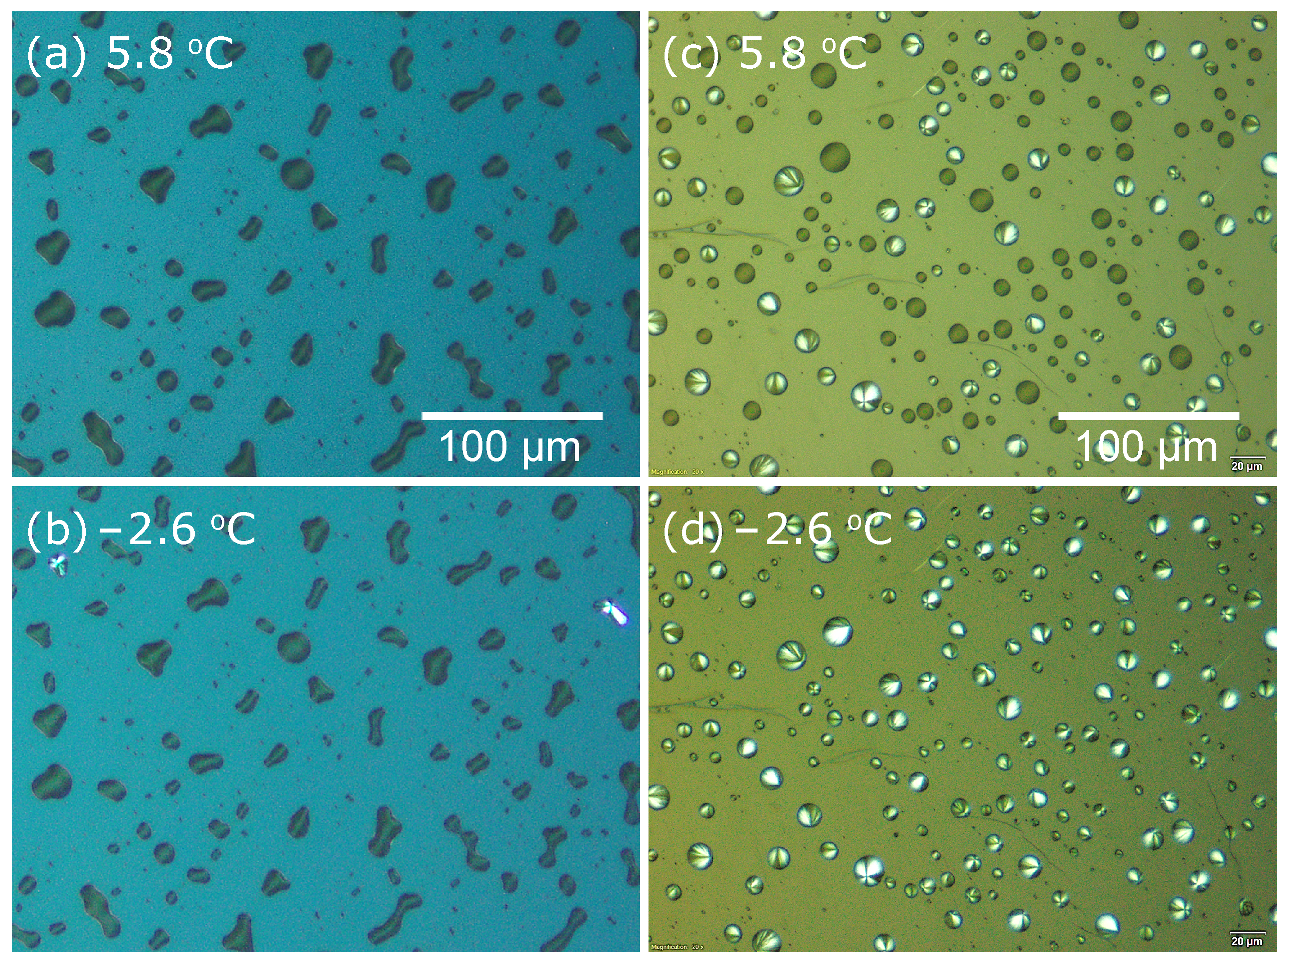
4.1. Optical Microscopy Measurements during Cooling
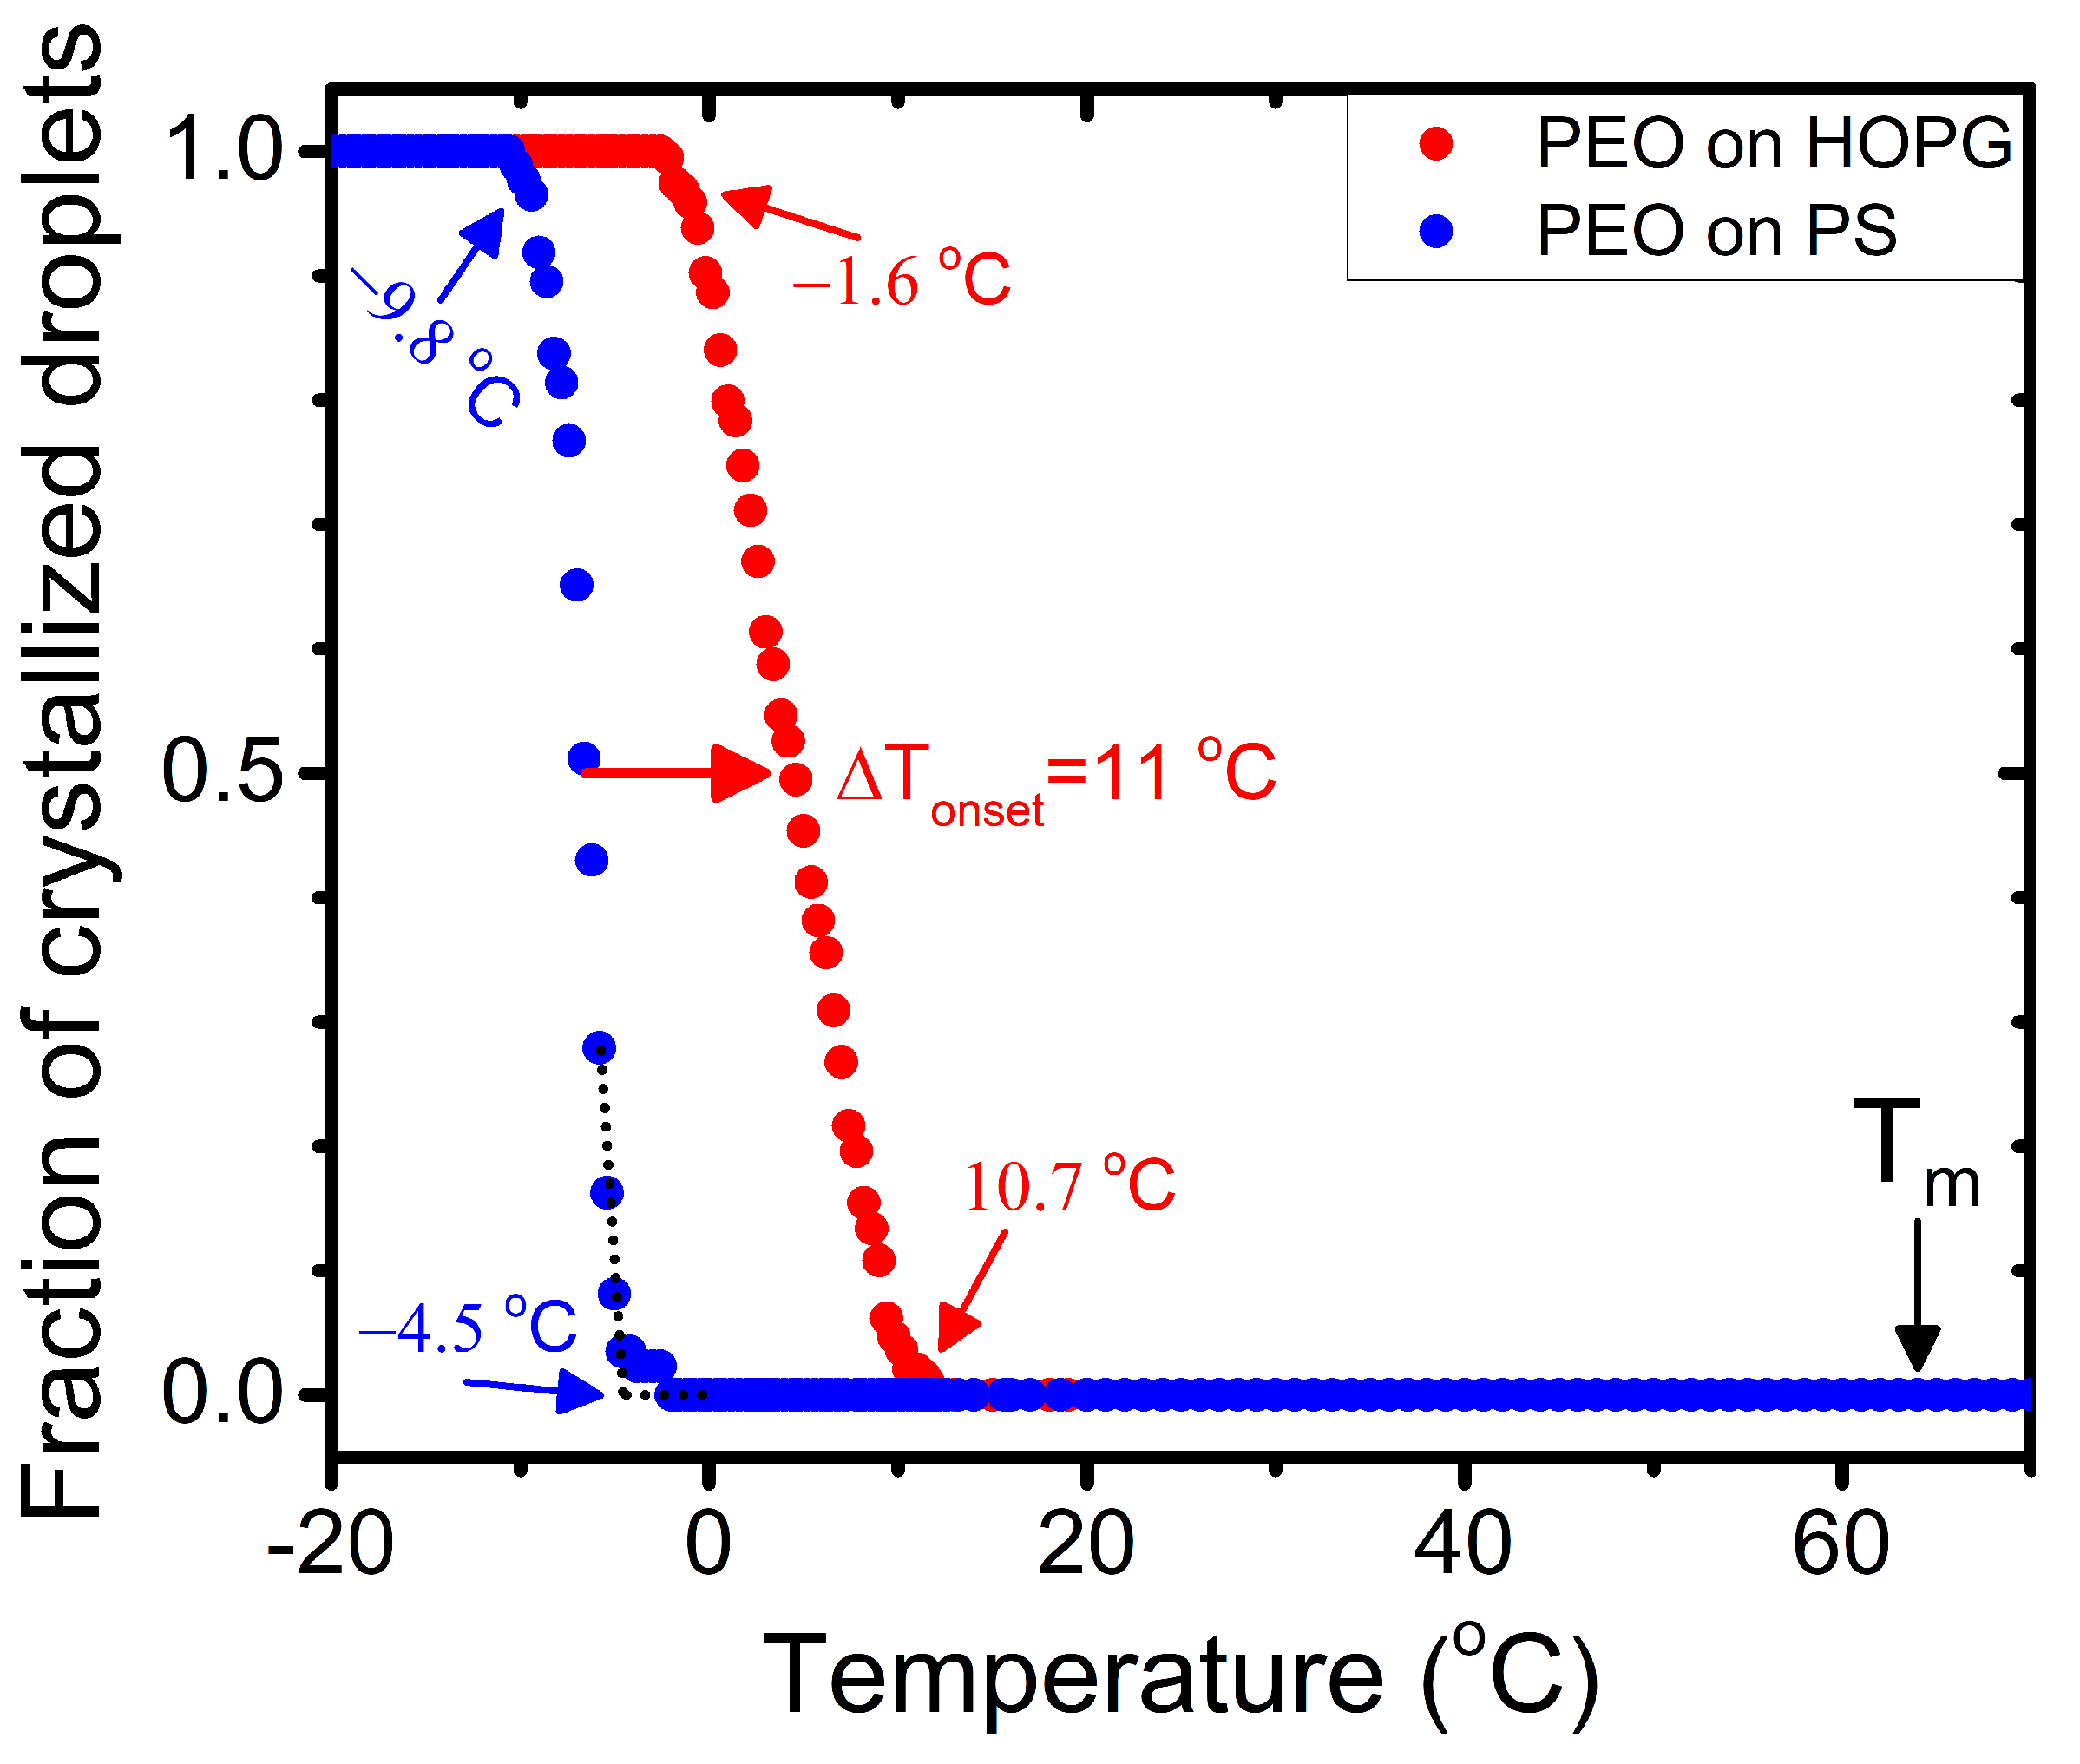
4.2. Quantitative Analysis of Kinetics
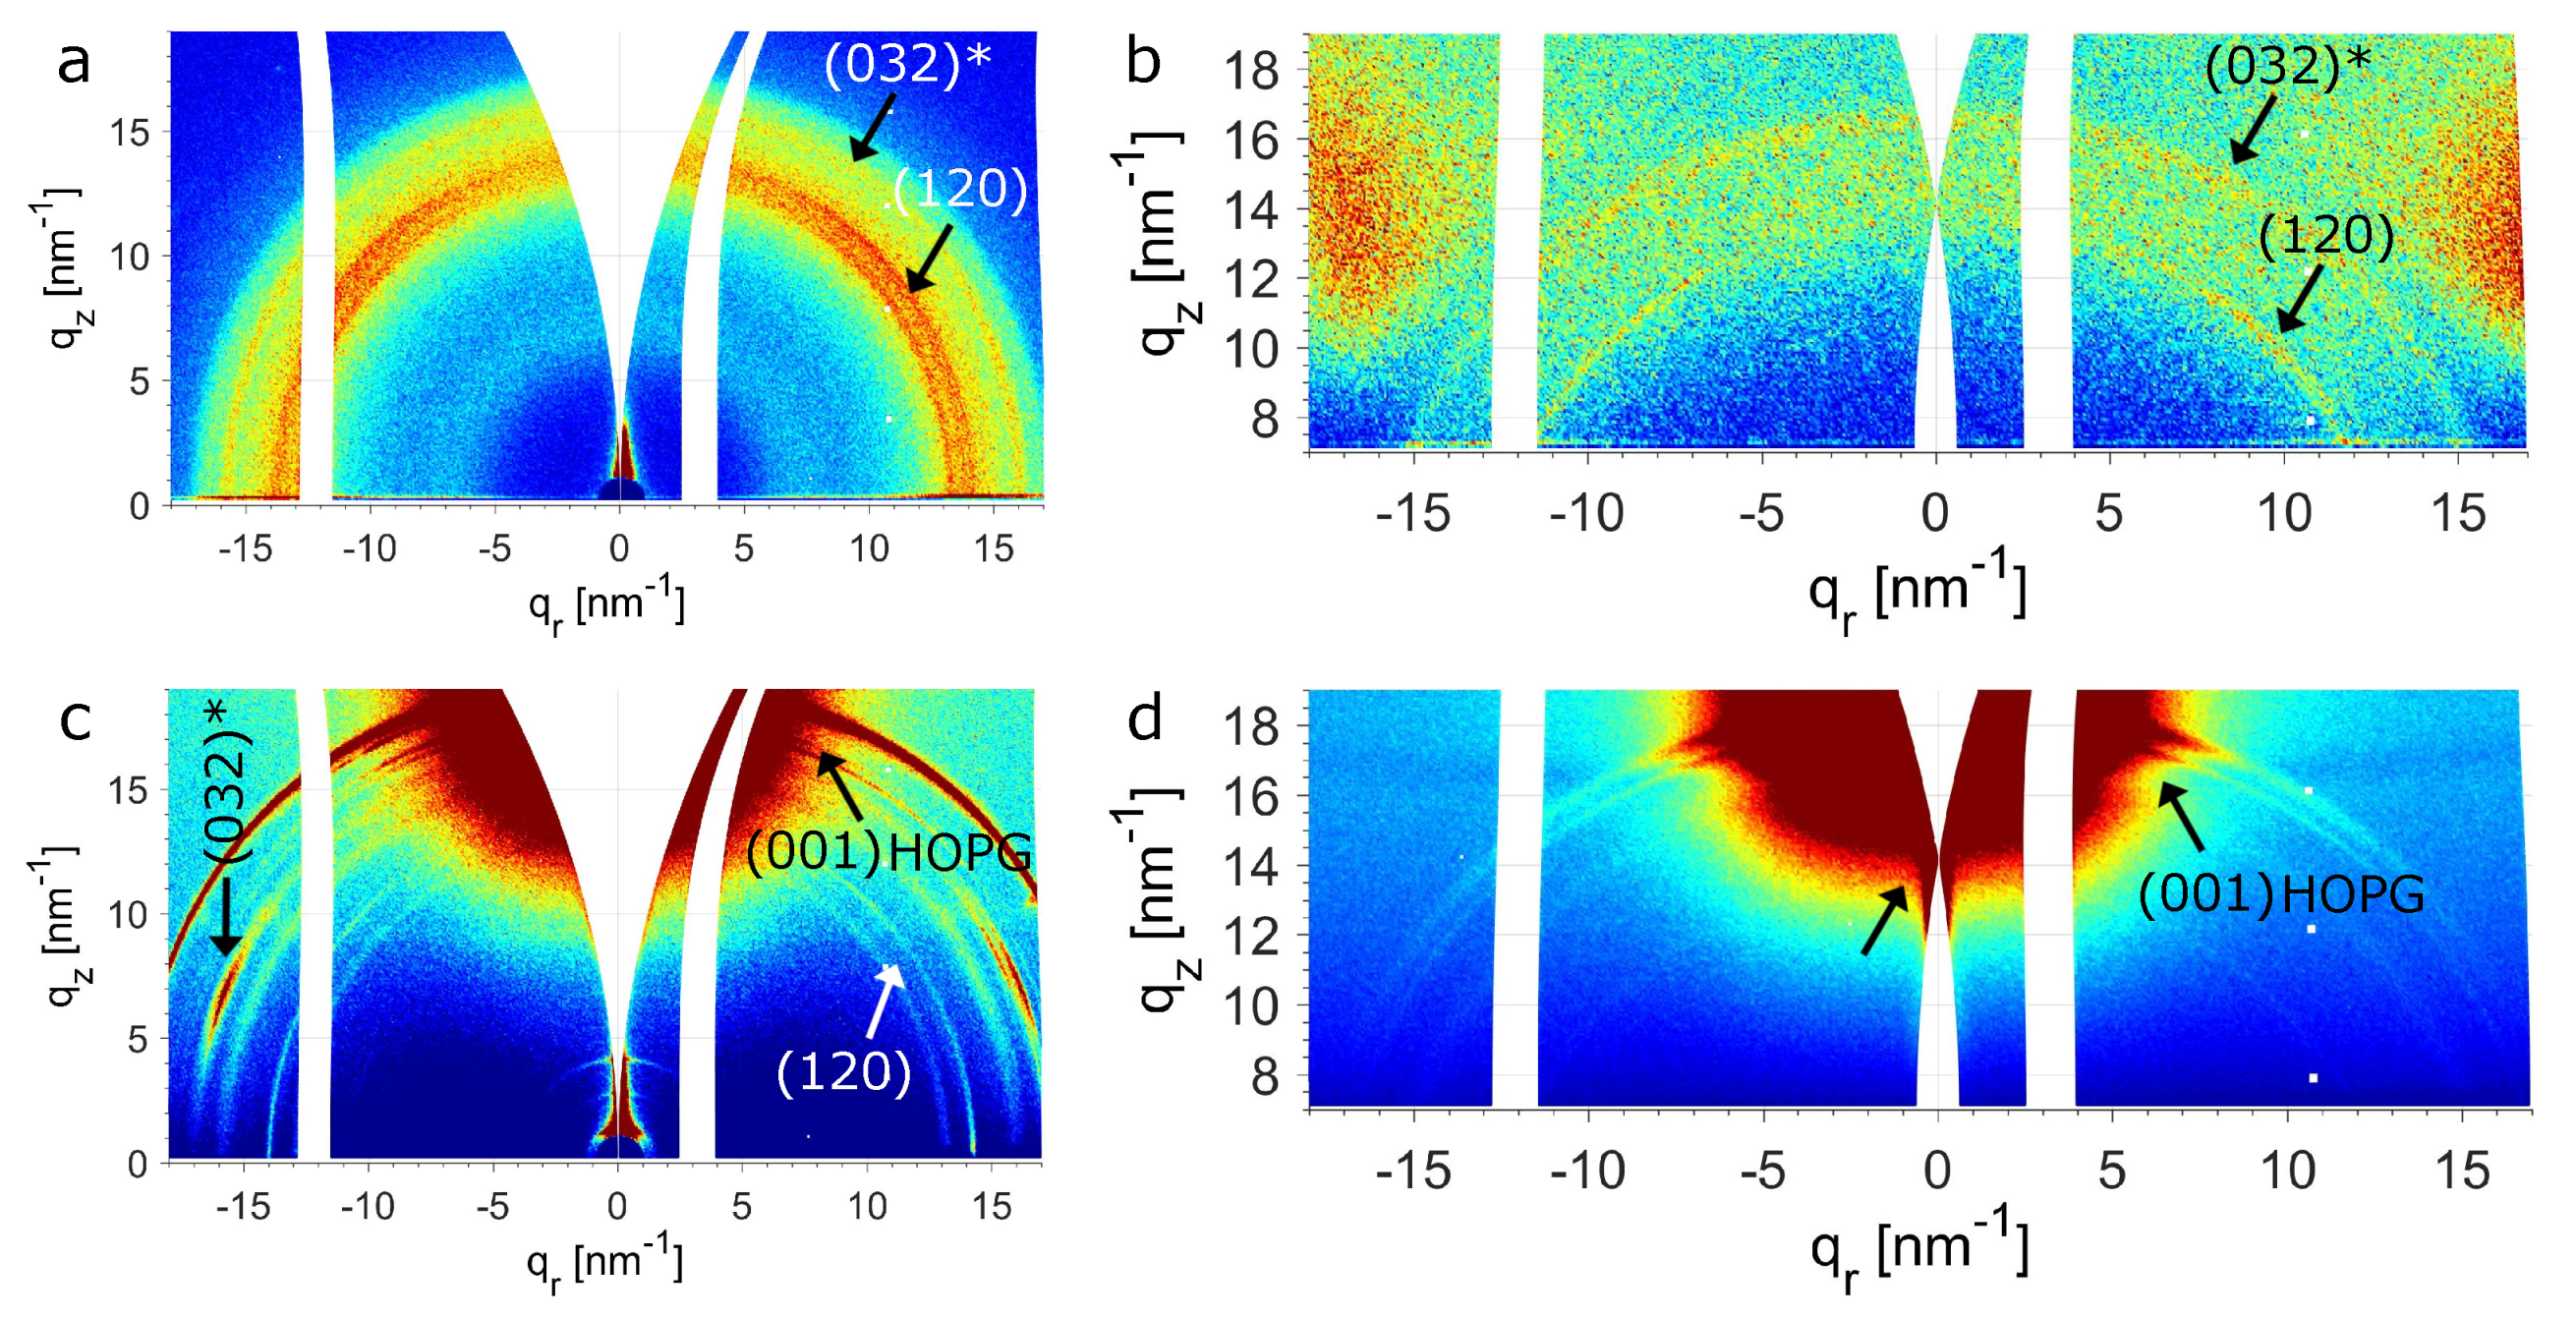
4.3. WAXS and AFM Measurements at Room Temperature
5. Conclusions
Supplementary Materials
Author Contributions
Funding
Institutional Review Board Statement
Informed Consent Statement
Data Availability Statement
Acknowledgments
Conflicts of Interest
References
- Sear, R. Nucleation: Theory and Applications to Protein Solutions and Colloidal Suspensions. J. Phys. Condens. Matter. 2007, 19, 033101. [Google Scholar] [CrossRef]
- Sosso, G.C.; Chen, J.; Cox, S.J.; Fitzner, M.; Pedevilla, P.; Zen, A.; Michaelides, A. Crystal Nucleation in Liquids: Open Questions and Future Challenges in Molecular Dynamics Simulations. Chem. Rev. 2016, 116, 7078–7116. [Google Scholar] [CrossRef] [Green Version]
- Heni, M.; Löwen, H. Surface Freezing on Patterned Substrates. Phys. Rev. Lett. 2000, 85, 3668–3671. [Google Scholar] [CrossRef] [Green Version]
- Courtemanche, D.; Pasmore, T.; Vanswol, F. A Molecular-Dynamics Study of Prefreezing Hard-Spheres at A Smooth Hard-Wall. Mol. Phys. 1993, 80, 861–875. [Google Scholar] [CrossRef]
- Löhmann, A.; Henze, T.; Thurn-Albrecht, T. Direct Observation of Prefreezing at the Interface Melt-Solid in Polymer Crystallization. Proc. Natl. Acad. Sci. USA 2014, 111, 17368–17372. [Google Scholar] [CrossRef] [PubMed] [Green Version]
- Flieger, A.K.; Schulz, M.; Thurn-Albrecht, T. Interface-Induced Crystallization of Polycaprolactone on Graphite via First-Order Prewetting of the Crystalline Phase. Macromolecules 2018, 51, 189–194. [Google Scholar] [CrossRef] [Green Version]
- Tariq, M.; Dolynchuk, O.; Thurn-Albrecht, T. Effect of Substrate Interaction on Thermodynamics of Prefreezing. Macromolecules 2019, 52, 9140–9148. [Google Scholar] [CrossRef]
- Tariq, M.; Dolynchuk, O.; Thurn-Albrecht, T. Independent Variation of Transition Temperature and Prefrozen Layer Thickness at the Prefreezing Transition. J. Phys. Chem. C 2020, 124, 26184–26192. [Google Scholar] [CrossRef]
- Dolynchuk, O.; Tariq, M.; Thurn-Albrecht, T. Phenomenological Theory of First-Order Prefreezing. J. Phys. Chem. Lett. 2019, 10, 1942–1946. [Google Scholar] [CrossRef] [Green Version]
- Bourque, A.; Locker, C.; Rutledge, G. Heterogeneous Nucleation of an n-Alkane on Tetrahedrally Coordinated Crystals. J. Phys. Chem. B 2017, 121, 904–911. [Google Scholar] [CrossRef] [Green Version]
- Schick, C.; Androsch, R.; Schmelzer, J. Homogeneous Crystal Nucleation in Polymers. J. Phys. Condens. Matter. 2017, 29, 453002. [Google Scholar] [CrossRef]
- Wittmann, J.; Lotz, B. Epitaxial Crystallization of Polyethylene on Organic Substrates: A Reappraisal of the Mode of Action of Selected Nucleating Agents. J. Polym. Sci. Polym. Phys. Ed. 1981, 19, 1837–1851. [Google Scholar] [CrossRef]
- Wittmann, J.; Hodge, A.; Lotz, B. Epitaxial Crystallization of Polymers onto Benzoic Acid: Polyethylene and Paraffins, Aliphatic Polyesters, and Polyamides. J. Polym. Sci. Polym. Phys. Ed. 1983, 21, 2495–2509. [Google Scholar] [CrossRef]
- Wittmann, J.; Lotz, B. Epitaxial Crystallization of Polymers on Organic and Polymeric substrates. Prog. Polym. Sci. 1990, 15, 909–948. [Google Scholar] [CrossRef]
- Tong, Y.; Lin, Y.; Wang, S.; Song, M. A Study of Crystallisation of Poly (ethylene oxide) and Polypropylene on Graphene Surface. Polymer 2015, 73, 52–61. [Google Scholar] [CrossRef] [Green Version]
- Massa, M.; Carvalho, J.; Dalnoki-Veress, K. Direct Visualisation of Homogeneous and Heterogeneous Crystallisation in an Ensemble of Confined Domains of Poly(ethylene oxide). Eur. Phys. J. E 2003, 12, 111–117. [Google Scholar] [CrossRef]
- Carvalho, J.; Dalnoki-Veress, K. Surface Nucleation in the Crystallisation of Polyethylene Droplets. Eur. Phys. J. E 2011, 34, 6. [Google Scholar] [CrossRef]
- Vonnegut, B. Variation with Temperature of the Nucleation Rate of Supercooled Liquid Tin and Water Drops. J. Colloid Sci. 1948, 3, 563–569. [Google Scholar] [CrossRef]
- Turnbull, D.; Cech, R.E. Microscopic Observation of the Solidification of Small Metal Droplets. J. Appl. Phys. 1950, 21, 804–810. [Google Scholar] [CrossRef]
- Campbell, J.; Meldrum, F.; Christenson, H. Is Ice Nucleation from Supercooled Water Insensitive to Surface Roughness? J. Phys. Chem. C 2015, 119, 1164–1169. [Google Scholar] [CrossRef] [Green Version]
- Murray, B.J.; Broadley, S.L.; Wilson, T.W.; Atkinson, J.D.; Wills, R.H. Heterogeneous Freezing of Water Droplets Containing Kaolinite Particles. Atmos. Chem. Phys. 2011, 11, 4191–4207. [Google Scholar] [CrossRef] [Green Version]
- Xue, H.; Lu, Y.; Geng, H.; Dong, B.; Wu, S.; Fan, Q.; Zhang, Z.; Li, X.; Zhou, X.; Wang, J. Hydroxyl Groups on the Graphene Surfaces Facilitate Ice Nucleation. J. Phys. Chem. Lett. 2019, 10, 2458–2462. [Google Scholar] [CrossRef]
- Massa, M.; Dalnoki-Veress, K. Homogeneous Crystallization of Poly(ethylene oxide) Confined to Droplets: The Dependence of the Crystal Nucleation Rate on Length Scale and Temperature. Phys. Rev. Lett. 2004, 92, 255509. [Google Scholar] [CrossRef] [Green Version]
- Carvalho, J.; Dalnoki-Veress, K. Homogeneous Bulk, Surface, and Edge Nucleation in Crystalline Nanodroplets. Phys. Rev. Lett. 2010, 105, 237801. [Google Scholar] [CrossRef] [PubMed]
- Shingne, N.; Geuss, M.; Hartmann-Azanza, B.; Steinhart, M.; Thurn-Albrecht, T. Formation, Morphology and Internal Structure of One-Dimensional Nanostructures of the Ferroelectric Polymer P(VDF-TrFE). Polymer 2013, 54, 2737–2744. [Google Scholar] [CrossRef]
- Duran, H.; Steinhart, M.; Butt, H.; Floudas, G. From Heterogeneous to Homogeneous Nucleation of Isotactic Poly(propylene) Confined to Nanoporous Alumina. Nano Lett. 2011, 11, 1671–1675. [Google Scholar] [CrossRef] [PubMed]
- Suzuki, Y.; Duran, H.; Steinhart, M.; Butt, H.J.; Floudas, G. Homogeneous Crystallization and Local Dynamics of Poly(ethylene oxide) (PEO) Confined to Nanoporous Alumina. Soft Matter 2013, 9, 2621–2628. [Google Scholar] [CrossRef]
- Reiter, G.; Castelein, G.; Sommer, J.U.; Röttele, A.; Thurn-Albrecht, T. Direct Visualization of Random Crystallization and Melting in Arrays of Nanometer-Size Polymer Crystals. Phys. Rev. Lett. 2001, 87, 226101. [Google Scholar] [CrossRef] [PubMed]
- Röttele, A.; Thurn-Albrecht, T.; Sommer, J.U.; Reiter, G. Thermodynamics of Formation, Reorganization, and Melting of Confined Nanometer-Sized Polymer Crystals. Macromolecules 2003, 36, 1257–1260. [Google Scholar] [CrossRef]
- Dolynchuk, O.; Schmode, P.; Fischer, M.; Thelakkat, M.; Thurn-Albrecht, T. Elucidating the Effect of Interfacial Interactions on Crystal Orientations in Thin Films of Polythiophenes. Macromolecules 2021, 54, 5429–5439. [Google Scholar] [CrossRef]
- Henze, T.; Schröter, K.; Thurn-Albrecht, T. Investigation of the Different Stable States of the Cantilever Oscillation in an Atomic Force Microscope. Nanotechnology 2012, 23, 245702. [Google Scholar] [CrossRef]
- Nečas, D.; Klapetek, P. Gwyddion: An Open-Source Software for SPM Data Analysis. Cent. Eur. J. Phys. 2012, 10, 181–188. [Google Scholar] [CrossRef]
- Balko, J.; Portale, G.; Lohwasser, R.; Thelakkat, M.; Thurn-Albrecht, T. Surface Induced Orientation and Vertically Layered Morphology in Thin Films of Poly(3-hexylthiophene) Crystallized from the Melt. J. Mater. Res. 2017, 32, 1957–1968. [Google Scholar] [CrossRef]
- Takahashi, Y.; Tadokoro, H. Structural Studies of Polyethers, (-(CH2)m-O-)n. X. Crystal Structure of Poly(ethylene oxide). Macromolecules 1973, 6, 672–675. [Google Scholar] [CrossRef]

Publisher’s Note: MDPI stays neutral with regard to jurisdictional claims in published maps and institutional affiliations. |
© 2021 by the authors. Licensee MDPI, Basel, Switzerland. This article is an open access article distributed under the terms and conditions of the Creative Commons Attribution (CC BY) license (https://creativecommons.org/licenses/by/4.0/).
Share and Cite
Tariq, M.; Thurn-Albrecht, T.; Dolynchuk, O. Heterogeneous Crystal Nucleation from the Melt in Polyethylene Oxide Droplets on Graphite: Kinetics and Microscopic Structure. Crystals 2021, 11, 924. https://doi.org/10.3390/cryst11080924
Tariq M, Thurn-Albrecht T, Dolynchuk O. Heterogeneous Crystal Nucleation from the Melt in Polyethylene Oxide Droplets on Graphite: Kinetics and Microscopic Structure. Crystals. 2021; 11(8):924. https://doi.org/10.3390/cryst11080924
Chicago/Turabian StyleTariq, Muhammad, Thomas Thurn-Albrecht, and Oleksandr Dolynchuk. 2021. "Heterogeneous Crystal Nucleation from the Melt in Polyethylene Oxide Droplets on Graphite: Kinetics and Microscopic Structure" Crystals 11, no. 8: 924. https://doi.org/10.3390/cryst11080924
APA StyleTariq, M., Thurn-Albrecht, T., & Dolynchuk, O. (2021). Heterogeneous Crystal Nucleation from the Melt in Polyethylene Oxide Droplets on Graphite: Kinetics and Microscopic Structure. Crystals, 11(8), 924. https://doi.org/10.3390/cryst11080924