Article

A Novel Method for the Preparation of Fibrous CeO2–ZrO2–Y2O3 Compacts for Thermochemical Cycles

German Aerospace Center (DLR), Institute of Materials Research, 51147 Köln, Germany
*
Author to whom correspondence should be addressed.
Crystals 2021, 11(8), 885; https://doi.org/10.3390/cryst11080885
Submission received: 29 June 2021 / Revised: 22 July 2021 / Accepted: 26 July 2021 / Published: 29 July 2021
(This article belongs to the Special Issue Advanced Functional Oxide Ceramics)

Abstract

:
Zirconium-Yttrium-co-doped ceria (Ce0.85Zr0.13Y0.02O1.99) compacts consisting of fibers with diameters in the range of 8–10 µm have been successfully prepared by direct infiltration of commercial YSZ fibers with a cerium oxide matrix and subsequent sintering. The resulting chemically homogeneous fiber-compacts are sinter-resistant up to 1923 K and retain a high porosity of around 58 vol% and a permeability of 1.6–3.3 × 10⁻¹⁰ m² at a pressure gradient of 100–500 kPa. The fiber-compacts show a high potential for the application in thermochemical redox cycling due its fast redox kinetics. The first evaluation of redox kinetics shows that the relaxation time of oxidation is five times faster than that of dense samples of the same composition. The improved gas exchange due to the high porosity also allows higher reduction rates, which enable higher hydrogen yields in thermochemical water-splitting redox cycles. The presented cost-effective fiber-compact preparation method is considered very promising for manufacturing large-scale functional components for solar-thermal high-temperature reactors.

1. Introduction

Solar energy in combination with redox materials can be utilized for thermochemical dissociation of water. Ceria is a very promising material for this process due to its redox thermodynamics and fast redox kinetics, e.g., [1,2,3,4,5,6]. If ceria is used as redox material the generation of solar fuels could be described as follows:
Reduction: C e O 2   C e O 2 δ + δ 1 2 O 2
Oxidation: C e O 2 δ + δ H 2 O   C e O 2 + δ H 2
Doping ceria with tetravalent cations like Zr4+ is promising in terms of enhanced oxygen release during reduction [7,8,9,10,11,12,13]. The solubility of Zr4+ in cubic ceria is given up to ∼20 mol%, only at higher Zr4+ concentrations tetragonal Zr-rich phases [9,14,15,16], which have a lower oxygen storage capacity, can be formed. Investigations on oxygen release indicate that the degree of reduction increases with increasing Zr4+ concentration up to 15–25 mol% [8,13,17]. The improvement is often attributed to the smaller ionic radius of Zr4+, which compensates stresses due to volume changes in the lattice caused by the larger Ce3+ ions [18,19,20]. In addition, the smaller Zr4+ ion prefers a seven-fold coordination with oxygen in contrast to the eight-fold coordination as in the CaF2 (fluorite) structure, which facilitates the formation of oxygen vacancies by reduction of Ce4+ to Ce3+ [9,21,22,23]. Therefore, the oxygen vacancies are preferably located next to the zirconium ions, which leads to pyrochlore arrangements [10,24]. Besides the improved reduction behavior, the oxidation kinetics and the reoxidation with H2O is slowed down with increasing Zr4+ concentration compared to undoped ceria [13,17,25]. As causes for the worsened reoxidation, in addition to the changed thermodynamic properties [9,10,24,26], the slowed kinetics due to sintering which results in longer diffusion paths and a smaller specific surface area, are discussed [27,28,29]. Studies by Scheffe et al. [13] show that an increase in the reactive surface area has a positive effect on the reoxidation. Furthermore, a co-doping with trivalent cations could be promising. Doping ceria-zirconia with trivalent oxides like Y2O3 leads to a stabilization of the cubic structure and suppression of degradation effects [30,31]. Additionally, trivalent cations induce formation of further oxygen vacancies in the fluorite structure, which increases the oxygen ion mobility [32,33]. These further oxygen vacancies could affect the interaction of Zr4+ and oxygen vacancies built during reduction of Ce4+ to Ce3+ [34].
Our incentive was to combine high sinter-resistant porosity with trivalent doping to achieve the best possible redox performance for Zr4+ doped ceria. With regard to porous shaped bodies, a number of things have already been described in the literature. Pullar et al. [35] reports on fibrous, three dimensionally ordered macroporous, reticulated and biomimetic porous ceria materials. Porous ceria felt, made from a sheet of compressed commercial ceria fibers, has been already investigated using simulated concentrated solar light by Furler et al. [36,37]. In these studies, the production rates of the felts were very low due the low rate of heat transfer. Furthermore, the concentrated solar light was found to destroy the fibrous structure [38]. Another study of commercial fibrous ceria particles described by Gladen and Davidson [39] and tested for CO2 splitting reach low CO yields of only 1.15 mL g–1 which is in combination with the high cost of these fibers and, therefore, makes them less valuable. The fibers of Gibbons et al. [40] prepared by electrospinning with a favored Zr4+ doping level of 2.5 mol%, initially show a high CO production of 3.9 mL g−1, but a continuous increase in the reduction temperature was also observed, indicating further sintering of the fibrous compact. However, with a higher resistance against sintering effects, much greater overall yields by higher Zr4+ doping and fast oxidation kinetics by further three valent doping, a fibrous compact could be very promising for thermochemical cycling.
In this work we present a novel, cost-effective, facile direct processing method for fibrous highly porous Ce-oxide ceramics. Reaction sintering of Ce-oxide and added chopped yttria-stabilized zirconia (YSZ) fibers provides co-doped ceria Ce0.85Zr0.13Y0.02O1.99 compacts with sinter-resistant fibrous microstructure. Furthermore, the influence of temperature on doping element distribution, microstructure and porosity are discussed in view of the applicability as redox material to be used in cyclic thermochemical processes.

2. Materials and Methods

2.1. Sample Preparation

YSZ fiber felts (5mol% Y2O3, ZYF, Zircar Zirconia Inc., Florida, NY, USA) were disintegrated into individual short fiber fragments of 20–200 µm by means of high-energy agitation in a resonant acoustic mixer (LabRAM II, Resodynmixers Inc., Butte, MT, USA). The RAM device was also employed to prepare aqueous slurries consisting of YSZ fibers and CeO2 nanopowders (70–105 nm, ChemPur, Germany) in the required mol fraction (CeO2: YSZ: H2O; 85:15:17). A carbonic acid salt (Dolapix PC80 164413, Zschimmer & Schwarz, Germany) was used as dispersant (4 drops per 10 mL H2O). The aqueous slurry was then filled into a flexible, disc-shaped silicone mold and allowed to dry slowly at ambient temperature. For comparison, CeO2 nanopowders and YSZ nanopowders (5.4vol% Y2O3, PlasmaChem GmbH, Germany) were dry mixed and pressed into pellets. Samples were subsequently sintered at temperatures between 1573 K and 1923 K (10K/min) for 2 h under ambient air.

2.2. Sample Characterization

The sintered samples were characterized by scanning electron microscopy (DSM Ultra 55 FEG, Carl Zeiss, Germany) and energy-dispersive X-ray spectroscopy (EDS, INCA, Oxford Instruments, Abingdon, UK). X-ray powder diffraction (XRD, D8 Advanced, Bruker AXS, Karlsruhe, Germany) using Cu-Kα radiation and EVA/TOPAS software package was used for phase analyses. A Pt-strip-heated stage was also employed for in-situ high-temperature XRD under ambient air (HTK 16N, Anton-Paar, Graz, Austria). In order to obtain maximum intensity at fast scan rates, experiments were performed without Ni primary filter.
The helium pycnometer (AccuPyc® II 1340, Micromeritics, GA, USA) was used to determine the skeletal density of the porous compounds by means of gas displacement. In addition, the enveloping density was determined using a sand pycnometer (Geopyc 1360, Micrometrics, GA, USA). The principle of volume displacement was applied with the aid of Dry Flo, a solid medium. Together with the skeletal density the porosity was then calculated.
Furthermore temperature-dependent dimensional changes of samples were recorded by heating microscopy (L74/HS/1600, Linseis, Selb, Germany).

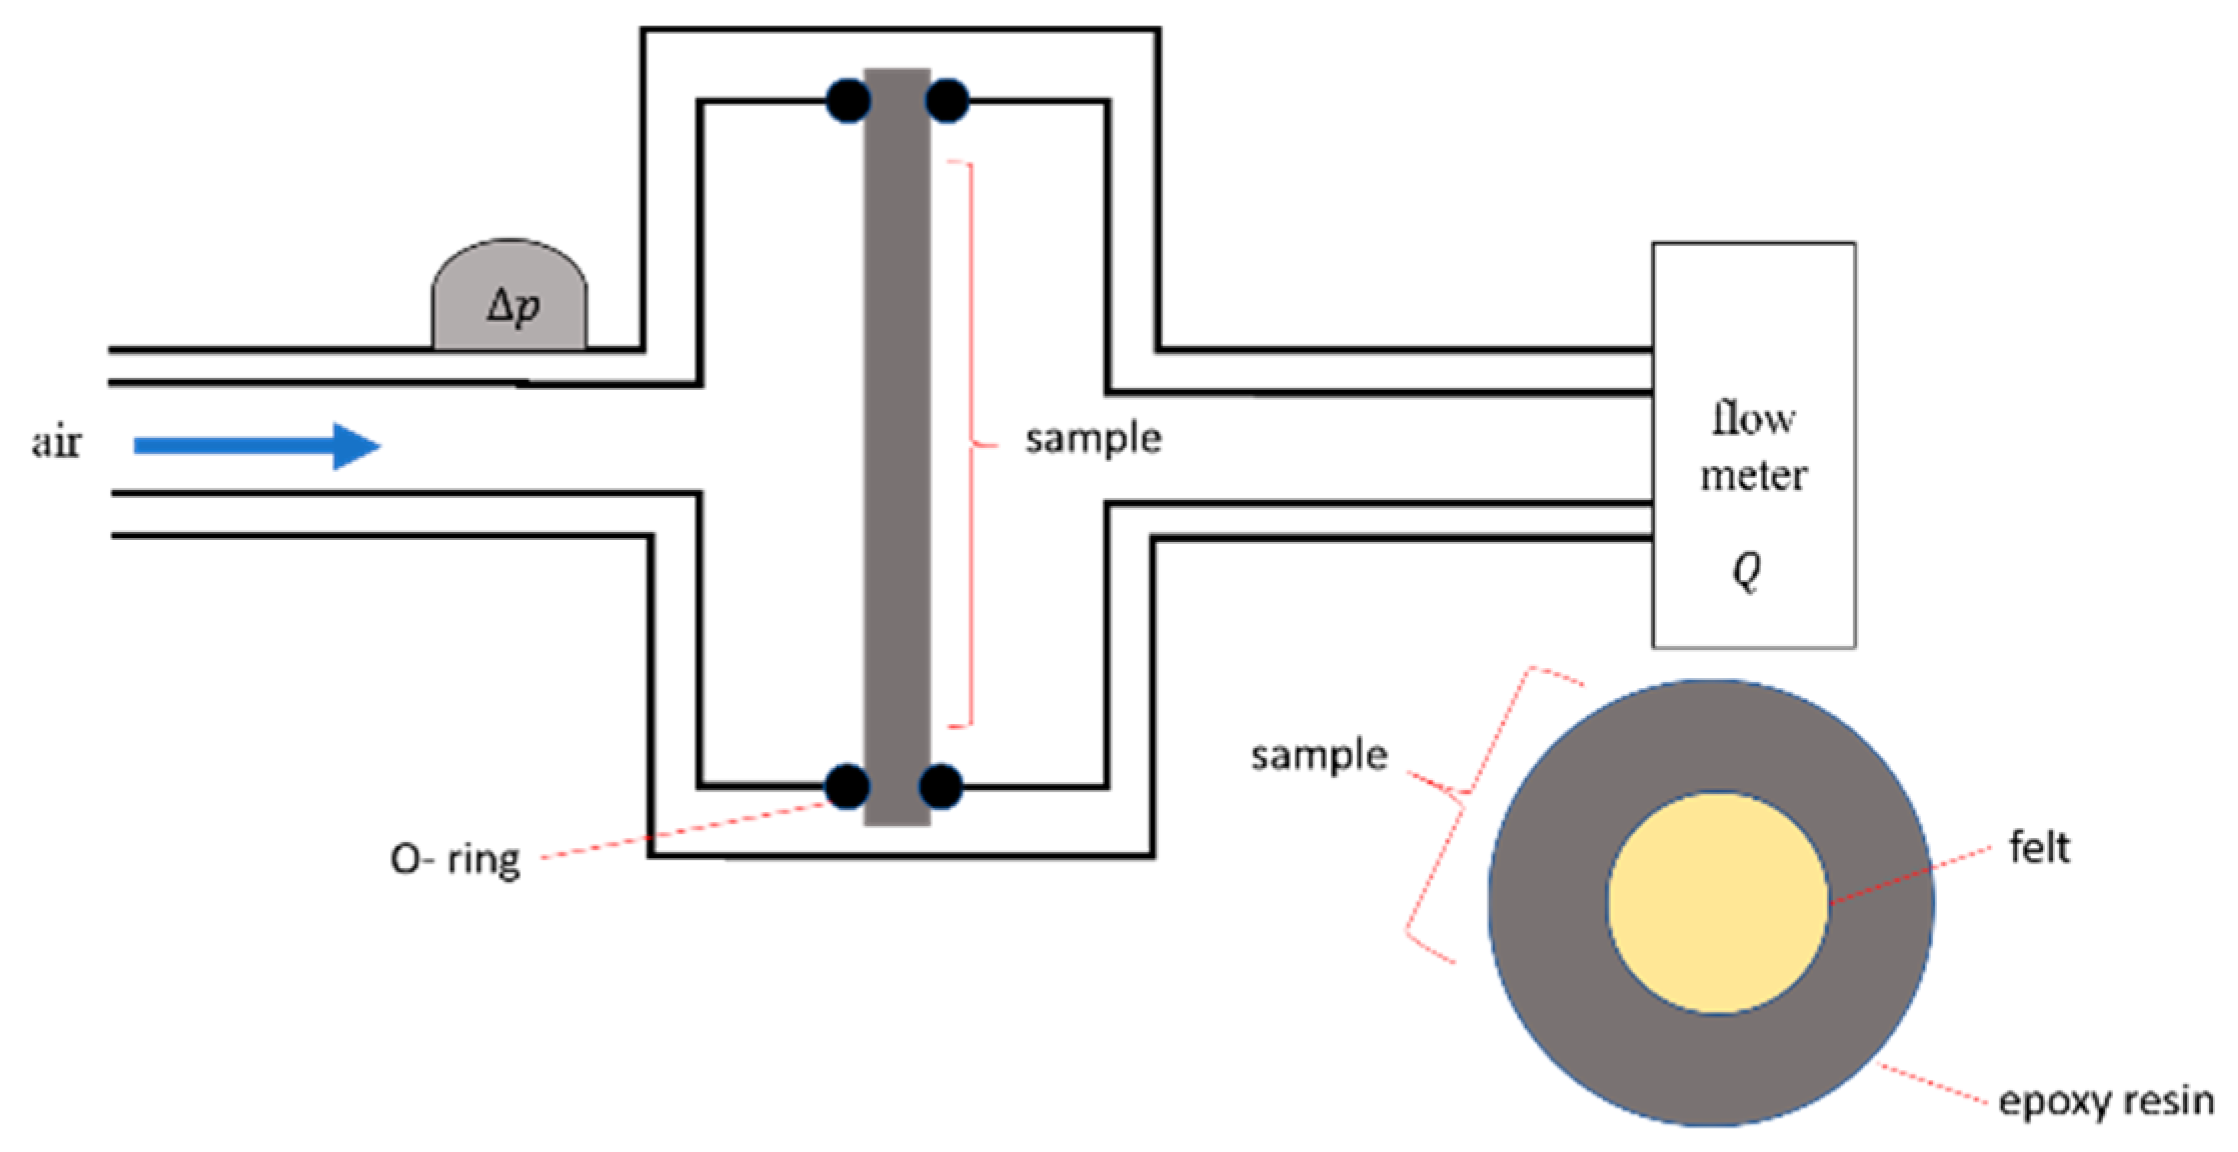
2.3. Gas Permeability Test

The air permeability of the porous ceramics was determined by using a custom setup (see sketch in Figure 1). The porous pellet samples with ~2 mm thickness and ~14 mm diameter were carefully embedded in highly viscous epoxy resin in order to avoid any sealing of porosity. Epoxy discs with central samples were fixed in the steel sample holder with the help of two rubber washers. The static air pressure was measured in the front of the sample by pressure transducer whereas the volumetric air flow Q was measured using a standard laboratory rotameter installed downstream.

2.4. Evaluation of Redox Kinetics

For the evaluation of redox kinetics thermogravimetric analyses (STA 449 F3 Jupiter, Netzsch, Selb, Germany) were performed on samples of Ce0.85Zr0.13Y0.02O1.99 pre-treated at different temperatures in order to determine equilibrium oxygen vacancy concentrations δ(pO2, T). For reduction the samples were heated by a ramp of 20 K/min under Ar (purity of 99,999%, 85 mL/min) and held for 2 h at high temperature. Afterward the samples were cooled down by 50 K/min under argon to the required oxidation temperature and then reoxidized with an oxygen (17 mL/min) / argon (68 mL/min) mixture for 30 min. The concentration of oxygen in the TGA was also controlled and measured using a Nernst-type oxygen detector (GEN’AIR, Setnag, Marseille, France).

3. Results and Discussion

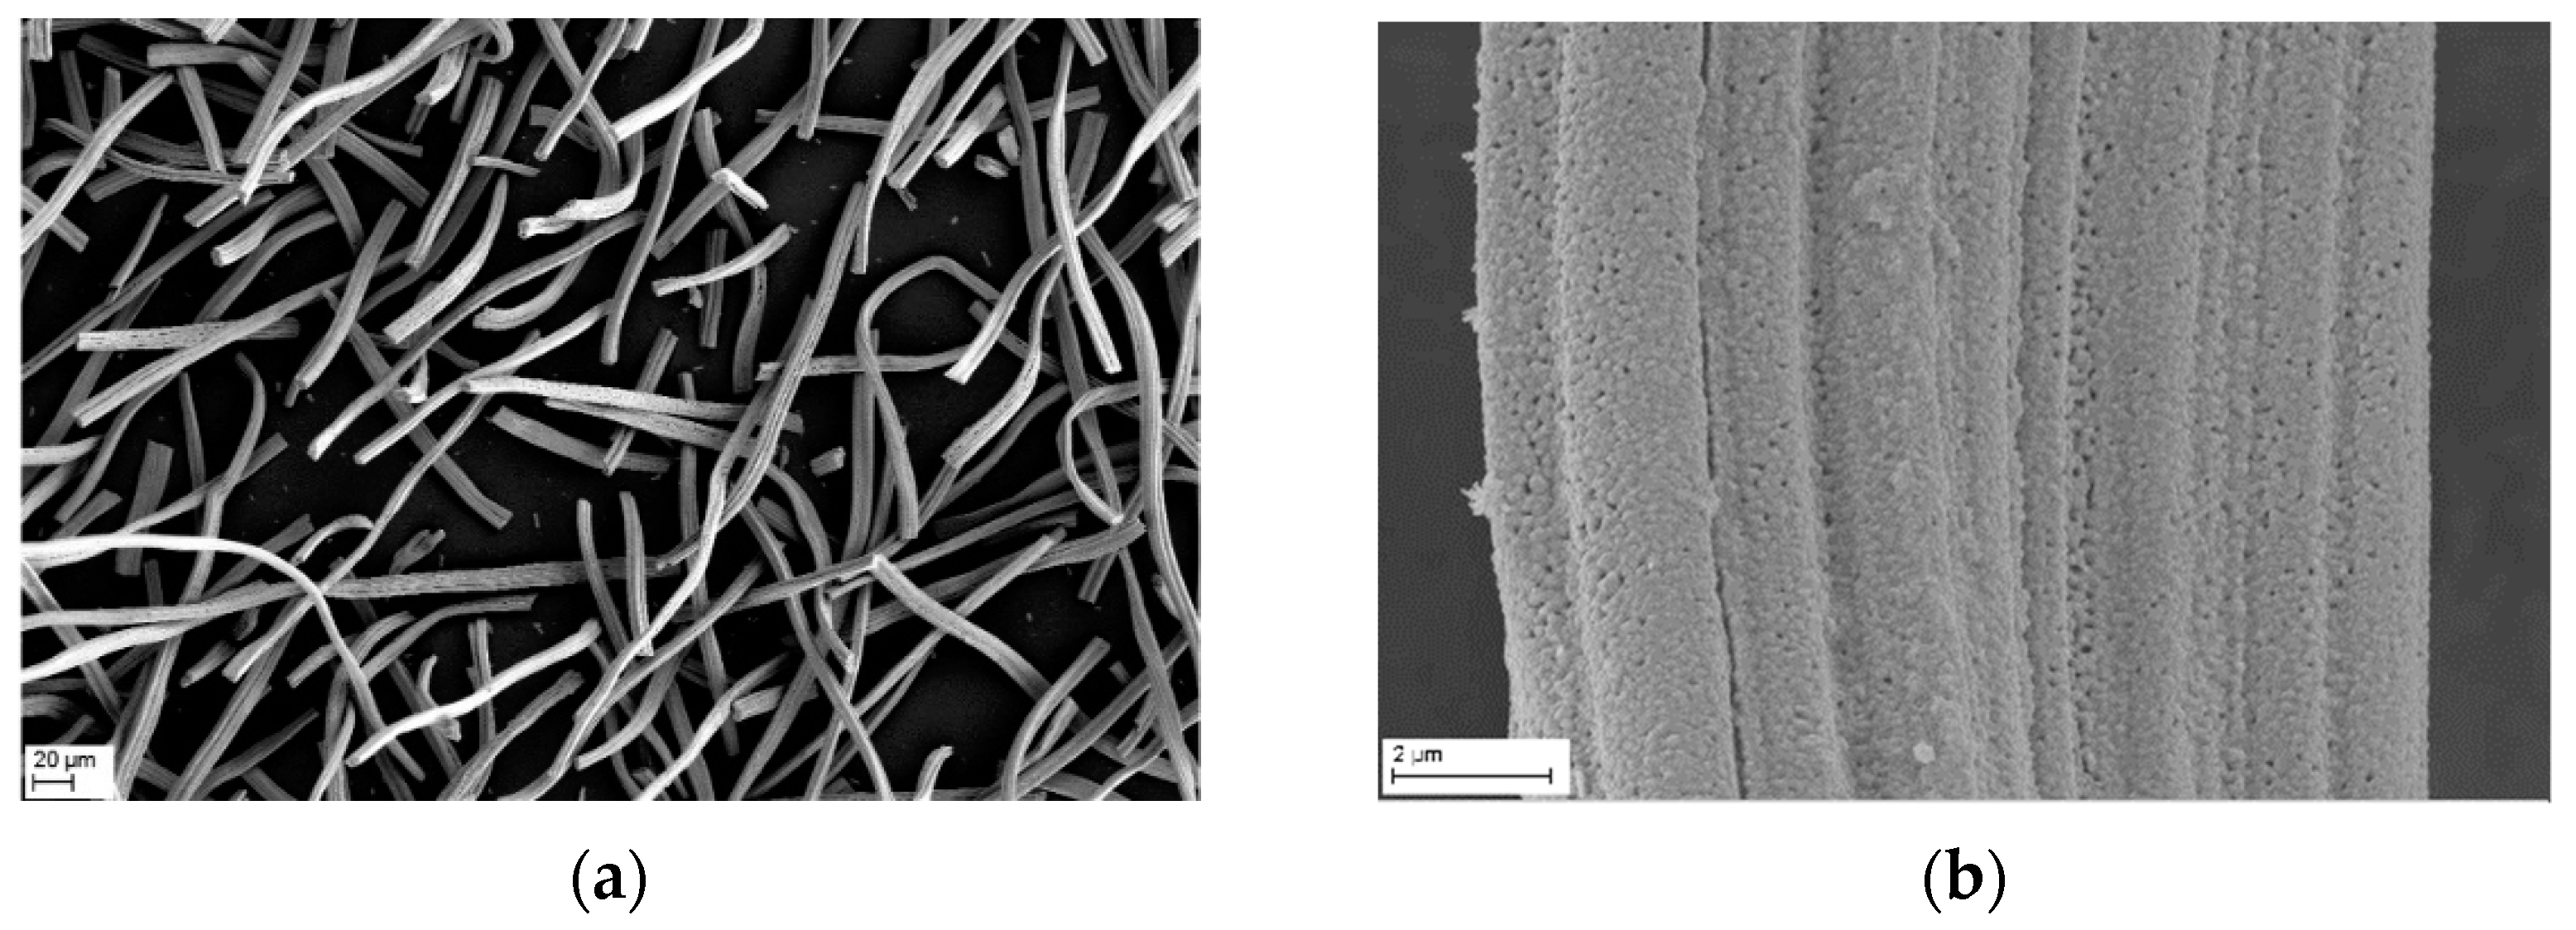
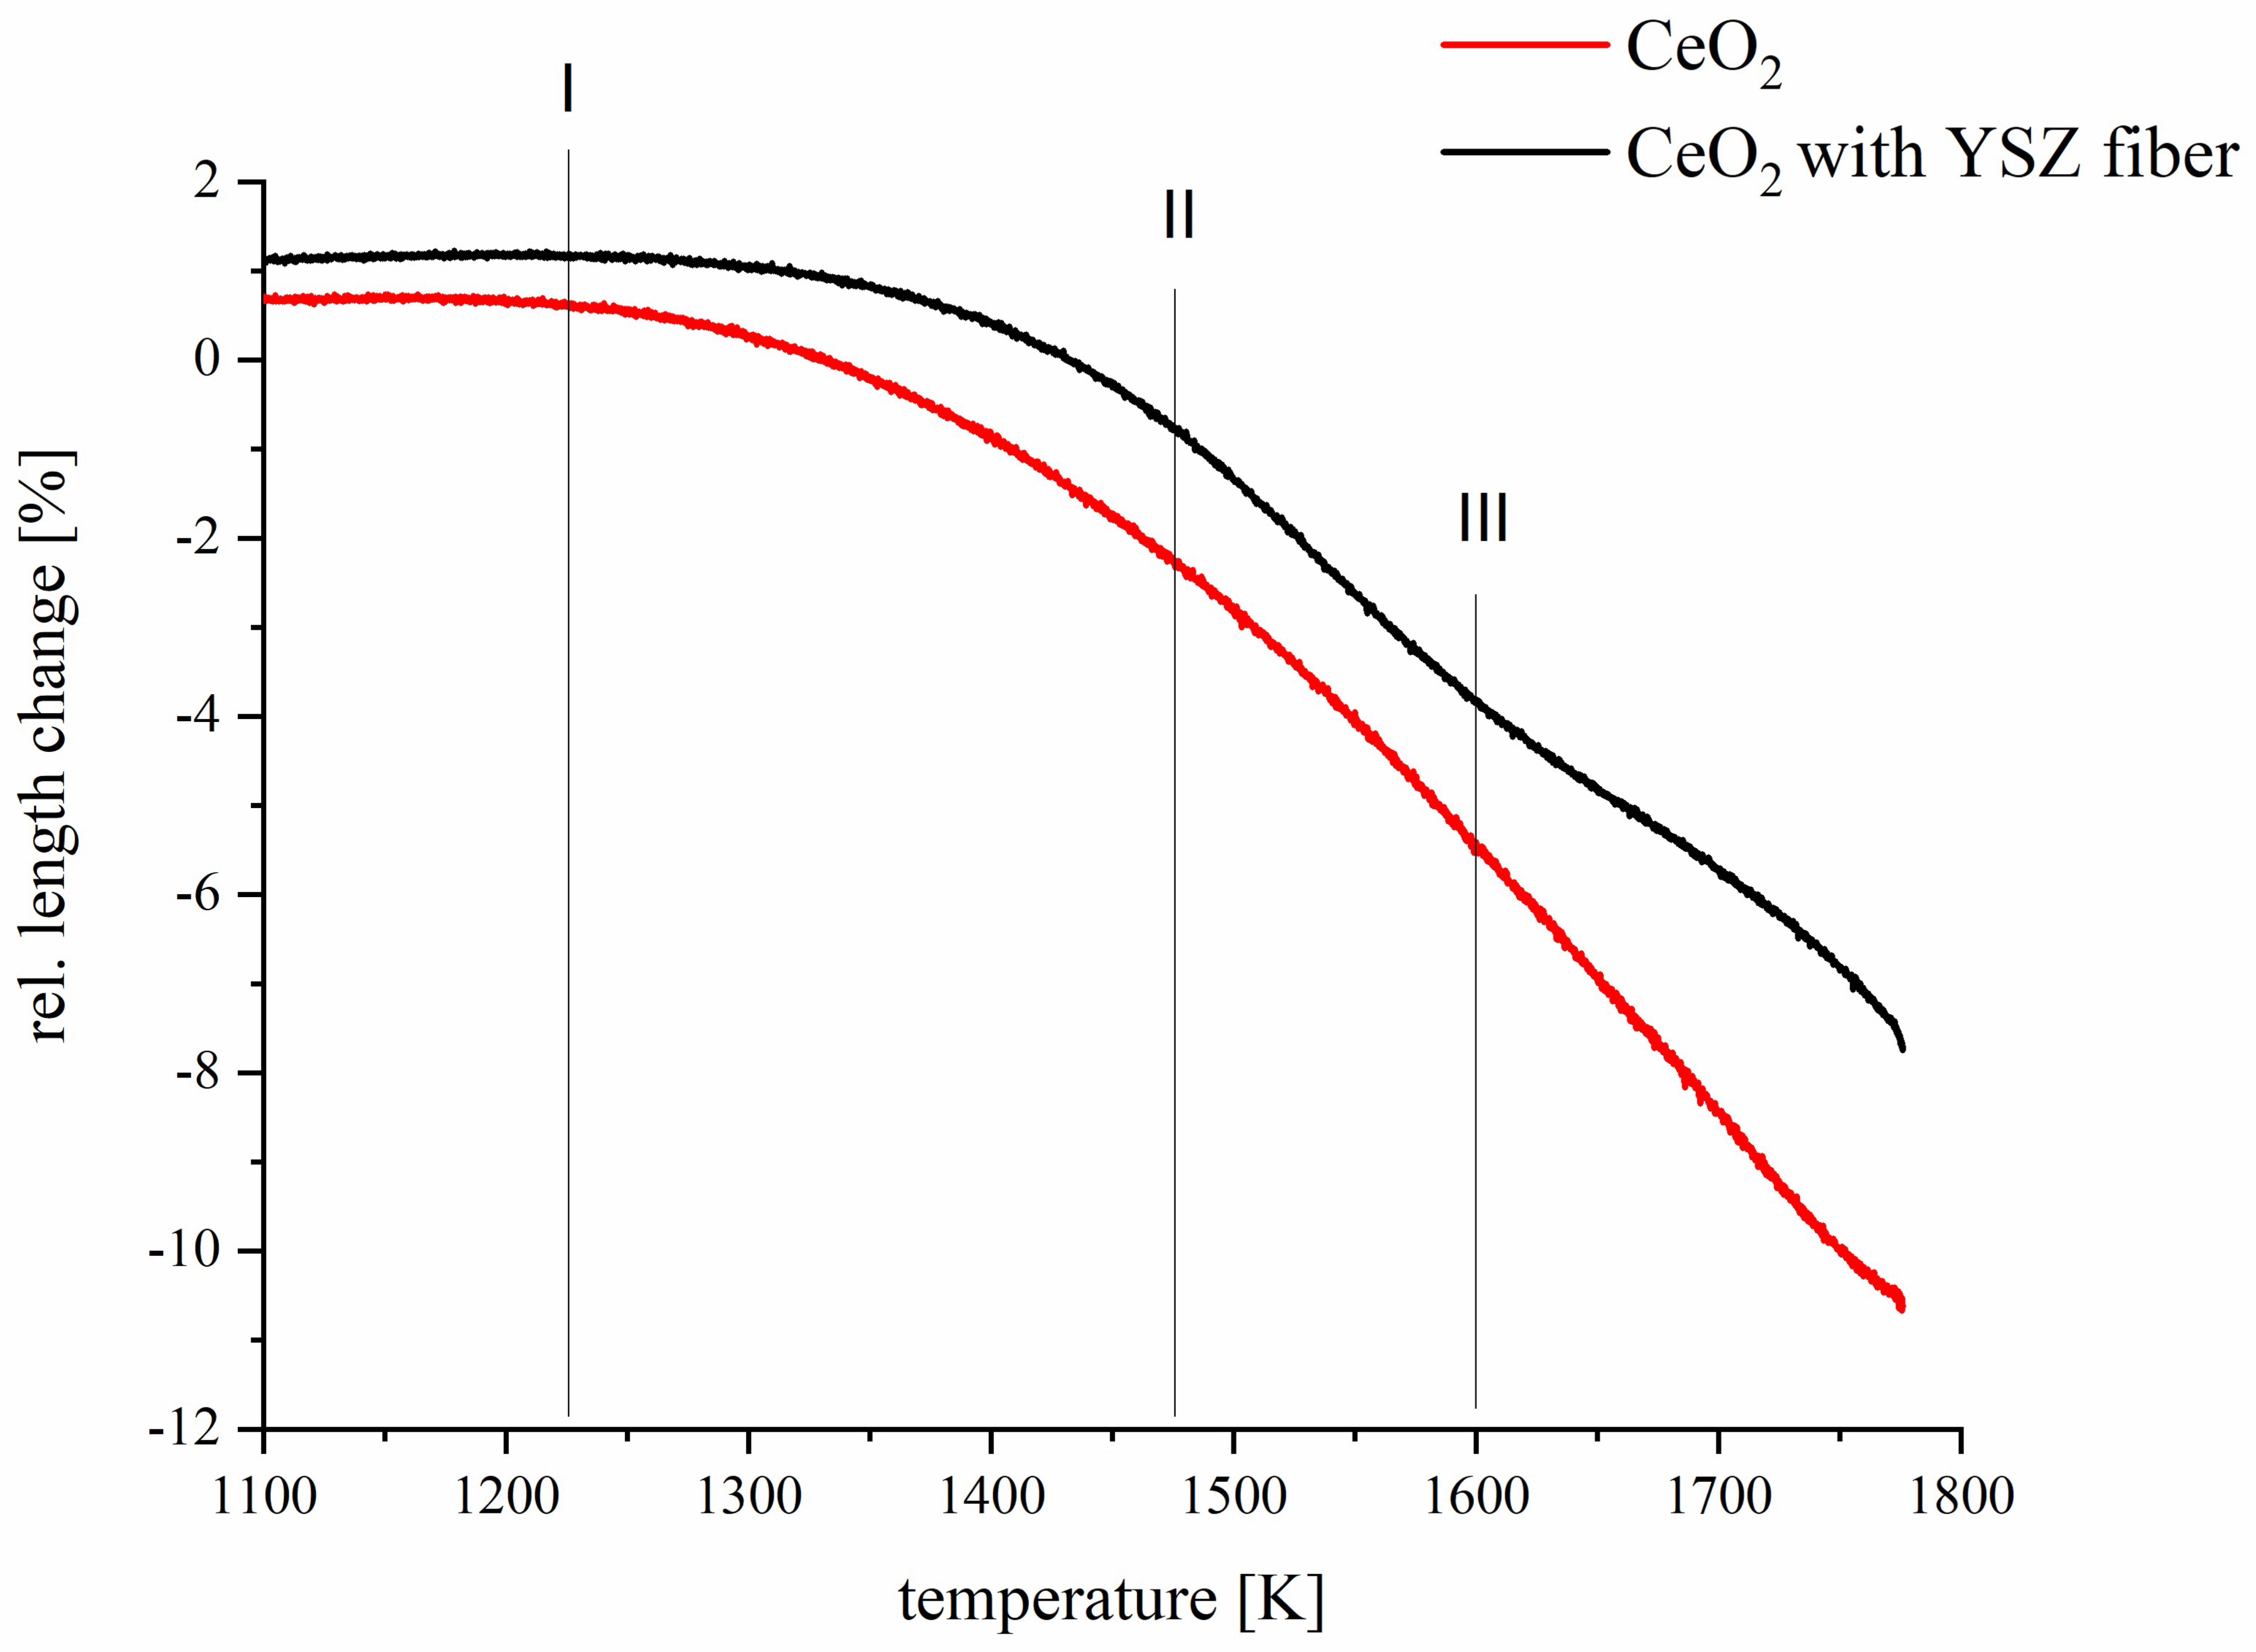
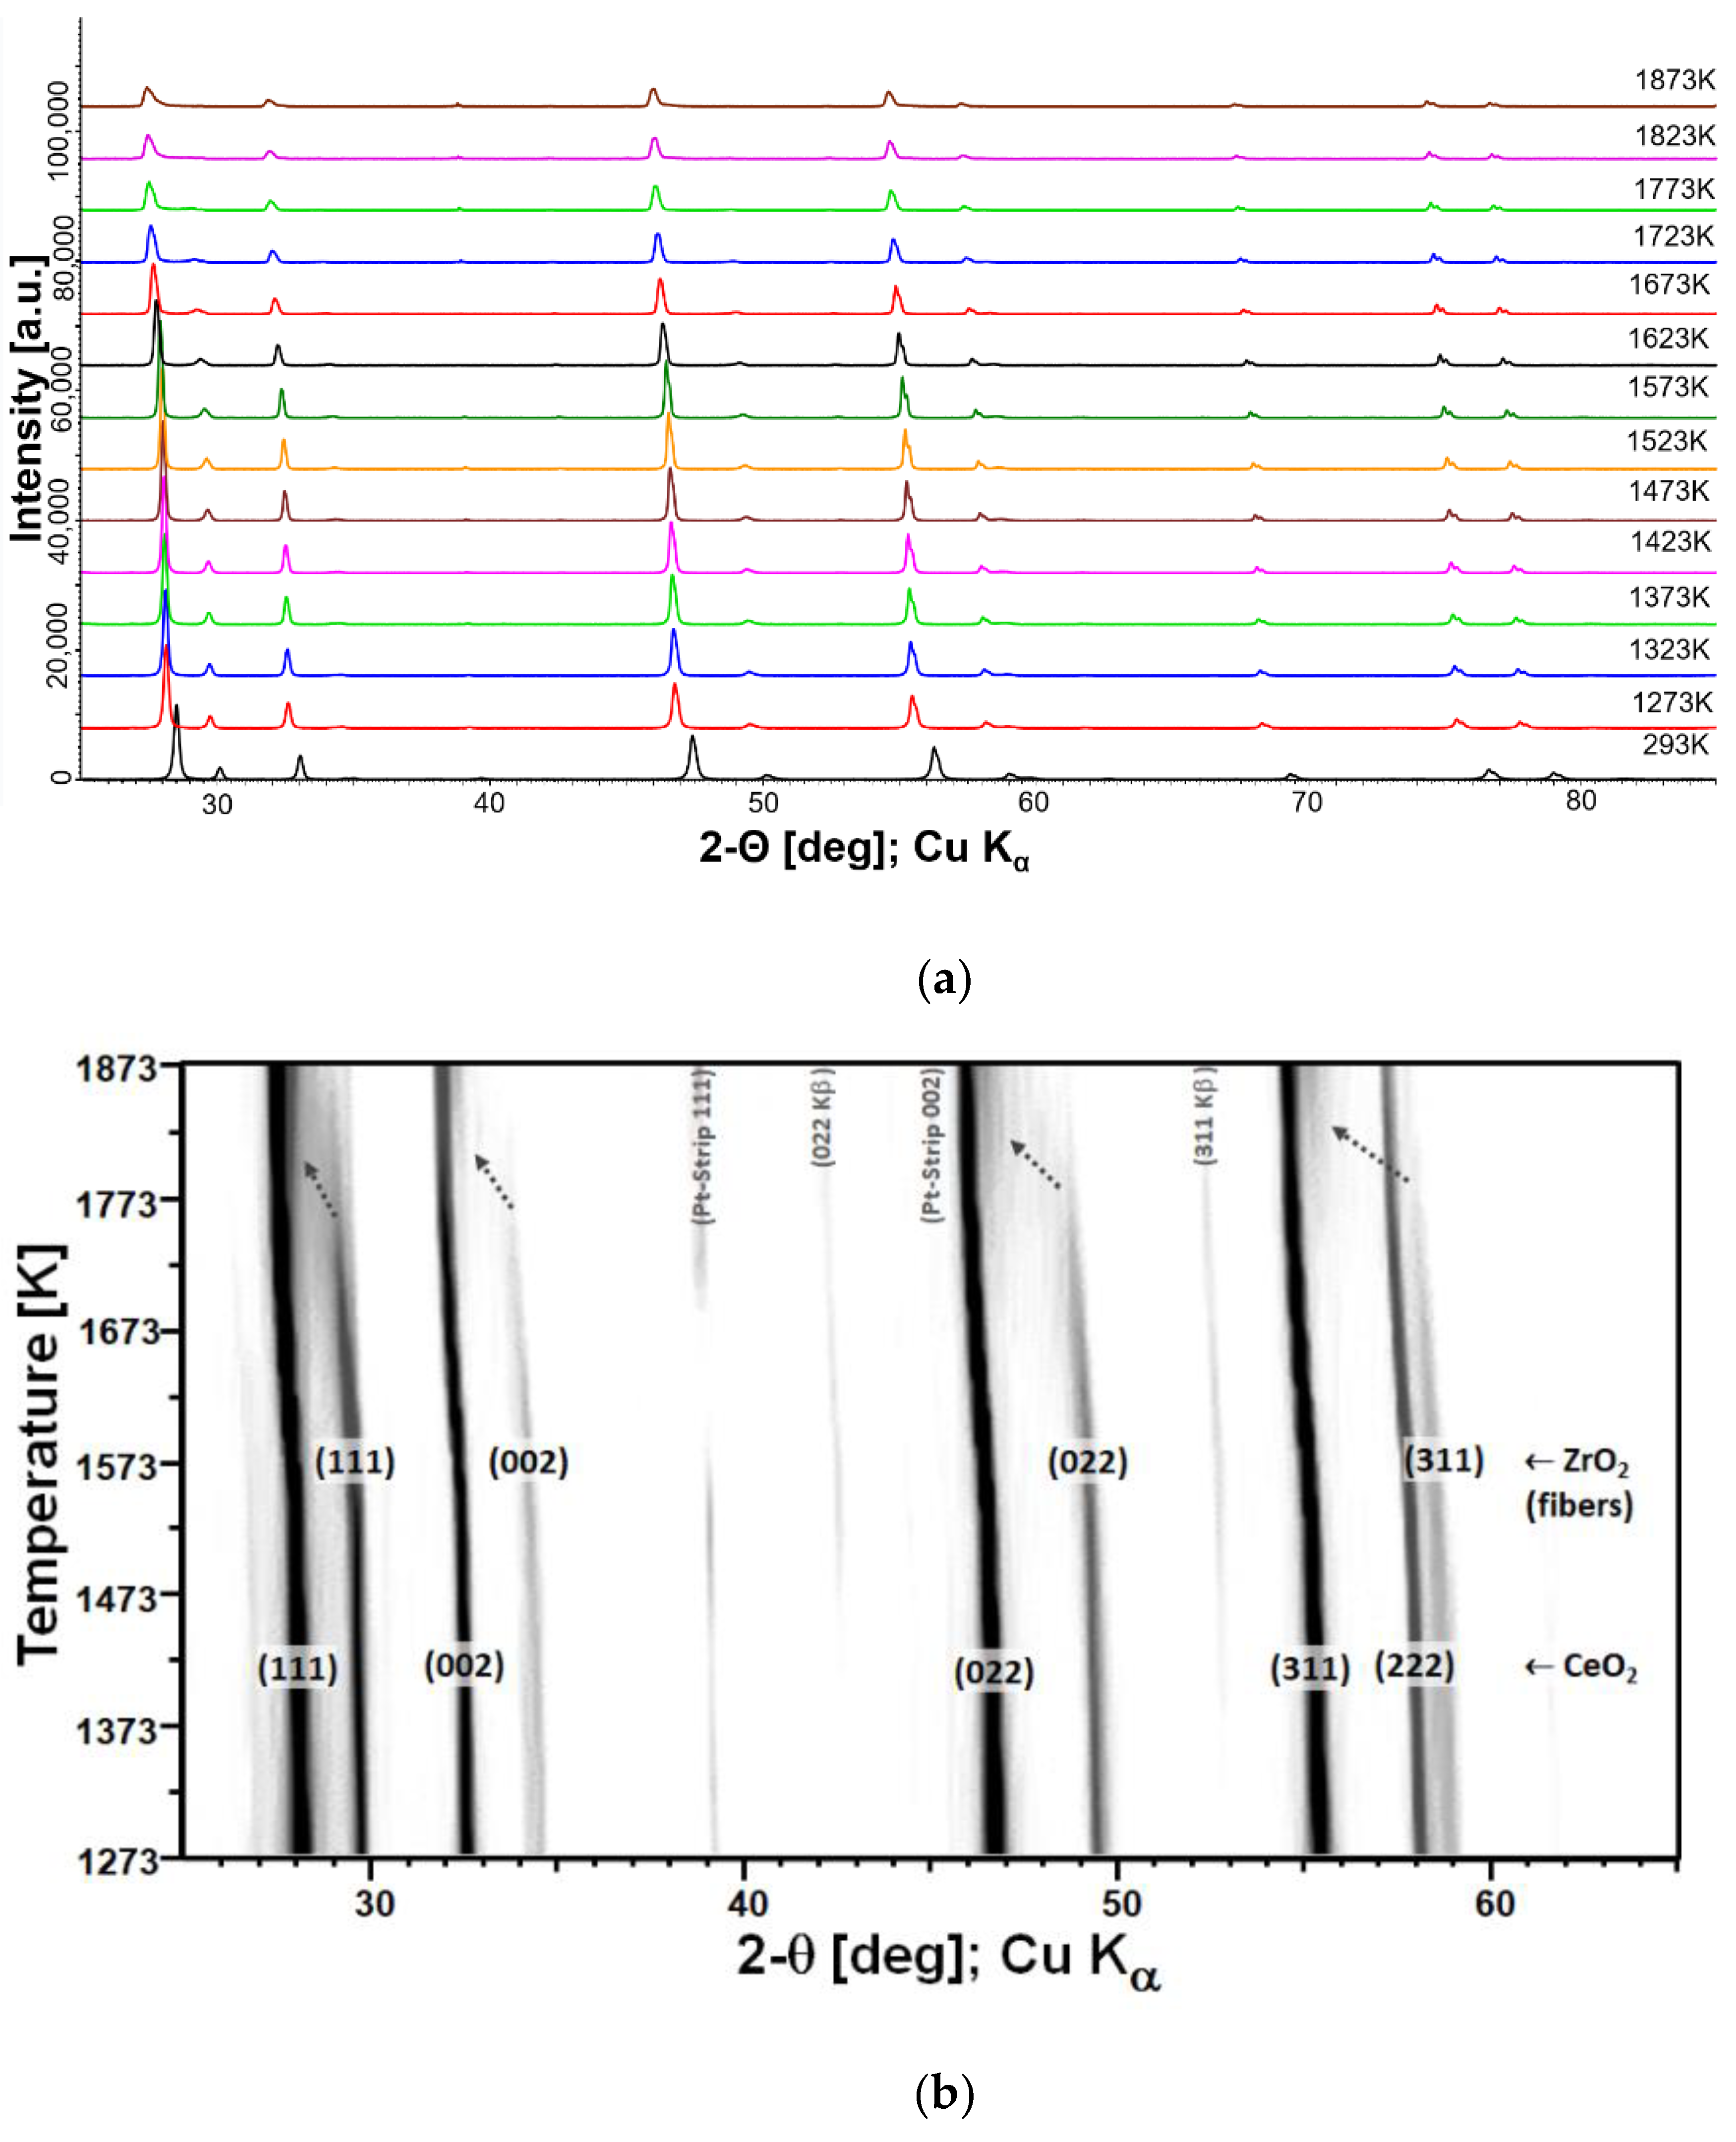
3.1. Fabrication and Microstructural Evolution of Fibrous Y,Zr Co-Doped CeO2 Compacts

The microstructures of the used YSZ fiber are shown in Figure 2. The close-up of the fiber reveals a curled surface and very fine grains in the nanometer range.
After thermal treatment at a high temperature of 1923 K the grains grew up to 2 µm–8 µm whereas the diameter of the fiber remained or shrank (Figure 3a).
For the preparation of fibrous CeO2-ZrO2-Y2O3 compacts the shopped YSZ fibers of Figure 2 were mixed with CeO2 as described previously. After a temperature treatment at 1573 K, a small amount of CeO2 has already diffused into the YSZ fiber, according to the results of SEM in Figure 3b and peak shift of diffraction in Figure 4a. However, the majority of cerium oxide is still present as a matrix next to the fibers, as seen in Figure 3b. As the temperature increases, the matrix content decreases significantly. After a temperature treatment at 1923 K, the cerium oxide matrix has almost disappeared (Figure 3c).
Figure 3 also enables a comparison between stand-alone YSZ fibers and reacted fibers after reaction at 1923 K (Figure 3a,c), respectively. It is evident that fibers in the former CeO2/YSZ mixture now have a significantly greater diameter and grain morphology is quite different to the ‘bamboo’-like morphology of stand-alone YSZ fibers. The only plausible effect explaining the observed microstructure and chemical composition is massive diffusion of CeO2 into YSZ fibers and subsequent formation of the new phase. According to the results of EDS and X-ray diffraction (Figure 4) the phase could be described as Ce0.85Zr0.13Y0.02O1.99 solid solution.
‘Swelling’ fibers, i.e., increasing fiber volume and the simultaneously disappearing CeO2 space filling raised the question if volumetric effects could also be associated with this specific reaction. Actually, such volume effects associated with CeO2-diffusion into YSZ fibers at higher temperatures could also be observed directly via the change in sample dimensions using a heating microscope. Figure 5 shows the relative change according to Equation (1) for pellet samples of pure ceria and ceria with fibers.
Δ l L = ( L C e O 2 δ ( T ) L C e O 2 ( T ) ) L C e O 2 ( T )  
Δ l = length change, L = length of the sample, L C e O 2 δ = length of the heated and maybe reduced sample, L C e O 2 ( T ) = length of the oxidized sample at 293K.
The curve shape of pure ceria (Figure 5, red curve) corresponds to the expected temperature-induced shrinkage linked to volume and grain boundary diffusion processes. The onset temperature of sinter-shrinkage is appr. 1150 K, then the sintering curve exhibits a conventional parabolic shape. In contrast, the respective sintering curve of CeO2/YSZf (Figure 5, black curve) shows three significantly differing features. The onset temperature for sintering is appr. 1250 K (I). A slight deviation from the parabolic shape is observed at about 1450 K, where sintering seems to accelerate (II). Interestingly, the sintering significantly slows down again above 1600 K as seen by the curve trending to a lower relative length change (III). As thermal activation for sintering is expected to be similar for both samples, there is obviously a kind of superposed volume expansion effect in the case of the CeO2/YSZf sample. This expansion could indicate a just-beginning reduction of Ce4+ to Ce3+ that could be accompanied by an expansion of the crystal lattice [41]. According to the literature, Zr4+ addition decreases the temperature of the reduction step compared to pure ceria [16], which could explain the observed effect. However, it is concluded that the significant dilatometer curve is most likely due to in-diffusion of CeO2 into the rigid YSZ fiber network and subsequent ‘swelling’ due to formation of the assumed new solid solution. The fact that CeO2/YSZf retains its fibrous morphology and shows much less sinter-shrinkage than conventional CeO2 powder compacts is considered a unique feature for manufacturing and operation of porous bodies at extremely high temperatures.
The observed, nearly complete diffusion of CeO2 into the YSZ fiber network was an a priori unexpected behavior which motivated us for deeper analysis of underlying mechanisms. Besides SEM, EDS and heating microscope, the reaction between CeO2 powders and YSZ fibers was monitored in situ by HT-XRD between 1273 K and 1873 K. In order to duplicate the standard 10/K min heating profiles used for sample preparation and other analyses, XRD profiles were collected under isothermal conditions combined with faster heating ramps (100 K/min rate).
Figure 6a shows a standard ‘stack’ representation of the HTXRD measurements of the CeO2/YSZ felt mixture. The corresponding ‘plane view’ 2D XRD-profile (Figure 6b) is well suited to display the deviation from standard linear expansion above 1573 K; CeO2 as well as YSZ peaks shift significantly faster toward lower 2-theta, whereas the streak of 111 Pt reflection from the sample holder is still linear. Note that weak peaks at 2-theta positions of 43 and 53 are Kß reflections of CeO2 caused by insufficient electronic filtering. A remarkable effect is observed for YSZ reflections above 1725 K; in addition to accelerated shifting toward corresponding CeO2 peak positions, peaks are fading out and now appear only as ‘shoulders’ of CeO2 peaks (see arrows in Figure 6b). This finding is also confirmed by respective lattice constant calculations which were performed by means of analytical profile fitting using the TOPAS software package (see Figure 7). Whereas CeO2 only shows a minor decreasing trend above 1573 K, YSZ displays a strong increase above 1725 K and evidently approach CeO2 lattice parameters. Evidently, the major impact of cation (inter-)diffusion is occurring in YSZ, and the composition of the newly forming solid solution is evolving in the direction of CeO2. Therefore, it can be concluded that CeO2 is diffusing much faster, quasi unidirectionally into YSZ fibers, which also explains the observed microstructure. The schematic diagram in Figure 8 illustrates the observed unusual unidirectional diffusion and the resulting swelling of the YSZ fiber.
In order to study the reaction between CeO2 and YSZ fibers we conducted an experiment where fibers were not infiltrated but brought into contact with a similar CeO2-matrix as diffusion couple. For this, a highly viscous CeO2 slurry (‘paste’) was prepared wherein a piece of YSZ felt was carefully placed. Due to the high viscosity, undesired infiltration of CeO2 into the YSZ felt could be minimized. After thermal treatment (1923 K/2 h) the felt/matrix diffusion couple was stabilized with epoxy resin and prepared for an SEM/EDS analyses. Figure 9 shows the respective cross-section with an approximately 100 µm thick part of the CeO2-matrix on the left. EDS analyses were performed as vertical line scans across the entire field of view, as indicated by dashed lines. Site-dependent quantifications for Ce, Zr, and Y are plotted as overlay on the SEM image (note that values are normalized to cations). At a glance, concentration profiles of Ce and Zr show a significant deviation from an expected symmetric, sigmoidal shape when entering the CeO2-section of the diffusion couple. Normally, one would initially expect bidirectional (inter-)diffusion of cations. The high-temperature polymorph of YSZ is cubic and isomorphic with CeO2, both being members of the AO2 oxides fluorite-type crystal structure family. Zr4+ is isovalent with Ce4+ and the effective ionic radii of Zr4+ and Y3+ in eight-fold coordination (Zr4+ = 84 pm, Y3+ = 102 pm) are close to the ionic radius of Ce4+ (Ce4+ = 97 pm) [18], so a diffusion of ZrO2 and Y2O3 into CeO2 with some formation of oxygen vacancies to equilibrate charge deficit by Y3+ (‘defect fluorite’) seems to be plausible. However, the non-sigmoidal EDS profiles show that the Zr4+ ion concentration in ceria is relatively low and Y3+ diffusion into the CeO2 matrix is below detectability limits of EDS (see Figure 9). In contrast to these findings, diffusion of CeO2 into the YSZ fibers follows the expected trend, as indicated by the parabolic concentration curve.
In general, the diffusion in solids occurs by migration across vacancies and interstitial sites, but not by direct site change mechanism [42]. Grain boundaries, phase boundaries and surfaces are areas with reduced binding energy, which means that surface-diffusion is considerably faster than volume-diffusion [42]. The YSZ of the fibers has a grain size of about 70 nm which is close to the grain size of the used ceria powder. As a result, it is expected that cation diffusion is not due to the difference in grain size but mainly explained by cation vacancies. A vacancy migration controlled cation diffusion in undoped and doped ceria has also been reported by Beschnitt and De Souza [43]. In the case of an acceptor doped system with [ Y Z r ´ ] = 2 [ V O . . ], an increasing concentration of the acceptor dopant at constant temperature leads to an decrease of the concentration of V Z r . According to the Schottky equilibrium, the concentration of cation vacancies is inversely proportional to the concentration of oxygen vacancies. Consequently, the bulk cation diffusion coefficient should decrease with increasing Y3+ concentration. Our data, however, shows an opposite trend (Figure 9); cation diffusion seemed to be higher at the high dopant concentration side (Y-doped ZrO2) and lower at the undoped ceria side. Such surprising cation diffusion behavior was also observed by Beschnitt and De Souza [43] for Zr4+ diffusion in Y3+-doped ceria. In the present case, cation diffusion seems to follow a sigmoidal trend in ceria and a parabolic trend in YSZ (see Figure 9).
After complete cation diffusion at high temperature, a quasi-homogeneous ceramic with outstanding porosity was formed (Figure 10). Such highly porous and fibrous CeO2-ZrO2-Y2O3 ceramics can hardly be obtained by means of sintering of conventional powder mixtures, in particular, at sintering temperatures of 1923 K. This novel preparation also provides advantages in comparison to elaborate the electrospinning process, e.g., [44]. The direct introduction of YSZ fiber into porous ceramics has so far been reported in the literature mainly only in the field of fiber reinforcing porous ceramic, e.g., [45], where the matrix is still present also after the sintering process. In the literature, the highest porosity of porous YSZ ceramics produced via common gel-casting method was 75.9% (after 1623 K for 2 h), but the porosity quickly drops to 66% at higher temperature of 1773 K [46]. Dong et al. obtained with their fabrication method for YSZ ceramics, including YSZ fiber with 10 vol% solid loading and 20 wt% fiber addition, a porosity of 75.4% (sintered at 1773 K for 2 h) [45]. In this study, the porosity of the high sintered Ce0.85Zr0.13Y0.02O1.99 felt was determined by means of helium pycnometry. The solid density referring to the fibrous oxide was calculated to 7.05 ± 0.02 g/cm3, i.e., close to the theoretical density of CeO2, indicating a pore-free ‘skeleton’. The bulk density was calculated to 2.96 ± 0.14 g/cm3 which translates to 58 vol% open porosity after sintering at 1923 K.
Despite the high sintering temperature, the high porosity of the ceramic body is retained. The fibrous microstructure seems to be very helpful to impede densification during the sintering process. The high porosity enables a high gas permeability. The gas flow through a porous medium is usually described by Darcy’s law [47]:
K = Q · μ · l A · Δ p
where K = permeability; Q = flow rate; µ = Viscosity coefficient of air; l = length of the porous body; A = cross-sectional area of the porous body; Δ p = pressure gradient.
Darcy’s law indicates that the flow rate through a porous medium is proportional to the pressure gradient Δ p and the permeability K is inversely proportional to the viscosity coefficient µ of the gas [48]. Figure 11 depicts the permeability of air through fibrous Ce0.85Zr0.13Y0.02O1.99 as a function of the pressure gradient Δ p .
A laminar flow as described by Darcy’s law can be observed from a pressure gradient of 100,000 Pa. At smaller pressure gradients, the dominating surface forces cause turbulent flow which is responsible for the nonlinear permeability/pressure relationship. The permeability at a higher pressure gradient amounts to values in a range of 1.6–3.3 × 10⁻¹⁰ m², close to the values achieved by Haussener and Steinfeld [49] for porous ceria using graphite as the pore former. In comparison to Isobe et al. [50], when achieving permeabilities for nitrogen in the range of 10–14 m² for porous Al2O3 samples with unidirectionally aligned pores, our observed permeability values are one to two orders higher.

3.2. Redox-Kinetics

The gas permeability is a key to fast redox kinetics for thermochemical cycling. The porosity has a direct influence on the oxygen partial pressure and the related redox kinetics as well as on the hydrogen generation during oxidation due to the higher surface area. To evaluate the redox performance the oxygen loss δ during reduction at high temperature is calculated. The value of δ can be determined from the mass changes Δ m detected by TGA using the formula:
δ = M · Δ m M O ·   m s
where M is the molar mass of Ce0.85Zr0.13Y0.02O1.99, Δ m the equilibrium value of the mass change during the redox-reaction, m s the sample mass in the fully oxidized state, and M O the molar mass of oxygen. Figure 12 shows the δ values calculated from the mass loss curves of TGA experiments. Samples are oxidized in air at 1073 K followed by heating to the targeted reduction temperature steps under streaming Ar (purity of 99,999%), respectively. The achieved δ values of fibrous Ce0.85Zr0.13Y0.02O1.99 are comparable to the values of reference monolithic Zr-doped cerium oxide. Compared to pure cerium oxide, significantly higher delta values are observed.
Figure 13 shows the re-oxidation curves at 1173 K under air after reduction at 1473 K under Ar (purity of 99,999%). The reduction temperature was chosen so low so that the cooling time to the oxidation temperature is as short as possible.
The comparison of the re-oxidation curve of fibrous compacts to curves of dense pellet samples of the same doping and pure Zr doping clearly shows that the re-oxidation rate is many times faster. The mass curves were also fitted by Origin software (OriginLab Inc., Northampton, MA, USA) using the equation
y = y 0 + A 1 e x p ( x x 0 t 1 )
which is included in the Origin software as a standard function (‘ExpDecay1’) for fitting decay-type curves. The calculation of t 1 enables a consideration of the relaxation time constant τ . After the time t = ln(2)τ ≈ 0, 69τ (half-life), the magnitude has approached half of the final value, after t = τ to about 36.8%, after t = 2 τ to about 13.5%, and after t = 3 τ to about 5.0%; i.e., the system is relaxed to approx. 95% at this time.
The relaxation time constant of our fibrous compact is much smaller than that of the dense pellets, even though a higher reduction state is present (see Table 1). The use of porous felts can thus result in a significant acceleration of the re-oxidation, which can be attributed to the larger specific surface area and the smaller diffusion paths. Therefore, the fibrous compacts provide both extended reduction and faster re-oxidation kinetics. An early report of a fibrous ceria material shows that a commercial porous ceria felt (CeF-100 by Zircar Zirconia Inc.) with fibers of 7 µm diameter, 100 µm long, 88% porosity and a density of 0.86 g cm−3 was completely destroyed after cycling using a high flux simulated solar light powered TGA, (reduction and oxidation temperatures of ∼1598 K and ∼1098 K for short periods of 4-5 min) due to sintering [38]. Another study of Zr-doped ceria electrospun fibers of 1µm diameter show a better cycling performance and resistance to sintering up to 1703 K [40]. However, as shown for pure Zr-doped cerium oxide ceramics, higher reduction states can be expected here, but the oxidation rate decreases sharply, leading to slower performance. Our Y-Zr-doped ceria fiber-compacts show fast re-oxidation kinetics and are resistant to high temperature due pre-sintering at 1923 K. The results of X-ray diffraction (Figure 14a) do not give a hint to changes of the structure and further formed phases. The SEM image shows that the fibrous structure is retained even after cycling (Figure 14b). Note that minor remnants of the matrix are visible in this region, but according to EDS analyses their composition is the same as for the fibers.
Furthermore, the thicker nature of the fiber could enable a uniform heating due to deeper penetration and bulk volume absorption of the concentrated solar radiation in comparison to felts described by Pullar et al. [35].

4. Conclusions

Highly porous Ce0.85Zr0.13Y0.02O1.99 ceramic compacts consisting of fibers with diameters in the range of 8–10 µm have been successfully prepared by infiltration of commercial YSZ fibers with a cerium oxide matrix and subsequent sintering. This preparation technique revealed an unexpected behavior where the cation diffusion is higher at the high dopant concentration side (Y-doped ZrO2 fibers) and lower at the undoped ceria side. This resulted in quasi unidirectional diffusion and thus complete incorporation of the present ceria matrix into the YSZ fibers. The resulting chemically homogeneous fiber-compacts show strong resistance to sintering and related microstructural degradation. They retain a high porosity of around 58 vol% even after long-term sintering at 1923 K. The fiber-compacts show a high potential for the application in thermochemical redox cycling. The first evaluation of redox kinetics shows that the relaxation time of oxidation is five times faster than that of dense samples of the same composition. The rapid gas exchange due to the high porosity also allows higher reduction rates, which could enable higher hydrogen yields in thermochemical water-splitting redox cycles. The presented fiber-compact preparation method is considered very promising for cost-effective manufacturing of large-scale functional CeO2-based components for solar-thermal high-temperature reactors.

Author Contributions

Formal analysis, N.K. and P.M.; Investigation, N.K. and P.M.; Writing—original draft, N.K. and P.M. All authors have read and agreed to the published version of the manuscript.

Funding

This research received no external funding.

Data Availability Statement

Not applicable.

Acknowledgments

Porosity measurements performed by J. Schettler (DLR Institute of Materials Research) are thankfully acknowledged.

Conflicts of Interest

The authors declare no conflict of interest.

References

  1. D’Souza, L. Thermochemical hydrogen production from water using reducible oxide materials: A critical review. Mater. Renew. Sustain. Energy 2013, 2, 1–12. [Google Scholar] [CrossRef] [Green Version]
  2. Roeb, M.; Neises, M.; Monnerie, N.; Call, F.; Simon, H.; Sattler, C.; Schmücker, M.; Pitz-Paal, R. Materials-Related aspects of thermochemical water and carbon dioxide splitting: A review. Materials 2012, 5, 2015–2054. [Google Scholar] [CrossRef] [Green Version]
  3. Agrafiotis, C.; Roeb, M.; Sattler, C. A review on solar thermal syngas production via redox pair-based water/carbon dioxide splitting thermochemical cycles. Renew. Sustain. Energy Rev. 2015, 42, 254–285. [Google Scholar] [CrossRef]
  4. Abanades, S.; Flamant, G. Thermochemical hydrogen production from a two-step solar-driven water-splitting cycle based on cerium oxides. Sol. Energy 2006, 80, 1611–1623. [Google Scholar] [CrossRef]
  5. Chueh, W.C.; Haile, S.M. A thermochemical study of ceria: Exploiting an old material for new modes of energy conversion and CO2 mitigation. Philos. Trans. A Math. Phys. Eng. Sci. 2010, 368, 3269–3294. [Google Scholar] [CrossRef] [Green Version]
  6. Knoblauch, N.; Dörrer, L.; Fielitz, P.; Schmücker, M.; Borchardt, G. Surface controlled reduction kinetics of nominally undoped polycrystalline CeO2. Phys. Chem. Chem. Phys. 2015, 17, 5849–5860. [Google Scholar] [CrossRef] [PubMed]
  7. Meng, Q.-L.; Lee, C.; Ishihara, T.; Kaneko, H.; Tamaura, Y. Reactivity of CeO2-based ceramics for solar hydrogen production via a two-step water-splitting cycle with concentrated solar energy. Int. J. Hydrog. Energy 2011, 36, 13435–13441. [Google Scholar] [CrossRef]
  8. Call, F.; Roeb, M.; Schmücker, M.; Bru, H.; Curulla-Ferre, D.; Sattler, C.; Pitz-Paal, R. Thermogravimetric analysis of zirconia-doped ceria for thermochemical production of solar fuel. AJAC 2013, 4, 37–45. [Google Scholar] [CrossRef] [Green Version]
  9. Kuhn, M.; Bishop, S.R.; Rupp, J.; Tuller, H.L. Structural characterization and oxygen nonstoichiometry of ceria-zirconia (Ce1−xZrxO2−δ) solid solutions. Acta Mater. 2013, 61, 4277–4288. [Google Scholar] [CrossRef]
  10. Shah, P.R.; Kim, T.; Zhou, G.; Fornasiero, P.; Gorte, R.J. Evidence for entropy effects in the reduction of ceria−zirconia solutions. Chem. Mater. 2006, 18, 5363–5369. [Google Scholar] [CrossRef]
  11. Jiang, Q.; Zhou, G.; Jiang, Z.; Li, C. Thermochemical CO2 splitting reaction with CexM1−xO2−δ (M=Ti4+, Sn4+, Hf4+, Zr4+, La3+, Y3+ and Sm3+) solid solutions. Sol. Energy 2014, 99, 55–66. [Google Scholar] [CrossRef]
  12. Call, F.; Roeb, M.; Schmücker, M.; Sattler, C.; Pitz-Paal, R. Ceria doped with zirconium and lanthanide oxides to enhance solar thermochemical production of fuels. J. Phys. Chem. C 2015, 119, 6929–6938. [Google Scholar] [CrossRef]
  13. Scheffe, J.R.; Jacot, R.; Patzke, G.R.; Steinfeld, A. Synthesis, characterization, and thermochemical redox performance of Hf4+, Zr4+, and Sc3+ doped ceria for splitting CO2. J. Phys. Chem. C 2013, 117, 24104–24114. [Google Scholar] [CrossRef]
  14. Fornasiero, P.; Kašpar, J.; Graziani, M. On the rate determining step in the reduction of CeO2–ZrO2 mixed oxides. Appl. Catal. B Environ. 1999, 22, L11–L14. [Google Scholar] [CrossRef]
  15. Yashima, M.; Arashi, H.; Kakihana, M.; Yoshimura, M. Raman scattering study of cubic-tetragonal phase transition in Zr1-xCexO2 Solid Solution. J. Am. Ceram. Soc. 1994, 77, 1067–1071. [Google Scholar] [CrossRef]
  16. Le Gal, A.; Abanades, S. Catalytic investigation of ceria-zirconia solid solutions for solar hydrogen production. Int. J. Hydrog. Energy 2011, 36, 4739–4748. [Google Scholar] [CrossRef]
  17. Le Gal, A.; Abanades, S.; Bion, N.; Le Mercier, T.; Harlé, V. Reactivity of doped ceria-based mixed oxides for solar thermochemical hydrogen generation via two-step water-splitting cycles. Energy Fuels 2013, 27, 6068–6078. [Google Scholar] [CrossRef]
  18. Shannon, R.D. Revised effective ionic radii and systematic studies of interatomic distances in halides and chalcogenides. Acta Cryst. A 1976, 32, 751–767. [Google Scholar] [CrossRef]
  19. Kaneko, H.; Taku, S.; Tamaura, Y. Reduction reactivity of CeO2–ZrO2 oxide under high O2 partial pressure in two-step water splitting process. Sol. Energy 2011, 85, 2321–2330. [Google Scholar] [CrossRef]
  20. Lemaux, S.; Bensaddik, A.; van der Eerden, A.M.J.; Bitter, J.H.; Koningsberger, D.C. Understanding of enhanced oxygen storage capacity in Ce0.5Zr0.5O2: The presence of an anharmonic pair distribution function in the Zr−O2 subshell as analyzed by XAFS spectroscopy. J. Phys. Chem. B 2001, 105, 4810–4815. [Google Scholar] [CrossRef] [Green Version]
  21. Yang, Z.; Woo, T.K.; Hermansson, K. Effects of Zr doping on stoichiometric and reduced ceria: A first-principles study. J. Chem. Phys. 2006, 124, 224704. [Google Scholar] [CrossRef] [PubMed]
  22. Rodriguez, J.A.; Hanson, J.C.; Kim, J.-Y.; Liu, G.; Iglesias-Juez, A.; Fernández-García, M. Properties of CeO2 and Ce1-xZrx nanoparticles: X-ray absorption near-edge spectroscopy, density functional, and time-resolved X-ray diffraction studies. J. Phys. Chem. B 2003, 107, 3535–3543. [Google Scholar] [CrossRef]
  23. Wang, H.-F.; Guo, Y.-L.; Lu, G.-Z.; Hu, P. Maximizing the localized relaxation: The origin of the outstanding oxygen storage capacity of kappa-Ce2Zr2O8. Angew. Chem. Int. Ed. Engl. 2009, 48, 8289–8292. [Google Scholar] [CrossRef]
  24. Zhou, G.; Shah, P.R.; Kim, T.; Fornasiero, P.; Gorte, R.J. Oxidation entropies and enthalpies of ceria–zirconia solid solutions. Catal. Today 2007, 123, 86–93. [Google Scholar] [CrossRef] [Green Version]
  25. Le Gal, A.; Abanades, S.; Flamant, G. CO2 and H2O splitting for thermochemical production of solar fuels using nonstoichiometric ceria and ceria/zirconia solid solutions. Energy Fuels 2011, 25, 4836–4845. [Google Scholar] [CrossRef]
  26. Hao, Y.; Yang, C.-K.; Haile, S.M. Ceria–Zirconia solid solutions (Ce1–xZrxO2−δ, x ≤ 0.2) for solar thermochemical water splitting: A thermodynamic study. Chem. Mater. 2014, 26, 6073–6082. [Google Scholar] [CrossRef]
  27. Abanades, S.; Legal, A.; Cordier, A.; Peraudeau, G.; Flamant, G.; Julbe, A. Investigation of reactive cerium-based oxides for H2 production by thermochemical two-step water-splitting. J. Mater. Sci. 2010, 45, 4163–4173. [Google Scholar] [CrossRef]
  28. Le Gal, A.; Abanades, S. Dopant incorporation in ceria for enhanced water-splitting activity during solar thermochemical hydrogen generation. J. Phys. Chem. C 2012, 116, 13516–13523. [Google Scholar] [CrossRef]
  29. Rudisill, S.G.; Venstrom, L.J.; Petkovich, N.D.; Quan, T.; Hein, N.; Boman, D.B.; Davidson, J.H.; Stein, A. Enhanced oxidation kinetics in thermochemical cycling of CeO2 through templated porosity. J. Phys. Chem. C 2013, 117, 1692–1700. [Google Scholar] [CrossRef]
  30. Eufinger, J.-P.; Daniels, M.; Schmale, K.; Berendts, S.; Ulbrich, G.; Lerch, M.; Wiemhöfer, H.-D.; Janek, J. The model case of an oxygen storage catalyst—non-stoichiometry, point defects and electrical conductivity of single crystalline CeO2-ZrO2-Y2O3 solid solutions. Phys. Chem. Chem. Phys. 2014, 16, 25583–25600. [Google Scholar] [CrossRef] [Green Version]
  31. Vidmar, P.; Fornasiero, P.; Kašpar, J.; Gubitosa, G.; Graziani, M. Effects of trivalent dopants on the redox properties of Ce0.6Zr0.4O2 mixed oxide. J. Catal. 1997, 171, 160–168. [Google Scholar] [CrossRef]
  32. Yahiro, H.; Eguchi, Y.; Eguchi, K.; Arai, H. Oxygen ion conductivity of the ceria-samarium oxide system with fluorite structure. J. Appl. Electrochem. 1988, 18, 527–531. [Google Scholar] [CrossRef]
  33. Qi, X.; Lin, Y.S.; Holt, C.T.; Swartz, S.L. Electric conductivity and oxygen permeability of modified cerium oxides. J. Mater. Sci. 2003, 38, 1073–1079. [Google Scholar] [CrossRef]
  34. Grieshammer, S. Defect interactions in the CeO2–ZrO2–Y2O3 solid solution. J. Phys. Chem. C 2017, 121, 15078–15084. [Google Scholar] [CrossRef]
  35. Pullar, R.C.; Novais, R.M.; Caetano, A.P.F.; Barreiros, M.A.; Abanades, S.; Oliveira, F.A.C. A review of solar thermochemical CO2 splitting using ceria-based ceramics with designed morphologies and microstructures. Front. Chem. 2019, 7, 601. [Google Scholar] [CrossRef] [PubMed] [Green Version]
  36. Furler, P.; Scheffe, J.; Gorbar, M.; Moes, L.; Vogt, U.; Steinfeld, A. Solar thermochemical CO2 splitting utilizing a reticulated porous ceria redox system. Energy Fuels 2012, 26, 7051–7059. [Google Scholar] [CrossRef]
  37. Furler, P.; Scheffe, J.R.; Steinfeld, A. Syngas production by simultaneous splitting of H2O and CO2 via ceria redox reactions in a high-temperature solar reactor. Energy Environ. Sci. 2012, 5, 6098–6103. [Google Scholar] [CrossRef]
  38. Takacs, M.; Ackermann, S.; Bonk, A.; Neises-von Puttkamer, M.; Haueter, P.; Scheffe, J.R.; Vogt, U.F.; Steinfeld, A. Splitting CO2 with a ceria-based redox cycle in a solar-driven thermogravimetric analyzer. AIChE J. 2017, 63, 1263–1271. [Google Scholar] [CrossRef] [PubMed] [Green Version]
  39. Gladen, A.C.; Davidson, J.H. The morphological stability and fuel production of commercial fibrous ceria particles for solar thermochemical redox cycling. Sol. Energy 2016, 139, 524–532. [Google Scholar] [CrossRef] [Green Version]
  40. Gibbons, W.T.; Venstrom, L.J.; de Smith, R.M.; Davidson, J.H.; Jackson, G.S. Ceria-Based electrospun fibers for renewable fuel production via two-step thermal redox cycles for carbon dioxide splitting. Phys. Chem. Chem. Phys. 2014, 16, 14271–14280. [Google Scholar] [CrossRef]
  41. Bishop, S.R. Chemical expansion of solid oxide fuel cell materials: A brief overview. Acta. Mech. Sin. 2013, 29, 312–317. [Google Scholar] [CrossRef]
  42. Crank, J. The-Mathematics-of-Diffusion, 2nd ed.; Oxford University Press: London, UK, 1975; ISBN 0-19-853344-6. [Google Scholar]
  43. Beschnitt, S.; de Souza, R.A. Impurity diffusion of Hf and Zr in Gd-doped CeO2. Solid State Ion. 2017, 305, 23–29. [Google Scholar] [CrossRef]
  44. Zhang, Y.; Li, J.; Li, Q.; Zhu, L.; Liu, X.; Zhong, X.; Meng, J.; Cao, X. Preparation of CeO(2)-ZrO(2) ceramic fibers by electrospinning. J. Colloid Interface Sci. 2007, 307, 567–571. [Google Scholar] [CrossRef]
  45. Dong, Y.; Wang, C.-A.; Zhou, J. Effect of YSZ fiber addition on microstructure and properties of porous YSZ ceramics. J. Mater. Sci. 2012, 47, 6326–6332. [Google Scholar] [CrossRef]
  46. Hu, L.; Wang, C.-A.; Huang, Y. Porous yttria-stabilized zirconia ceramics with ultra-low thermal conductivity. J. Mater. Sci. 2010, 45, 3242–3246. [Google Scholar] [CrossRef]
  47. Darcy, H. Les Fontaines Publiques de la Ville de Dijon; Victor Dalmont: Paris, France, 1856. [Google Scholar]
  48. Kawagoe, Y.; Oshima, T.; Tomarikawa, K.; Tokumasu, T.; Koido, T.; Yonemura, S. A study on pressure-driven gas transport in porous media: From nanoscale to microscale. Microfluid. Nanofluid. 2016, 20. [Google Scholar] [CrossRef] [Green Version]
  49. Haussener, S.; Steinfeld, A. Effective heat and mass transport properties of anisotropic porous ceria for solar thermochemical fuel generation. Materials 2012, 5, 192–209. [Google Scholar] [CrossRef]
  50. Isobe, T.; Kameshima, Y.; Nakajima, A.; Okada, K.; Hotta, Y. Gas permeability and mechanical properties of porous alumina ceramics with unidirectionally aligned pores. J. Eur. Ceram. Soc. 2007, 27, 53–59. [Google Scholar] [CrossRef]
  51. Knoblauch, N. Synthese, Charakterisierung und Untersuchung zum Redoxverhalten von ceroxidbasierten Materialien zur Erzeugung Solarer Brennstoffe. Ph.D. Thesis, Technische Universität Clausthal, Clausthal-Zellerfeld, Germany, 2018. [Google Scholar] [CrossRef]
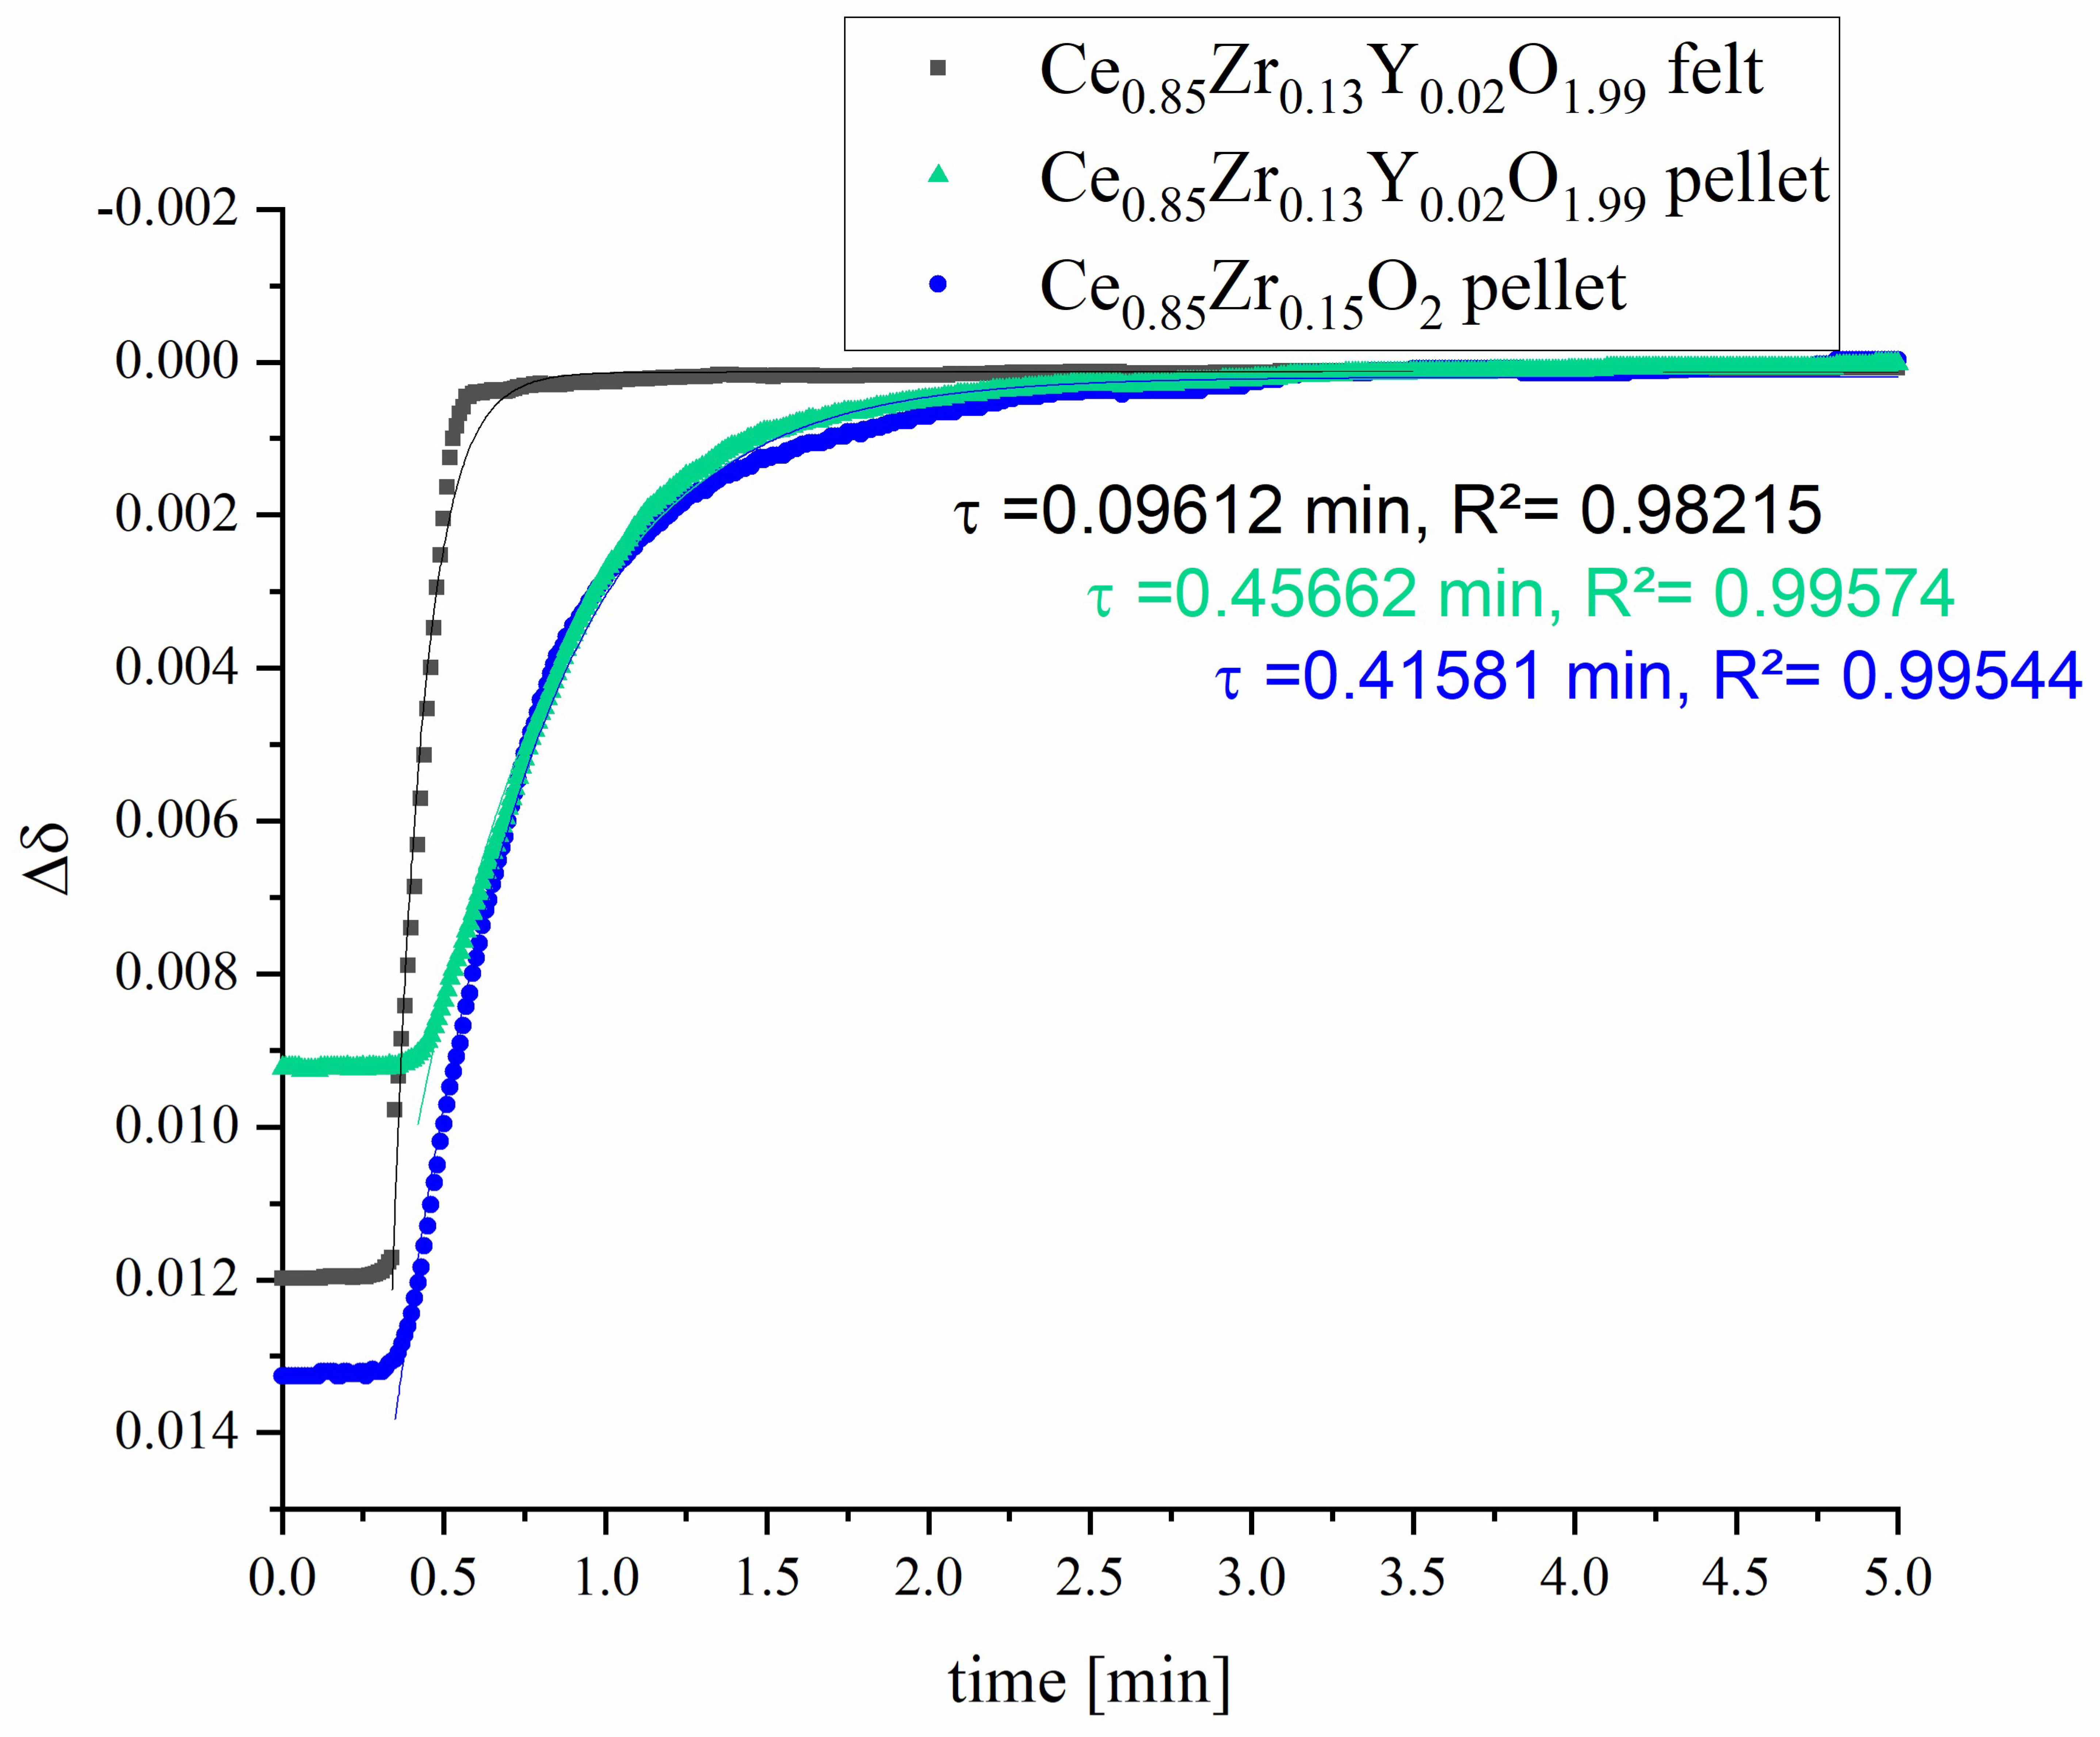
Figure 1. Permeability setup for porous pellet samples.
Crystals 11 00885 g001
Figure 2. SEM micrographs of YSZ felt before thermal treatment in different magnification (a,b).
Crystals 11 00885 g002
Figure 3. SEM micrographs of pure YSZ fiber after thermal treatment at 1923 K for 2 h (a) and SEM micrographs of YSZ fiber mixed with CeO2 after thermal treatment at 1573 K (b) and 1923 K (c).
Crystals 11 00885 g003
Figure 4. (a) XRD-profile of the CeO2/YSZ felt mixture after heat treatment at 1573 K (black) and 1923 K (red). (b) EDS results of the CeO2/YSZ felt mixture after heat treatment at 1923 K.
Crystals 11 00885 g004
Figure 5. The relative length changes of sample dimension of CeO2 (red) and CeO2 with YSZ fiber (black) as function of temperature.
Crystals 11 00885 g005
Figure 6. (a) Stacked XRD-profiles of the CeO2/YSZ felt mixture at temperatures between 293 K and 1873 K. (b) ‘Plane view’ (2D) XRD-profile. The arrows illustrate the shift of the peaks of YSZ.
Crystals 11 00885 g006
Figure 7. Lattice constant calculation of CeO2 and YSZ as function of temperature.
Crystals 11 00885 g007
Figure 8. Schematic representation of the matrix fiber interaction after 1573 K and 1923 K.
Crystals 11 00885 g008
Figure 9. SEM cross-section of a CeO2 powder compact/YSZ felt diffusion couple after thermal treatment at 1923 K with superposed EDS quantification data of line scans indicated by dashed lines.
Crystals 11 00885 g009
Figure 10. SEM cross-section of a Ce0.85Zr0.13Y0.02O1.99 felt after 1923 K (2 h).
Crystals 11 00885 g010
Figure 11. The flow rate of air through the porous Ce0.85Zr0.13Y0.02O1.99 felt as function of the pressure gradient.
Crystals 11 00885 g011
Figure 12. Calculated vacancy concentration δ of Ce0.85Zr0.13Y0.02O1.99 in comparison to literature data of CeO2 and Ce0.85Zr0.15O2 measured under the same conditions [51].
Crystals 11 00885 g012
Figure 13. Isothermal time dependence of the mass change during re-oxidation at 1173 K of Ce0.85Zr0.13Y0.02O1.99 felt and pellet in comparison to Ce0.85Zr0.15O2 pellet [51] after reduction at 1373 K. δ0 is the Δδ at time t0 when the temperature starts to become constant and the gas is changed from argon to air. Time constants, τ, to reach equilibrium are evaluated by fit Equation (4) where the R2 values quantify the fit quality.
Crystals 11 00885 g013
Figure 14. (a) XRD-profile of Ce0.85Zr0.13Y0.02O1.99 felt before (red) and after cycling (blue). (b) SEM of Ce0.85Zr0.13Y0.02O1.99 felt after cycling.
Crystals 11 00885 g014
Table 1. Calculated relaxation time constants and reaction times for a turnover of 95% based on the fit of the mass curves in Figure 13 using Equation (4).
SampleRelaxation Time Constant
τ [min]
t [min] for Turnover of 95%
Ce0.85Zr0.13Y0.02O1.99 felt0.09612 ± 0.00121~0.29
Ce0.85Zr0.13Y0.02O1.99 pellet0.45662 ± 0.00289~1.37
Ce0.85Zr0.15O2 pellet0.41581 ± 0.00268~1.25
Publisher’s Note: MDPI stays neutral with regard to jurisdictional claims in published maps and institutional affiliations.

