Abstract
Haynes 282 has attracted attention for casting applications in AUSC power plants due to its good creep properties. However, the market is primarily comprised of wrought Haynes 282, while the cast version is not commercially available. In this study, the microstructure of a large traditional sand cast Haynes 282 was studied from as-cast condition to long-term heat-treated condition by combining experimental data and thermodynamic calculations. The microstructure of a large cast Haynes 282 includes γ, γ’, two types of MX, M23C6 and µ phases. After standard post heat treatment, µ phases were dissolved and precipitated as M6C. The equilibrium state was achieved after 266 h aging at 788 °C, after which γ’ particles began coarsening. These kept to a spherical morphology; the smallest misfit was found with the γ matrix. Once post heat treatment was finished, MX exhibited little morphology and compositional change during the long-term isothermal aging. Grain boundary is covered by discrete M23C6 and M6C precipitates and this morphology keeps stable during isothermal aging. No presence of the needle µ phase have been found at grain boundaries after 10,000 h aging at 788 °C. All these microstructural features indicated that cast Haynes 282 could have a high thermal stability and good creep properties.
1. Introduction
Ni-based superalloys are currently the only option for use in advanced ultra supercritical (AUSC) power plants where steam temperatures are above 700 °C and pressures are above 35 MPa [1]. Haynes 282 was induced by Haynes International in 2005 [2] as a wrought material and was first considered for boiler components for AUSC power plants because of its outstanding thermal stability [3]. Due to its good creep resistance [4] and good resistance to post weld heat treatment cracking [5], it also attracted attention for turbine casing and valve applications [6,7], which require a casting process to facilitate their complicated geometry. However, the commercial cast version of Haynes 282 is not yet available [7].
Vacuum casting [6,8] and additive manufacturing [9,10,11] of Haynes 282 have been tried. Maziasz et al. [8] found that cast Haynes 282 had the best combination of high-temperature yield strength (511 MPa at 800 °C) and ductility (19.3% elongation at 800 °C) when compared with three other alloys: Nimonic 105, Inconel 740 and alloy 263. Unocic et al. [9], Deshpande et al. [10] and Ramakrishnan et al. [11] studied Haynes 282 made by electron beam melting, selective laser melting and direct laser melt depositing, respectively, and found that the tensile properties of additive manufactured Haynes 282 are only slighter lower than that of wrought Haynes 282.
Mechanical properties are highly dependent on microstructure. A general microstructure of wrought Haynes 282 includes MC, intergranular and intragranular Cr-rich M23C6, and a 20 nm uniformly distributed γ’ [2,5,12,13,14]. Mo-rich M6C has been found in additive manufactured [11] and cast Haynes 282 [15], as well as in wrought Haynes 282—with alternative heat treatments due to its sluggish kinetics [16]. A lamellar constituent consisting of Mo and Cr-rich secondary carbide phases together with γ phase was found in a vacuum cast thin wall component (4.6 kg) [7]. The ordered γ’ phase and grain boundary precipitates can provide high temperature strength through precipitation strengthening and creep resistance by impeding movement of dislocations. By comparing creep properties of wrought and cast Haynes 282 [6,8], it was found that regardless of the size, the creep properties of cast Haynes 282 are similar to that of wrought Haynes 282. Kim et al. [6] reported that creep failure is mainly caused by grain boundary precipitates. However, the grain size and grain boundary precipitates of wrought and cast Haynes 282 are different, due to the different manufacture processes. The grain size of cast Haynes 282 is much bigger than that of wrought Haynes 282, and the grain boundary of wrought Haynes 282 is covered by discrete MC and M23C6 [2], while the grain boundary of cast Haynes 282 is covered by M23C6 and M6C [15]. There is a lack of microstructural analyses of cast Haynes 282 in long-term service conditions at elevated temperatures to link to the properties. This paper aimed to provide a fuller understanding of the microstructural evolution of different phases in a large cast Haynes 282 and explain why the alloy has high thermal stability and good creep properties from a microstructural point of view.
2. Materials and Methods
2.1. Materials and Heat Treatment
Table 1 illustrates the nominal chemical composition (wt.%) of Haynes 282. The materials studied in this research were cut from a thick section (the most segregated region) of a large step cast (900 mm in height) produced by traditional sand casting by Goodwin Steel Castings Limited. The sizes of the received materials are shown in Figure 1.

Table 1.
The nominal composition in wt.% of Haynes 282.
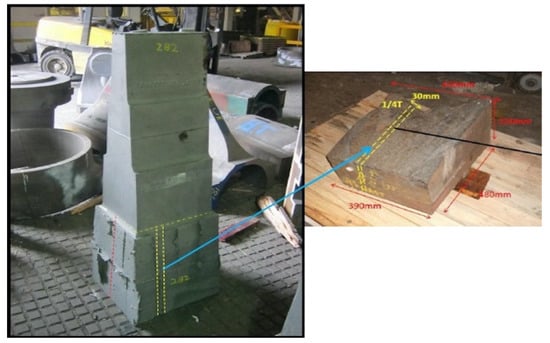
Figure 1.
A plot showing the location of the materials in this study.
The received specimens were cut into 1.5 cm3 size and subjected to a range of heat treatments. One was kept in as-cast condition for comparison purpose. All other samples were undergone a two-stage solution treatment (ST), a first aging (FA) treatment and a second aging (SA) treatment, all of which are standard post heat treatments [2]. Then, the samples underwent isothermal aging (IA) at 788 °C for various durations (up to 10,000 h) in order to simulate service conditions as described in Table 2.

Table 2.
Conditions and code names of all the samples in this paper (WQ: water quenching; AC: air cooling; √ means that the sample was undergone this heat treatment).
2.2. Thermodynamic Calculation
Thermodynamic calculations were performed using the MTDATA software [17] developed by the National Physical Laboratory with an appropriate modified Ni-database [18]. The cast alloy composition was used to predict the equilibrium phases between 400 °C and 1600 °C with a step of 5 °C and with all phases included. The chemical composition of each predicted phase was predicted as a function of temperature. Scheil methodology, which can predict micro-segregation, was used to predict solidification and chemical segregation profiles.
2.3. Microstructural Characterisation
For microstructural examination, all samples were mounted in electrically conductive Bakelite, ground on SiC papers from 220 to 1200 grit, and then polished with a series of diamond solutions to a 1 µm finish. To reveal the grain boundaries and γ’, the polished samples were further polished using a 0.5 µm colloidal silica solution for 20 min. Kallings No. 2 (CuCl2—2 g, HCl—40 mL and ethanol—40–80 mL) etchant, which can remove γ’, was used for 10 s for quantification of γ’.
A detailed microstructural study was carried out using a MEF 3 inverted stage optical microscope (OM) and a series of electron microscopes, including a Carl Zeiss (Leo) 1530 VP field emission gun scanning electron microscope (FEG-SEM) and an FEI F20 Tecnai field emission gun transmission electron microscope (FEG-TEM). Both microscopes were equipped with Oxford Instruments energy-dispersive X-ray spectrometers (EDS).
When using FEG-SEM, backscatter electron imaging (BSE) was used to show different phases in polished samples due to its atomic weight contrast. Secondary electron (SE) imaging was used for quantification of γ’ in etched samples due to the major surface morphology contrast. Both imaging modes were used at an accelerating voltage of 10 kV for optimized spatial resolution. Spectra were collected with a 20 kV accelerating voltage when using FEG-SEM and a 200 keV accelerating voltage when using FEG-TEM.
TEM samples were prepared with a thickness of 100 nm by focused ion beam (FIB) machining using an FEINova Nanolab 600 dual beam system. Diffraction patterns of different precipitates were collected by a JEOL 2000FX TEM.
Quantification of various microstructural features was performed by image analysis on the micrographs of the features of interest using Image J software. For each precipitate, 20 random micrographs were collected.
2.4. Hardness Test
The hardness values of the as-cast sample and all the heat-treated samples were measured using a 10 kg load and a 15 s dwell time by a Mitutoyo HM-123 Vickers Hardness machine. 15 random values were recorded for each sample and the average value was taken.
3. Results and Discussion
3.1. Thermodynamic Calculations
The calculated equilibrium phase diagram and solidification sequence of Haynes 282 are illustrated in Figure 2a,b, respectively. Liquid, γ, γ’, MX, M23C6, M6C, M3B2 and µ phase were predicted both in the equilibrium state and during solidification. During solidification, the first solid to form from the liquid was in the form of γ dendrites. During continuous cooling, γ dendrites continued to form, and a series of compositions was observed due to segregation during solidification. At the same time, solute elements with a partition coefficient k > 1 were rejected into the interdendritic liquid at the dendrite/liquid interface. Continued solute enrichment in the interdendritic liquid could have caused the solubility limit of the primary γ to be exceeded, and consequently, secondary solidification constituents were formed between the dendrites.
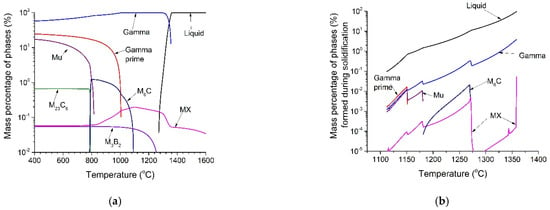
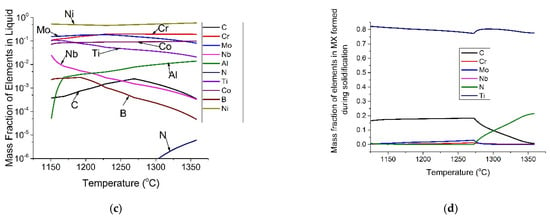
Figure 2.
Thermodynamic predictions: (a) equilibrium state phase diagram, (b) solidification sequence, (c) element distribution in liquid during solidification, and (d) composition of predicted MX during solidification.
Figure 2c illustrates the predicted segregation profile of different elements in the liquid during solidification. According to the value of the partition coefficient (k), all elements can be grouped into three categories:
- Elements which do not segregate in liquid (k~1): Ni, Cr, Co and C
- Positively segregated elements in liquid (k > 1): Nb, B, Mo and Ti
- Negatively segregated elements in liquid (k < 1): N and Al
The positively segregated elements result in precipitates in the interdendritic regions and the negatively segregated elements result in precipitates in the dendritic regions.
From Figure 2b, it can be seen that there were two stages of MX precipitates. The composition of MX during solidification was also calculated and is shown in Figure 2d. As shown in Figure 2d, MX precipitates formed during solidification can be grouped into two types: Ti-rich carbo-nitrides formed above 1270 °C, and Ti, Mo-rich carbides formed below 1270 °C.
3.2. Microstructural Analysis of the As-Cast Sample
Figure 3 shows an overview OM micrograph of the AC Haynes 282; a large grain size in the mm range and a dendritic structure with precipitates in the interdendritic regions were found. These interdendritic precipitates were MX and could be grouped into two types: randomly distributed MX and blocky grain boundary MX. These two types of MX have been previously identified [15]; the randomly distributed MX consisted of Ti-rich nitrides with an FCC structure and a lattice parameter of 0.425 nm, while the blocky grain boundary MX was Ti, Mo-rich carbides with an FCC structure and a lattice parameter of 0.432 nm. The increase in lattice parameter of the (Ti, Mo) C was caused by large substitutional atoms, Mo substituting for Ti.

Figure 3.
Microstructural overview of the AC sample. From left to right: an overview of huge grains and dendrites; interdendritic precipitates; randomly distributed MX precipitates and blocky grain boundary MX precipitates. The inserted image is a micrograph of γ’.
Star morphology precipitates were found homogeneously distributed in the γ matrix as shown in the inserted image in Figure 3. A TEM micrograph and a superlattice diffraction pattern with γ matrix (shown in Figure 4a) indicated that the star precipitates were γ’ particles. TEM-EDS spectra (Figure 4b) showed that the γ’ particles were Ni, Al and Ti-rich.
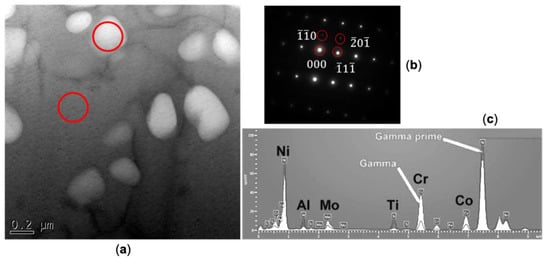
Figure 4.
Phase identification of γ’ precipitates: (a) a TEM micrograph of γ’; (b) a superlattice diffraction pattern of γ’ and (c) compared EDS spectra of the γ matrix and the γ’ particle.
From the image of blocky grain boundary MX in Figure 3, it can also be seen that the grain boundary was fully covered by small precipitates. A highlighted TEM micrograph of these precipitates is shown in Figure 5a, in which dark and bright precipitates can be seen. The EDS maps in Figure 5b show that the dark precipitates were Cr-rich carbides, and the white precipitate were Mo-rich particles without C. Diffraction patterns of the white and dark precipitates are illustrated in Figure 5c and d respectively; they proved that the white precipitate was µ phase with a rhombohedral lattice parameter of a = 0.47 nm and c = 2.56 nm, and the dark precipitate was M23C6 phase with a lattice parameter of 1.06 nm.
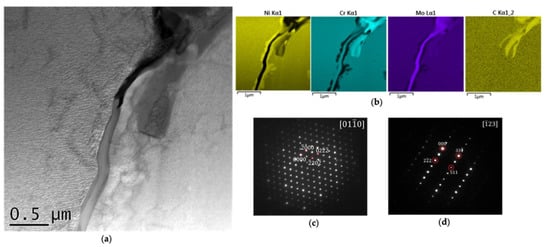
Figure 5.
Identification of grain boundary precipitates: (a) a micrograph showing white and dark precipitates on a grain boundary, (b) EDS maps showing the white precipitate and the dark precipitate, (c) diffraction of the white precipitate and (d) diffraction pattern of the dark precipitate.
Therefore, the microstructure of the as-cast condition had two types of MX, γ’ particles, grain boundary M23C6, and µ phase. It was a combination of the equilibrium prediction (Figure 2a) and the solidification prediction (Figure 2b). M6C was not found on the grain boundary in the as-cast condition because of the slow precipitation kinetics of M6C [16]. During solidification, Cr atoms at the grain boundary combined with C atoms to form M23C6 phase; due to the sluggish M6C precipitation, the grain boundary was dominated by M23C6 precipitates, and Mo atoms segregated to the grain boundaries to form µ phase due to insufficient C content. No Mo-rich borides which were previously found in wrought Haynes 282 [19] were found in the as-cast condition. This result is also supported by [16]. The authors stated that the absence of Mo-rich borides could be explained by its very small size and volume fraction.
3.3. Microstructural Evolution of MX in a Long-Term Aging Condition
3.3.1. Change of MX
Figure 6 illustrates the microstructure of MX precipitates after ST, SA and IA for up to 10,000 h. The MX precipitates kept morphology stable with a slight size increase during isothermal aging at 788 °C for up to 10,000 h. The sizes of the MX precipitates were quantified: 4.9 ± 4.0 µm in the AC sample and 6.4 ± 5.0 µm in the IA10000 sample.
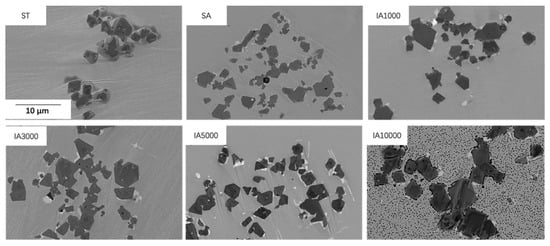
Figure 6.
Micrographs of MX in different heat-treated samples.
However, as shown in Figure 6, some white precipitates formed around the MX during isothermal aging. The composition of MX precipitates was quantified for the AC sample and the IA10000 samples, as illustrated in Figure 7a,b respectively. There were two types of MX precipitates: TiN and (Ti, Mo) C. The (Ti, Mo) C precipitates in the AC sample had a more scattered chemical composition distribution than those in the IA10000 sample. This result demonstrated that, in the IA10000 sample, MX precipitates had less Mo content than in the AC sample. There are two possible reasons for this phenomenon:
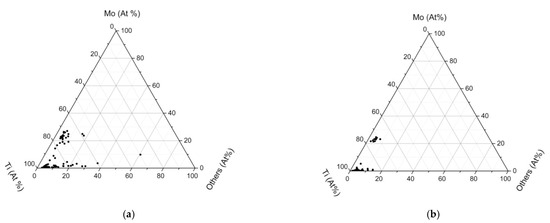
Figure 7.
Compositional quantification of MX: (a) AC sample and (b) IA10000 sample.
- MX decomposition;
- Mo diffusing out from the MX to form other phases.
Since the size of the MX in the IA10000 sample was larger than that in the AC sample, the reduced content of Mo in the IA10000 sample has not been attributed to MX decomposition. Micrographs in Figure 6 were taken in backscatter mode; elements with a larger atomic number will be brighter under contrast. From the ST image in Figure 6, it can be seen that there were two regions in the MX precipitate and that the middle region was darker than the edge region. This result indicated that the element in the middle region was lighter than that in the edge region. Therefore, the middle region was more Ti-rich and the edge region was more Mo-rich. However, as seen in the IA images in Figure 6, it was difficult to find two regions in the MX precipitates, while there were white precipitates formed around MX. These results indicated that the Mo element diffused out from MX to form other phases during isothermal aging. Therefore, it was the diffusion of Mo from the MX particle to form other phases that accounted for the reduction of Mo in the MX in the IA10000 sample.
3.3.2. Stability of MX
The thermodynamic calculations in Figure 2d demonstrate why MX precipitates are stable with a large size. It can be clearly seen that the first formed MX was Ti-rich carbon-nitride above 1270 °C, and the following formed MX was Ti, Mo-rich carbide. The high satiability of MX can be attributed to its formation mechanism.
As shown in Figure 6, there were very dark holes in contrast in the MX. A FIB lift-out TEM sample was done for an MX particle, and small inclusions were found inside the MX particle with white contrast in a TEM bright field micrograph (Figure 8a). An EDS line-scan across the white part of the MX (Figure 8b) showed that the white part was an MgO impurity. This result indicated that the MgO acted as a nucleation site for the MX particle and thus it could easily be formed at random, as shown in Figure 3 and Figure 6. This was also supported by Matysial [7], who reported that the formation of TiN was associated with nonmetallic impurities.
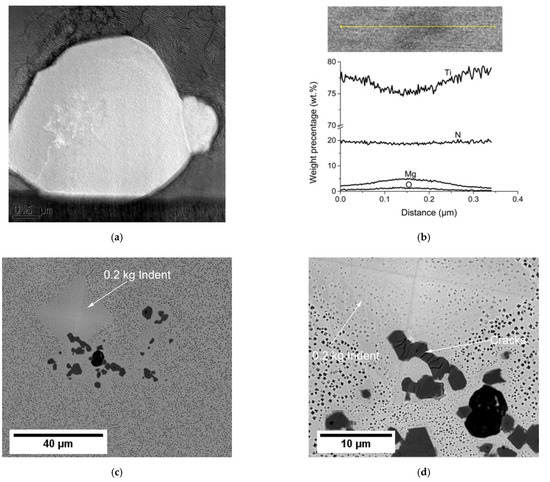
Figure 8.
(a) TEM micrograph of a TiN; (b) TEM-EDS line-scan analysis showing MgO impurity inside the TiN; and (c,d) a low and high magnification micrograph showing that the TiN is very sensitive to stress.
Although MX remained stable during the isothermal aging treatment, it did not have a significant strengthening effect because of its large size in 5µm scale. Furthermore, the TiN particles were very brittle and sensitive to stress, as shown in Figure 8c,d, where cracks were formed in a TiN particle after a 0.2 kg indent was applied. From tensile tests of cast Haynes 282, Kim et al. [6] found that large particles and heterogeneous microstructure between dendritic and interdendritic regions caused earlier crack formation and led to brittle fractures in cast Haynes 282. Therefore, vacuum casting and careful deoxidation processes could be beneficial to the mechanical properties of the alloy, because they can inhibit the formation of large size Ti-rich MX. In addition, since γ’ particles are the major strengthening phase in Ni-based superalloys, it would also be helpful (from a strengthening point of view) to reduce Ti-rich MX, because it consumes Ti which forms γ’.
3.4. Microstructural Evolution of Grain Boundary Precipitates in A Long-Term Aging Condition
Figure 9 shows micrographs of grain boundary precipitates after ST, FA and SA treatments. After ST, the grain boundary precipitates shown in Figure 5a were dissolved. After FA, the grain boundaries were decorated by white precipitates, around which there were round dark particles, as shown in Figure 9a. EDS spectrum and diffraction patterns (Figure 9b) showed that the white phases were Mo-rich M6C. After SA, some grey precipitates were found on the gap of M6C phases on the grain boundaries, as shown in Figure 9a. They were proven to be Cr-rich M23C6 according to the EDS spectrum and the diffraction pattern (Figure 9c). These results were all in agreement with the thermodynamic calculations shown in Figure 2a; at 1010 °C (the FA temperature), M6C phase was predicted to be formed, and the M23C6 phase was predicted to be precipitated at 788 °C (the SA temperature).
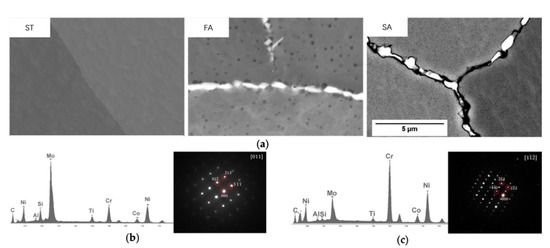
Figure 9.
(a) Micrographs of grain boundary precipitates in ST, FA, SA condition; (b) EDS spectra and a diffraction pattern of white precipitate in FA sample; (c) EDS spectra and a diffraction pattern of dark precipitate in SA sample.
Therefore, after the standard heat treatment, grain boundaries in AC Haynes 282 were 100% covered by discrete M6C and M23C6 precipitates. In general, three morphologies of grain boundary precipitates were found in Haynes 282: filmlike, brick wall, and discrete precipitates [16,20]. Vattappara et al. and Joseph et al. [16,21] studied the effect of aging temperature on grain boundary morphology. They found that, with increasing aging temperatures—from below 650 °C to 1050 °C—grain boundary morphology changed from a continuous film (650–750 °C) to a brick wall structure (750–950 °C) and finally to discrete precipitates (above 1000 °C). It has been reported that the brick wall grain boundary structure can reduce ductility by 50% compared to discrete precipitate structure [16]. Therefore, from a perspective that focuses on grain boundary precipitate morphology, cast Haynes 282 has good properties.
Figure 10 shows micrographs of grain boundary precipitates during isothermal aging. The grain boundaries were still covered by discrete precipitates and the morphology did not exhibit much change. This was also supported by the findings of [16]; they reported that, with increasing aging time, discrete precipitate morphology showed little change, only growth and coarsening of carbides. Because 100% of the grain boundaries were covered after SA (as shown in Figure 9a), there was no room during IA treatment for all precipitates to grow. Table 3 illustrates the quantified size of the grain boundaries of M23C6 and M6C precipitates during IA. The size of M23C6 remained at 0.5 µm while the M6C grew from 0.5 to 1.3 µm during IA for up to 10,000 h. The growth of M6C during isothermal aging is caused by the merging of 2–3 M6C precipitates, as illustrated in Figure 10.
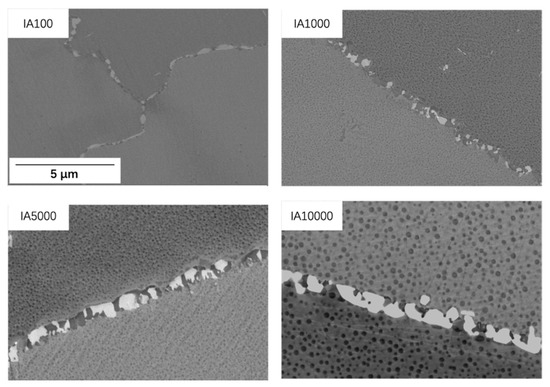
Figure 10.
Micrographs of grain boundary precipitates in different isothermal aged samples.

Table 3.
Quantified size of M23C6 in H282 after aging at 788 °C.
Kim et al. [6] found that the creep properties of cast and wrought Haynes 282 were similar and that the creep failure mechanisms in both were the same as well, mainly caused by grain boundary diffusion and sliding. In general, creep failure is caused by Cr-rich carbides at grain boundaries acting as initiation sites for creep cavities. Then, cavities propagate by interconnection [21]. In cast Haynes 282, Cr-rich carbides are separated by large M6C carbides and thus, once isothermal cavities are formed on Cr-rich M23C6, they cannot easily connect each other to form grain boundary cracks. Because of this, cast Haynes 282 has good creep resistance.
As shown in Figure 10, no µ phase—which is known to have brittle performance—was found along grain boundaries. Similar results were found in [16,22] where no sigma and µ phases were observed during long-term thermal exposure. This may also help explain why cast Haynes 282 has good creep properties [4,6].
The dark spherical particles found after FA treatment (Figure 9a) were γ’ particles. A TEM line-scan (Figure 11) across a grain boundary of the SA sample showed that the phases from left to right were: Ni, Cr and Co enriched γ matrix; Ni, Ti and Al enriched γ’; Ni, Si and Mo enriched M6C; Cr enriched M23C6; Ni, Ti and Al enriched γ’; and Ni, Cr and Co enriched γ matrix. This result indicated that the grain boundary precipitates were in γ’ envelopes. This phenomenon is common in Ni-base superalloys, as stated in [22]. It is rationalized in the following way: after the ST, nearly all precipitates (except MX) are dissolved in the supersaturated matrix. During the FA treatment, Mo, Cr-rich M6C precipitated out on the grain boundary and left the matrix near the grain boundary enriched in Ni, Ti and Al. Consequently, the boundary γ’ particles formed. During the SA treatment, M23C6 precipitated, consuming further Cr atoms on or between the gaps of the M6C particles. The formation of the γ’-enveloped grain boundary precipitates can be concluded as:
γ + (C’‘) →M6C + γ’
γ + M6C + (C’‘) →M6C + M23C6 + γ’
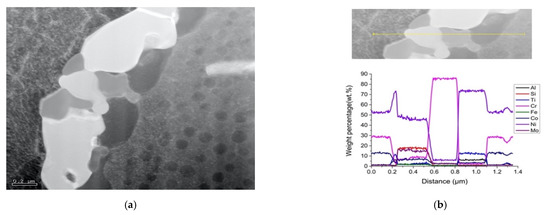
Figure 11.
Grain boundary precipitates after SA: (a) TEM micrograph and (b) TEM-EDS line-scan cross the boundary.
3.5. Microstructural Evolution of Gamma Prime in a Long-Term Aging Condition
3.5.1. Coarsening of γ’ Particles
Homogeneous γ’ particles precipitated after the SA treatment (Figure 9a and Figure 11a), then grew and coarsened during the IA treatment at 788 °C, as shown in Figure 12.
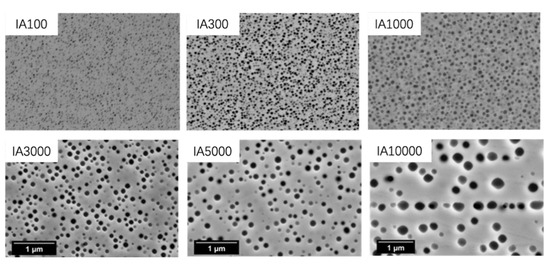
Figure 12.
Micrographs of γ’ particles in different isothermal aging samples.
Figure 13a,b illustrates quantification of area percentage and size of γ’ particles, respectively. As shown, it was assumed that after 1000 h, the area percentage of γ’ particles was constant, at about 16 ± 2.0%. The value agreed with the predicted data—17.3 wt.% at 788 °C (Figure 2a). During isothermal aging, γ’ particles first reach equilibrium, a state in which the area percentage will not increase, and then undergo a coarsening process. Comparing the area percentage of γ’ particles, we concluded that the equilibrium state was reached at a point between 100 and 1000 h. This finding was in agreement with the results of Alexandratou et al. [23], which stated that γ’ particles were coarsened after aging at 760 °C for 1000 h.
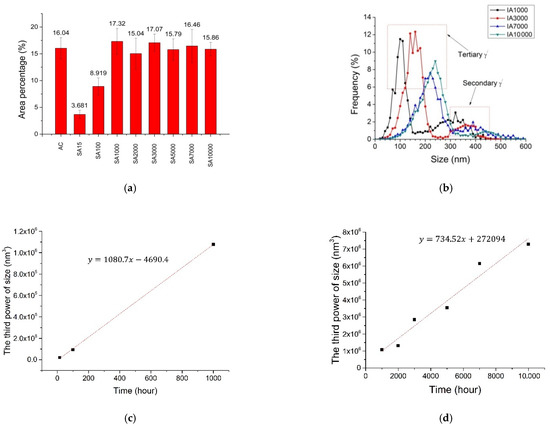
Figure 13.
Bimodally distributed γ’ particles’ diameters: (a) quantified area percentage of γ’ particles; (b) quantified size of γ’ particles; (c) a quantification plot of γ’ size with time below 1000 h, and (d) a quantification plot of γ’ with time above 1000 h.
To calculate the time to achieve equilibrium state, the size of γ’ particles before and after coarsening (1000 h) were quantified and are illustrated in Figure 13c,d, respectively. From Figure 13d it can be seen that the coarsening behavior of particles followed the LSW theory [24]:
where R is the average size of particles, R0 is the average radius at the onset of coarsening, K is the coarsening rate and t is exposure time.
R3 = Kt + R03
The linear equation of γ’ size with time in Figure 13d is:
R3 = 734.52t + 272,094
Comparing Equations (3) and (4), it can be seen that:
R03 = 272,094
Therefore, the size of γ’ particles at the onset of coarsening (R0) are about 65 nm.
The linear equation of γ’ size with time in Figure 13c is:
R3 = 1093t − 16,046
It can be calculated from equation 6 that the time when the γ’ particles are 65 nm is 266 h. Figure 12 shows a micrograph of the IA300 sample, it can be seen that the γ’ particles are about 65 nm. Therefore, the time to achieve the equilibrium state for the γ’ particles at 788 °C is about 266 h.
γ’ particles have the most significant strengthening effects of any Ni-based superalloy [2] and their size, morphology, and volume fraction have greater impacts on mechanical properties than carbides [25]. From Figure 12, it can be seen that γ’ particles in cast Haynes 282 were still in spherical morphology after aging for 10,000 h, which means it still has the smallest misfit with the γ matrix [22]. This leads to good strengthening effects. From this point of view, cast Haynes 282 has good creep strength.
3.5.2. Bimodal Distribution of γ’ Particles
As shown in Figure 13b, γ’ particles’ diameters’ distribution showed two obvious peaks: one below 200 nm and the other above 200 nm, albeit with a low quantity (<3%). The large γ’ particles (>200 nm) were secondary γ’ and the small γ’ particles were tertiary γ’.
Figure 14a illustrates a micrograph of an IA1000 sample. As shown, ther γ’ particles were bimodally distributed. It is normal to have a range of particle sizes due to differences in the time of nucleation and rate of growth. M.P. Jackson and R.C. Reed [26] found this bimodal distribution of γ’ particles’ size in the superalloy 720Li and explained that the distribution could have been a result of nucleation at different under-coolings during quenching after solution treatment. However, this did not seem to be the reason for the bimodal distribution of γ’ particles observed in cast Haynes 282. In cast Haynes 282, the bimodal distribution was more likely caused by the two-step aging treatment, as explained in the following.
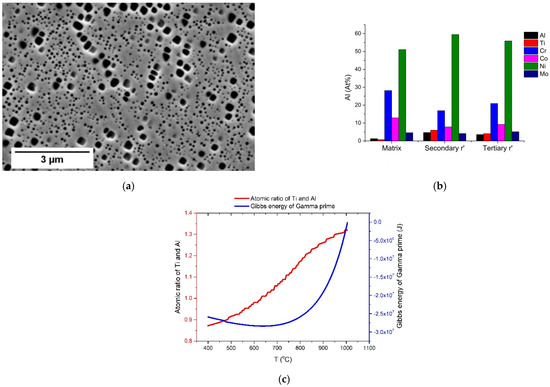
Figure 14.
Bimodally distributed γ’ particles’ diameters: (a) a micrograph of the IA1000 sample; (b) a quantification plot of composition of two types γ’ particles; (c) a calculated atomic ratio of Ti and Al and Gibbs energy of γ’ particles.
Secondary γ’ particles were always found near grain boundaries and MX precipitates, while the tertiary γ’ particles were homogeneously distributed in the γ matrix. The compositions of these two γ’ particles were slightly different, as illustrated in Figure 14b, and we calculated that the atomic ration of Ti and Al of secondary γ’ particles and tertiary γ’ particles were 1.27 and 1.14, respectively. The predicted equilibrium atomic ratio of Ti and Al is shown in Figure 14c. Compared with the measured atomic ratio of Ti and Al, the ratio at 780 °C in the equilibrium state was the same as the measured ratio of the tertiary γ’, while the ratio at 920 °C in the equilibrium state was the same as the measured ratio of the secondary γ’. These two temperatures were similar to the FA and SA temperatures. Therefore, the tertiary γ’ particles were likely formed during the SA treatment and the secondary γ’ particles were likely formed during the FA treatment. This explains why secondary γ’ particles were found near the grain boundary after FA (Figure 9a). These results were also in agreement with the finding of Polkowski et al. [13] that bimodal γ’ particles were more likely to be formed in two-stage aging treatments.
By tracing the coarsening of γ’ particles (Figure 13b), it was determined that both types of γ’ particles were coarsened during isothermal aging. When the aging time changed from 15 to 10,000 h, the size of the secondary γ’ particles changed from 200 to 500 nm, while the size of the tertiary γ’ particles changed from 50 to 200 nm. Therefore, the tertiary γ’ particles coarsened much quicker than the secondary γ’ particles. The different coarsening rates of secondary and tertiary γ’ particles can be explained by the reduction of Gibbs energy, which was affected by the interfacial energy and Gibbs free energy. The lower the Gibbs energy of the particle, the quicker the coarsening rate.
During coarsening, the interfacial energy increases by increasing the diameter of a particle. However, the Gibbs free energy may decrease due to the compositional difference. Figure 14c shows the calculated Gibbs energy of the γ’ particles in the equilibrium state. It is obvious that the Gibbs energy at 788 °C (−2.62 × 10⁷ J) is lower than that at 1010 °C (−1.24 × 10⁷ J), and this potentially explains why tertiary γ’ particles show a more rapid coarsening behavior than the secondary γ’ particles.
Although there was a small fraction of secondary γ’ particles caused by FA treatment, the mechanical properties were not significantly affected. Shin et al. [27] compared the tensile properties of Haynes 282 after 1-step and 2-step aging treatments at 750 °C; they found that the tensile strength was similar, but the elongation of Haynes 282 after 1-step aging was lower than that after 2-step aging. The lower ductility was probably because of the different grain boundary precipitates, as explained in Section 3.3. Tortorelli et al. [28] compared the creep properties of Haynes 282 after 1-step and 2-step aging treatments and found similar creep properties. Therefore, the small fraction of secondary γ’ particles had little effect on mechanical properties.
3.6. Relationship between Microstructure and Hardness
Figure 15 illustrates the hardness data of all examined samples. As shown, the AC sample had a similar hardness to the IA15 sample. However, the area percentage of γ’ particles in the AC sample was about 4 times that in the IA15 sample. In the AC sample, the γ’ particles had a star morphology—a cluster of a few γ’ particles. Conversely, there were, on average, 50 nm spherical particles in the IA15 sample. Therefore, the size and morphology of γ’ particles both have significant effects on the strength of the alloy.
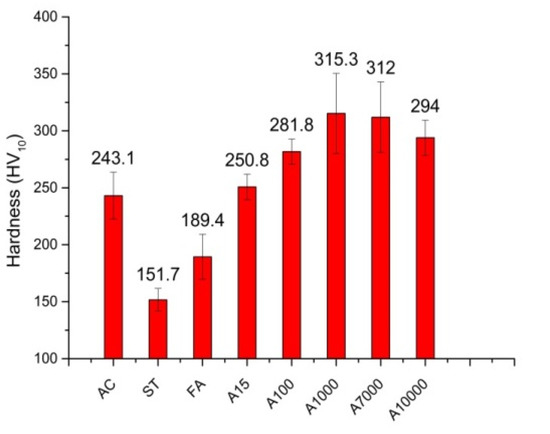
Figure 15.
Hardness data of samples in this study.
The ST sample had the lowest hardness (151 HV). This was because after the ST, all strengthening precipitates (boundary precipitates and γ’ particles) were dissolved. The FA sample had a 40 HV higher hardness than the ST sample, and this was because of the formation of boundary M6C and secondary γ’ particles. During SA, before the equilibrium state (<1000 h), the hardness of the alloy had about a 120 HV increase because of the significant increase in area percentage and the slow increase in the size of γ’ particles.
Comparing the samples after aging for 1000 h when γ’ particles underwent the coarsening process, the hardness values were nearly the same, with only a 10 HV drop in the IA10000 sample. This result was in agreement with the stable microstructural features discussed in Section 3.3, Section 3.4 and Section 3.5.
4. Conclusions
The microstructure of the large cast Haynes 282 studied included γ, γ’, two types of MX, M23C6 and µ phases, all of which agrees with the thermodynamic calculation.
After the solution treatment, all phases except γ matrix and MX were dissolved, which resulted in the lowest hardness (150 HV). During the FA treatment, M6C and associated secondary γ’ particles precipitated on grain boundaries and adjacent to MX, leading to a 40 HV hardness increase. During the SA treatment, spherical tertiary γ’ particles were precipitated, causing a 120 HV increase in hardness until the equilibrium state was reached. The equilibrium state was achieved after 266 h aging at 788 °C, at which point the γ’ particles began coarsening while the hardness remained in a stable state.
MX showed few morphology changes during isothermal aging at 788 °C. The grain boundary was 100% covered by discrete precipitates and the morphology remained stable during isothermal aging, while M6C increased in size by merging with each other. The γ’ particles were still in spherical morphology, with the smallest misfit with γ after isothermal aging at 788 °C for 100,000 h. No presence of the needle µ phase could be found at grain boundaries up to 10,000 h, in combination with a good thermal stability of γ’ particles, MX and grain boundary precipitates. All of this indicated that Haynes 282 could have high thermal stability and good creep properties.
Funding
This research received no external funding from funding agencies in the public, commercial, or not-for-profit sectors.
Institutional Review Board Statement
Not applicable.
Informed Consent Statement
Not applicable.
Data Availability Statement
Not applicable.
Acknowledgments
This research was supported by Goodwin Steel Casting LTD (materials used for experiments), UK and Loughborough University (technical support), UK.
Conflicts of Interest
The authors declare no conflict of interest.
References
- Park, S.; Young, K.J.; Kyu, Y.M.; Ryul, R.D.; Yeom, C.S. Thermodynamic and Economic Investigation of Coal-Fired Power Plant Combined with Various Supercritical CO2 Brayton Power Cycle. Appl. Therm. Eng. Des. Process. Equip. Econ. 2018, 130, 611–623. [Google Scholar] [CrossRef]
- Pike, L.M. Development of a Fabricable Gamma-Prime (γ’) Strengthened Superalloy. In Superalloys 2008; Wiley: Hoboken, NJ, USA, 2008; pp. 191–200. [Google Scholar] [CrossRef]
- Dudziak, T.; Jura, K.; Polkowska, A.; Deodeshmukh, V.; Warmuzek, M.; Witkowska, M.; Ratuszek, W.; Chrusciel, K. Steam oxidation resistance of advanced steels and Ni-based alloys at 700 °C for 1000 h. Oxid. Met. 2018, 89, 755–779. [Google Scholar] [CrossRef]
- Boehlert, C.J.; Longanbach, S.C. A comparison of the microstructure and creep behavior of cold rolled HAYNES® 230 alloy™ and HAYNES® 282 alloy™. Mater. Sci. Eng. A 2011, 528, 4888–4898. [Google Scholar] [CrossRef]
- Osoba, L.O.; Khan, A.K.; Adeosun, S.O. Cracking susceptibility after post-weld heat treatment in Haynes 282 nickel based superalloy. Acta Met. Sin. (Engl. Lett.) 2013, 26, 747–753. [Google Scholar] [CrossRef]
- Kim, Y.-J.; Park, J.-H.; Ahn, Y.-S. Comparison of Creep Properties of Cast and Wrought Haynes 282 Superalloy. Adv. Mater. Sci. Eng. 2018, 2018, 1–7. [Google Scholar] [CrossRef]
- Matysiak, H.; Zagorska, M.; Andersson, J.; Balkowiec, A.; Cygan, R.; Rasinski, M.; Pisarek, M.; Andrzejczuk, M.; Kubiak, K.; Kurzydlowski, K.J. Microstructure of Haynes® 282® Superalloy after Vacuum Induction Melting and Investment Casting of Thin-Walled Components. Materials 2013, 6, 5016–5037. [Google Scholar] [CrossRef] [PubMed]
- Maziasz, P.J.; Evans, N.D.; Jablonski, P.D. High-Temperature Mechanical Properties and Microstructure of Cast Ni-based Superalloys for Steam Turbine Casing Applications. In Proceedings of the Advances in Materials Technology for Fossil Power Plants: Proceedings from the 6th International Conference, Santa Fe, NM, USA, 31 August–3 September 2010; pp. 900–916. [Google Scholar]
- Unocic, K.; Kirka, M.; Cakmak, E.; Greeley, D.; Okello, A.; Dryepondt, S. Evaluation of additive electron beam melting of haynes 282 alloy. Mater. Sci. Eng. A 2020, 772, 138607. [Google Scholar] [CrossRef]
- Deshpande, A.; Nath, S.D.; Atre, S.; Hsu, K. Effect of Post Processing Heat Treatment Routes on Microstructure and Mechanical Property Evolution of Haynes 282 Ni-Based Superalloy Fabricated with Selective Laser Melting (SLM). Metals 2020, 10, 629. [Google Scholar] [CrossRef]
- Ramakrishnan, A.; Dinda, G. Microstructure and mechanical properties of direct laser metal deposited Haynes 282 superalloy. Mater. Sci. Eng. A 2019, 748, 347–356. [Google Scholar] [CrossRef]
- Osoba, L.O.; Ojo, O.A. Influence of laser welding heat input on HAZ cracking in newly developed Haynes 282 superalloy. Mater. Sci. Technol. 2012, 28, 431–436. [Google Scholar] [CrossRef]
- Polkowska, A.; Polkowski, W.; Warmuzek, M.; Cieśla, N.; Włoch, G.; Zasada, D.; Purgert, R.M. Microstructure and Hardness Evolution in Haynes 282 Nickel-Based Superalloy During Multi-variant Aging Heat Treatment. J. Mater. Eng. Perform. 2019, 28, 3844–3851. [Google Scholar] [CrossRef]
- Osoba, L.O.; Khan, A.K.; Ojo, O.A. Identification of Mo-based precipitates in Haynes 282 superalloy. Miner. Met. Mater. Soc. ASM Int. 2017. [CrossRef]
- Yang, Y.; Thomson, R.C.; Leese, R.M.; Roberts, S. Microstructural evolution in cast Haynes 282 for application in advanced power plants. In Advances in Materials Technology for Fossil Power Plants, Proceedings of the 7th International Conference (EPRI 2013); Gandy, D., Shingledecker, J., Eds.; ASM International: Materials Park, OH, USA, 2013; pp. 143–154. [Google Scholar]
- Joseph, C.; Persson, C.; Colliander, M.H. Precipitation Kinetics and Morphology of Grain Boundary Carbides in Ni-Base Superalloy Haynes 282. Met. Mater. Trans. A 2020, 51, 6136–6141. [Google Scholar] [CrossRef]
- Davies, R.H.; Dinsdale, A.T.; Gisby, J.A.; Robinson, J.A.J.; Martin, S.M. MTDATA—Thermodynamic and Phase Equilibrium Software from the National Physical Laboratory; NPL Materials Centre; National Physical Laboratory: Teddington, UK, 2002. [Google Scholar]
- Saunders, N. Phase Diagram Calculations for Ni-based Superalloys. In Superalloys 1996; TMS: Pittsburgh, PA, USA, 1996. [Google Scholar]
- Osoba, L.O.; Ding, R.G.; Ojo, O.A. Improved Resistance to Laser Weld Heat-Affected Zone Microfissuring in a Newly Developed Superalloy HAYNES 282. Met. Mater. Trans. A 2012, 43, 4281–4295. [Google Scholar] [CrossRef]
- Vattappara, K.; Hosseini, V.A.; Joseph, C.; Hanning, F.; Andersson, J. Physical and thermodynamic simulations of gamma-prime precipitation in Haynes® 282® using arc heat treatment. J. Alloy. Compd. 2021, 870, 159484. [Google Scholar] [CrossRef]
- Coble, R.L. A Model for Boundary Diffusion Controlled Creep in Polycrystalline Materials. J. Appl. Phys. 1963, 34, 1679–1682. [Google Scholar] [CrossRef]
- Pike, L.M. Long term thermal exposure of Haynes 282 alloy. In Proceeding of the 7th International Conference on Superalloy 718 and Derivatives, Pittsburgh, PA, USA, 10–13 October 2010; pp. 645–660. [Google Scholar] [CrossRef]
- Alexandratou, A.; Deligiannis, S.; Liolios, D.; Tsakiridis, P. TEM Study of Precipitation Sequences in Haynes 282 Ni Superalloy. Microsc. Microanal. 2018, 24, 2200–2201. [Google Scholar] [CrossRef][Green Version]
- Baldan, A. Review Progress in Ostwald ripening theories and their applications to nickel-base superalloys Part I: Ostwald ripening theories. J. Mater. Sci. 2002, 37, 2171–2202. [Google Scholar] [CrossRef]
- Hawk, J.A.; Cheng, T.-L.; Sears, J.S.; Jablonski, P.D.; Wen, Y.-H. Gamma Prime Stability in Haynes 282: Theoretical and Experimental Considerations. J. Mater. Eng. Perform. 2015, 24, 4171–4181. [Google Scholar] [CrossRef]
- Jackson, M.; Reed, R. Heat treatment of UDIMET 720Li: The effect of microstructure on properties. Mater. Sci. Eng. A 1999, 259, 85–97. [Google Scholar] [CrossRef]
- Shin, K.-Y.; Kim, J.-H.; Terner, M.; Kong, B.-O.; Hong, H.-U. Effects of heat treatment on the microstructure evolution and the high-temperature tensile properties of Haynes 282 superalloy. Mater. Sci. Eng. A 2019, 751, 311–322. [Google Scholar] [CrossRef]
- Tortorelli, P.F.; Unocic, K.A.; Wang, H.; Santella, M.L.; Shingledecker, J.P. Ni-Based Alloys for Advanced Ultra-Supercritical Steam Boilers, Fossile Energy Crosscutting Research Program Review. 2014. Available online: https://www.netl.doe.gov/File%20Library/Events/2014/crosscutting/Crosscutting_20140522_1600B_ORNL.pdf (accessed on 23 June 2021).
Publisher’s Note: MDPI stays neutral with regard to jurisdictional claims in published maps and institutional affiliations. |
© 2021 by the author. Licensee MDPI, Basel, Switzerland. This article is an open access article distributed under the terms and conditions of the Creative Commons Attribution (CC BY) license (https://creativecommons.org/licenses/by/4.0/).