Article

Tunable Low Frequency Band Gap and Waveguide of Phononic Crystal Plates with Different Filling Ratio

School of Mechanical & Automobile Engineering, Qingdao University of Technology, No. 777 Jialingjiang Road, Qingdao 266520, China
*
Author to whom correspondence should be addressed.
Crystals 2021, 11(7), 828; https://doi.org/10.3390/cryst11070828
Submission received: 16 June 2021 / Revised: 8 July 2021 / Accepted: 14 July 2021 / Published: 16 July 2021
(This article belongs to the Special Issue Applications of Phononic Crystals & Acoustic Metamaterials)

Abstract

:
Aiming at solving the NVH problem in vehicles, a novel composite structure is proposed. The new structure uses a hollow-stub phononic-crystal with filled cylinders (HPFC) plate. Any unit in the plate consists of a lead head, a silicon rubber body, an aluminum base as outer column and an opposite arranged inner pole. The dispersion curves are investigated by numerical simulations and the influences of structural parameters are discussed, including traditional hollow radius, thickness, height ratio, and the new proposed filling ratio. Three new arrays are created and their spectrum maps are calculated. In the dispersion simulation results, new branches are observed. The new branches would move towards lower frequency zone and the band gap width enlarges as the filling ratio decreases. The transmission spectrum results show that the new design can realize three different multiplexing arrays for waveguides and also extend the locally resonant sonic band gap. In summary, the proposed HPFC structure could meet the requirement for noise guiding and filtering. Compared to a traditional phononic crystal plate, this new composite structure may be more suitable for noise reduction in rail or road vehicles.

1. Introduction

With the development of phononic crystals (PCs) [1,2,3,4], new characteristics of controlling acoustic/elastic waves have been studied, such as low frequency band gaps [5,6,7], waveguides [8,9,10], filters [11,12], sensing [13], and sound focusing lenses [14,15]. Among these research topics, the band gap and waveguide are more important for vehicle NVH problems.
When the periodic pillar arrays are deposited on the thin PCs, two types of band gaps can be found by selecting appropriate geometric parameters to impede acoustic wave transmission [16,17]. Based on the wave analysis method, Lv et al. [18] investigated the propagation characteristics of finite Timoshenko local resonance beams in forced vibration and periodically attached two-degree-of-freedom force-type resonators. The beams had a wide low frequency band gap, but are very hard to be embedded into the vehicle’s skin structure. Using the Brillouin light scattering experiments, Graczykowski et al. [19] built whispering-gallery modes (WGMs). The models used holes and pillars within a silicone thin square film and introduced a high quality factor to define the lattice. WGMs could guide and filter sound waves in Bragg band gaps with a smaller size compared to the former beams. However, this thin film structure limited low frequency band gaps and cannot adapt to the change in vehicle drive situations. Liang et al. [20] calculated the dispersion curves of Timoshenko beams by a comprehensive with differential quadrature method, unconventional matrix-partitioning method, and variable substitution method. The results showed that the first band gap could be widened by increasing the mass ratio or stiffness ratio, or by decreasing the lattice constant. In addition to the three parameters studied by Liang, the thickness or the filling rate of a composite structure may also affect the band gap. Although the physical phenomena of the low frequency band gaps in PCs studies provide a potential application for vehicle’s NVH, the crystal lattice’s structure design has to face the challenge from serious radiated noises.
Waveguides phenomena of the single or composite structure have also been studied by many scholars. By changing the geometry of the pillar, Hsu [21] numerically studied the propagation of Lamb waves through a stepped resonator array on a thin plate. However, the relationship between the two components is not clear and how to construct the high frequency waveguide by the structure design is not mentioned either. Achaoui et al [22] reported the propagation of surface guided waves in periodically arranged columns on a semi-infinite medium. However, only single model waveguide channels were investigated in Achaoui’s study. In the above-mentioned papers [8,9,10,21,22], different PC structures are designed to construct waveguides. The waveguide was usually formed through line defects or point defects at specific frequencies. It has been proved that these defects would be determined by unit structure parameters, for example the radius [2,9] or the height [10,22]. However, using only one parameter to define a composite structure model may bring about confusion. The confusion regarding the description of the relationship between the substrate and the oscillator would increase the difficulty of waveguide forming. Therefore, we need a more detailed model in calculations and simulations, not only for the waveguide, but also the band gap.
To offer a satisfied solution on band gap and waveguide calculations suitable for vehicle noises, a new composite structure is proposed in Section 2. A crystal subunit in the plate consists of a lead head, a silicon rubber body, an aluminum base as outer column and an oppositely arranged inner pole. In order to show more details required by the waveguide and gap calculations, we define a dimensionless factor FR to describe the relative height relationship for two components in a lattice. Simulations are performed and the dispersion curves and transmission spectrum of hollow-stub phononic-crystals with filled cylinders are given at different FR values along the first irreducible Brillouin zone. Three new branches were observed in the band gap simulations. A peak in the transmission spectrum was spotted corresponding to two of the branches. In Section 3, the influence of structural parameters on flatness of dispersion curve and the width of band gaps is analyzed. These include three traditional parameters, the radius, the thickness, and the height ratio, which can be validated by other research in the literature. The low frequency band gaps in different FR values are calculated and discussed in particular. The results prove that this new defined variable may play a more important role in the dispersion performance. In Section 4, three HPFC multiplexing arrays are created with different FR distributions. In the simulation results with an anti-symmetric Lamb wave input, variable narrow-band frequencies are spotted in the transmission spectrum and the displacement map. Finally, we draw five conclusions for this new composite crystal plate in Section 5. Potential mechanism and method for FR control with STMf103 chips are briefly discussed in the Supplementary Materials. The layout of the study is illustrated in Figure 1, with blue dashed lines dividing the sections.

2. The Features of HPFC

A novel composite PC structure is created, as shown in Figure 2. The PC plate has a cubic symmetric crystal axis in Cartesian coordinate system. Figure 2a illustrates a unit with two components. Along the z axis, the outer column consists of a lead head, a silicon rubber body, and an aluminum base, and the inner pillar has similar but opposite arranged layers. Periodic boundary conditions are applied to each side of the unit element in the (x, y) plane. Within the four boundaries, PC units are homogeneously arrayed. Therefore, we name this new structure a hollow-stub phononic-crystal with filled cylinders (HPFC) plate. The remaining pictures in Figure 2 show the structure parameters on the inner and outer components. For the symbol on the inner pillar, ‘ri’ is the inner radius of the stubbed hollow column plate; ‘h2’ is the height of the lead head for the pillar; ‘h1’ is the height of the silicone rubber cylinder; and ‘e’ is the thickness of the aluminum base. The symbols on the outer cylinder have the same definitions, besides its outer radius r and the lattice dimension ‘a’. The first irreducible Brillouin zone of the square lattice is plotted in Figure 2d. The calculated parameters of the material are shown in Table 1.
In order to describe the height relationship between the pillar and the cylinder, we introduce a new dimensionless factor ‘FR’. It is defined as the ratio of the filled part of the hollow pillar plate to the full-filling pillar. Then, sufficient simulations are performed using finite element method. Typical dispersion curves with different FR values are shown in Figure 3.
For all the four subfigures, we set the geometric parameters a = 10 mm, r/a = 0.3, ri/a = 0.145, h2 = 0.4a, h1 = 0.3a and e = 0.05a. Figure 3a depicts the dispersion curve along the boundary of the first irreducible Brillouin zone (as shown in Figure 2d) when FR is set to 100%.The band curves are drawn with magenta points. It can be seen that the fully filled HPFC’s dispersion clearly show three band gaps, plotted in cyan color. The low frequency band gaps are due to the local resonance. The upper two Bragg band gaps are caused by the periodicity of the crystal and the collective scattering effect between the pillars. It should be pointed out that although the hollow cylindrical and the filling pillar have a small height with the same lead material, geometry parameters remain unchanged in this section, except for FR.
When we adjust the FR to 70%, 46.67%, and 6.67%, the dispersion curves at different FR values are given in Figure 3b–d. Three new dispersion branches could be observed. We label them as 1, 2, and 3 in red color. The branches are not very clear when FR is above 70%. These new branches are not present in the fully filled state. With the reduction in FR, the new dispersion branches move toward a lower frequency. When the FR = 46.67%, the new dispersion branch at the high-frequency band gap is relatively straight and flat. However, due to the interaction between the plate and the mode, the low frequency branching will not produce isolated branches as the Bragg gap. The new branches could offer a possibility to form waveguide structures.
When the FR = 6.67% in Figure 3d, the band gap width at the low frequency band is 900 Hz larger than the FR = 100%. The new dispersion branches are related to the short stubs on both sides of the plate. The same resonant eigenmode and the plate’s Lamb modes have a strong coupling. It may lead to an increase in the width of the locally resonant frequency band gap. Therefore, when we solve the vehicle NVH problem, we have to set the structure within the low frequency band gaps.
Figure 4 shows the change in the three new branches with the filling ratio. Figure 4a,b show the displacement field distribution of the single unit at the FR = 46.67%. Figure 3c shows that the branching frequency would nonlinearly decrease with the reduction in the FR. In addition to three frequency points for each FR values, the three band gaps at the FR = 100% were added with dot lines in different colors. Thus we can see whether the frequency points located in the band gaps. These frequency points are taken from Figure 3c. They are the end point of branch 1, 2, and 3 at the right edge marked with ‘X’. The ‘X’ represents the boundary in the first irreducible Brillouin zone. When FR = 20% and 30%, the 1st and 2nd branching points fall on the low frequency band gap. This means that the new structure may provide guiding ability in low frequency, compared to the traditional high frequency waveguide. We performed simulations from 10% to 100% with a 10% interval. It is interesting that these new branches have disappeared when FR < 20% and FR > 70%.
In order to analyze the transmission performance of the plat, we built a row PCs with five HPFC units at FR = 46.67%. The layout and simulation results are shown in Figure 5. Perfect matching layers (PML) are applied to the inlet and outlet of the board to avoid any reflection from the external edges. Periodic boundary conditions are imposed on each side of the cell in the Y direction. The incident wave is an A0 Lamb wave of the plate, propagating along the X direction. It is generated by applying a harmonic shift on the (y, z) plane in front of the crystal in Figure 2. The transmission spectrum shows that, although some modal conversion occurs at the right exit of the HPFC, the transmitted wave could still maintains its original characteristics. The anti-symmetric Lamb wave excitation produces a narrow pass band transmission along the Г direction, labeled as peak A in Figure 5b. The frequency of peak A would shift down with the decreasing of the FR. The detailed graphics will not be discussed in this paper.

3. Influence of Structural Parameters

The simulation model in the previous section has demonstrated that the HPFC can be used as a low frequency muffler and a tunable filter. In this section, the effects of different structural parameters on the model are studied. The structural parameters include the hollow radius (ri), the thickness of the plate (e), and the height ratio of the pillar (HR = h2/h1). In addition to the three traditional parameters, the proposed factor FR and its correlation with HR are studied more carefully. The original model (ri = 0.145, e = 0.05, and HR = 4/3) was used for comparison. The structure at FR = 46.67% is used to calculate dispersion curves.

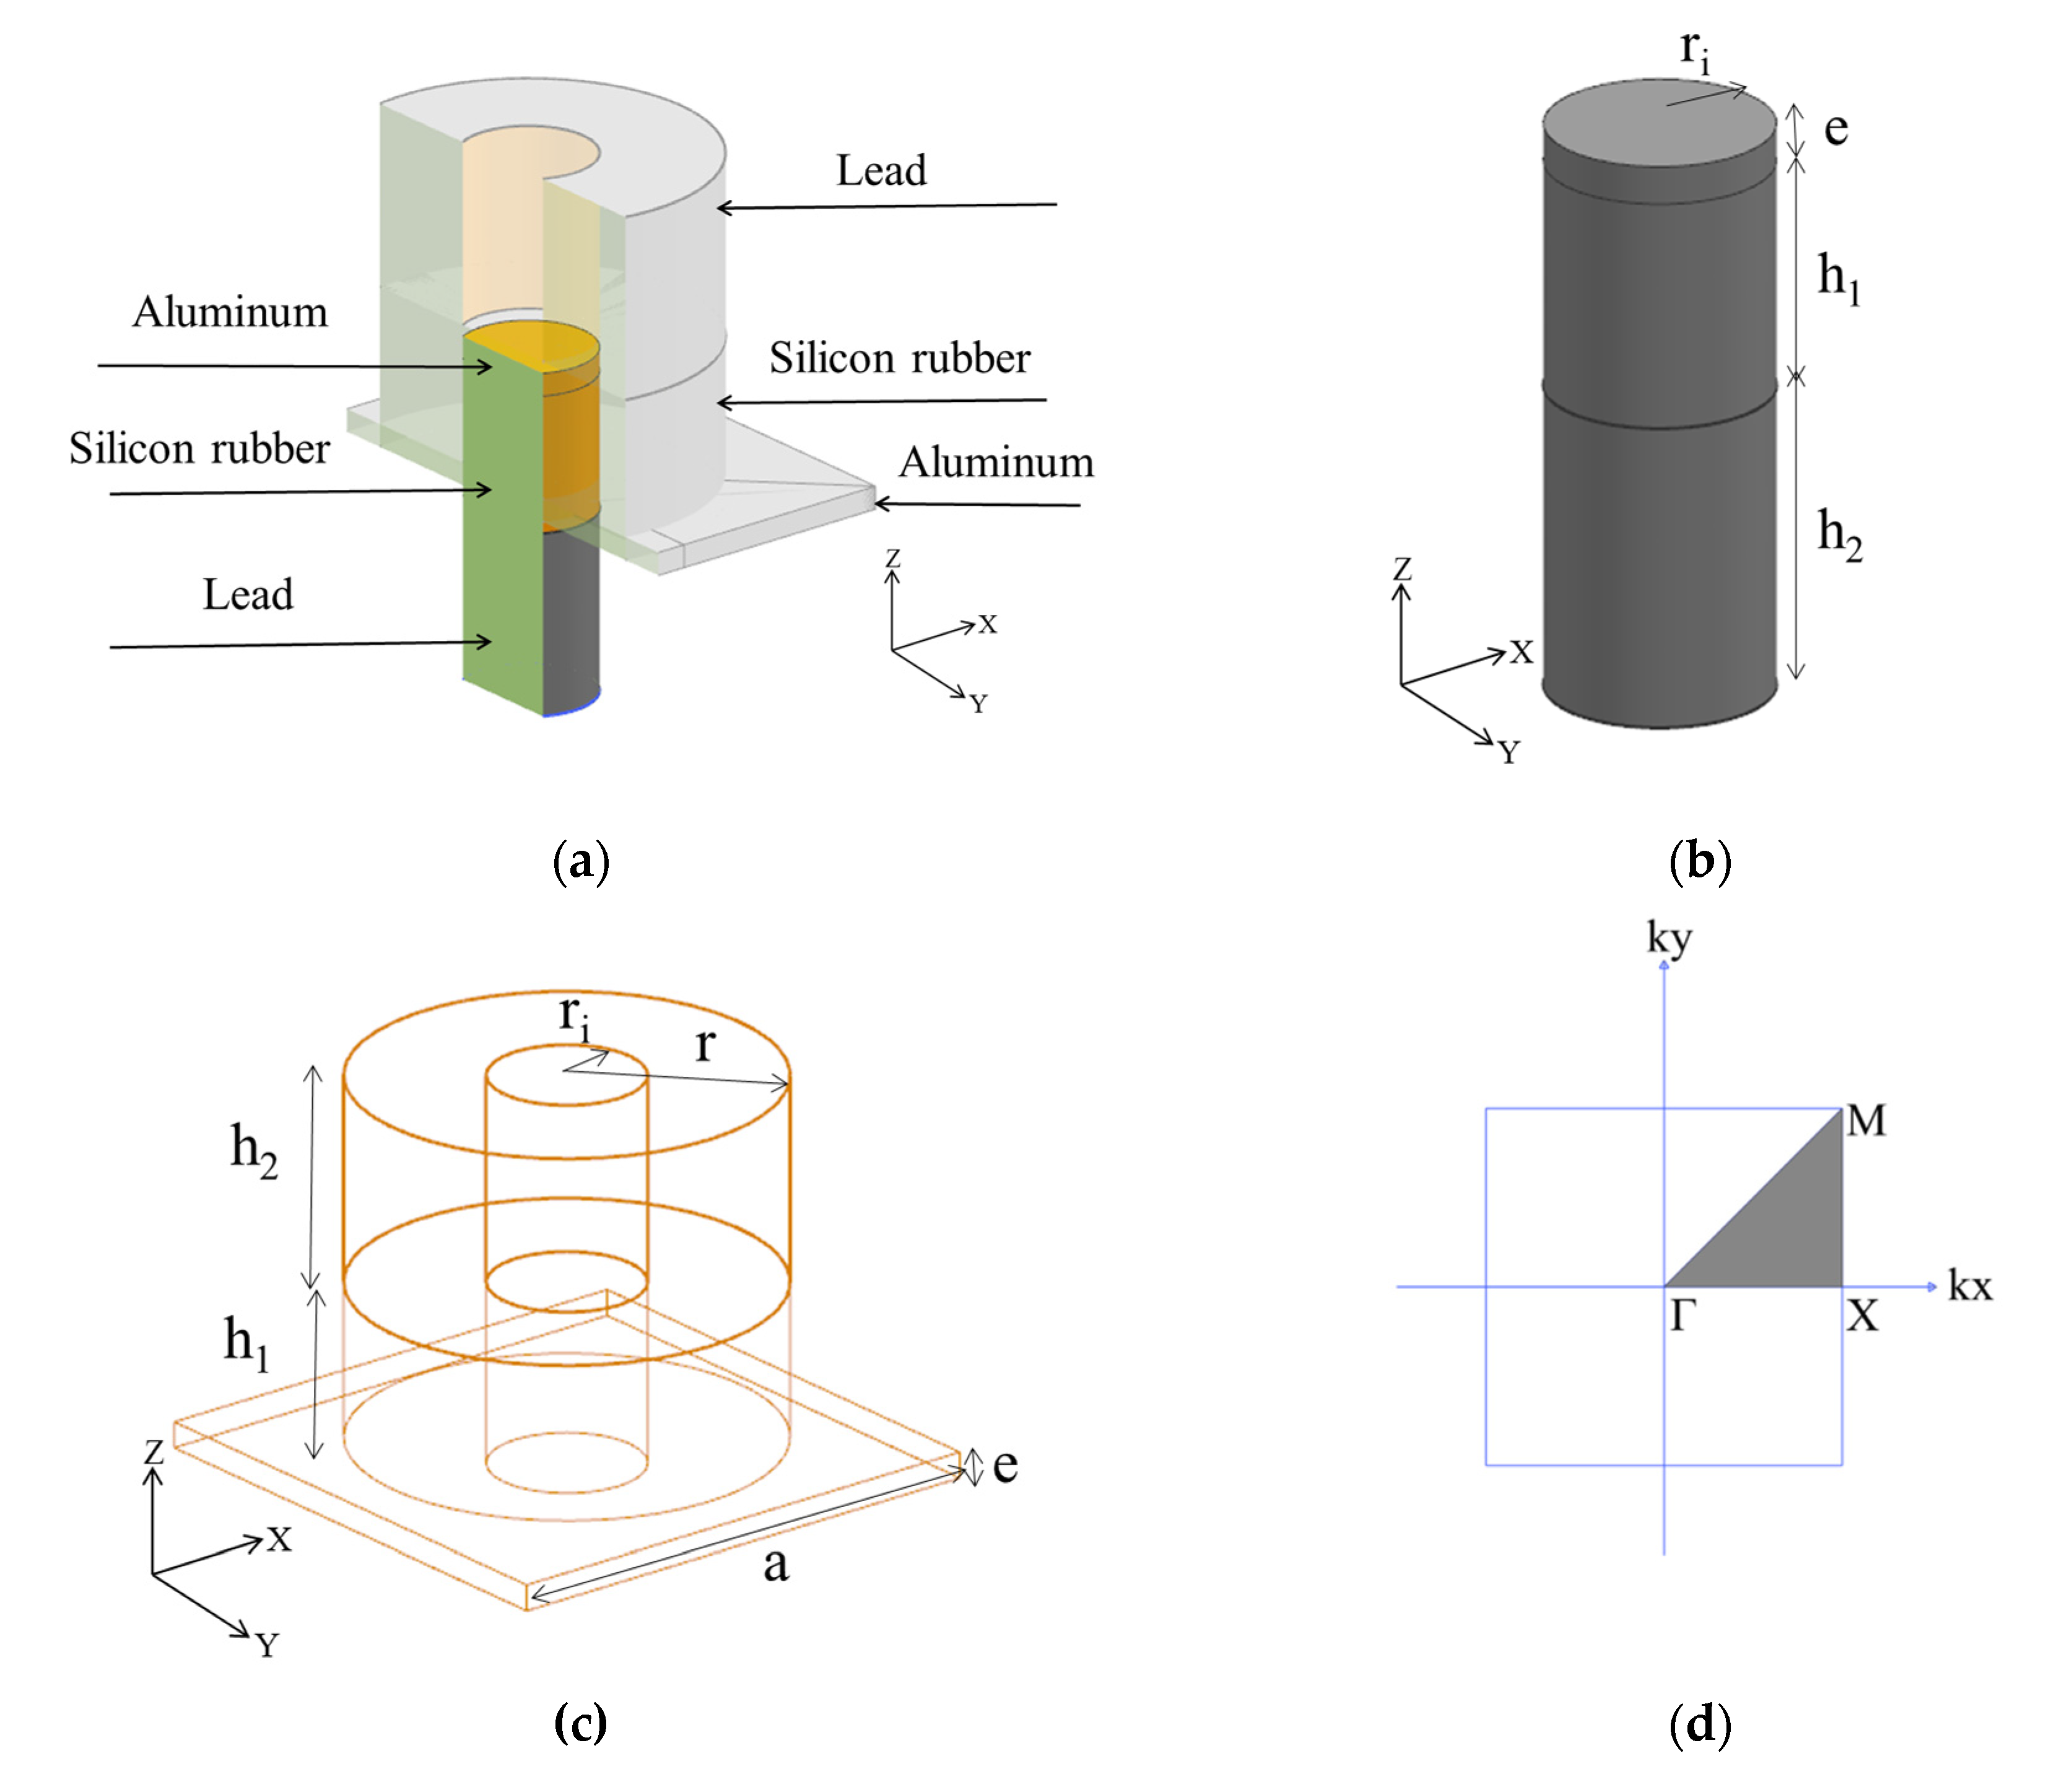
3.1. Influence of Hollow Radius

The hollow radius is set as 0.1a, 0.145a (original model), 0.2a, and 0.25a. The results are shown in Figure 6. We can see that the frequency of the dispersion curve would increase with the radius. When the radius was changed from 0.1a to 0.145a, the number of band gaps remains unchanged. The maximum value of band gap width ΔT is 7.7kHz appearing at ri = 0.1a. When the lattice model takes larger radius, the dispersion should pay more attention to the flatness of the energy bands so that the cyan band gaps are not labeled in the two figures to the right of Figure 6. When ri = 0.2a, there are three flatter energy bands than the original model dispersion curve between 20–40 kHz, which are marked with red stars. When ri = 0.25a, the three energy bands between 10–20 kHz are the flattest, which are marked with blue circles.

3.2. Influence of Plate Thickness

The effect of plate thickness is discussed afterwards. The thickness is set up as 0.05a (original model), 0.1a, 0.15a, and 0.2a. We analyze the frequency values of the dispersion curves and the flatness of the dispersion branches. Compared with the hollow radius, the thickness has fewer influences on both the frequency and the flatness of the dispersion branch, as shown in Figure 7.

3.3. Influence of Pillar Height Ratio

The influence of pillar height ratio (HR = h2/h1) is discussed. We set the pillar height ratio as 1/2, 1, 4/3 (the original model), and 2. The simulation results show that the frequency value would increase with HR. The dispersion curves at HR = 1 have more distinguished features. A 0.02 kHz-wide band gap around 2.95 kHz is indicated by a red star. A flat energy band exists around 10 kHz with this geometrical parameter, marked with a blue circle, while for the dispersion at the other three HR values, no significant variations in band gap width and dispersion branch flatness were found. The results of the above discussion are shown in Figure 8.

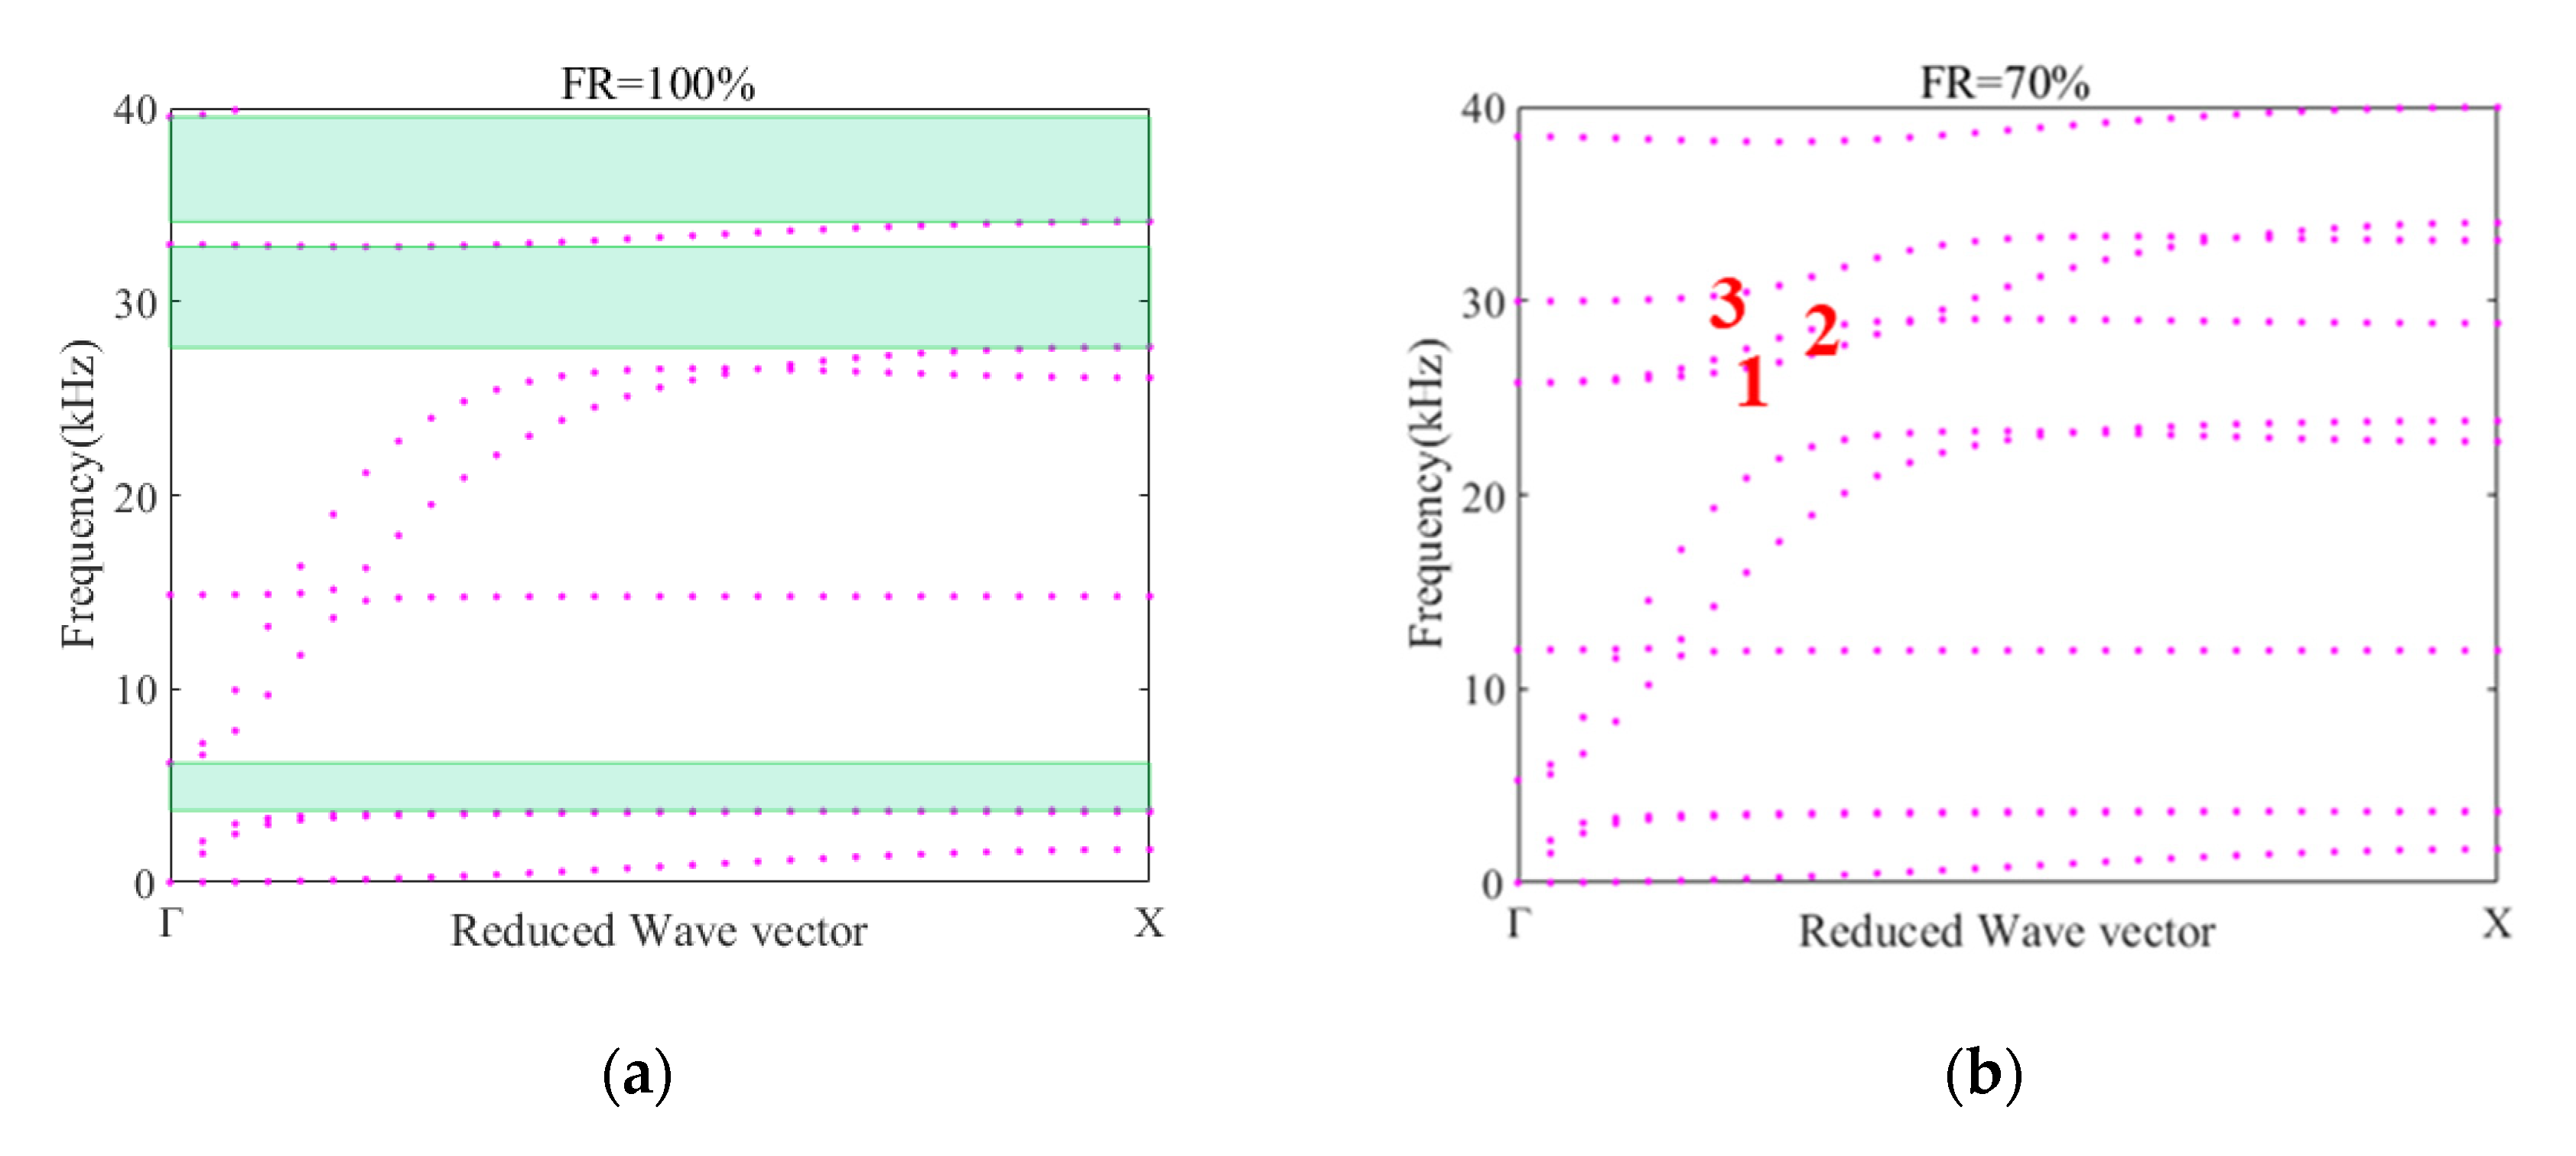
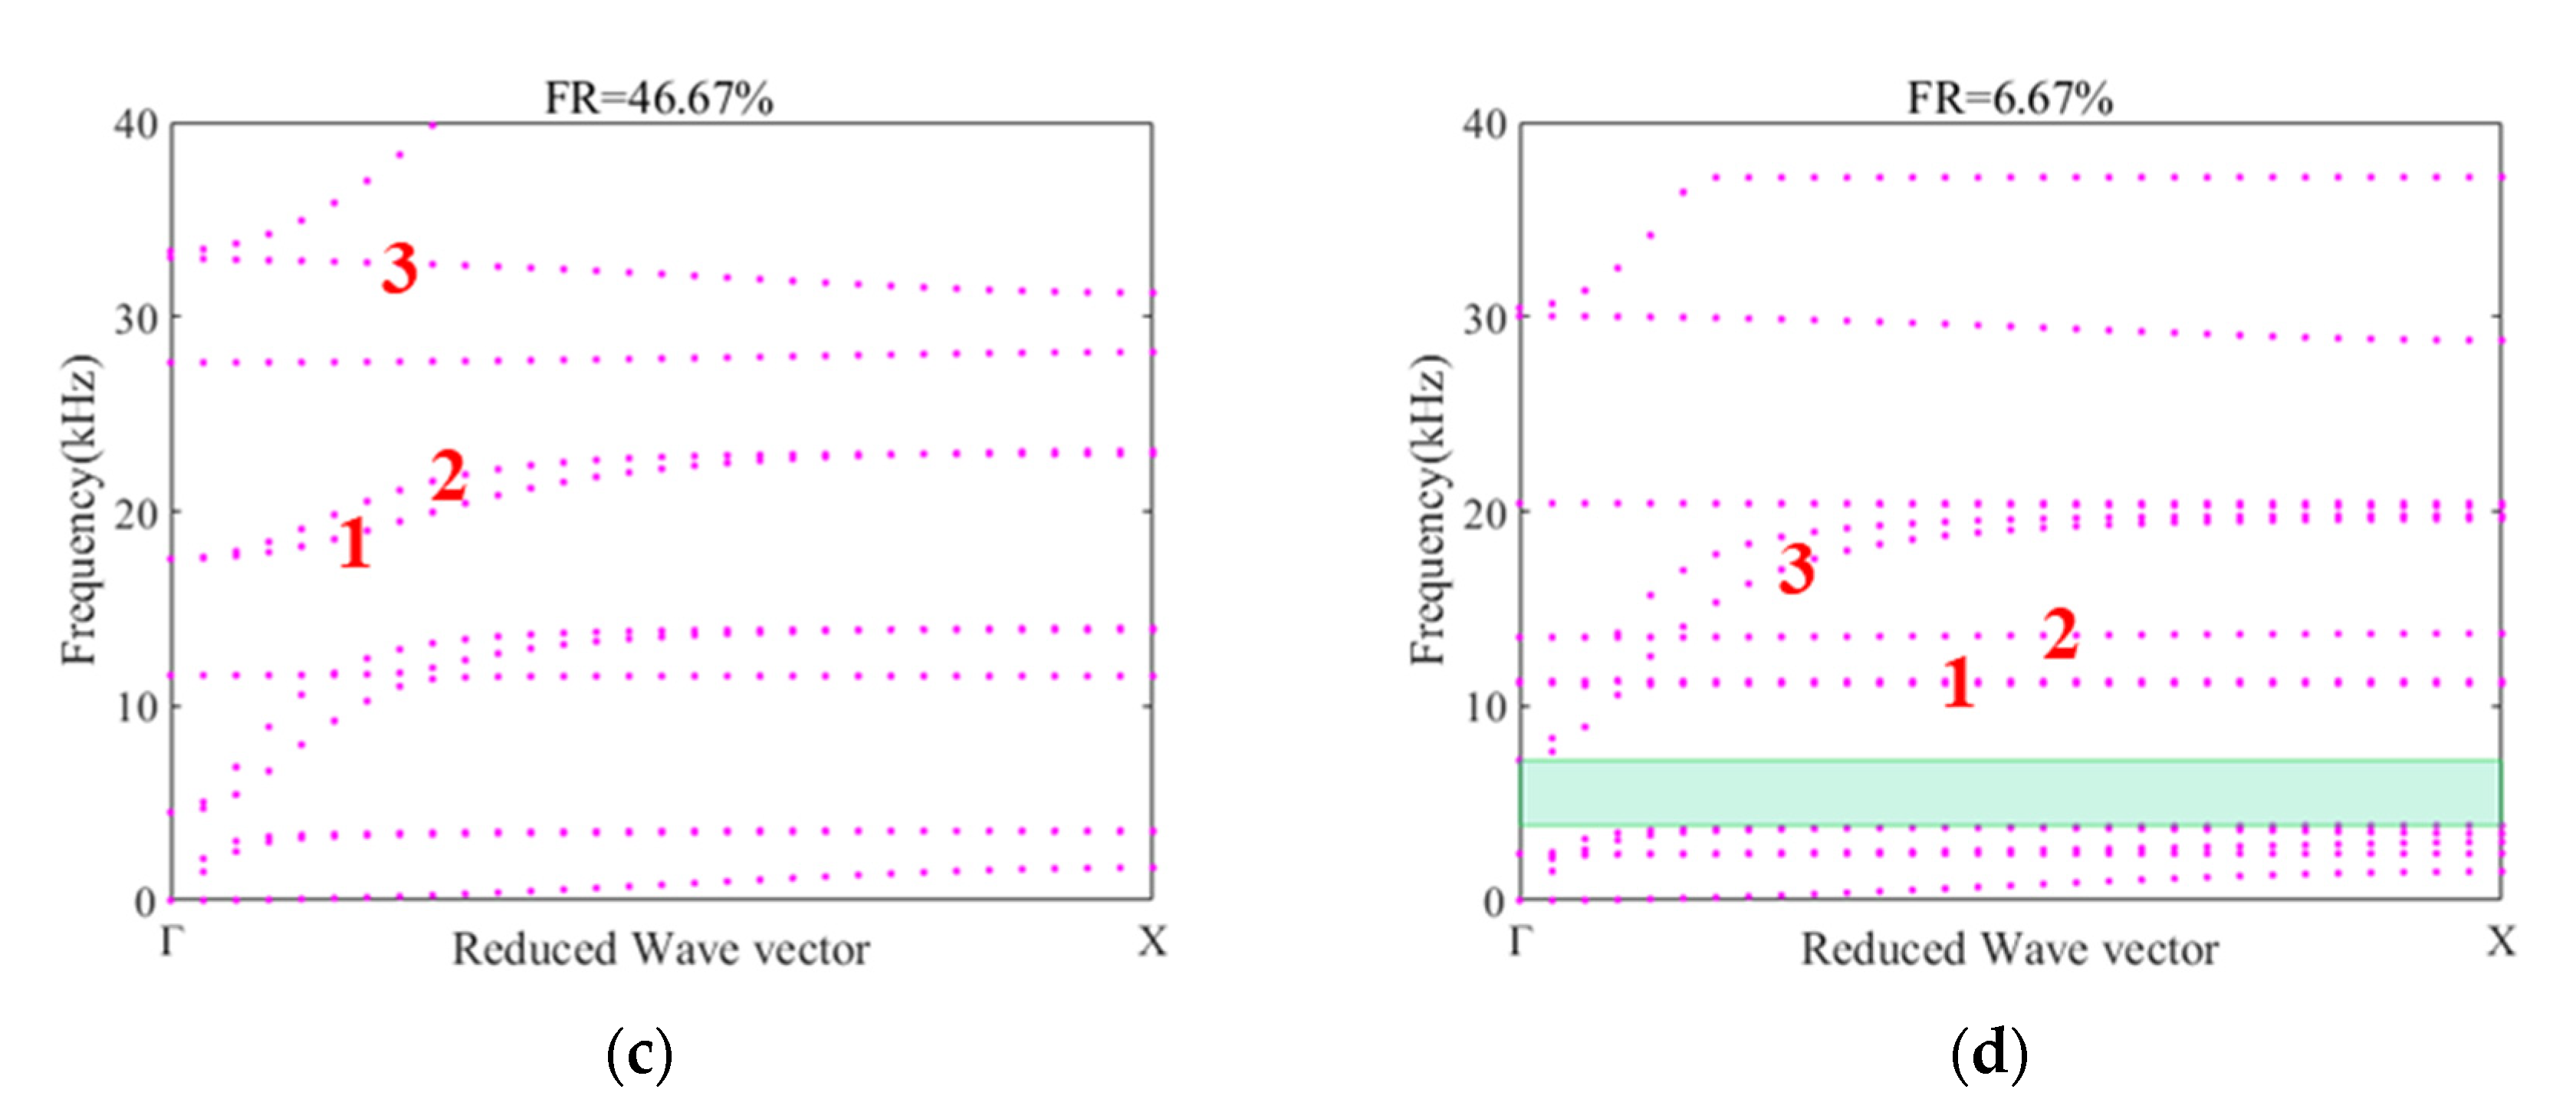
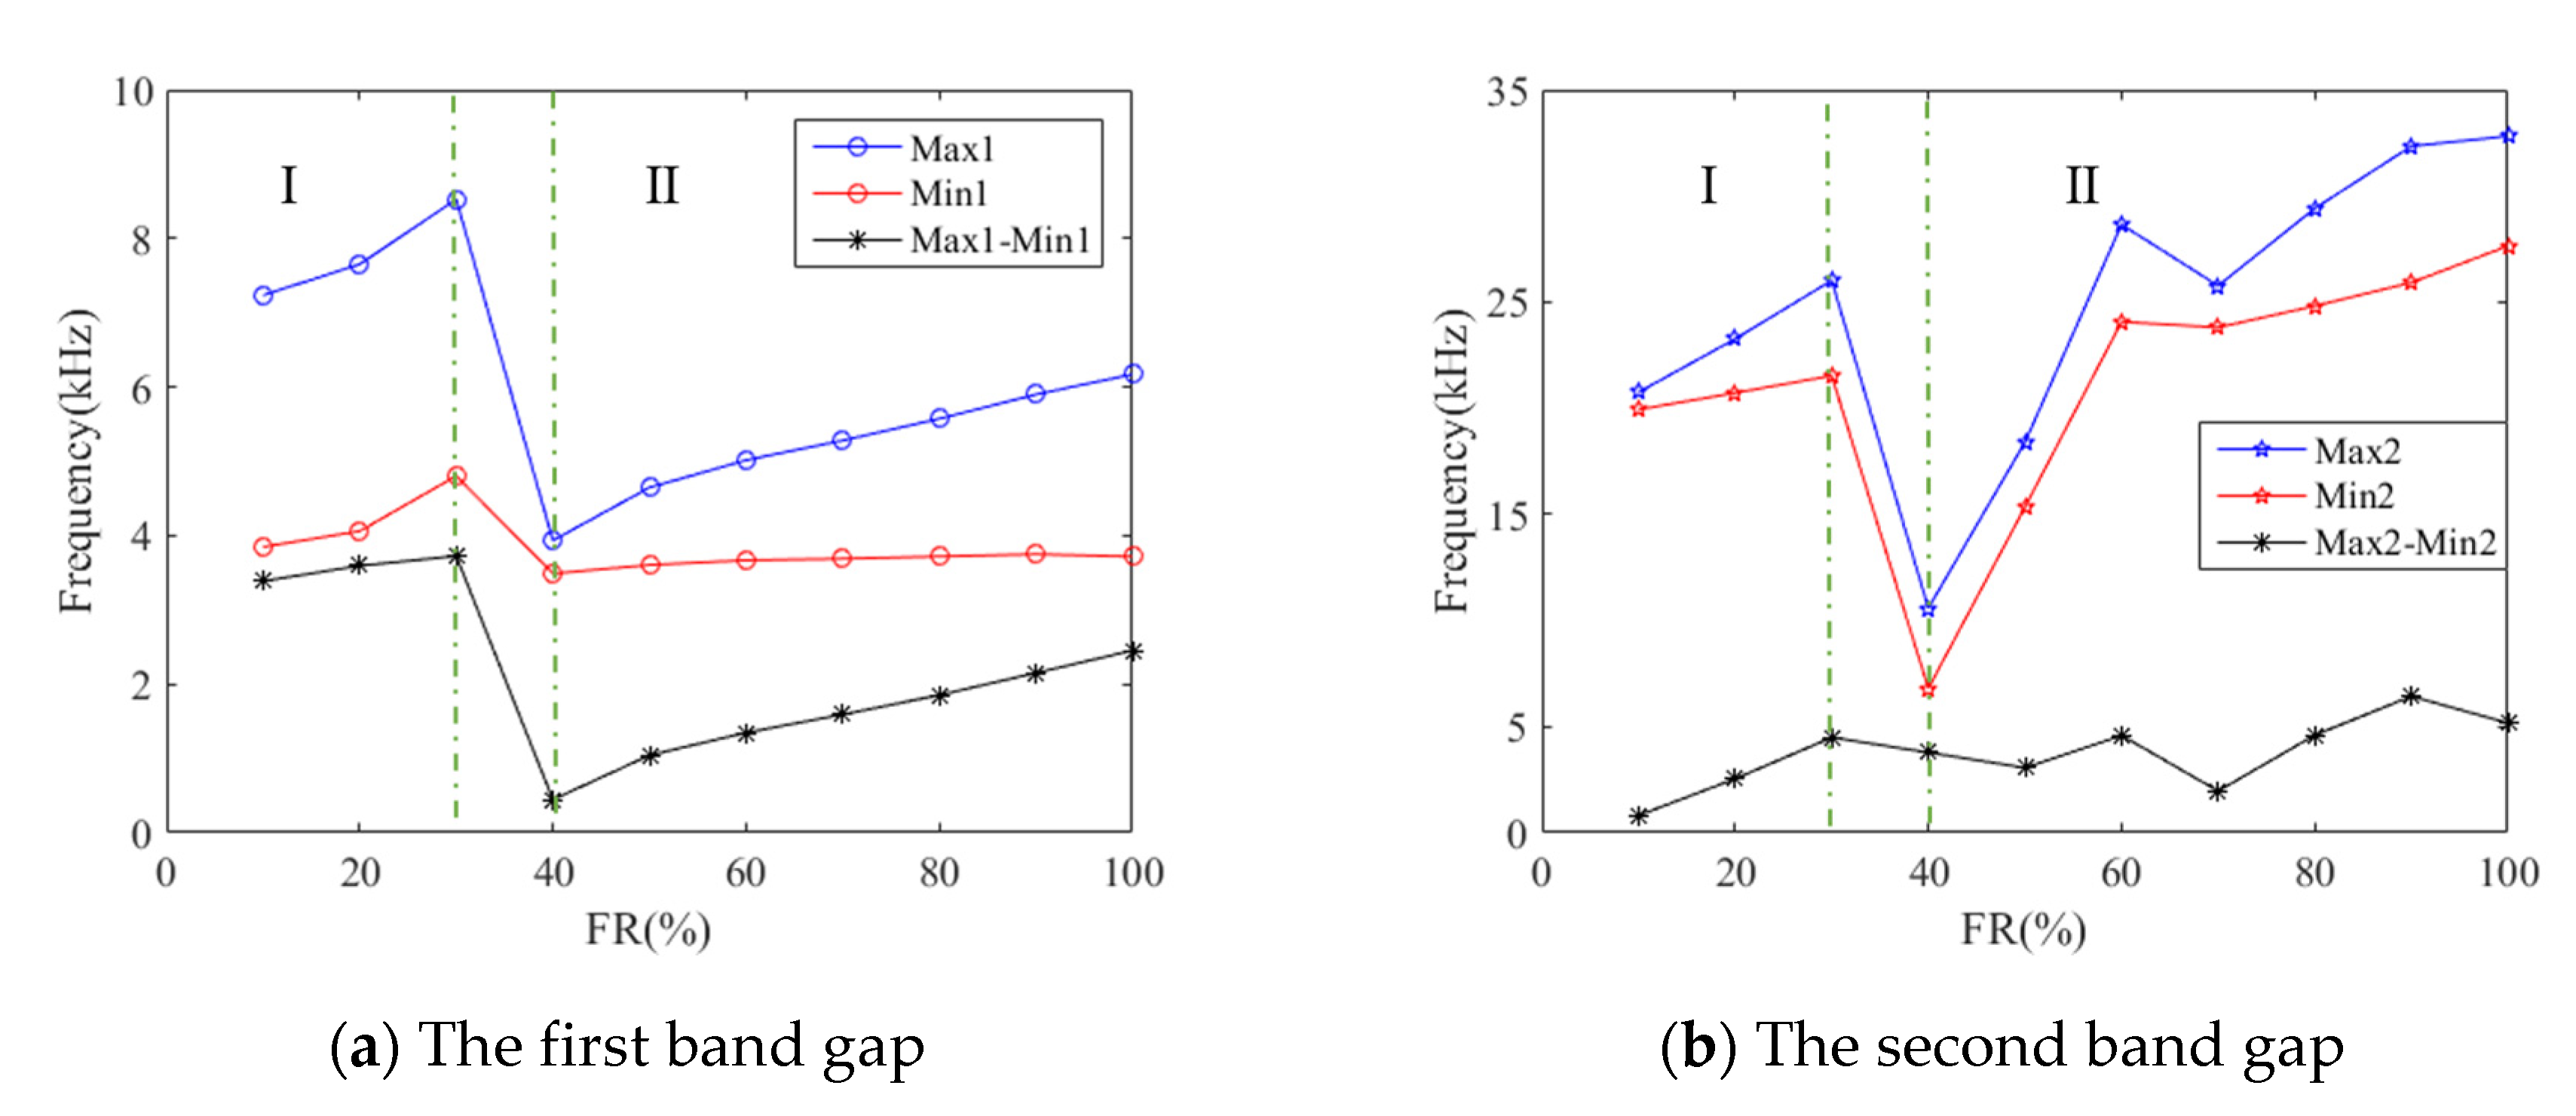
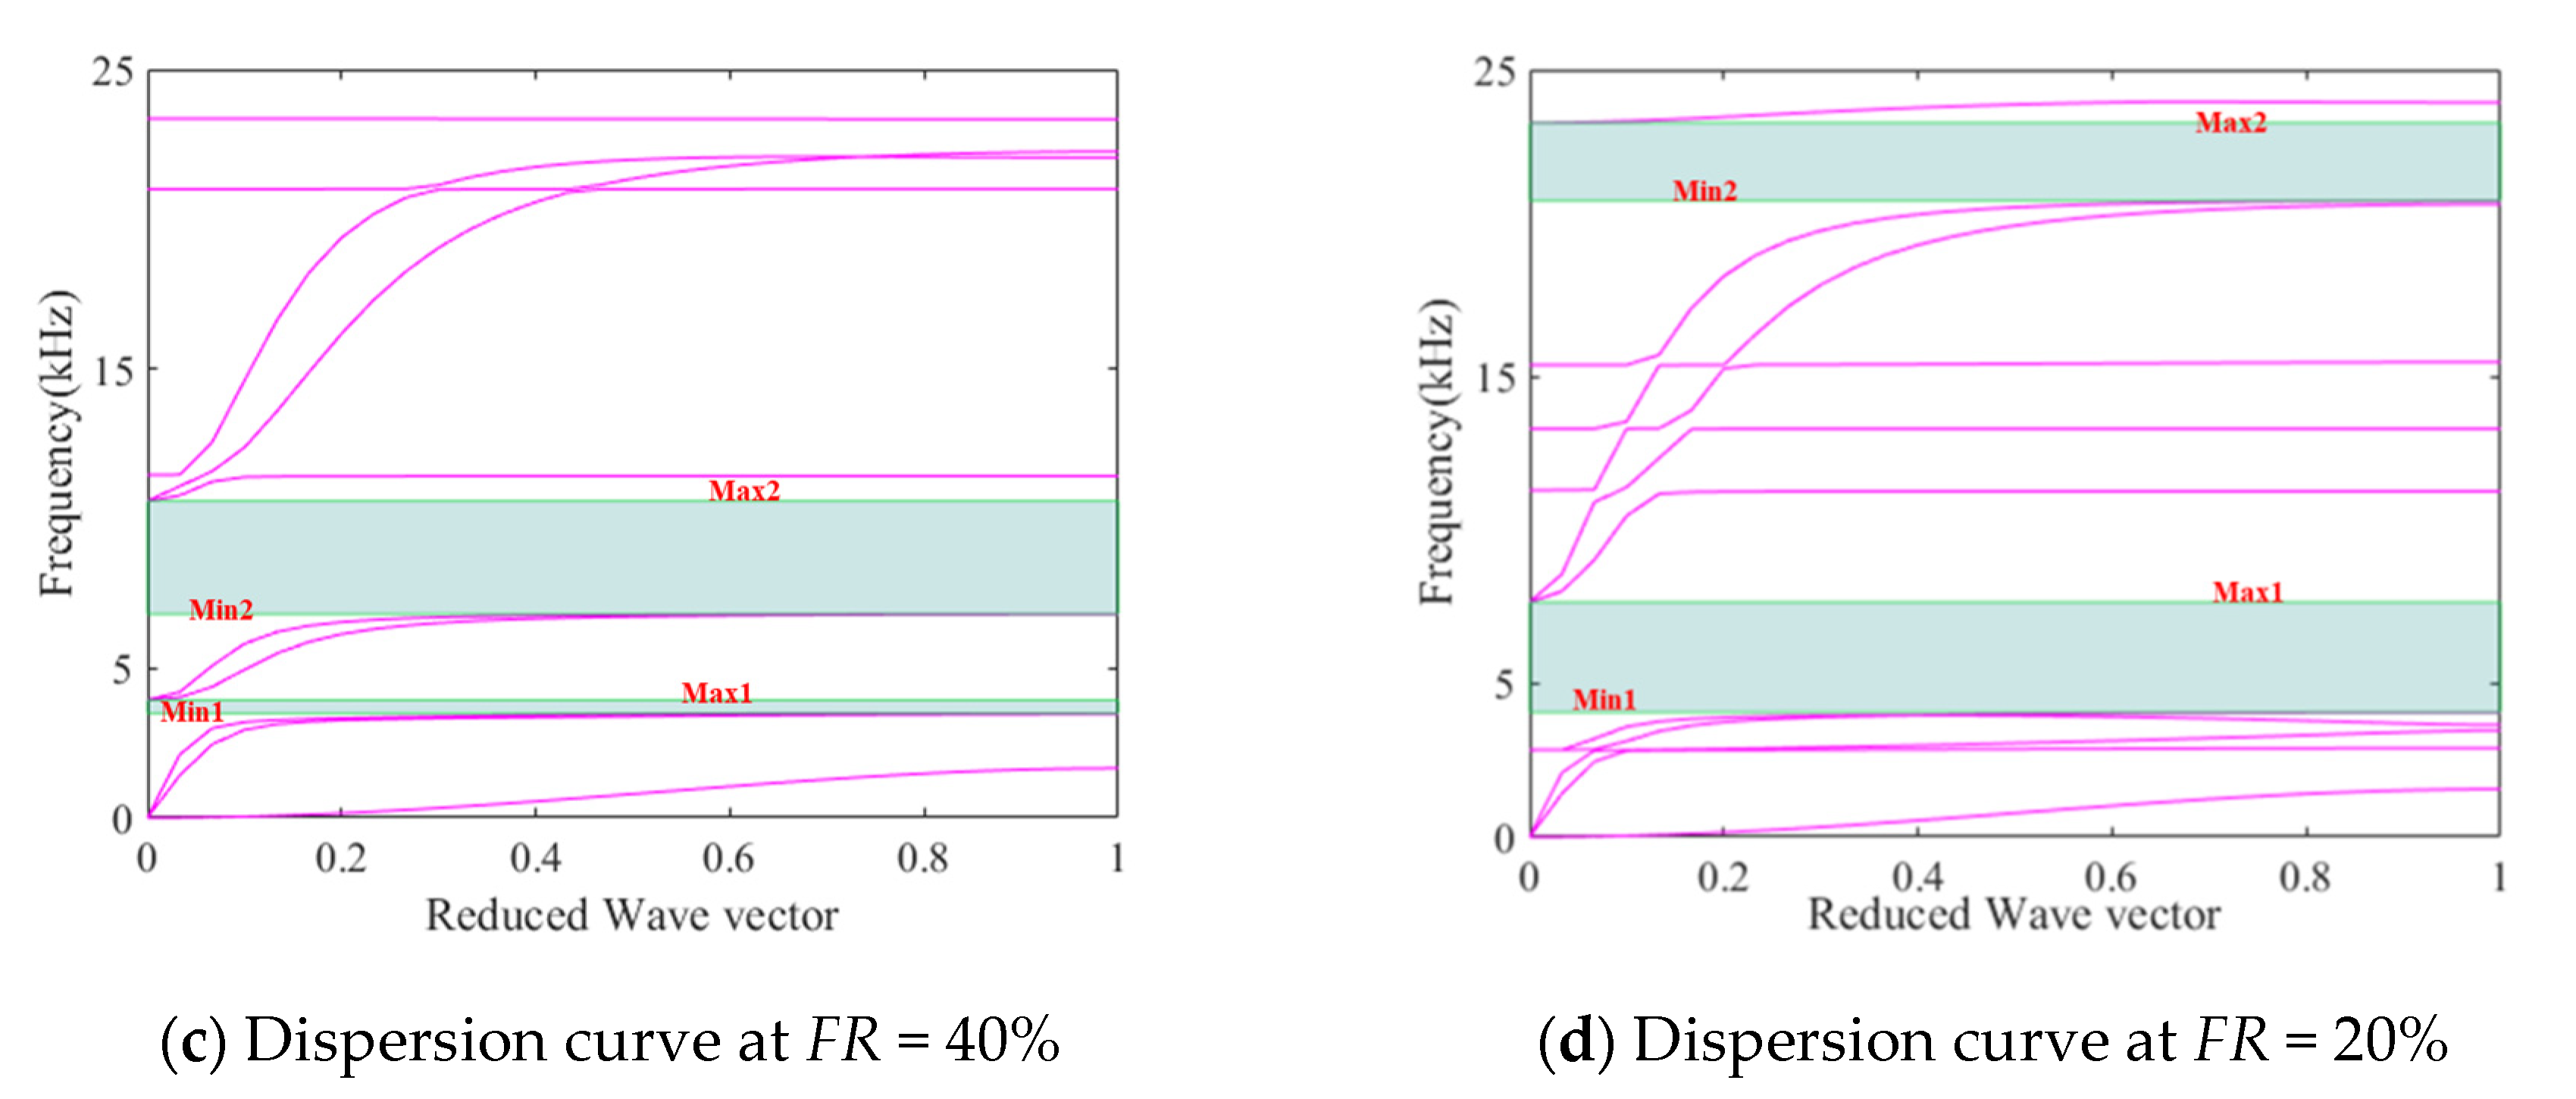
3.4. Influence of Filling Ratio

The above traditional structure parameters are not sufficient for HPFC’s structure design. The new proposed FR may play a more important role in the dispersion performance.
We performed simulations at a 10% interval with FR. The upper and lower boundary curves of the first band gap are given in Figure 9a. The boundary values of the second band gap are given in Figure 9b. The lower boundary value of the band gap is defined as Minj and the upper boundary value is defined as Maxj, where j is 1, 2. It is interesting that there are similar two distinguished zones I and II, separated by vertical dotted-lines, so we give the dispersion curves for FR = 40% and FR = 20%. The first and the second band gaps are selected and labeled to show more details.
Within each zones, the values of ’Maxj’, ’Minj’ and ’Maxj–Minj’ of the first band gap increase with the rise of ’FR’. The second band gap boundary values have similar features to those of the first gaps, except for a decrease when FR = 70. ’Maxj–Minj’ for the first band gap has the same trend, but the deviation for the second gap will increase slowly. Although the reason for the distinguished two zones is still not clear and need further study, the study for band gaps could still provide a theoretical basis for the low frequency sound insulation of the structure.

3.5. Influence of Composite Parameters

The FR describes the structure relationship for the two components. A similar parameter HR describes the material relationship. These two dimensionless factors may have a coupling effect on the dispersion performance for HPFC plate, so we investigated them together.
The locally resonant band gaps at different FR and HR are simulated as shown in Figure 10. The Figure 10a shows the band gap by varied FR when HR = 4/3, and the results are shown in Figure 10b when HR = 2. The band gap width ΔT and the band gap median frequency T are selected to quantify the results under different structural parameters. We show the data for different HR and FR in Table 2.
Compared with Figure 10a,b, the lowest T of the band gap exist in the frequency of 3.7615 Hz when FR = 100% and HR = 2 and the widest ΔT exist with the band gap of 3.3540 when FR = 6.67% and HR = 4/3. The band gap width at FR = 6.67% provides a research direction for realizing the low frequency sound insulation and vibration and noise reduction function at a wide frequency. This is very important for the vehicle NVH.
All the above discussions provide a direction for the research of locally resonant frequency sound insulation and vibration and noise reduction by different structural parameters.

4. Multiplexing Design Based on FR Variation

Waveguides enable the transmission of A0Lamb waves at specific frequencies. The multiplexing technique could transmit among these different waves in a single channel. The proposed variable FR by itself could define both the waveguide and the physical structure. Therefore, we choose FR as the kernel of the multiplexing for HPFC plate.

4.1. Multichannel Resonator Multiplexer

Based on the above analysis of different structural parameter models, a (5 × 5) super PCs structure is built and simulation results are shown in Figure 11a. We set the periodicity condition in the Y direction and PML in the X direction of sound transmission. The PCs consist of a row of full-filling pillars that separate the linear waveguides to prevent significant leakage between them. Waveguides A and B are composed of two rows of hollow pillars with the FR = 46.67% and the FR = 50%. The other geometrical parameters take the same value with one of the models in Section 3.5 (ri = 0.145, e = 0.05, and HR = 2). The initial displacement is set in front of the PCs to generate the A0 Lamb wave to verify the transmission effect.
As shown in Figure 11a, two narrow bands pass through the transmission spectrum at the frequencies of 22.600 kHz and 23.100 kHz. The transmitted waves of waveguides A and B corresponding to two narrow bands are shown in the displacement field distribution in Figure 11b. Then a multi-channel wavelength multiplexer could be set up.

4.2. Single-Channel Resonator Multiplexer

A single channel multiplexer composed of two alternating hollow pillars with different FR values is plotted in the top of Figure 12a. The FR(C) is 46.67%. The FR(D) is 50%, as the same value with the multi-channel multiplexer. The transmission spectrum is shown in Figure 12a. By a different array arrangement, two narrow bands also appear at 22.801 kHz and 23.801 kHz. This means that two different wavelengths can be transmitted through the same channel. Figure 12b depicts the displacement field at frequencies f(C) and f(D), where the enhancement of the fields inside the hollow pillar can be observed at the two ratios.

4.3. Compact Multiplexer Based on Linear Cavity

A cell with an extremely compact structure is shown in the top of Figure 13a. It consists of two rows of hollow pillars with different FR values and surrounded by a row of solid pillars (FR = 100%) on each side. The unit has a finite dimension along the X direction and is periodic in the Y direction. The FR(E) = 46.67% and the FR(F) = 50%. The transmission of the anti-symmetric Lamb waves is emitted in the X direction in Figure 13a. It indicates that two narrow bands of the structure appear at 31.901 kHz and 32.401 kHz, and Figure 13b depicts the displacement field at frequencies f(E) and f(F).
Three multiplexed structures are constructed by adjusting the positions of different FR. The results show that the a factor (FR) could be used to define the waveguides and physical structures. It may provide a possibility for the real-time modulation.

5. Discussion

A new composite structure is proposed and a dimensionless variable, the filling ratio, is defined to describe the lattice model. Through the calculation and simulations on the transmission spectrum and band gap dispersion curves, five main conclusions can be drawn as follows:
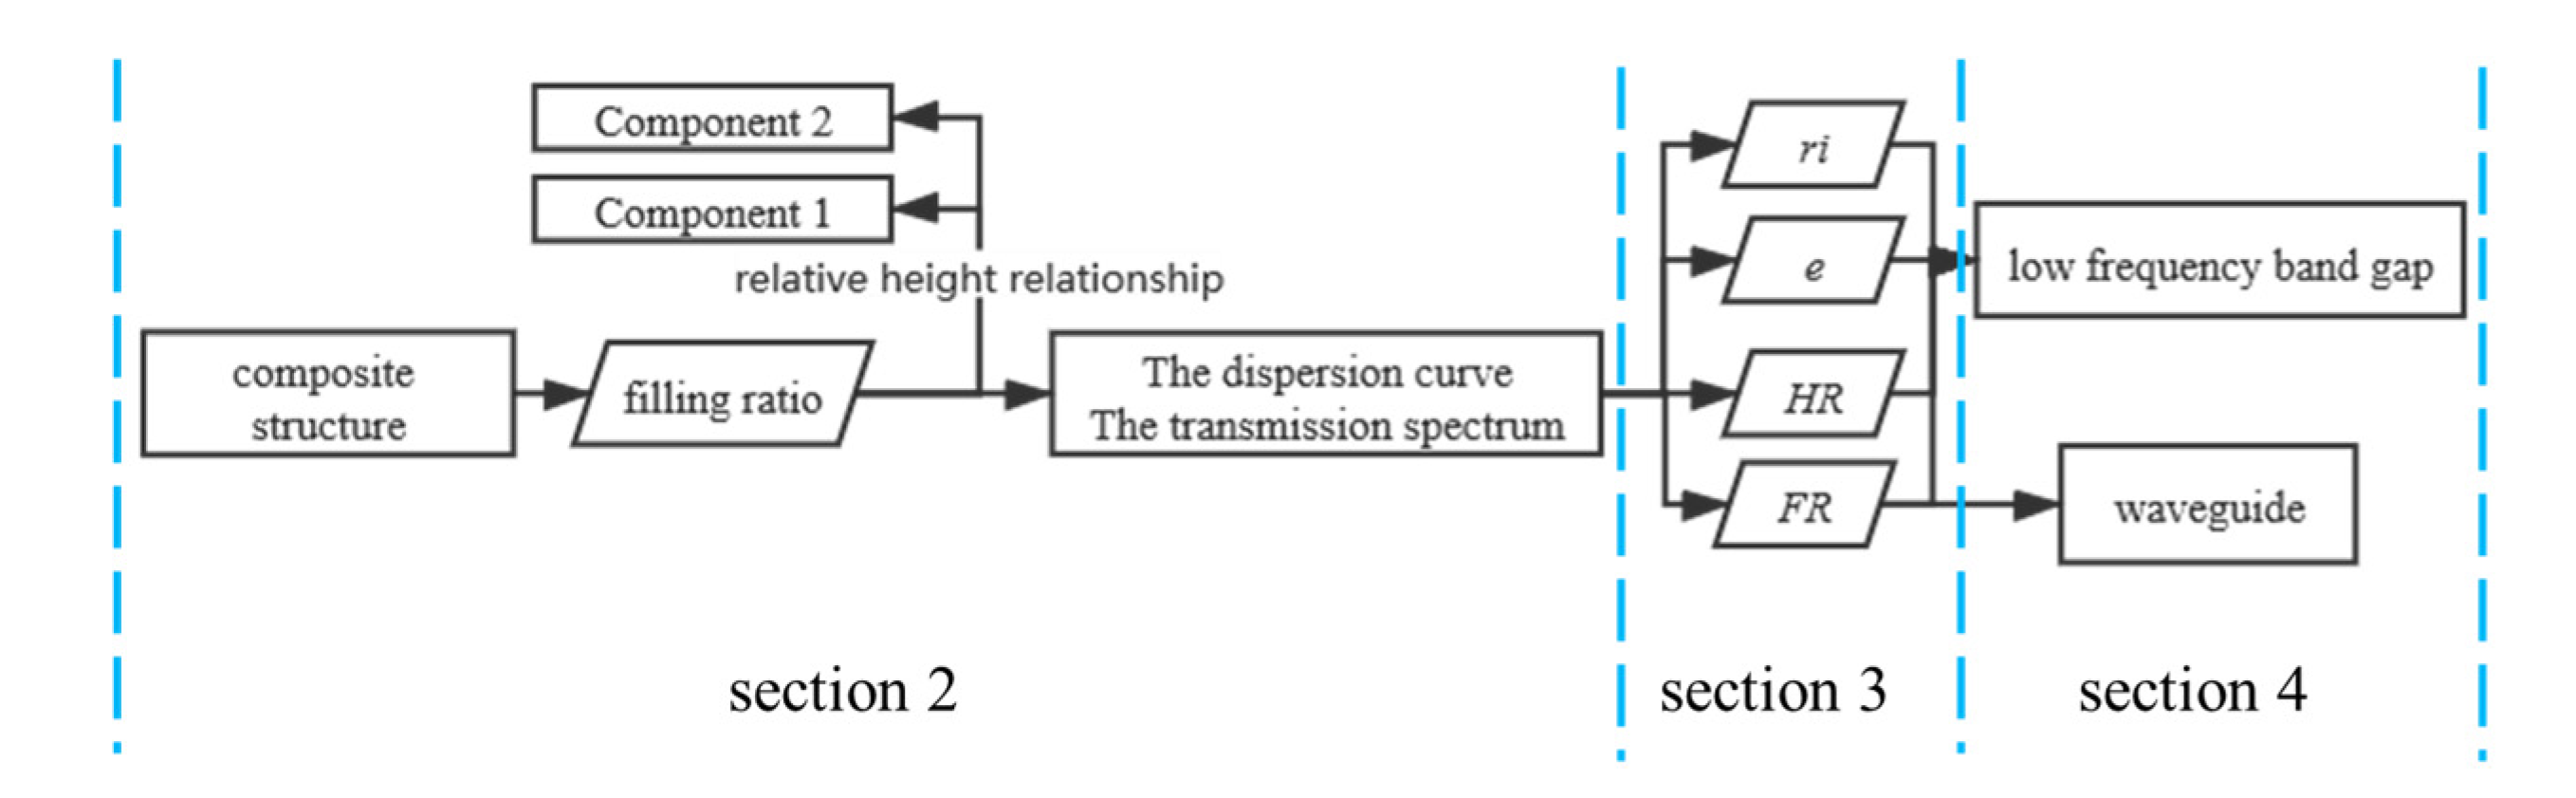
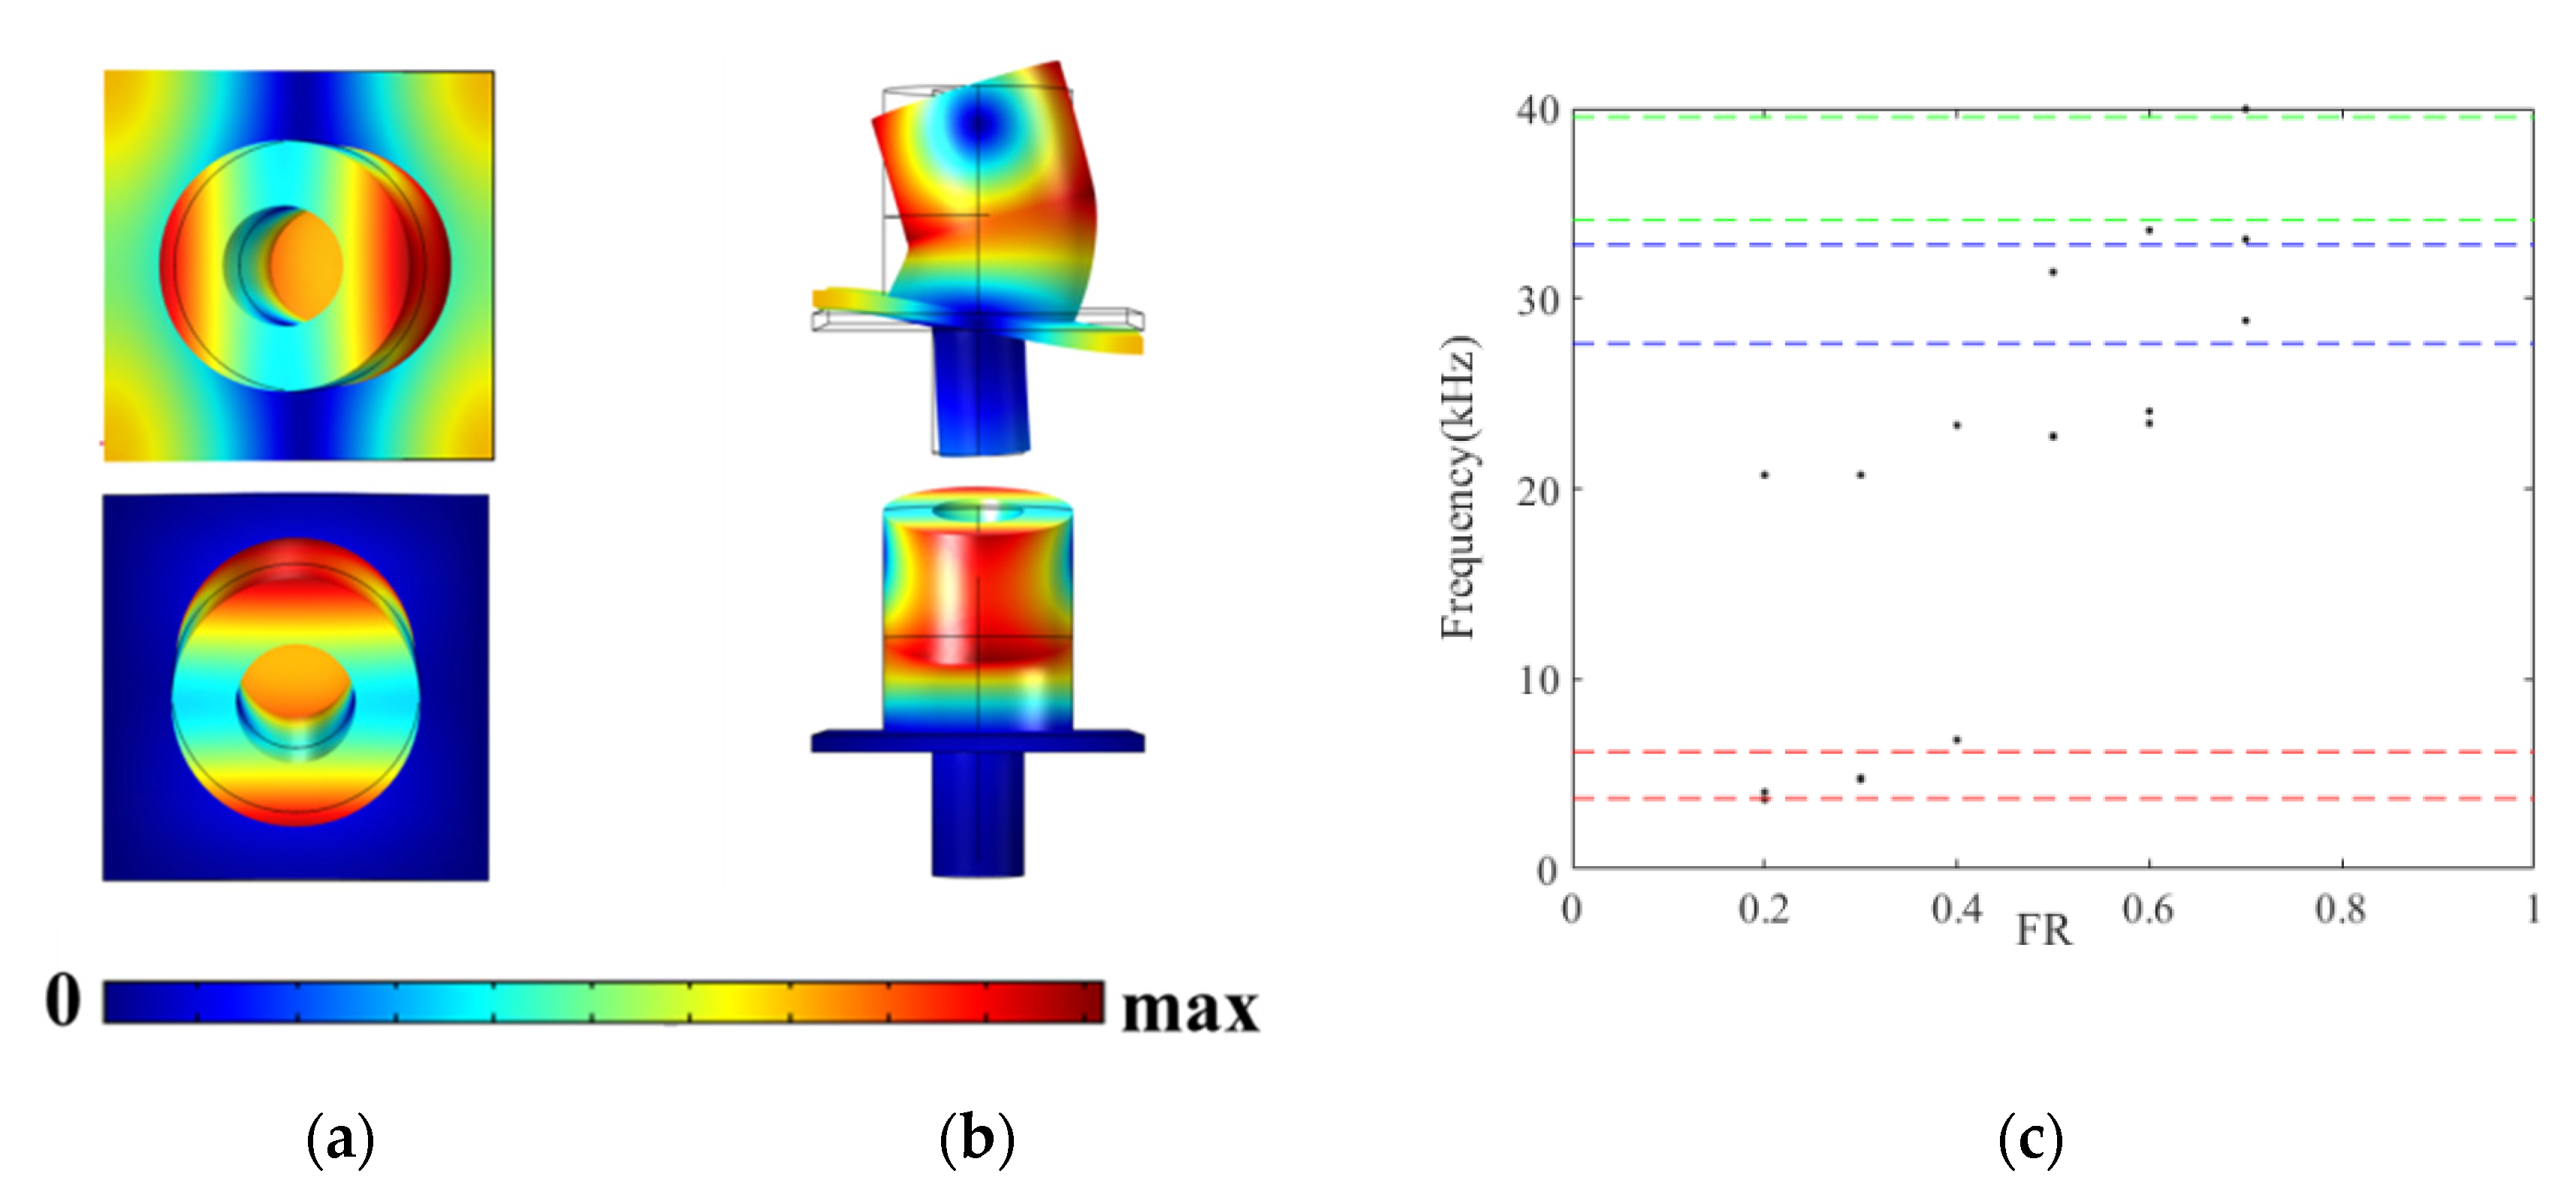
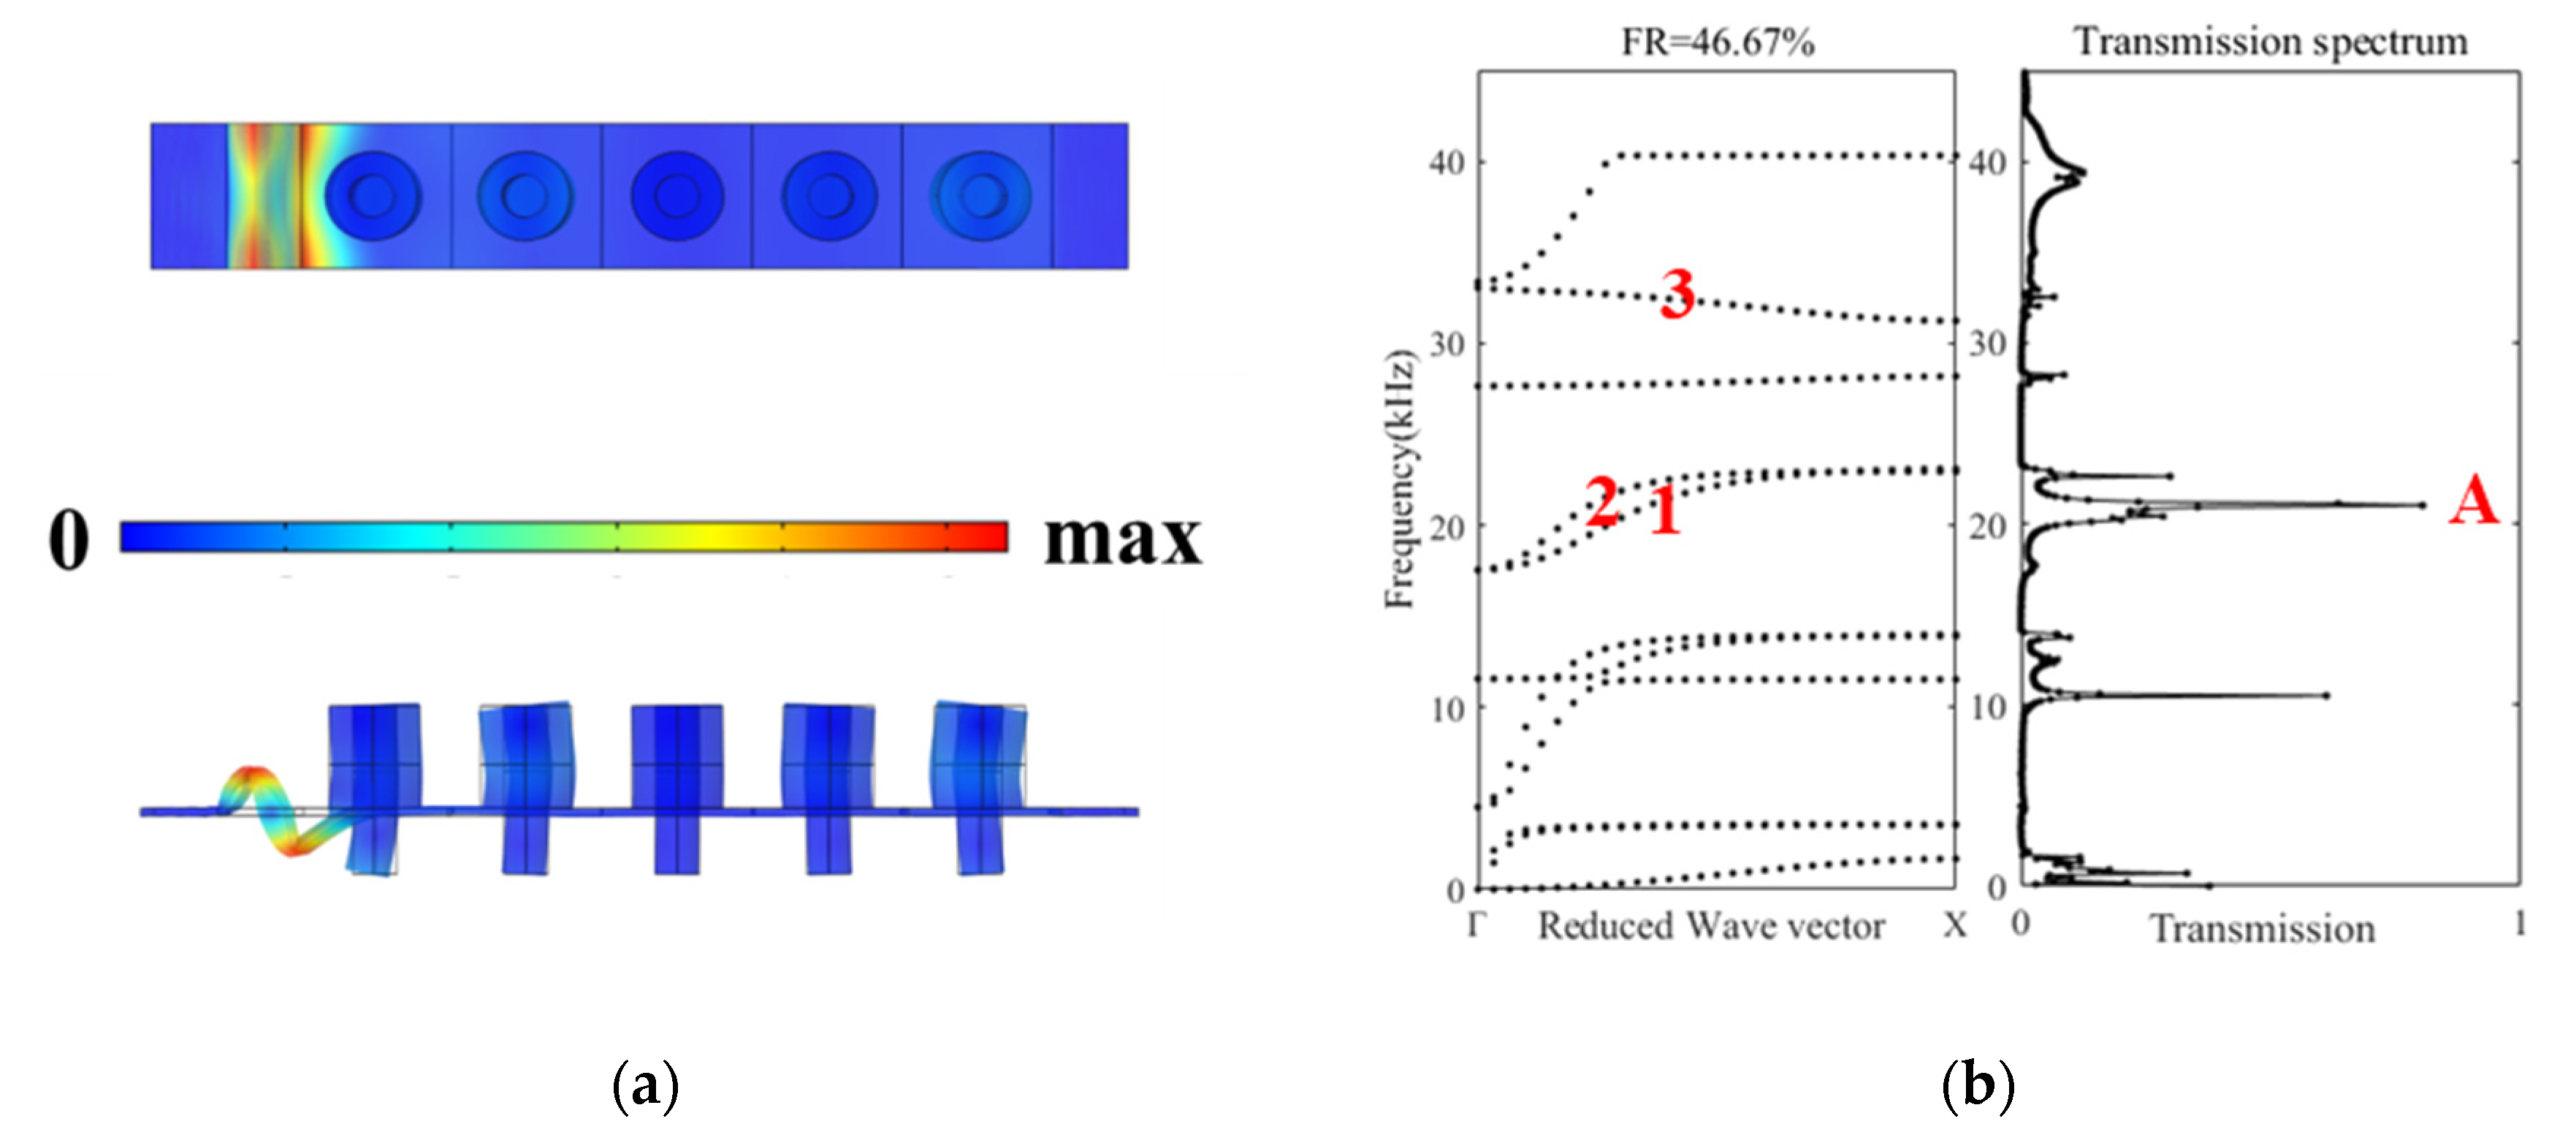
  • The proposed composite structure (HPFC) could guide and filter the sound waves. It may expand the sonic band gap in lower frequencies and realize the waveguide function, validated by the observed three dispersion branches. Compared to other lattices, the oppositely arranged three-layer pillar and hollow stub make it a potential solution for vehicle NVH problems;
  • By introducing the concept of FR into the PCs model description, it helps us to understand how the relationship between the components affects the sonic performances with a similar structure. The frequency of these branches decreases with the reduction in FR. It is interesting that the dispersion branches are mostly flat when FR = 46.67%. When FR = 6.67%, the width of the low frequency band gap is largest. Therefore, when we design a real plate used in vehicles, we may set the structure optimization boundary according these two percentages.
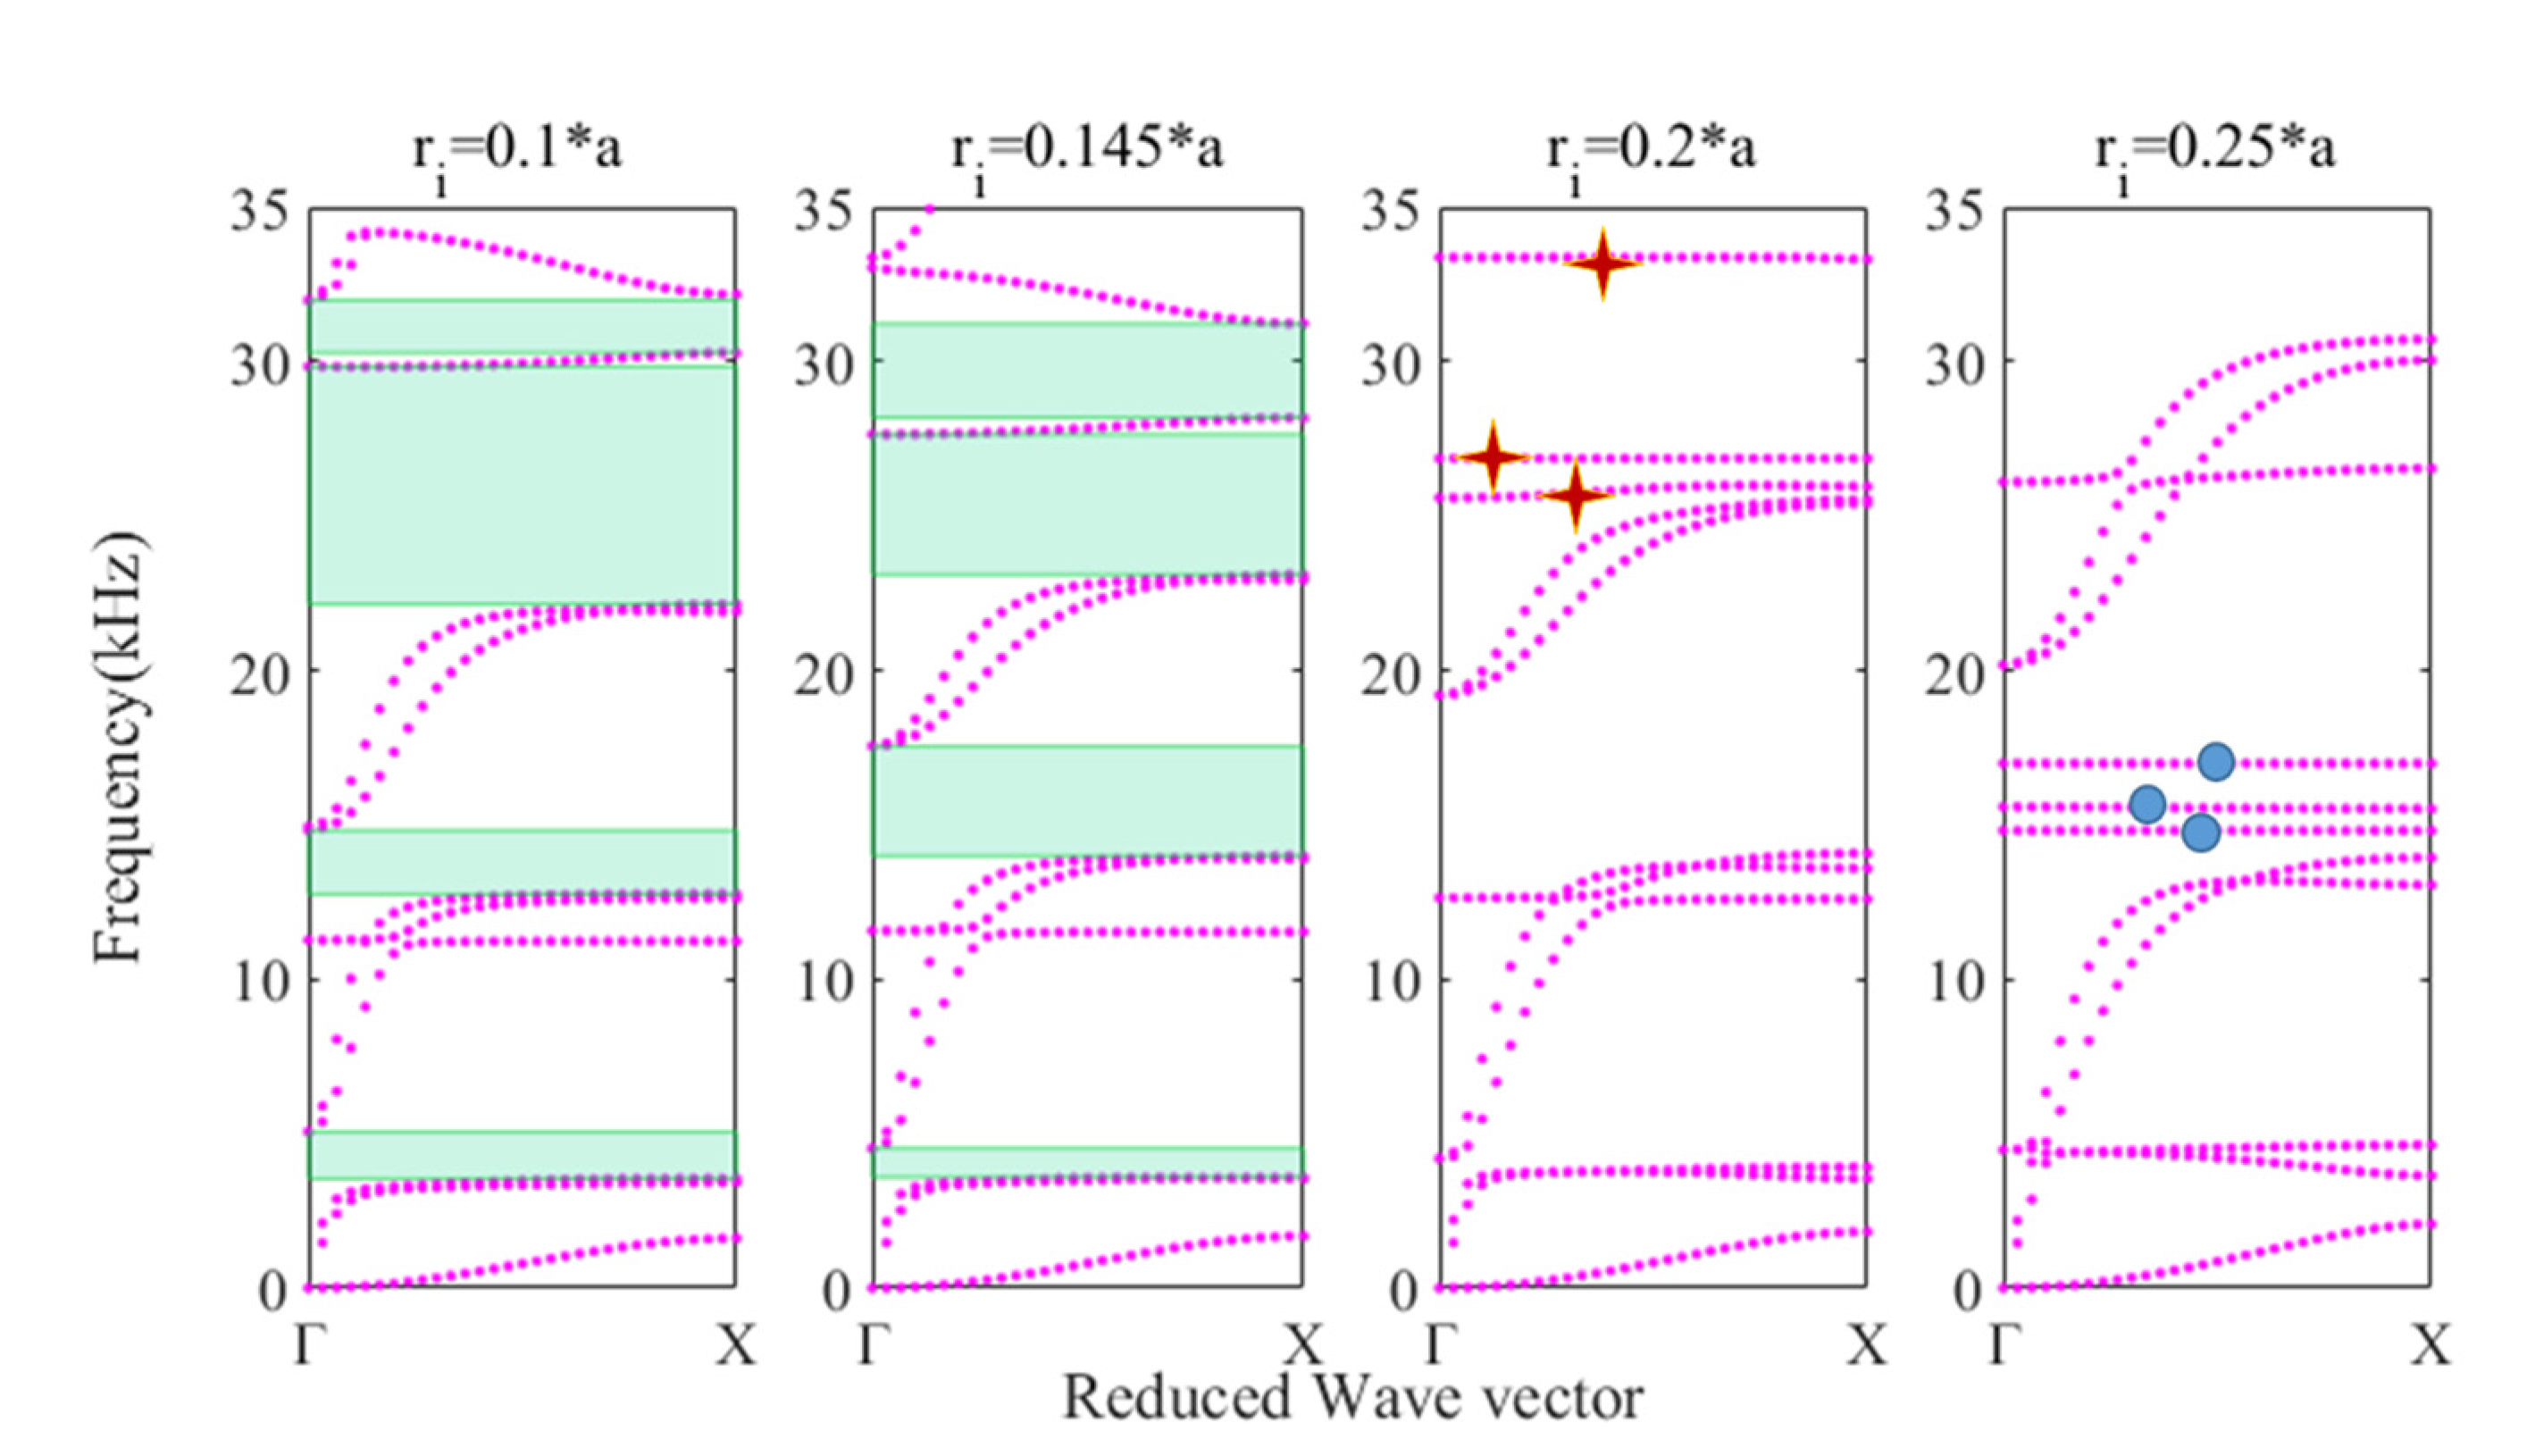
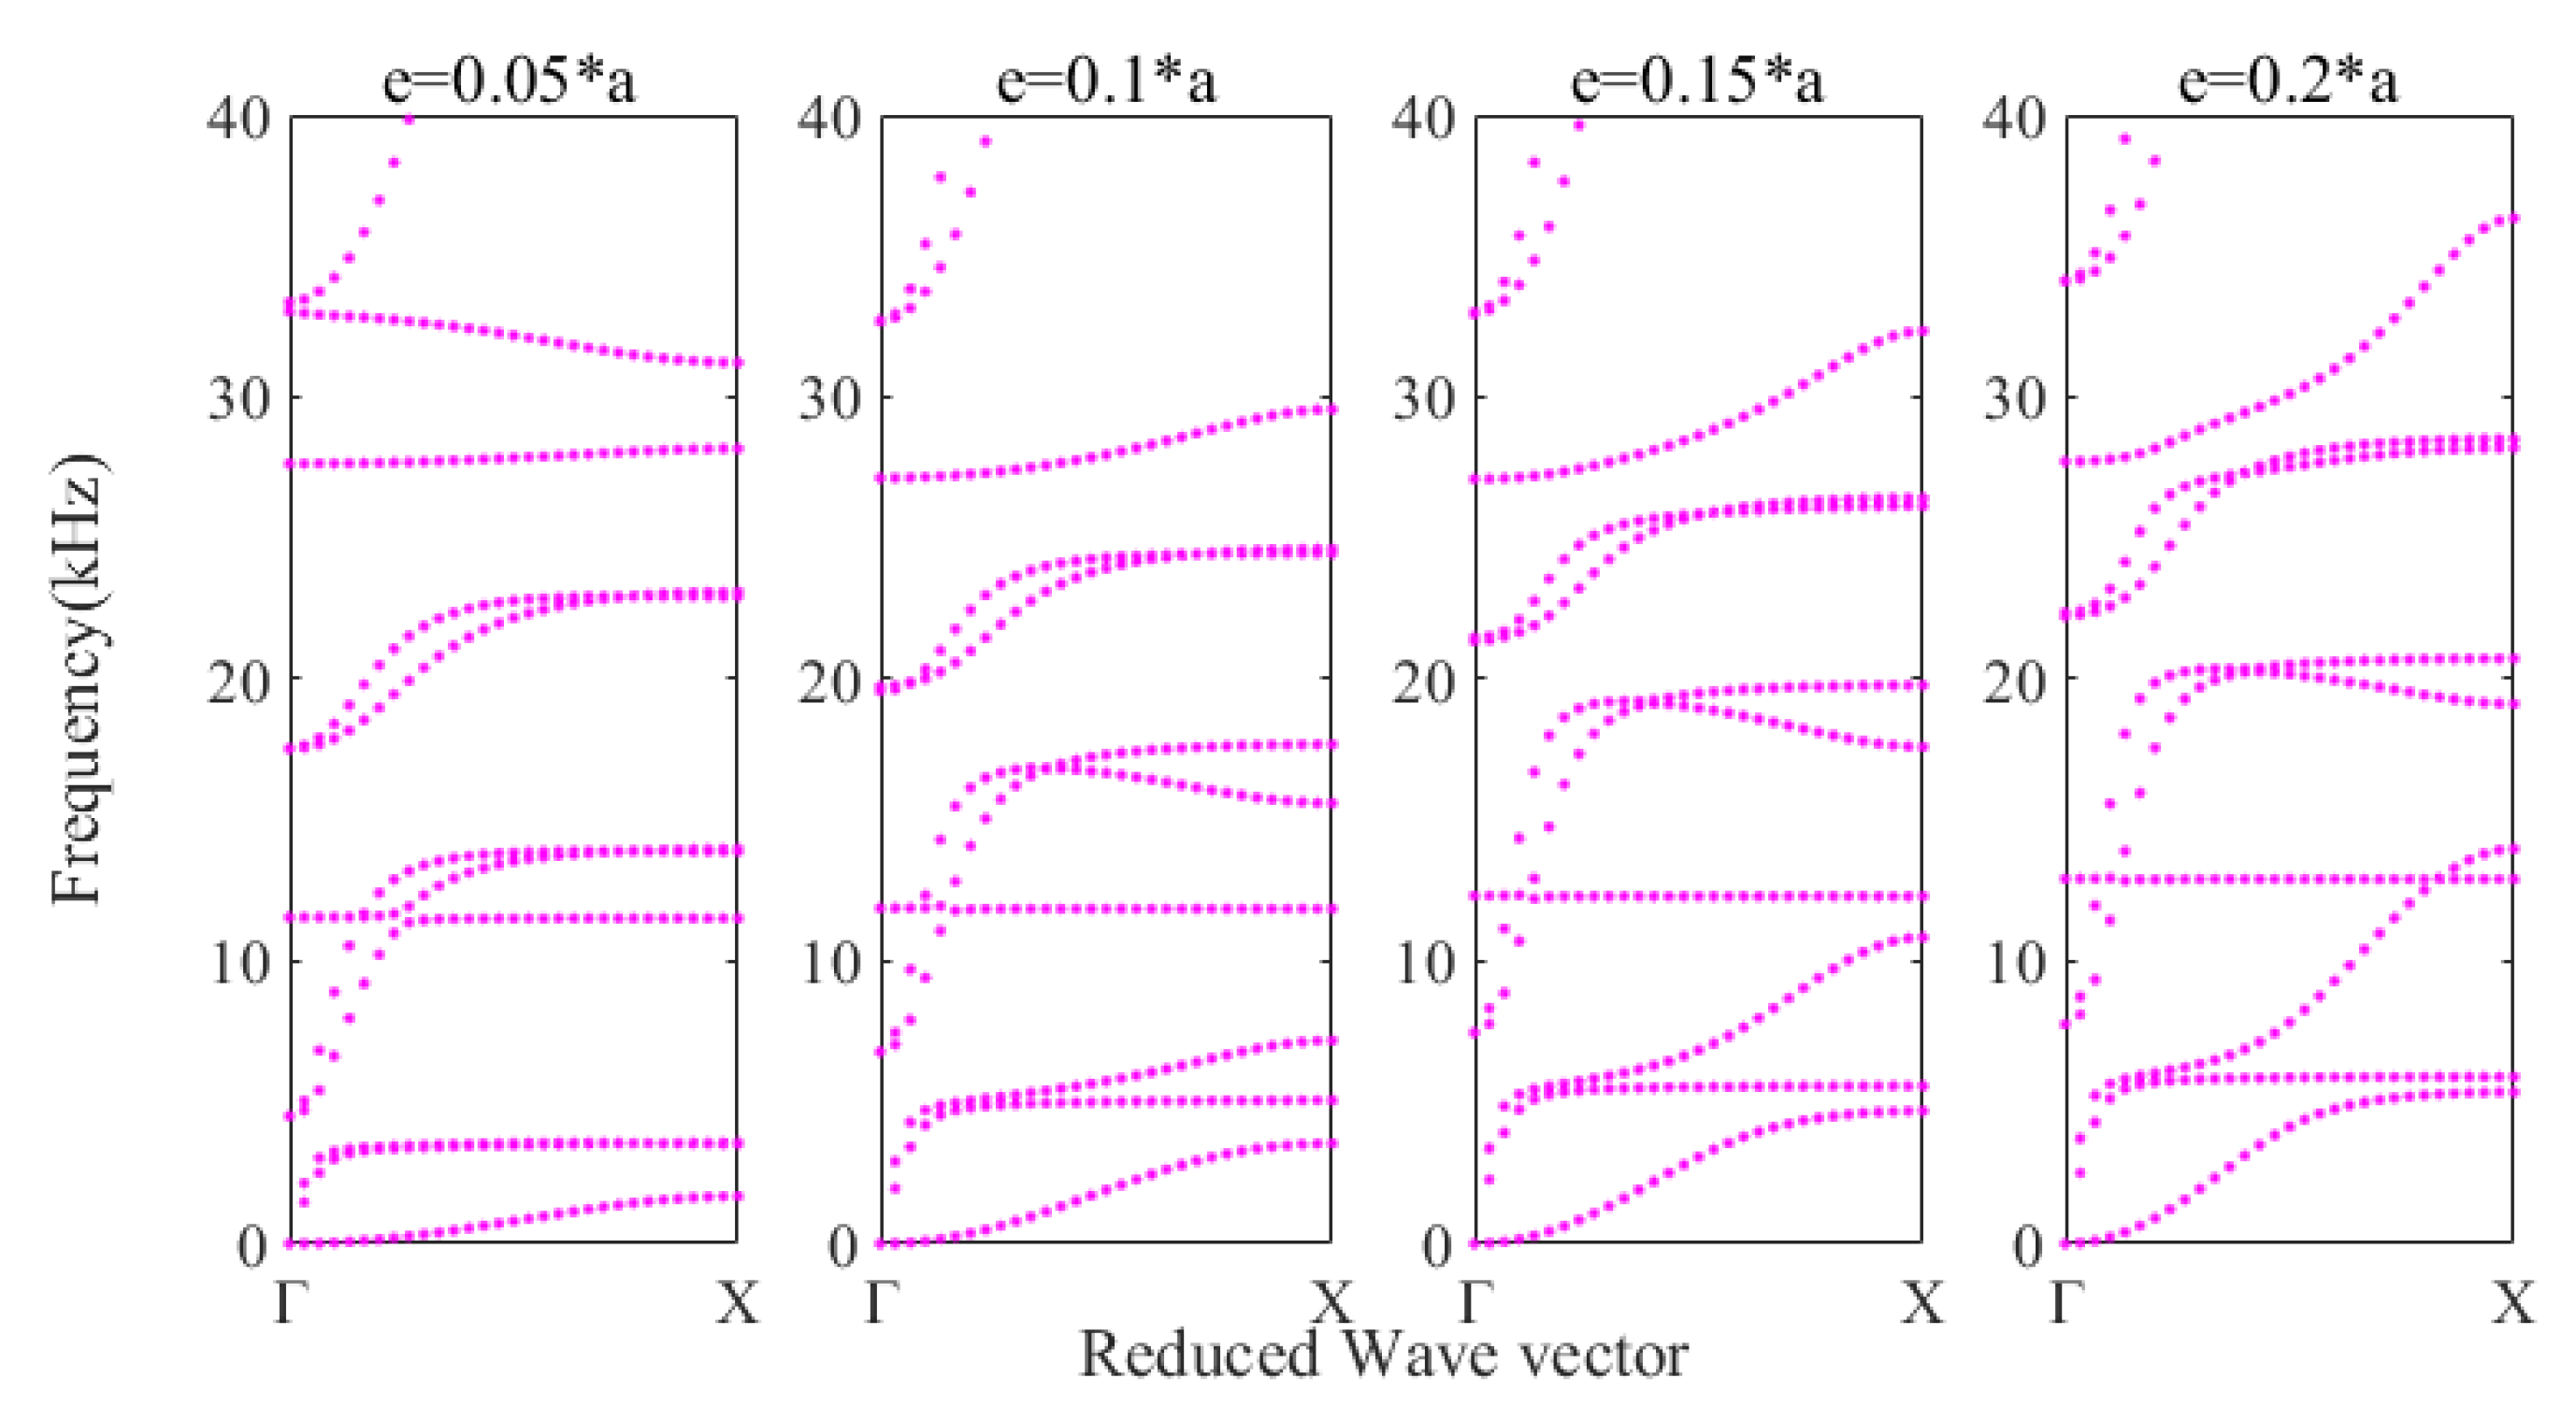
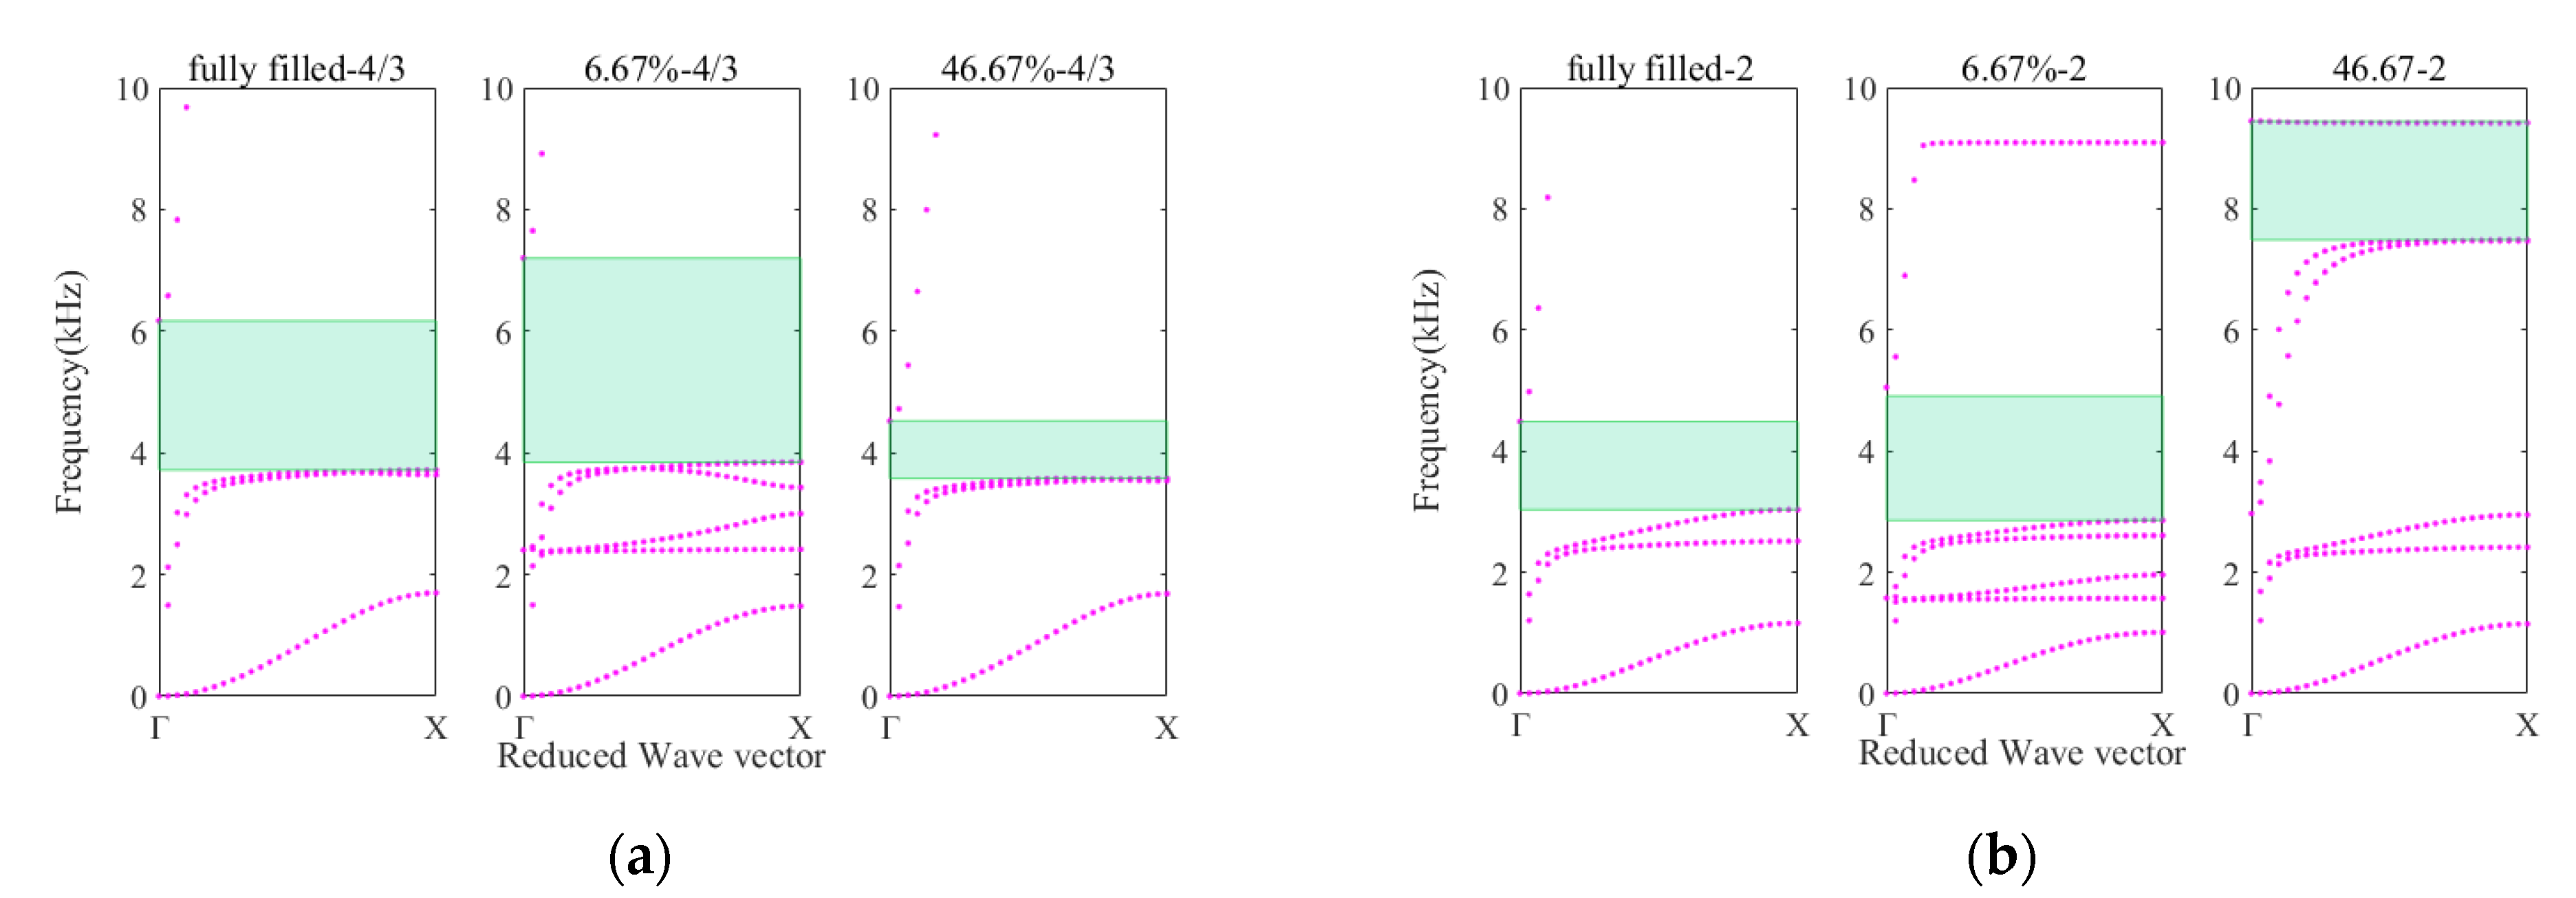
  • The effects of other structural parameters on the dispersion curves of the HPFC are discussed in three aspects: the radius of the central hole(ri), the thickness of the plate(e), and the ratio of the height of the stub(HR). When ri = 0.25a, the new dispersion branch is flatter than ri = 0.145a (the original model). The effect of plate thickness on flatness of dispersion curve and width of the band gap is small. Compared with HR = 4/3 (the original model), the stub height ratio HR = 1 produces a straight branch at the locally resonant frequency band gap and the band gap width is larger; it is interesting that there are similar two distinguished zones I and II. The reason is still not clear and need further study.
  • The structural parameters that affect the width of the low frequency band gap and the intermediate frequency value of the band gap are discussed. When HR = 4/3, FR = 6.67%, ΔT = 3.3540, T = 5.5230 kHz. When HR = 2, FR = 6.67%, ΔT = 1.4570, T = 3.7615 kHz. With the same filling ratio, the height ratios show a negative relationship with both the width and the geometric median value of the band gaps.
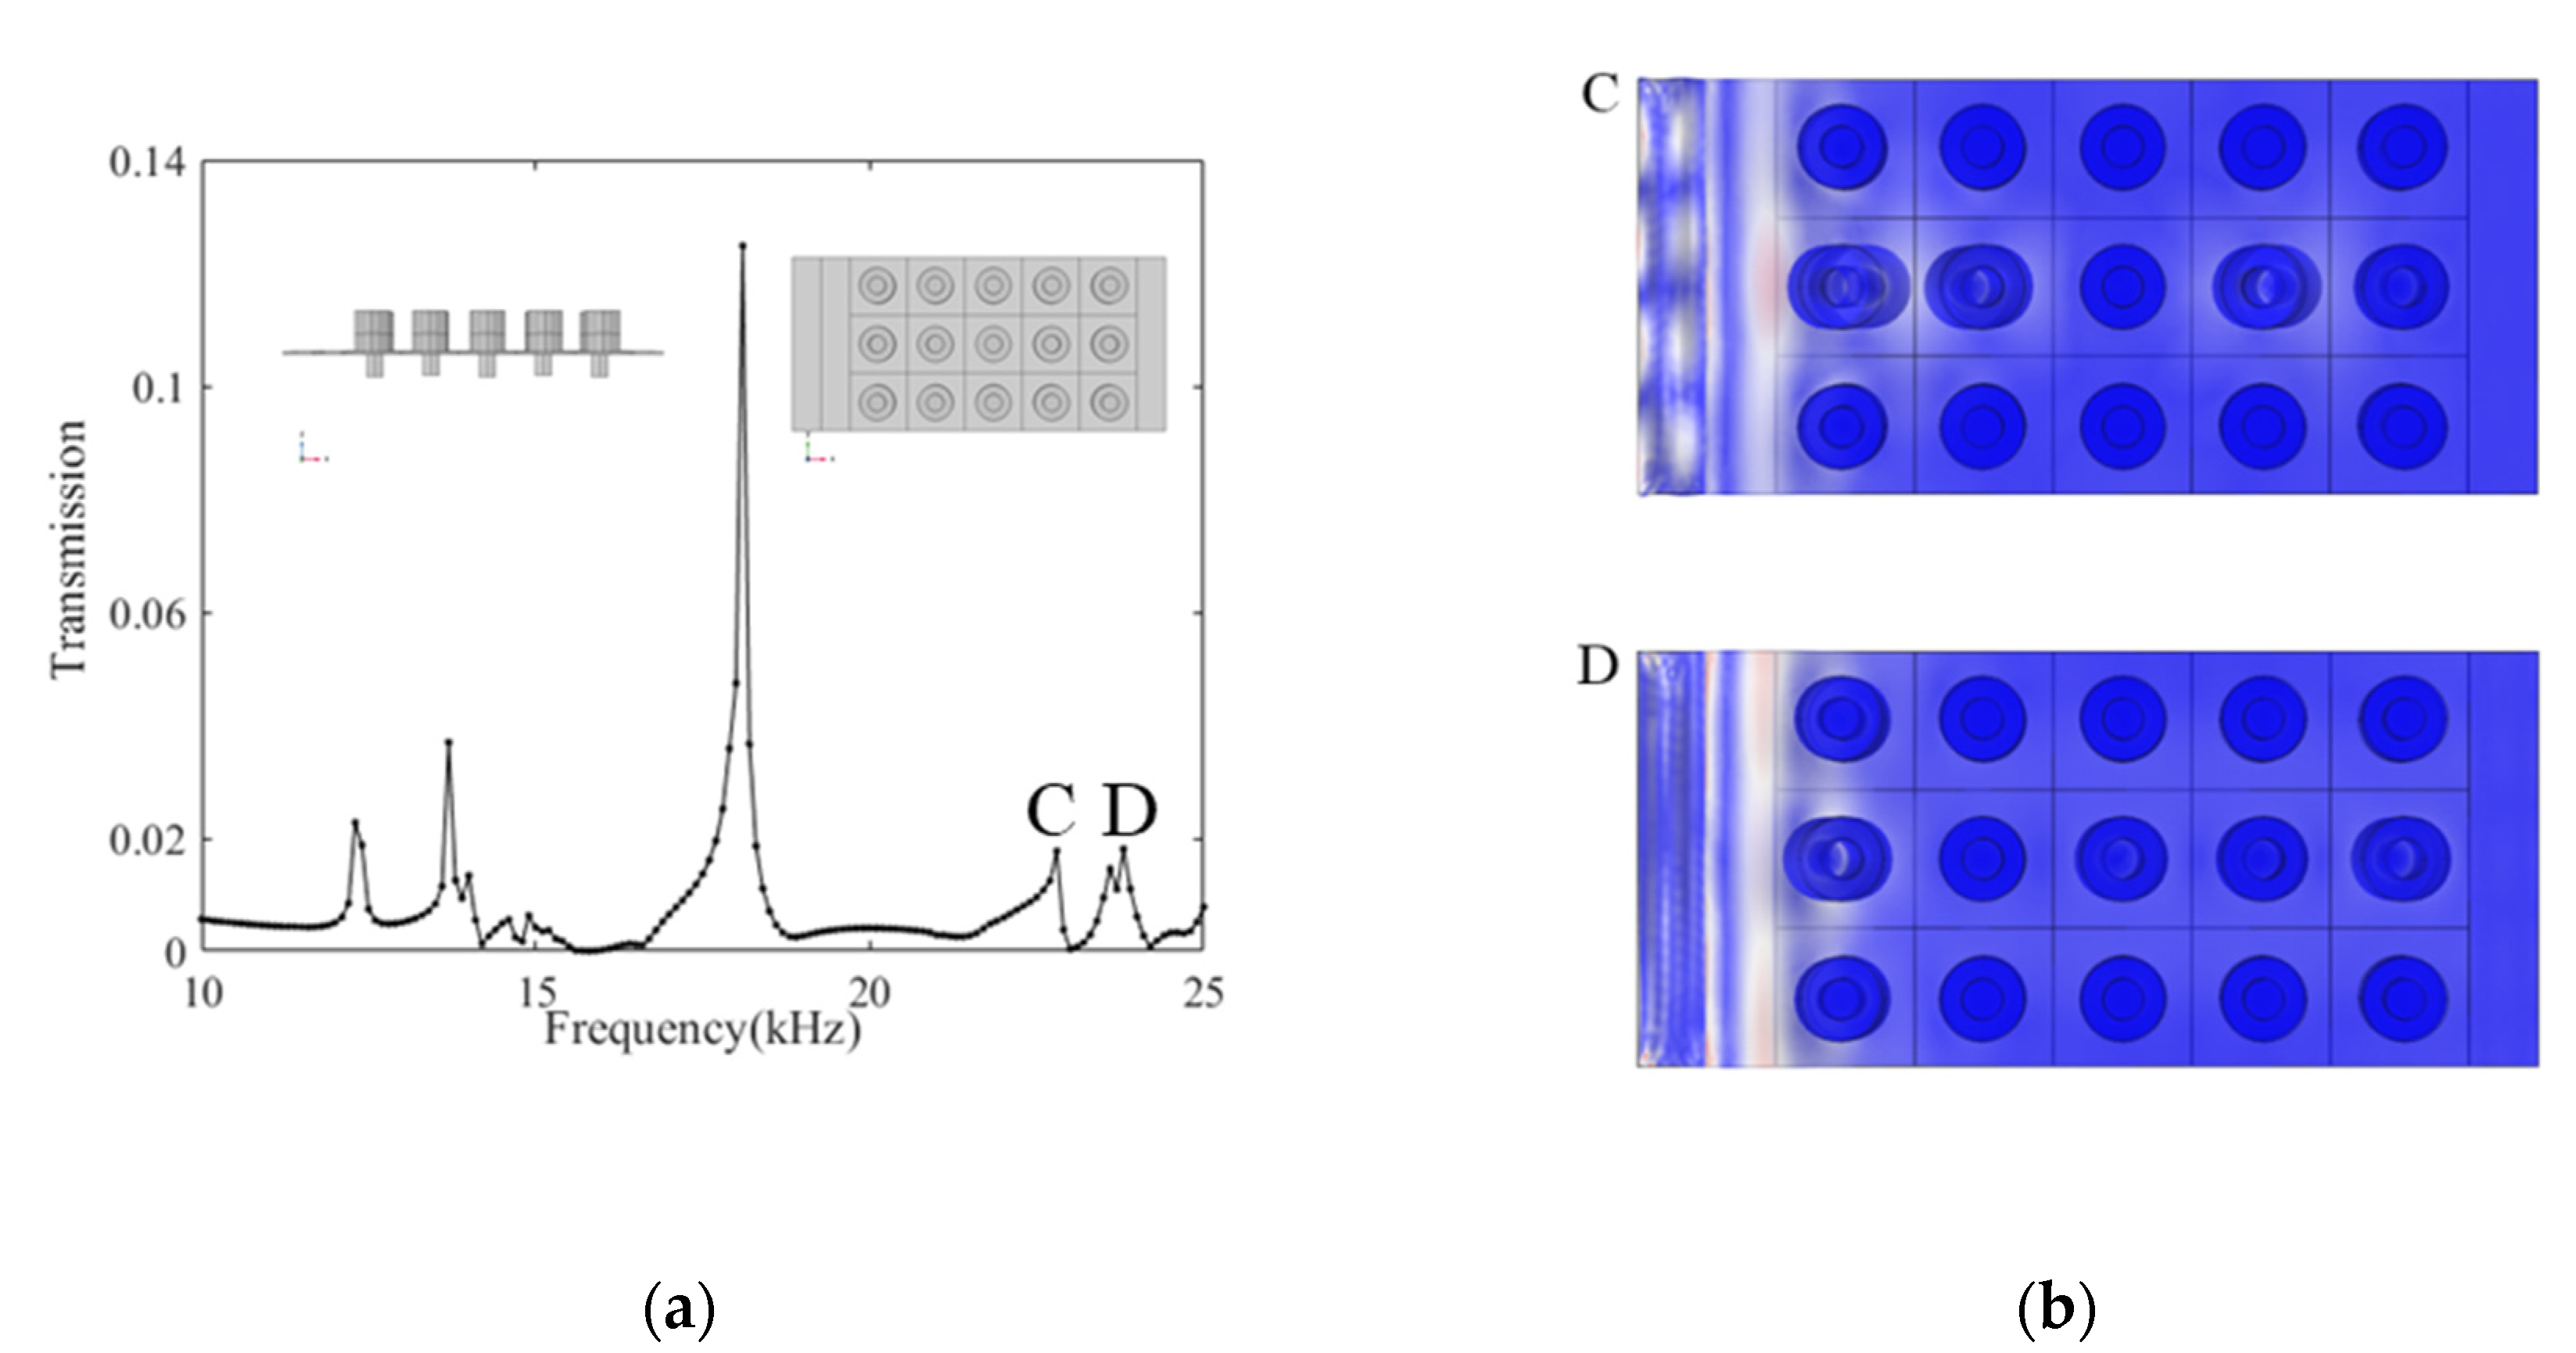
  • The created three array show different transmission feature for sounds. If we design a control mechanism and actuator properly, we could realize the real time and patterns switchable solution for vehicle noises. This makes the on-vehicle noise control system more flexible for variable driving conditions.

Supplementary Materials

The following are available online at https://www.mdpi.com/article/10.3390/cryst11070828/s1, Figure S1: Dispersion curve and the value of band gap with different FR values, Figure S2: The structure diagram for changing the filling ratio with modular thinking and implement the structure with STM32F103 chip. (a) The picture of the whole structure. (b) The structure of Push board.

Author Contributions

For this research, methodology, J.L.; resources, S.Z. and J.L.; writing—original draft, S.Z.; writing—review and editing, S.Z., J.L., H.Z. and S.W. All authors have read and agreed to the published version of the manuscript.

Funding

This research work is supported by the National Natural Science Foundation of China (NSFC) under grant No. 51575288. The authors gratefully acknowledge the supporting agency.

Institutional Review Board Statement

Not applicable.

Informed Consent Statement

Not applicable.

Data Availability Statement

Data included in the article or Supplementary Materials. The initial data in this study can be found in [1,2,3,4,5,6,7,8,9,10,11,12,13,14,15,16,17,18,19,20,21,22,23].

Conflicts of Interest

The authors declare no conflict of interest.

References

  1. Hussein, M.I.; Leamy, M.J.; Ruzzene, M. Dynamics of Phononic Materials and Structures: Historical Origins, Recent Progress, and Future Outlook. Appl. Mech. Rev. 2014, 66, 040802. [Google Scholar] [CrossRef]
  2. Sigalas, M.; Economou, E.N. Band structure of elastic waves in two dimensional systems. Solid State Commun. 1993, 86, 141–143. [Google Scholar] [CrossRef]
  3. Yan, P.; Jerome, V.; Bahram, D.R. Two-dimensional phononic crystals: Examples and applications. Surf. Sci. Rep. 2010, 65, 229–291. [Google Scholar]
  4. Zhang, H.B.; Liu, B.L.; Zhang, X.L.; Wu, Q.Q.; Wang, X.G. Zone folding induced tunable topological interface states in one-dimensional phononic crystal plates. Phys. Lett. A 2019, 383, 2797–2801. [Google Scholar] [CrossRef]
  5. Oudich, M.; Li, Y.; Assouar, B.M. A sonic band gap based on the locally resonant phononic plates with stubs. New J. Phys. 2010, 12, 083049. [Google Scholar] [CrossRef]
  6. Jin, Y.; Femez, N.; Pennec, Y.; Bonello, B.; Moiseyenko, R.P.; Hemon, S.; Pan, Y.D.; Djafari-Rouhani, B. Tunable waveguide and cavity in a phononic crystal plate by controlling whispering-gallery modes in hollow pillars. Phys. Rev. B 2016, 93, 054109. [Google Scholar] [CrossRef] [Green Version]
  7. Assouar, M.B.; Oudich, M. Enlargement of a locally resonant sonic band gap by using double-sides stubbed phononic plates. Appl. Phys. Lett. 2012, 100, 123506–123509. [Google Scholar]
  8. Khelif, A.; Choujaa, A.; Benchabane, S.; Djafari-Rouhani, B. Guiding and bending of acoustic waves in highly confined phononic crystal waveguides. Appl. Phys. Lett. 2004, 84, 4400–4402. [Google Scholar] [CrossRef]
  9. Wu, T.T.; Sun, J.H. Propagation of acoustic waves in phononic-crystal plates and waveguides using a finite-difference time-domain method. Phys. Rev. B 2007, 76, 104304. [Google Scholar]
  10. Jin, Y.; Pennec, Y.; Pan, Y.D.; Djafari-Rouhani, B. Phononic Crystal Plate with Hollow Pillars Actively Controlled by Fluid Filling. Crystals 2016, 6, 64. [Google Scholar] [CrossRef] [Green Version]
  11. Babak, R.D.; Monhammad Kazem, M.F.; Fakhroddin, N. Acoustic add-drop filters based on phononic crystal ring resonators. Phys. Rev. B 2016, 93, 041304. [Google Scholar]
  12. Pennec, Y.; Djafari-Rouhani, B.; Vasseur, J.O.; Deymier, P.A. Tunable filtering and demultiplexing in phononic crystals with hollow cylinders. Phys. Rev. E 2004, 69, 046608. [Google Scholar] [CrossRef] [Green Version]
  13. Amoudache, S.; Yan, P.; Antoine, K.; Rachid, T. Simultaneous sensing of light and sound velocities of fluids in a two-dimensional phoXonic crystal with defects. J. Appl. Phys. 2014, 115, 283–291. [Google Scholar] [CrossRef]
  14. Jin, Y.; Torrent, D.; Pan, Y.D.; Djafari-Rouhani, B. Gradient Index Devices for the Full Control of Elastic Waves in Plates. Sci. Rep. 2016, 6, 24437. [Google Scholar] [CrossRef] [Green Version]
  15. Yang, S.X.; Page, J.H.; Liu, Z.Y.; Cowan, M.L.; Chan, C.T.; Sheng, P. Focusing of Sound in a 3D Phononic Crystal. Phys. Rev. Lett. 2004, 93, 024301. [Google Scholar] [CrossRef] [Green Version]
  16. Pennec, Y.; Rouhani, B.D.; Vasseur, J.O.; Akjouj, A.; Thabet, G.; Gillet, J.N.; Larabi, H. Phonon transport and waveguiding in a phononic crystal made up of cylindrical dots on a thin homogeneous plate. Phys. Rev. B 2009, 80, 144302. [Google Scholar] [CrossRef]
  17. Wu, T.T.; Tsai, T.T.; Huang, Z.G.; Wu, T.C. Evidence of complete band gap and resonances in a plate with periodic stubbed surface. Appl. Phys. Lett. 2008, 93, 11902. [Google Scholar] [CrossRef]
  18. Lv, H.; Li, S.; Huang, X.; Yu, Z. Band-Gap Properties of Finite Locally Resonant Beam Suspended Periodically with Two-Degree-of-Freedom Force Type Resonators. Crystals 2021, 11, 716. [Google Scholar] [CrossRef]
  19. Graczykowski, B.; Sledzinska, M.; Alzina, F.; Gomis-Bresco, J.; Reparaz, J.S.; Wagner, M.R.; Sotomayor Torres, C.M. Phonon dispersion in hypersonic two-dimensional phononic crystal membranes. Phys. Rev. B 2015, 91, 75414. [Google Scholar] [CrossRef] [Green Version]
  20. Liang, X.; Wang, T.; Jiang, X.; Liu, Z.; Ruan, Y.; Deng, Y. A Numerical Method for Flexural Vibration Band Gaps in A Phononic Crystal Beam with Locally Resonant Oscillators. Crystals 2019, 9, 293. [Google Scholar] [CrossRef] [Green Version]
  21. Hsu, J.C. Local resonances-induced low-frequency band gaps in two-dimensional phononic crystal slabs with periodic stepped resonators. J. Phys. D Appl. Phy. 2011, 44, 055401. [Google Scholar] [CrossRef]
  22. Khelif, A.; Mohammadi, S.; Eftekhar, A.A.; Adibi, A.; Aoubiza, B. Acoustic confinement and waveguiding with a line-defect structure in phononic crystal slabs. J. Appl. Phys. 2010, 108, 084515. [Google Scholar] [CrossRef]
  23. Oudich, M.; Senesi, M.; Assouar, M.B.; Ruzenne, M.; Sun, J.H.; Vincent, B.; Hou, Z.L.; Wu, T.T. Experimental evidence of locally resonant sonic band gap in two-dimensional phononic stubbed plates. Phys. Rev. B 2011, 84, 667–673. [Google Scholar] [CrossRef]
Figure 1. Diagram of the research idea.
Crystals 11 00828 g001
Figure 2. Geometric parameters of the HPFC. (a) A three-dimensional schematic diagram of the hollow cylindrical plate. There is a hollow pillar placed on the thin plate; (b) 3D schematic diagram of filling pillar; (c) the integral part of the assembly; (d) the first irreducible Brillouin zone of the square lattice.
Crystals 11 00828 g002
Figure 3. Dispersion curves of the double-pillar fillable structure along the boundary of the first irreducible Brillouin zone Г-х. (a) Dispersion curve when the FR = 100%; (b) dispersion curve when the FR = 70%; (c) dispersion curve when the FR = 46.67%; (d) dispersion curve when the FR = 6.67%.
Crystals 11 00828 g003aCrystals 11 00828 g003b
Figure 4. Displacement field distribution and dispersion branch with different FR. (a) The top view of the displacement field; (b) the main view of the displacement field; (c) The graph of the new dispersion branch X point with the different FR. The three-color dotted line represents the band gap width when the FR = 100%.
Crystals 11 00828 g004
Figure 5. The transmission spectrum under the array element. (a) Distribution of structural displacement field. The top view is the upper half and the front view is the lower half; (b) dispersion curve (left) and transmission spectrum (right) of anti-symmetric Lamb wave passing through hollow pillar PCs with FR = 46.67%.
Crystals 11 00828 g005
Figure 6. The influence of hollow radius on the dispersion curve of the HPFC.
Crystals 11 00828 g006
Figure 7. The influence of plate thickness e on the dispersion curve of the HPFC.
Crystals 11 00828 g007
Figure 8. The influence of pillar height ratio HR on the dispersion curve of the HPFC.
Crystals 11 00828 g008
Figure 9. Dispersion curve and the value of band gap with different FR values. (a) The upper and lower boundary differences of the first band gap. (b) The upper and lower boundary differences of the second band gap. (c) Band gap selection for the filling ratio above 40%. (d) Band gap selection for the filling ratio below 40.
Crystals 11 00828 g009aCrystals 11 00828 g009b
Figure 10. Low frequency band gaps with different parameter structures. (a) Low frequency band gap plots at different FR when HR = 4/3; (b) low frequency band gap plots at different FR when HR = 2.
Crystals 11 00828 g010
Figure 11. Schematic representation of a multichannel wavelength multiplexer. (a) The transmission spectrum of anti-symmetric Lamb waves when the FR in the waveguide FR(A) = 46.67% and FR(B) = 50%. (b) Displacement field distribution at two narrow-band frequencies A and B.
Crystals 11 00828 g011
Figure 12. Schematic representation of a single-channel wavelength multiplexer. (a) The transmission spectrum of anti-symmetric Lamb waves when the FR in the waveguide FR(C) = 46.67% and FR(D) = 50%; (b) displacement field distribution at two narrow-band frequencies C and D.
Crystals 11 00828 g012
Figure 13. The schematic representation of the compact wavelength cavity multiplexer. (a) The transmission spectrum of the anti-symmetric Lamb wave when FR(E) = 46.67% and FR(F) = 50% in the waveguide; (b) displacement field distribution at two narrowband frequencies, E, and F.
Crystals 11 00828 g013
Table 1. Physical properties of silicone rubber, lead, and aluminum [17,23].
ρ (kg/m3)E (GPa)μ
Silicone rubber13002.150.4998
Lead11,34410.730.46
Aluminum2702700.33
Table 2. The width and median frequency of the band gap.
Factor 1Factor 2ΔT (kHz)T (kHz)
HR = 4/3FR = 6.67%3.35405.5230
FR = 46.67%0.94804.0520
FR = 100%2.45304.9445
HR = 2FR = 6.67%2.04903.8835
FR = 46.67%1.96008.4660
FR = 100%1.45703.7615
Publisher’s Note: MDPI stays neutral with regard to jurisdictional claims in published maps and institutional affiliations.

