
Influence of LiCl and AgNO3 Doping on the Electrical Conductivity of PVA Flexible Electrolyte Polymer Film


Abstract
:1. Introduction

| Sample | σ(S/cm) | Fabrication Method | T (°C) | Refs. |
|---|---|---|---|---|
| PVA-sodium salicylate (50 wt.%) | ~5 × 10⁻⁶ | casting technique | R.T | [13] |
| PVA-H3PO4 (70 wt.%) | 1.67 × 10⁻³ | casting technique | R.T | [14] |
| (PVA)1−x(MgBr2)x/2(H3PO4)x/2 at x = 0.40 wt.% | 1.64 × 10⁻⁴ | casting technique | 20 | [15] |
| PAN–sodium dodecylsulfate/PVA | 1.10 × l0−7 | casting technique | R.T | [16] |
| PVA/Chitosan-LiCF3SO3 (45 wt.%) | 1.2 × 10⁻⁴ | casting technique | R.T | [17] |
| PANI-PVA films with aniline content (0.2 mL) | 6.8 × 10 −5 | casting technique | R.T | [18] |
2. Experimental
2.1. Materials
2.2. Fabrication of Flexible Electrolyte Polymer Film
2.3. Experimental Techniques
3. Results and Discussion
4. Conclusions
Funding
Acknowledgments
Conflicts of Interest
References
- El-Shamy, A. Polyvinyl alcohol and silver decorated carbon quantum-dots for new nano-composites with application electromagnetic interface (EMI) shielding. Prog. Org. Coat. 2020, 146, 105747. [Google Scholar] [CrossRef]
- El-Shamy, A. Novel conducting PVA/Carbon quantum dots (CQDs) nanocomposite for high anti-electromagnetic wave performance. J. Alloy. Comp. 2019, 810, 151940. [Google Scholar] [CrossRef]
- El-Shamy, A. Synthesis of new magnesium peroxide (MgO2) nano-rods for pollutant dye removal and antibacterial applications. Mater. Chem. Phys. 2020, 243, 122640. [Google Scholar] [CrossRef]
- El-Shamy, A.; Zayied, H. New polyvinyl alcohol/carbon quantum dots (PVA/CQDs) nanocomposite films: Structural. optical and catalysis properties. Synth. Met. 2020, 259, 116218. [Google Scholar] [CrossRef]
- El-Shamy, A.; Attia, W.; Abd El-Kader, K. The optical and mechanical properties of PVA-Ag nanocomposite films. J. Alloy. Comp. 2014, 590, 309–312. [Google Scholar] [CrossRef]
- El-Shamy, A. Novel hybrid nanocomposite based on Poly(vinyl alcohol)/ carbon quantum dots/fullerene (PVA/CQDs/C60) for thermoelectric power applications. Compos. Part B 2019, 174, 106993. [Google Scholar] [CrossRef]
- El-Shamy, A.; Maati, A.; Attia, W.; Abd El-Kader, K. Promising method for preparation the PVA/Ag nanocomposite and Ag nano-rods. J. Alloy. Comp. 2018, 744, 701. [Google Scholar] [CrossRef]
- El-Shamy, A. Composite (PVA/Cu nano) films: Two yield points, embedding mechanism and thermal properties. Prog. Org. Coat. 2019, 127, 252–259. [Google Scholar] [CrossRef]
- El-Shamy, A. New free-standing and flexible PVA/Carbon quantum dots (CQDs) nanocomposite films with promising power factor and thermoelectric power applications. Mater. Sci. Semicond. Proc. 2019, 100, 245–254. [Google Scholar] [CrossRef]
- El-Shamy, A.; Attia, W.; Abd El-Kader, K. Enhancement of the conductivity and dielectric properties of PVA/Ag nanocomposite films using γ irradiation. Mater. Chem. Phys. 2017, 191, 225–229. [Google Scholar] [CrossRef]
- El-Shamy, A. An efficient removal of methylene blue dye by adsorption onto carbon dot @ zinc peroxide embedded poly vinyl alcohol (PVA/CZnO2) nano-composite: A novel Reusable adsorbent. Polymer 2020, 202, 122565. [Google Scholar] [CrossRef]
- Ahad, N.; Saion, E.; Gharibshahi, E. Structural, Thermal, and Electrical Properties of PVA-Sodium Salicylate Solid Composite Polymer Electrolyte. J. Nanomater. 2012, 2012, 8. [Google Scholar] [CrossRef] [Green Version]
- Saadu, L.; Hashim, M.A.; Baharuddin, M.B. A Noble Conductivity Studies and Characterizations of PVA-Orthophosphoric-Filter Paper Electrolytes. J. Mater. Sci. Res. 2014, 3, 4. [Google Scholar] [CrossRef]
- Khalil, R.; Sheha, E.; Hanafy, T.; Al-Hartomy, O. Synthesis and characterization of poly(vinyl alcohol)-acid salt polymer electrolytes. Mater. Exp. 2014, 4, 6. [Google Scholar] [CrossRef]
- Li, X.-G.; Huang, M.-R.; Zeng, J.-F.; Zhu, M.-F. The preparation of polyaniline waterborne latex nanoparticles and their films with anti-corrosivity and semi-conductivity. Colloids Surf. A Physicochem. Eng. Asp. 2004, 248, 111–120. [Google Scholar] [CrossRef]
- Razak, N.A.A.; Winie, T.; Ghani, F.S.A.; Ahmad, A.H. conductivity and ftir studies on pva/chitosan-LiCF3SO3. Sol. Stat. Sci. Technol. 2008, 16, 1–7. [Google Scholar]
- Honmute, S.; Ganachari, S.V.; Bhat, R.; Kumar, H.M.P.N.; Huh, D.S.; Venkataraman, A. Studies on Polyaniline-Polyvinyl Alcohol (PANI-PVA) Interpenetrating Polymer Network (IPN) Thin Films Sindhu. Int. J. Sci. Res. 2012, 1, 102–106. [Google Scholar]
- Khodiri, A.A.; Al-Ashry, M.Y.; El-Shamy, A.G. Novel hybrid nanocomposites based on polyvinyl alcohol/graphene/magnetite nanoparticles for high electromagnetic shielding performance. J. Alloy. Comp. 2020, 847, 156430. [Google Scholar] [CrossRef]
- El-Shamy, A.G. The optical anatomy of new polyvinyl alcohol/zinc peroxide (PVA/ZnO2) nanocomposite films for promising optical limiting applications. Prog. Org. Coat. 2021, 150, 105981. [Google Scholar] [CrossRef]
- Attallah, M.A.; Elrasasi, T.Y.; Shash, N.M.; El-Shaarawy, M.G.; El-Tantawy, F.; El-Shamy, A.G. New hybrid nanocomposite based on (PVA-Ag-Coumarin) for high sensitive photodiode device. Mater. Sci. Semicond. Proc. 2021, 126, 105653. [Google Scholar] [CrossRef]
- Zhang, L.Z.; Wang, Y.Y.; Wang, C.L.; Xiang, H. Synthesis and characterization of a PVA/LiCl blend membrane for air dehumidification. J. Membr. Sci. 2008, 308, 198–206. [Google Scholar] [CrossRef]
- Al Naim, A.F.; El-Shamy, A.G. A new reusable adsorbent of polyvinyl alcohol/magnesium peroxide (PVA/MgO2) for highly selective adsorption and dye removal. Mater. Chem. Phys. 2021, 270, 124820. [Google Scholar] [CrossRef]
- Al Naim, A.F.; Ibrahim, S.S.; El-Shamy, A.G. New High Mechanically Flexible and Bendable Nanocomposite Ag@NCDots/PEDOT:PSS/PVA Films with High Thermoelectric Power Performance and Generator. Polymer 2021, 226, 123792. [Google Scholar] [CrossRef]
- Al-Asbahi, B.A.; Qaid, S.M.H.; El-Shamy, A.G. Flexible conductive nanocomposite PEDOT:PSS/Te nanorod films for superior electromagnetic interference (EMI) shielding: A new exploration. J. Ind. Eng. Chem. 2021, 100, 233–247. [Google Scholar] [CrossRef]
- El-Shamy, A.G. The role of nitrogen-carbon dots (NC) nano-particles in enhancing thermoelectric power functions of PEDOT:PSS/Te nano-composite films. Chem. Eng. J. 2021, 417, 129212. [Google Scholar] [CrossRef]
- El-Shamy, A.G. New nano-composite based on carbon dots (CDots) decorated magnesium oxide (MgO) nano-particles (CDots@MgO) sensor for high H2S gas sensitivity performance. Sens. Actuators B Chem. 2021, 329, 129154. [Google Scholar] [CrossRef]
- El-Shamy, A.G. Acido-treatment of PEDOT:PSS/Carbon Dots (CDots) nano-composite films for high thermoelectric power factor performance and generator. Mater. Chem. Phys. 2021, 257, 123762. [Google Scholar] [CrossRef]
- El-Shamy, A.G. New carbon quantum dots nano-particles decorated zinc peroxide (Cdots/ ZnO2) nano-composite with superior photocatalytic efficiency for removal of different dyes under UV-A light. Synth. Met. 2020, 267, 116472. [Google Scholar] [CrossRef]
- Almond, D.; Duncan, G.; West, A. The determination of hopping rates and carrier concentrations in ionic conductors by a new analysis of ac conductivity. Solid State Ion. 1983, 8, 159–164. [Google Scholar] [CrossRef]
- Almond, D.; West, A. Impedance and modulus spectroscopy of “real” dispersive conductors. Solid State Ion. 1983, 11, 57–64. [Google Scholar] [CrossRef]
- Pavani, Y.; Ravi, M.; Bhavani, S.; Karthikeya, R.; Rao, V.N. Physical investigations on pure and KBr doped poly (vinyl alcohol)(PVA) polymer electrolyte films for solid state battery applications. J. Mater. Sci. Mater. Electron. 2018, 29, 5518–5524. [Google Scholar] [CrossRef]
- Chodankar, N.R.; Dubal, D.P.; Lokhande, A.C.; Lokhande, C.D. Ionically conducting PVA–LiClO4 gel electrolyte for high performance flexible solid state supercapacitors. J. Colloid Interface Sci. 2015, 460, 370–376. [Google Scholar] [CrossRef] [PubMed]
- Sankaran, S.; Deshmukh, K.; Ahamed, M.B.; Pasha, S.; Sadasivuni, K.K.; Ponnamma, D.; AlMaadeed, M.A.-A.; Chidambaram, K. Investigation on the Electrical Properties of Lithium Ion Conducting Polymer Electrolyte Films Based on Biodegradable Polymer Blends. Adv. Sci. Lett. 2018, 24, 5496–5502. [Google Scholar] [CrossRef]
- Unnisa, C.N.; Chitra, S.; Selvasekarapandian, S.; Monisha, S.; Devi, G.N.; Moniha, V.; Hema, M. Development of poly (glycerol suberate) polyester (PGS)–PVA blend polymer electrolytes with NH 4 SCN and its application. Ionics 2018, 24, 1979–1993. [Google Scholar] [CrossRef]
- Siekierski, M.; Wieczorek, W. Application of the “universal power law” to the studies of ac conductivity of polymeric electrolytes. Solid State Ion. 1993, 60, 67–71. [Google Scholar] [CrossRef]
- Almond, D.; West, A. The activation entropy for transport in ionic conductors. Solid State Ion. 1987, 23, 27–35. [Google Scholar] [CrossRef]
- Miara, L.J.; Suzuki, N.; Richards, W.D.; Wang, Y.; Kim, J.C.; Ceder, G. Li-ion conductivity in Li 9 S 3 N. J. Mater. Chem. A 2015, 3, 20338–20344. [Google Scholar] [CrossRef]
- Adams, S.; Rao, R.P. Structural requirements for fast lithium ion migration in Li 10 GeP 2 S 12. J. Mater. Chem. 2012, 22, 7687–7691. [Google Scholar] [CrossRef]


| T (°C) | A | σdc (S/cm) | n | |
|---|---|---|---|---|
| PVA | 40 | 1.86 × 10⁻¹² | 3.11 × 10⁻⁸ | 0.815 |
| 50 | 1.80 × 10⁻¹² | 2.31 × 10⁻⁸ | 0.838 | |
| 60 | 1.85 × 10⁻¹² | 5.26 × 10⁻⁸ | 0.853 | |
| 70 | 1.44 × 10⁻¹² | 1.34 × 10⁻⁷ | 0.880 | |
| 80 | 1.39 × 10⁻¹² | 3.66 × 10⁻⁷ | 0.888 | |
| 90 | 1.37 × 10⁻¹² | 8.17 × 10⁻⁷ | 0.891 | |
| 100 | 1.24 × 10⁻¹² | 1.61 × 10⁻⁶ | 0.895 | |
| 110 | 1.27 × 10⁻¹² | 1.71 × 10⁻⁶ | 0.897 | |
| PVA/AgNO3 | 40 | 1.41 × 10⁻⁹ | 0.20 × 10⁻⁴ | 0.573 |
| 50 | 1.54 × 10⁻⁹ | 0.52 × 10⁻⁴ | 0.583 | |
| 60 | 1.71 × 10⁻⁹ | 1.06 × 10⁻⁴ | 0.586 | |
| 70 | 4.32 × 10⁻⁹ | 1.84 × 10⁻⁴ | 0.540 | |
| 80 | 1.10 × 10⁻⁷ | 3.19 × 10⁻⁴ | 0.370 | |
| 90 | 3.60 × 10⁻⁷ | 5.63 × 10⁻⁴ | 0.310 | |
| 100 | 3.75 × 10⁻⁶ | 9.65 × 10⁻⁴ | 0.192 | |
| 110 | 4.35 × 10⁻⁵ | 13.7 × 10⁻⁴ | 0.087 | |
| PVA/LiCl | 40 | 1.07 × 10⁻¹⁰ | 3.60 × 10⁻⁷ | 0.706 |
| 50 | 2.12 × 10⁻¹⁰ | 1.06 × 10⁻⁷ | 0.678 | |
| 60 | 2.18 × 10⁻¹⁰ | 2.20 × 10⁻⁶ | 0.683 | |
| 70 | 8.53 × 10⁻¹¹ | 3.71 × 10⁻⁶ | 0.746 | |
| 80 | 4.28 × 10⁻¹¹ | 4.13 × 10⁻⁶ | 0.784 | |
| 90 | 3.05 × 10⁻¹¹ | 7.81 × 10⁻⁶ | 0.786 | |
| 100 | 1.58 × 10⁻¹¹ | 1.34 × 10⁻⁵ | 0.800 | |
| 110 | 1.98 × 10⁻¹¹ | 1.63 × 10⁻⁵ | 0.814 |
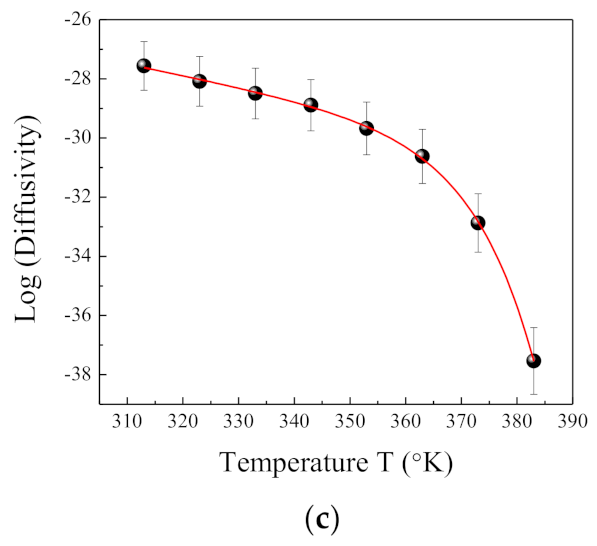
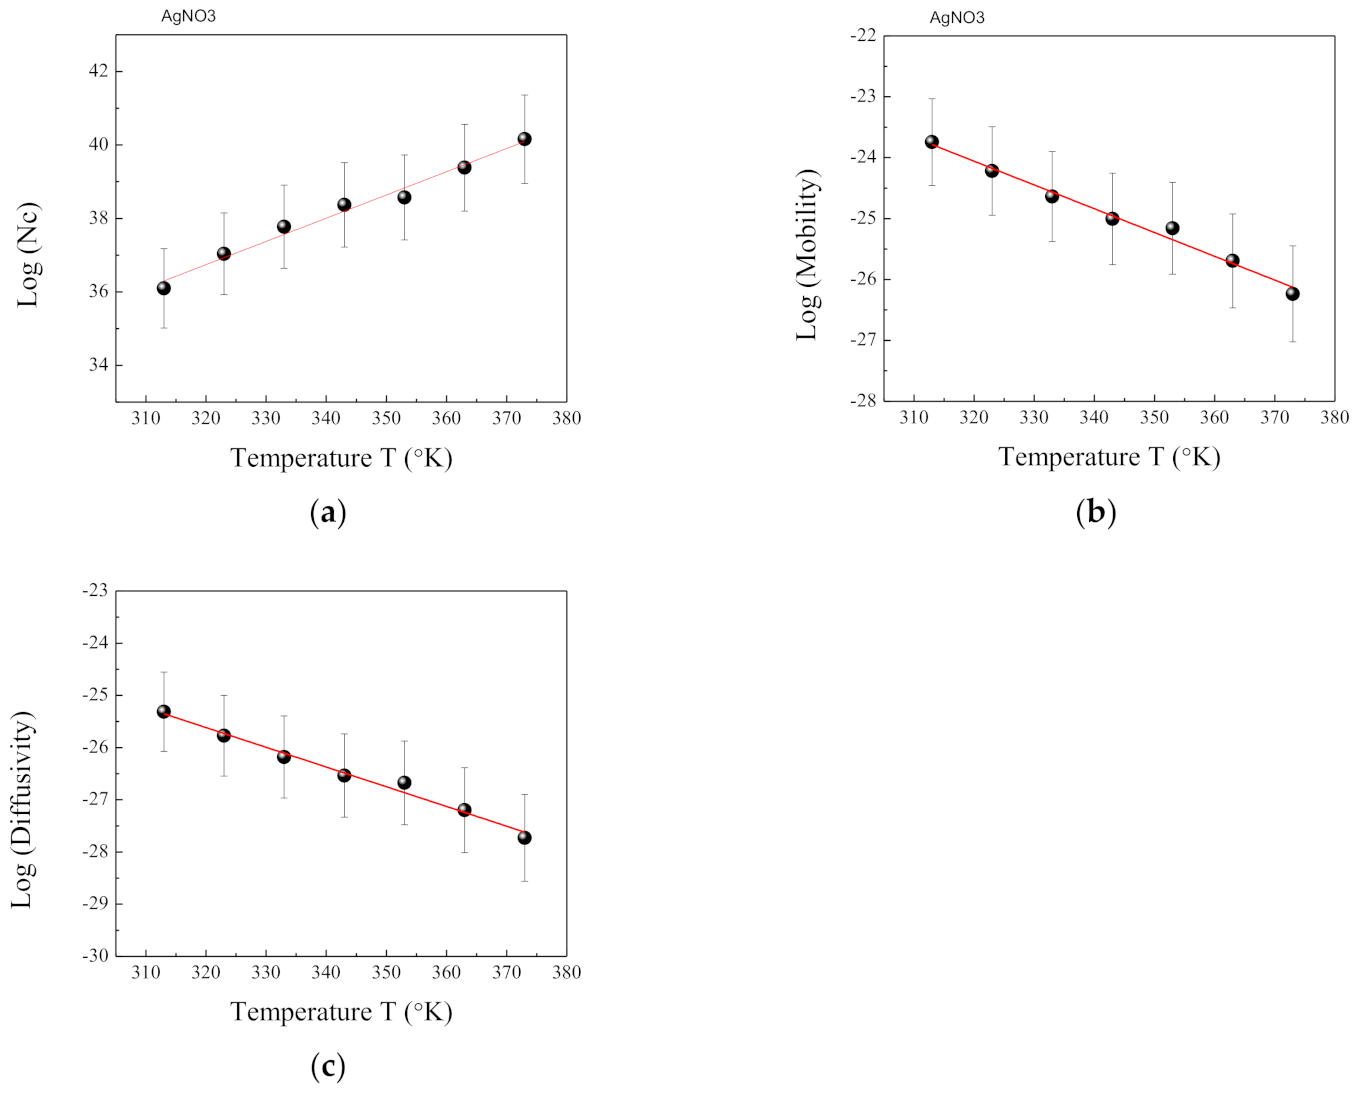
| Sample | T (°C) | ni (ions/m3) | µi (m2/V.s) | Di (m2/s) |
|---|---|---|---|---|
| PVA/LiCl | 40 | 1.23 × 1040 | 1.01 × 10⁻²⁶ | 2.74 × 10⁻²⁸ |
| 50 | 1.10 × 1041 | 2.95 × 10⁻²⁷ | 8.23 × 10⁻²⁹ | |
| 60 | 5.95 × 1041 | 1.11 × 10⁻²⁷ | 3.20 × 10⁻²⁹ | |
| 70 | 2.64 × 1042 | 4.35 × 10⁻²⁸ | 1.29 × 10⁻²⁹ | |
| 80 | 2.87 × 1043 | 6.94 × 10⁻²⁹ | 2.11 × 10⁻³⁰ | |
| 90 | 4.61 × 1044 | 7.64 × 10⁻³⁰ | 2.39 × 10⁻³¹ | |
| 100 | 1.45 × 1047 | 4.17 × 10⁻³² | 1.34 × 10⁻³³ | |
| 110 | 9.77 × 1051 | 8.76 × 10−37 | 2.90 × 10−38 | |
| PVA/AgNO3 | 40 | 1.25 × 1036 | 1.80 × 10⁻²⁴ | 4.87 × 10⁻²⁶ |
| 50 | 1.09 × 1037 | 6.05 × 10⁻²⁵ | 1.69 × 10⁻²⁶ | |
| 60 | 5.97 × 1037 | 2.30 × 10⁻²⁵ | 6.61 × 10⁻²⁷ | |
| 70 | 2.35 × 1038 | 9.86 × 10⁻²⁶ | 2.92 × 10⁻²⁷ | |
| 80 | 3.72 × 1038 | 6.94 × 10⁻²⁶ | 2.11 × 10⁻²⁷ | |
| 90 | 2.41 × 1039 | 2.02 × 10⁻²⁶ | 6.34 × 10⁻²⁸ | |
| 100 | 1.44 × 1040 | 5.81 × 10⁻²⁷ | 1.87 × 10⁻²⁸ | |
| 110 | 1.29 × 1040 | 7.88 × 10⁻²⁷ | 2.60 × 10⁻²⁸ |
Publisher’s Note: MDPI stays neutral with regard to jurisdictional claims in published maps and institutional affiliations. |
© 2021 by the author. Licensee MDPI, Basel, Switzerland. This article is an open access article distributed under the terms and conditions of the Creative Commons Attribution (CC BY) license (https://creativecommons.org/licenses/by/4.0/).
Share and Cite
Al Naim, A.F. Influence of LiCl and AgNO3 Doping on the Electrical Conductivity of PVA Flexible Electrolyte Polymer Film. Crystals 2021, 11, 822. https://doi.org/10.3390/cryst11070822
Al Naim AF. Influence of LiCl and AgNO3 Doping on the Electrical Conductivity of PVA Flexible Electrolyte Polymer Film. Crystals. 2021; 11(7):822. https://doi.org/10.3390/cryst11070822
Chicago/Turabian StyleAl Naim, Abdullah F. 2021. "Influence of LiCl and AgNO3 Doping on the Electrical Conductivity of PVA Flexible Electrolyte Polymer Film" Crystals 11, no. 7: 822. https://doi.org/10.3390/cryst11070822
APA StyleAl Naim, A. F. (2021). Influence of LiCl and AgNO3 Doping on the Electrical Conductivity of PVA Flexible Electrolyte Polymer Film. Crystals, 11(7), 822. https://doi.org/10.3390/cryst11070822