Article

Comparison of Phase Characteristics and Residual Stresses in Ti-6Al-4V Alloy Manufactured by Laser Powder Bed Fusion (L-PBF) and Electron Beam Powder Bed Fusion (EB-PBF) Techniques

1
Rigaku Americas Corporation, 9009 New Trails Drive, The Woodlands, TX 77381, USA
2
Division of Materials and Manufacturing Science, Graduate School of Engineering, Osaka University, 2-1, Yamadaoka, Osaka 565-0871, Japan
3
Department of Mechanical Engineering, Kobe University, 1-1 Rokkodai-cho, Kobe 657-8501, Japan
*
Authors to whom correspondence should be addressed.
Crystals 2021, 11(7), 796; https://doi.org/10.3390/cryst11070796
Submission received: 16 June 2021 / Revised: 1 July 2021 / Accepted: 4 July 2021 / Published: 8 July 2021

Abstract

:
Ti-6Al-4V alloy fabricated by laser powder bed fusion (L-PBF) and electron beam powder bed fusion (EB-PBF) techniques have been studied for applications ranging from medicine to aviation. The fabrication technique is often selected based on the part size and fabrication speed, while less attention is paid to the differences in the physicochemical properties. Especially, the relationship between the evolution of α, α’, and β phases in as-grown parts and the fabrication techniques is unclear. This work systematically and quantitatively investigates how L-PBF and EB-PBF and their process parameters affect the phase evolution of Ti-6Al-4V and residual stresses in the final parts. This is the first report demonstrating the correlations among measured parameters, indicating the lattice strain reduces, and c/a increases, shifting from an α’ to α+β or α structure as the crystallite size of the α or α’ phase increases. The experimental results combined with heat-transfer simulation indicate the cooling rate near the β transus temperature dictates the resulting phase characteristics, whereas the residual stress depends on the cooling rate immediately below the solidification temperature. This study provides new insights into the previously unknown differences in the α, α’, and β phase evolution between L-PBF and EB-PBF and their process parameters.

1. Introduction

Titanium alloys are widely studied as important materials with various applications in medicine and aviation owing to their low density, high yield strength, and excellent corrosion resistance [1]. Ti-6Al-4V is one of the most commonly used titanium alloys [1,2,3]. However, Ti-6Al-4V poses many challenges in production, including high cost, poor thermal conductivity, the tendency to strain hardening, and high chemical reactivity to oxygen. The additive manufacturing (AM) technique has the potential to overcome these challenges owing to its ability to produce near-net-shape structures [1].
Among the AM techniques, powder bed fusion (PBF) is suitable for fabricating small parts with complicated shapes, and their applications have been widely studied [4,5]. PBF techniques use either a laser or electron beam as the heat source, which scans and fuses thin layers of powder, pass-by-pass, and layer upon layer, to build a solid part according to a computer-aided design file. These techniques are called laser powder bed fusion (L-PBF) or electron beam powder bed fusion (EB-PBF), depending on the heat source. Both are among the few AM techniques established for industrial applications of metal AM [6,7]. L-PBF is suitable for small parts with complex details, while EB-PBF is more suited for larger parts owing to its higher scanning speed [8].
Ti-6Al-4V is an α/α’+β alloy. The α phase is the primary phase, and it has a hexagonal close-packed (hcp) structure. The α’ phase has the same hcp structure but contains a higher level of dislocations because it forms through a martensitic transformation from the body-centered cubic β phase by rapid cooling. Due to its higher level of dislocations, the α’ phase often shows broader X-ray diffraction (XRD) peaks [9]. The α and α’ phases also have slightly different lattice parameters because the α’ phase is saturated with β-stabilizing alloying elements. Sofinowski et al. [10] reported that the α’ phase has a smaller c/a value than that of the α phase. The mechanical properties of AM-made parts depend heavily on the quantity and morphology of the α, α’, and β phases [11,12,13]. To control and achieve the desired phase structure, we need to understand how each AM technique and its process parameters affect phase evolution. Although many comparisons of L-PBF and EB-PBF have been reported [14,15,16], to the best of the authors’ knowledge, there has been no in-depth and quantitative comparison of the crystalline phase structures. In this study, we used high-precision X-ray diffraction (HP-XRD) and the fundamental parameter (FP) method [17] to systematically and quantitatively investigate the α or α’+β crystalline phase structures of Ti-6Al-4V parts fabricated using L-PBF and EB-PBF under various process conditions.

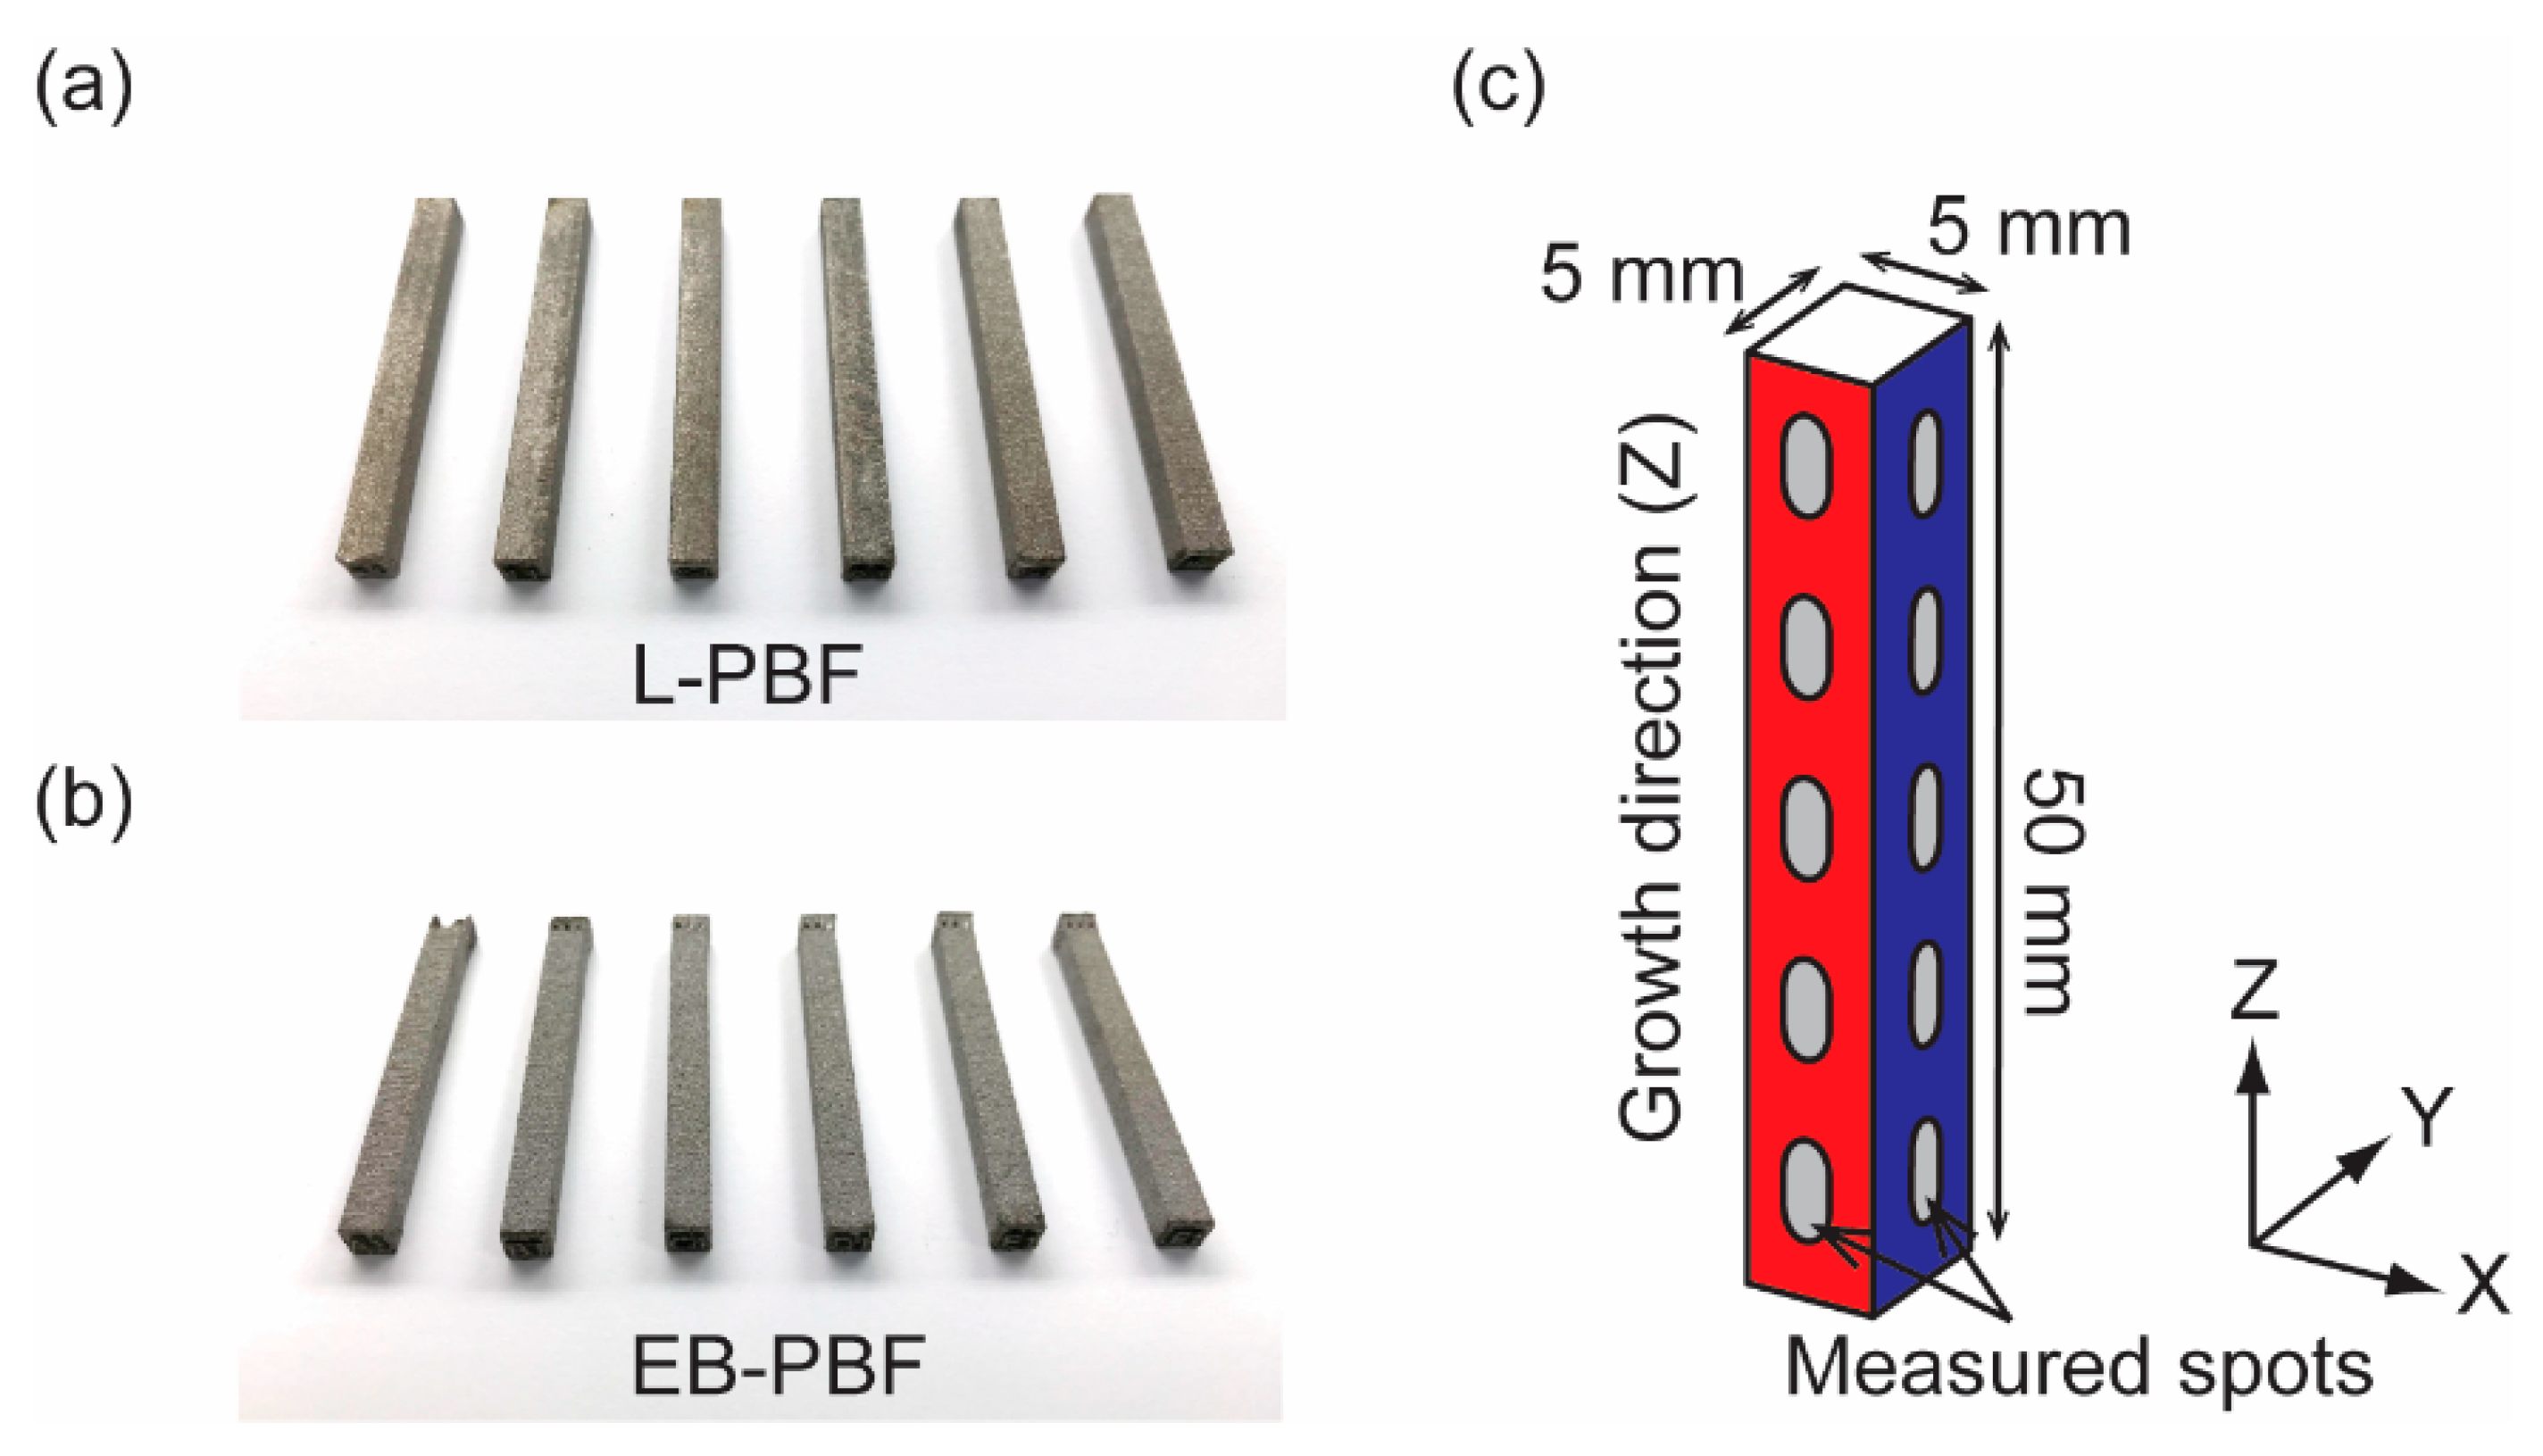
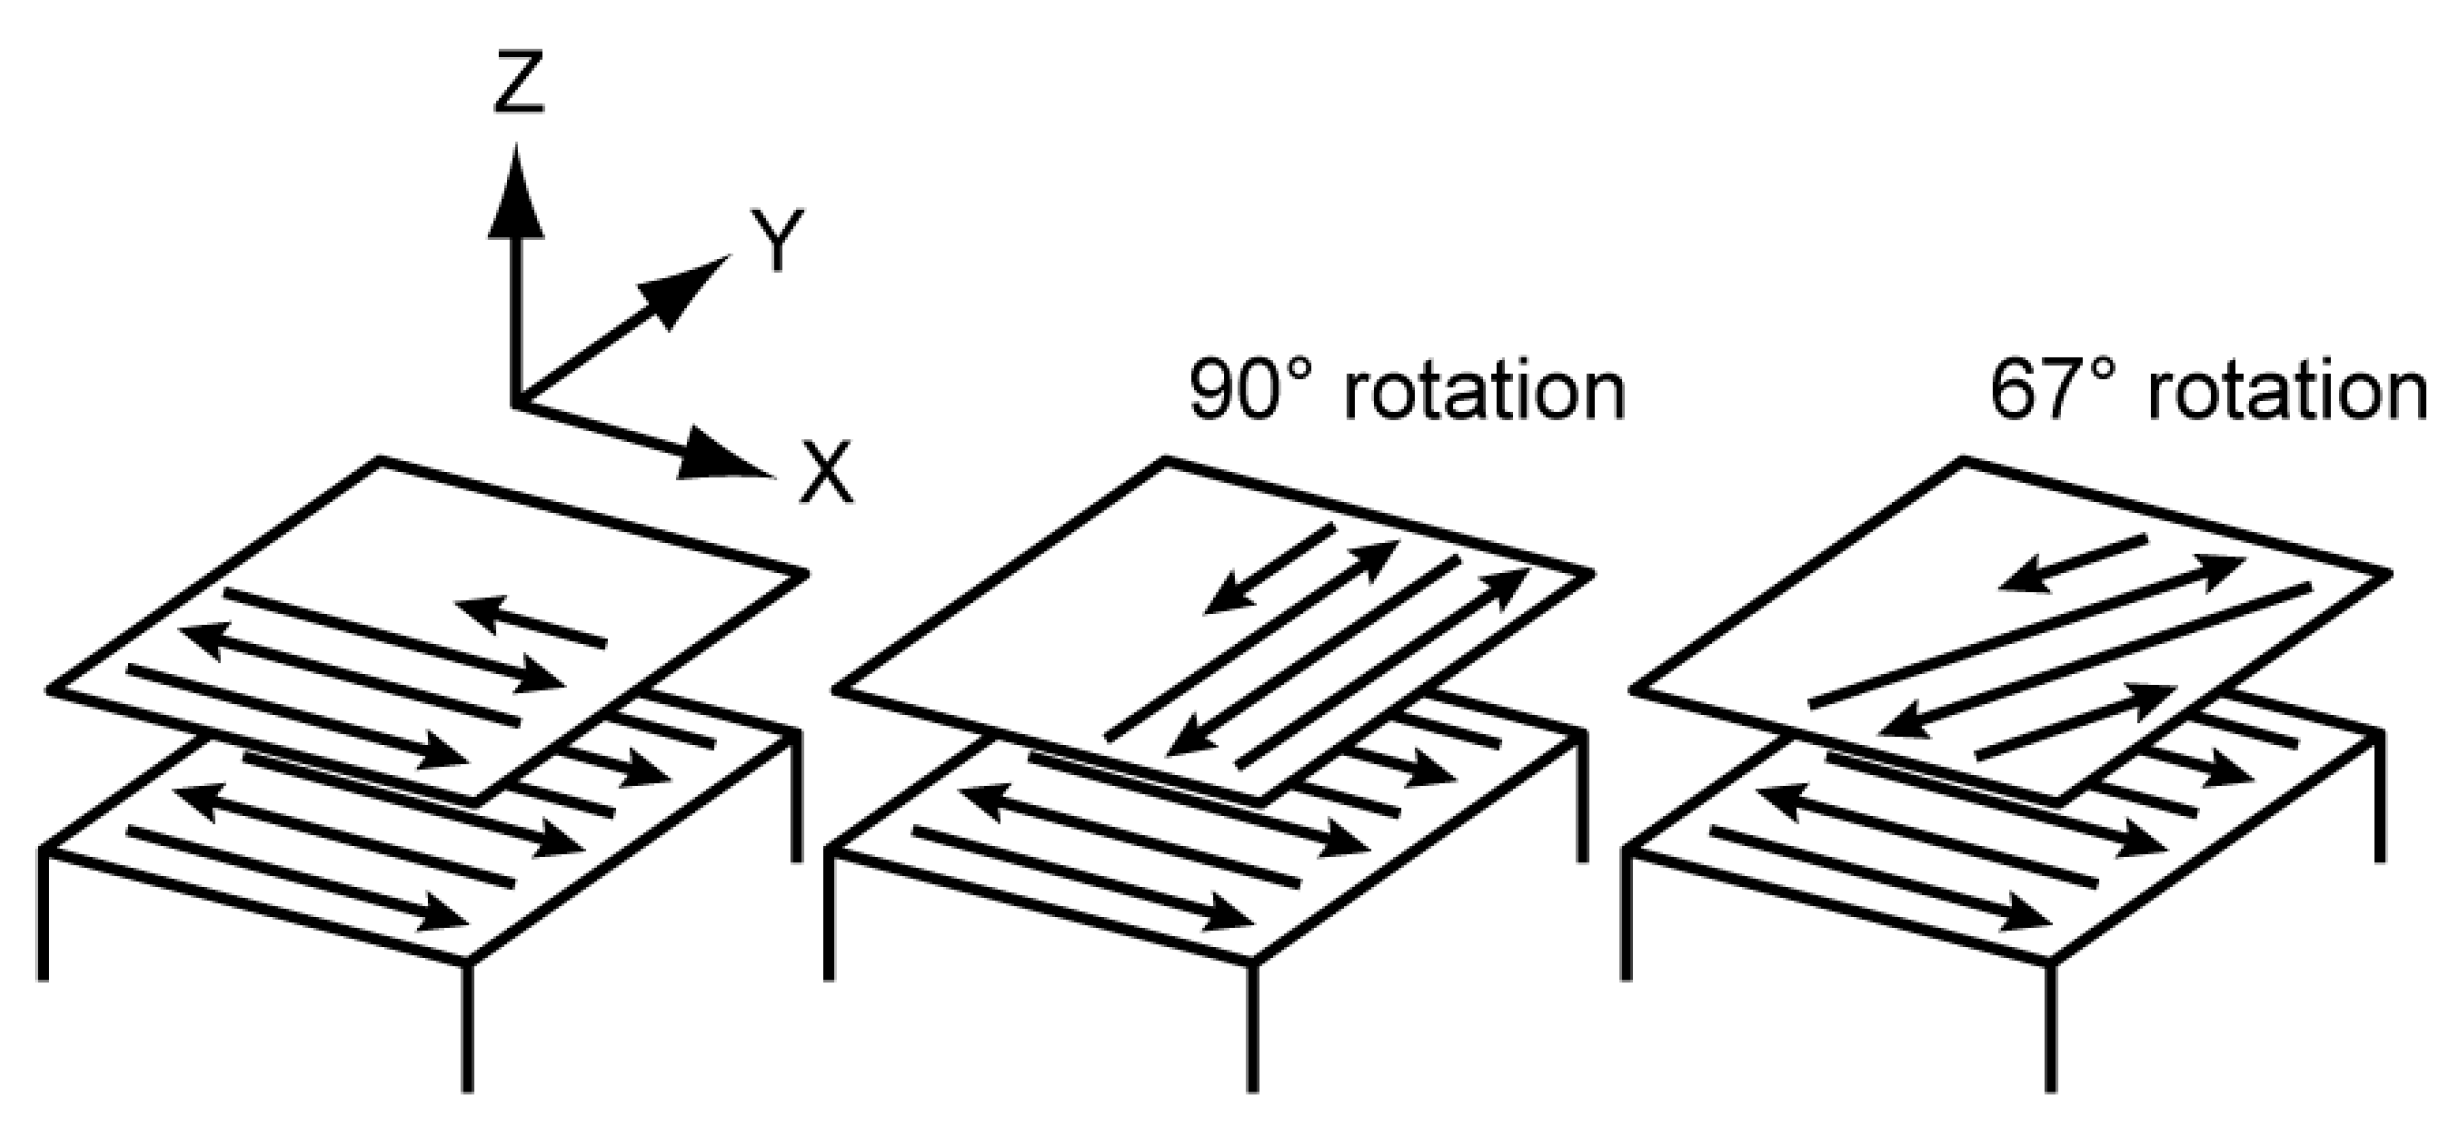
2. Materials and Methods

L-PBF powder (EOS, Krailling, Germany) and EB-PBF powder (Arcam, Mölnlycke, Sweden) were spherical, and D50 was 41.2 µm and 82.3 µm, respectively. Specimens with dimensions of 5 mm (width) × 5 mm (depth) × 50 mm (height) were fabricated. Figure 1a,b show the appearance of the built specimens. Three types of scan strategies were compared, as shown in Figure 2 [18,19]. For L-PBF, we used the EOS M 290 (EOS, Krailling, Germany) equipped with a Yb fiber laser and compared two settings of beam power and scanning speed: 360 W at 1200 mm/s and 75 W at 250 mm/s. The scan pitch and layer thickness were 0.1 mm and 0.06 mm, respectively. For EB-PBF, we used Arcam Q10 (Arcam, Mölnlycke, Sweden). The powder bed was preheated to 520 °C, and two conditions of beam current and scan speed, 15 mA at 5000 mm/s and 12.5 mA at 6000 mm/s, were compared. The scan pitch and layer thickness were 0.1 mm and 0.05 mm, respectively. Table 1 summarizes the specimen labels and process conditions. The microstructure was studied by field-emission scanning electron microscopy (FE–SEM, JIB–4610F, JEOL, Akishima, Japan).
The residual stress data and whole polycrystalline diffraction patterns were collected using a SmartLab diffractometer (Rigaku Corporation, Akishima, Japan) equipped with a Cu target 9 kW rotating anode X-ray generator, a horizontal goniometer, a Eulerian cradle, an XY mapping stage, and an Si strip detector. A parabolic multilayer mirror with 0.04° beam divergence on the incident side and a parallel slit analyzer with a 0.5° acceptance angle on the receiving side achieved a parallel beam geometry with Cu Kα radiation. The X-ray generator was operated at 45 kV and 200 mA, and the Si strip detector was used as the point detector. To map the change in the residual stress and crystal structure along the growth direction of the specimens, we shaped the incident X-ray beam to a 1 × 2 mm rectangle, which resulted in a beam footprint on the specimen surface of 1–3 mm width, depending on the X-ray incident angle, and 4 mm long in the growth direction. To maintain the analyzed volume between the residual stress and the crystal structure analysis, we used the same experimental setup to analyze the residual stresses, lattice parameters, crystallite size, random lattice strain of α or α’phase, and β phase quantities. A total of 240 locations (20 locations of the 12 parts listed in Table 1) were analyzed.
For the residual stress measurements, we aligned and tested the diffractometer according to the American Society for Testing and Materials (ASTM) E915-10 standards [20]. The residual stress measurement conditions were selected according to the Society of Automotive Engineers (SAE) International standards [21]. The sin2ψ iso-inclination method was used to measure the horizontal σX and σY components of the residual stresses on the XZ and YZ planes, respectively. The sin2ψ side-inclination method was used to measure the vertical σZ component of the residual stresses on the XZ and YZ planes. Figure 3 shows each residual stress component at the center of the z-axis as an example. A diffraction peak as close to 165° as possible and a sufficient number of ψ positions (seven or more) are recommended for an accurate determination of the residual stress [20]. We used the α or α’ phase (2 1 3) reflection at approximately 142.0° and 11 points of ψ from 0.0° to 45.0°. In this setting, the penetration depth of the Cu Kα radiation, defined as a point where only 1% of the incident beam can travel to, varied from 22 μm at ψ = 45° to 48 μm at ψ = 0°. A Young’s modulus of 114 GPa [22] and Poisson’s ratio of 0.34 were used for the residual stress calculation. The average deviation of the eleven ψ positions from the linear fit of the sin2ψ plot was used as the size of the error bar of each residual stress value because this value reflects the validity of the linear fit model as well as the accuracy of the measurement of diffraction angles [20].
The polycrystalline diffraction patterns were analyzed using the whole pattern fitting (WPF) method. A polycrystalline diffraction pattern can be calculated using the X-ray intensity Ical as a function of the scattering angle 2θ using the following equation:
I cal ( 2 θ ) = A ( 2 θ ) n S n h k l M n , h k l L n , h k l I n , h k l Φ n ( 2 θ 2 θ n ,   h k l T ( 2 θ ) ) + y b ( 2 θ ) ,
where A(2θ) is the absorption factor and Sn is the scale factor of the nth phase. The Mn,hkl, Ln,hkl, and In,hkl terms are the multiplicity factor, Lorentz polarization factor, and integrated diffraction intensity of the (h k l) reflection of the nth phase, respectively. The Φn term is the profile shape function of the nth phase, 2θn, hkl is the diffraction angle of the (h k l) reflection of the nth phase, calculated from the lattice parameters, T(2θ) is the systematic diffraction peak shift, and yb(2θ) is the background scattering. The systematic diffraction peak shift T(2θ) was corrected by measuring a standard reference lanthanum hexaboride powder, NIST SRM 660c (National Institute of Standard and Technology, Gaithersburg, MD, USA), with a known lattice parameter of 4.156826 ± 0.00008 Å at 22.5 °C, certified by the National Institute of Standards and Technology [23]. The WPF method is also called the Pawley method when In,hkl is not constrained by the crystal structure. This method increases the precision of the lattice parameter analysis by introducing constraints based on the crystal symmetry and profile shape function Φn, and systematic diffraction peak shift T(2θ) determined by the standard reference material [24]. By combining the parallel beam geometry, systematic peak shift correction, and WPF method, the HP-XRD method can analyze lattice parameters with a sensitivity of 0.02% or better [25,26].
The profile shape is related to the crystallite size and the random lattice strain of the corresponding phase. The crystallite size is defined as the size of a crystallite considered to be a single crystal that diffracts X-rays coherently. The random lattice strain is the distribution of the atomic plane distance, or d-spacing, around the average value caused by dislocations and other imperfections in the crystal structure. To analyze these parameters precisely, one needs to eliminate ambiguity and minimize the degrees of freedom in the profile shape analysis as much as possible. Meanwhile, the profile shape function Φn is conventionally approximated by purely mathematical functions, such as pseudo-Voight or Pearson-VII [27], leaving some degrees of freedom in the fitting process. In contrast, the fundamental parameter (FP) method significantly reduces the degrees of freedom by theoretically calculating the profile shape based on the X-ray geometry. As a result, this method can increase the precision and reliability of the crystallite size and random lattice strain analyses [17]. We used the FP method to calculate the profile shape function Φn in Equation (1) and refined the crystallite size and random lattice strain parameters in the a- and c-axis directions separately [28]. The random lattice strain was assumed to follow a Gaussian distribution.
We also used the WPF method to quantify the weight percentages of the α or α’ and β phases. The α and α’ phases were not distinguished. The WPF method can introduce constraints in diffraction peak intensities by theoretically calculating the integrated diffraction intensity, In,hkl in Equation (1), based on the atomic coordinates. This technique is called the Rietveld method. By introducing the diffraction peak intensity constraints, the scale factor, Sn in Equation (1), can be converted into the weight% of the nth phase in a mixture [29].
To understand the origin of the differences in the crystal structures observed on the L-PBF-made parts between different process parameters, we performed finite element analysis to simulate the heat transfer and temperature change during the L-PBF process. COMSOL Multiphysics® 5.5, (COMSOL Inc., Burlington, MA, USA) was used for the numerical simulation. The dimensions of the finite element model were 5 mm (width) × 5 mm (depth) × 2 mm (height). In the simulation, the laser scanned the entire 5 mm × 5 mm XY plane to calculate the temperature distribution at the center of both the XZ and YZ planes. The L-PBF-360W-Fast-X and L-PBF-75W-Slow-X scanning conditions shown in Table 1 were used in the simulation. Under these conditions, the laser made 25 round trips per 60 μm thick layer. As we assume that the heat flux from the laser beam satisfies the Gaussian distribution [30,31,32], the three-dimensional energy distribution can be expressed as a function of radius r and depth z:
Q 0 ( r , z ) = 2 α P π R 2 z 0 e x p ( 2 r 2 R 2   ) × ( 1 z z 0   )   ( 0 < z < z 0 )
where α is the heat absorptivity of the laser beam on the metal powder bed, P is the laser power, R is the radius of the beam set to 50 μm [33,34], and z0 is the penetration depth of the laser. In this calculation, the powder bed was not modeled, but α was set to 85% to consider the high heat absorptivity of the powder bed [30]. The z0 value was adjusted based on the melt-pool dimensions [35,36]. The temporal and spatial heat transfer is governed by the following equation [37,38]:
ρ C T t + · q = Q ,
where ρ is the material density, C is the specific heat capacity, T is the temperature, t is the time, q is the heat flux, and Q is the amount of heat generated per unit volume. The heat flux due to heat conduction is represented by the following equation, according to Fourier’s law:
q = k T ,
where k is thermal conductivity. The boundary conditions on the outer surface of the model are set using the following equation:
n · q = q 0 = h   ( T ext T ) ,
where n is the normal vector of the surface through which the heat flows, h is the heat transfer coefficient and was set to 10 W/m2·K, and Text is the external temperature at which the model contacts the environment. The thermal conductivity [39,40], specific heat capacity [41], and material density [42] were treated as functions of temperature.

3. Results

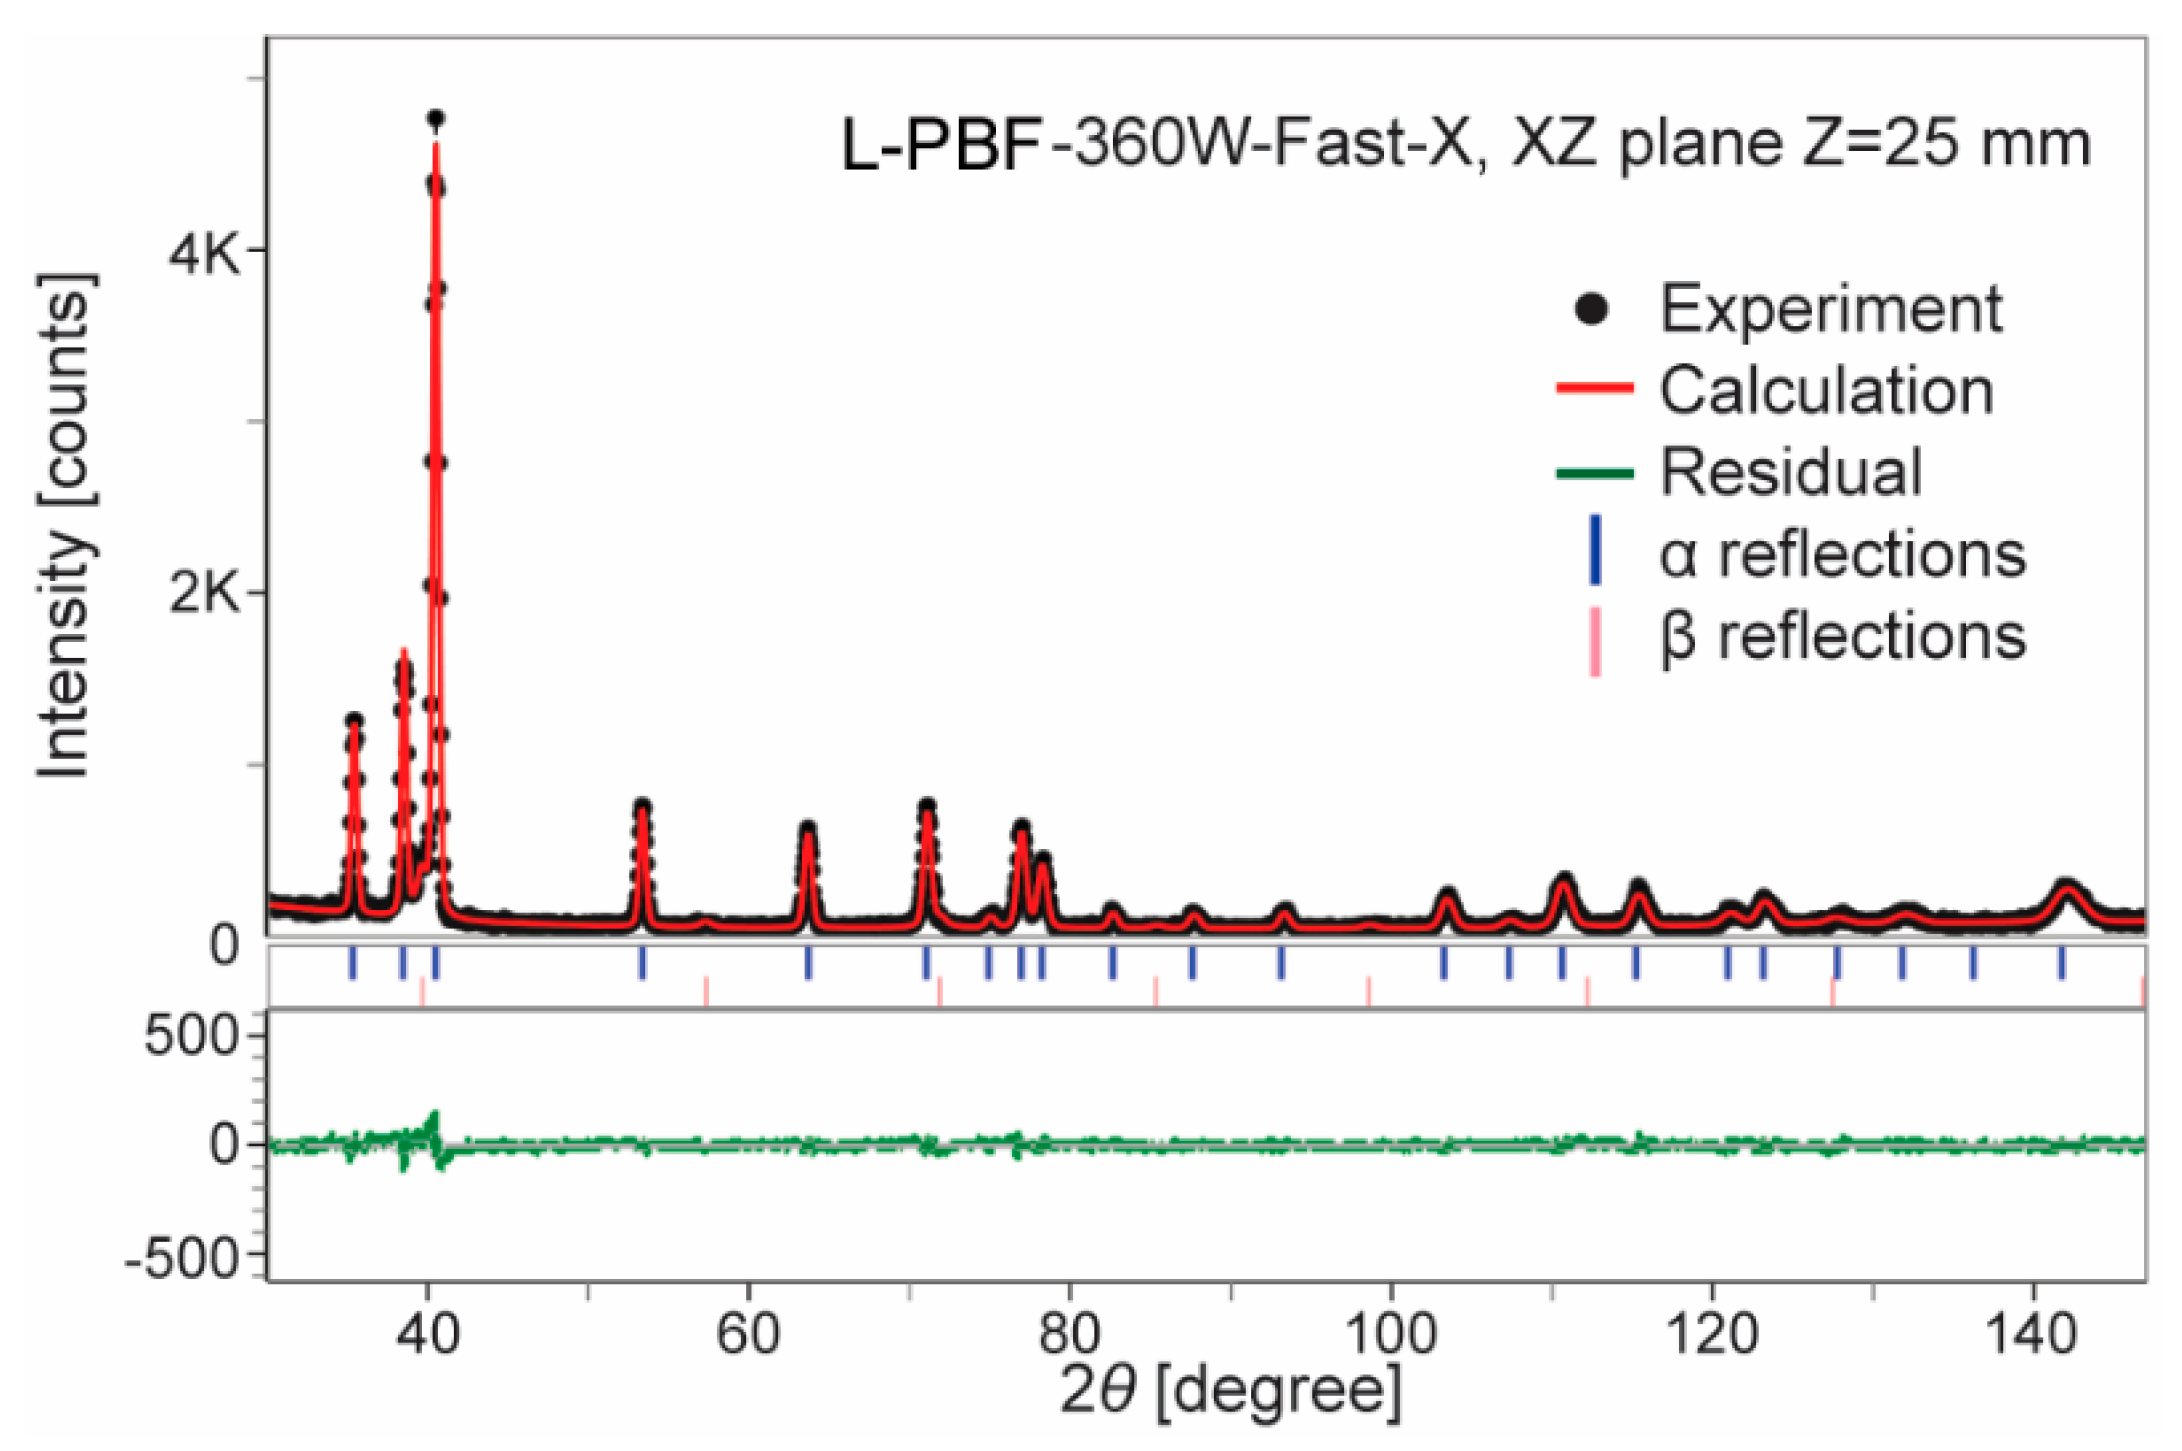
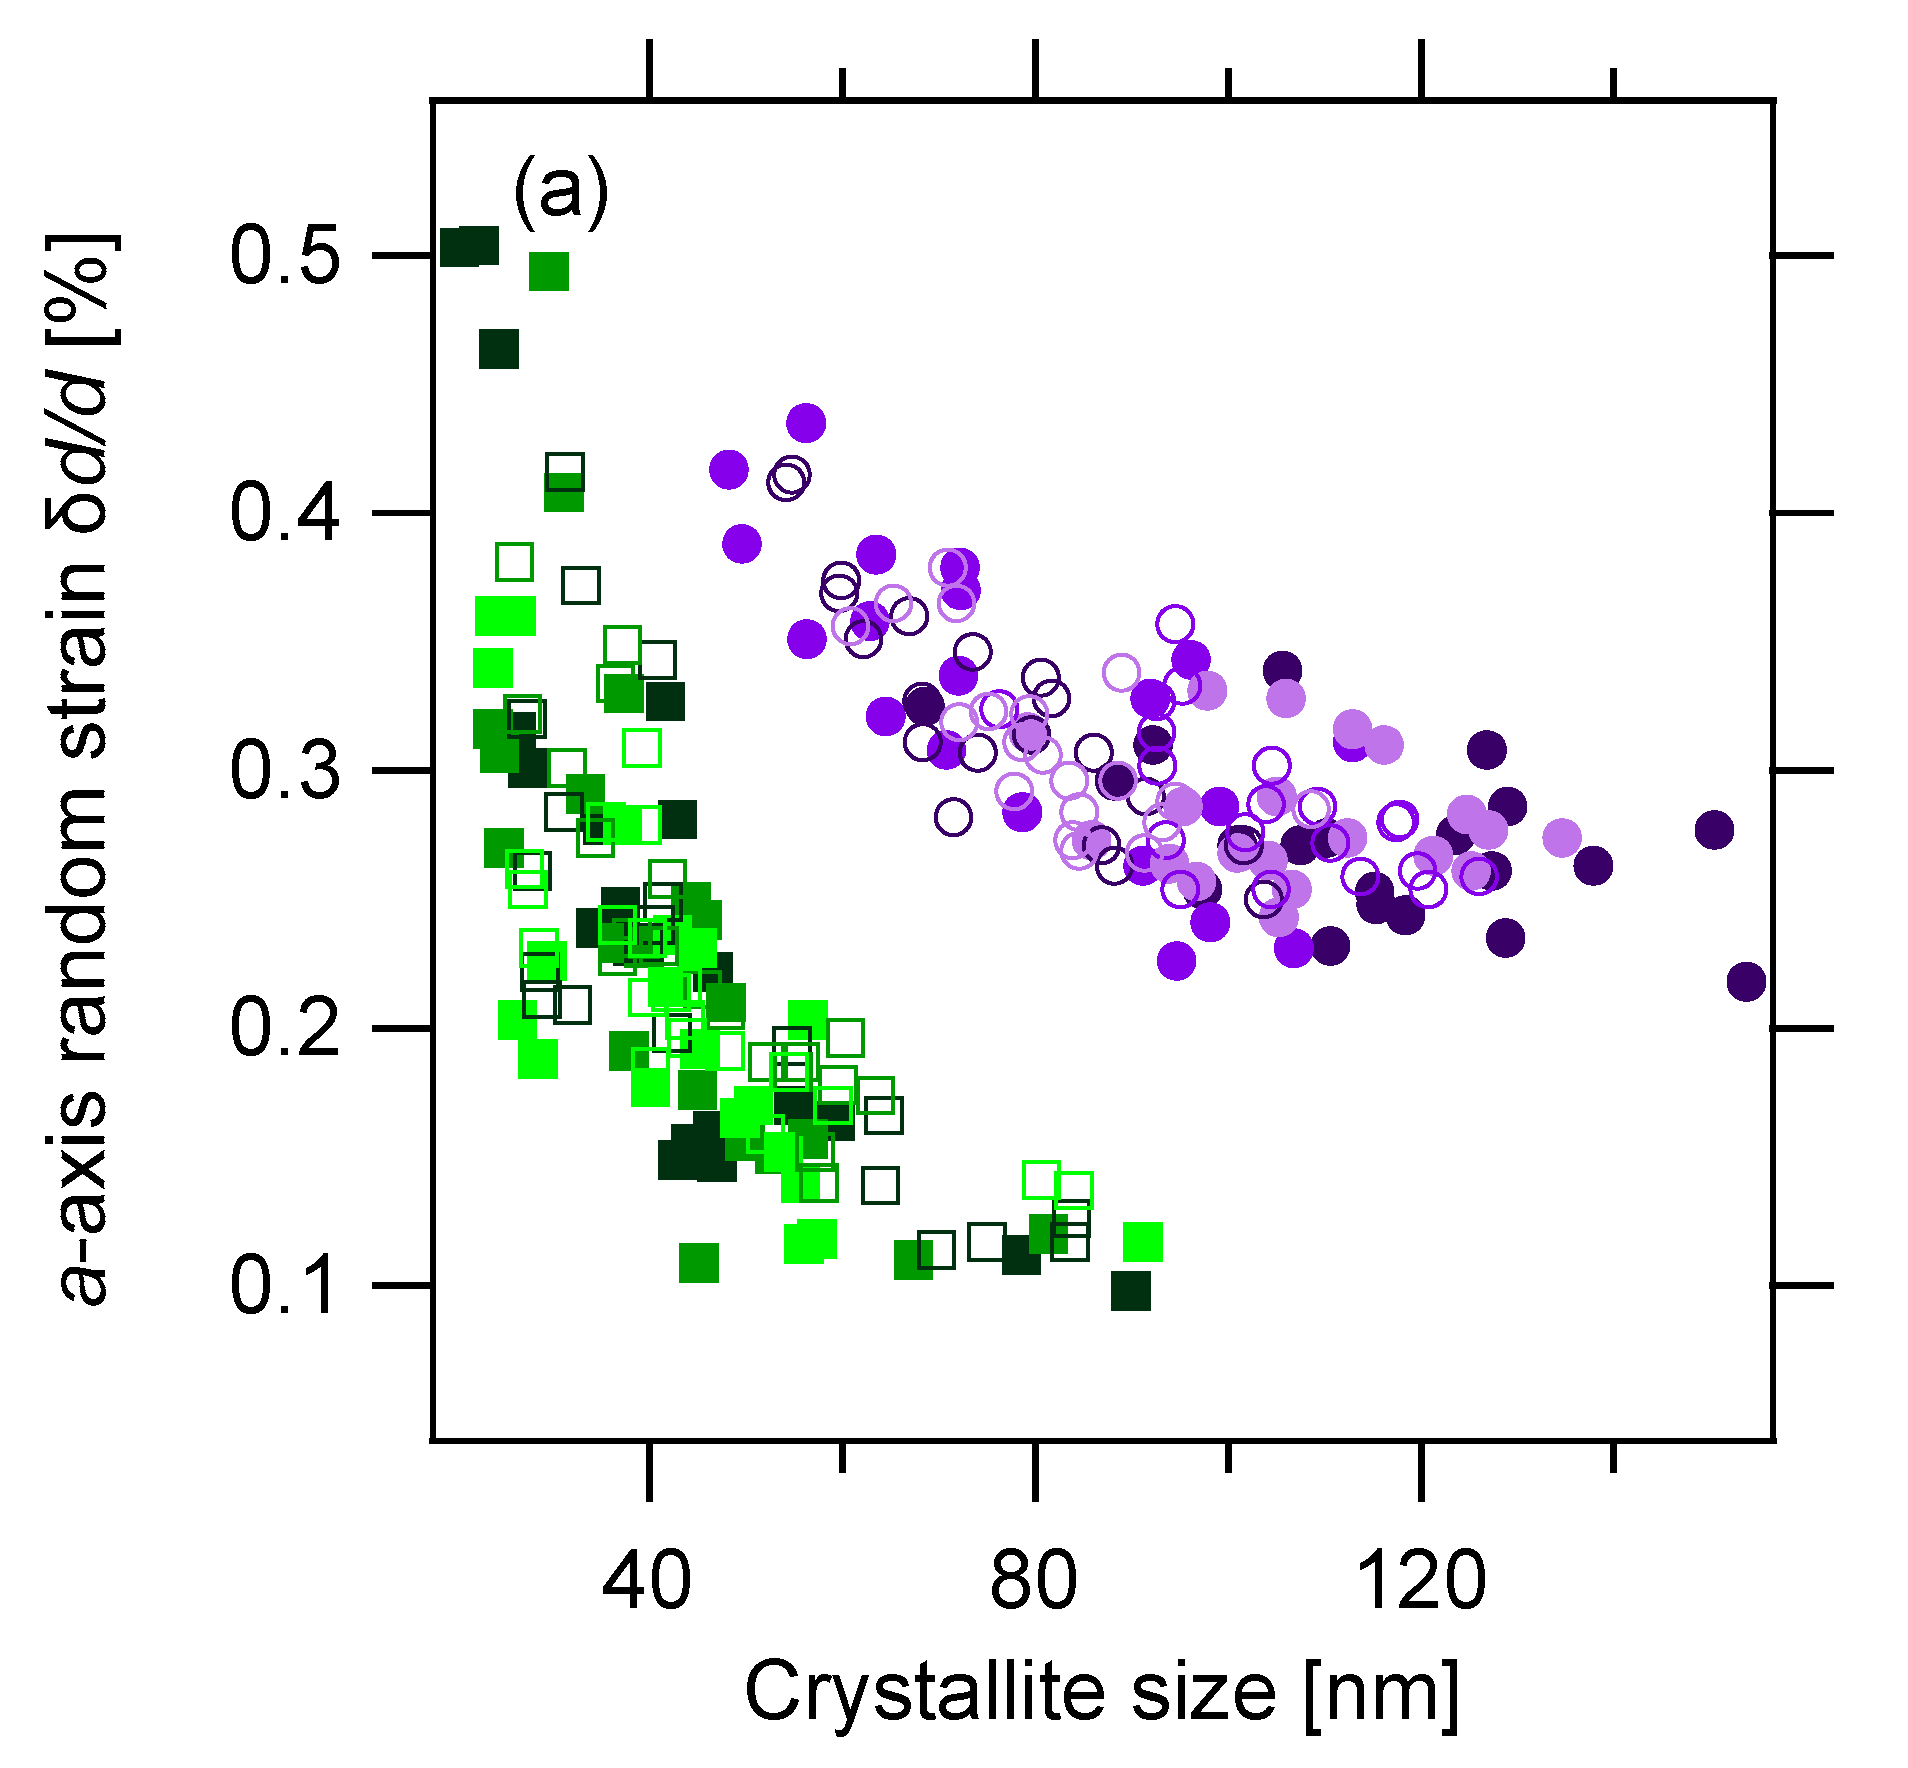
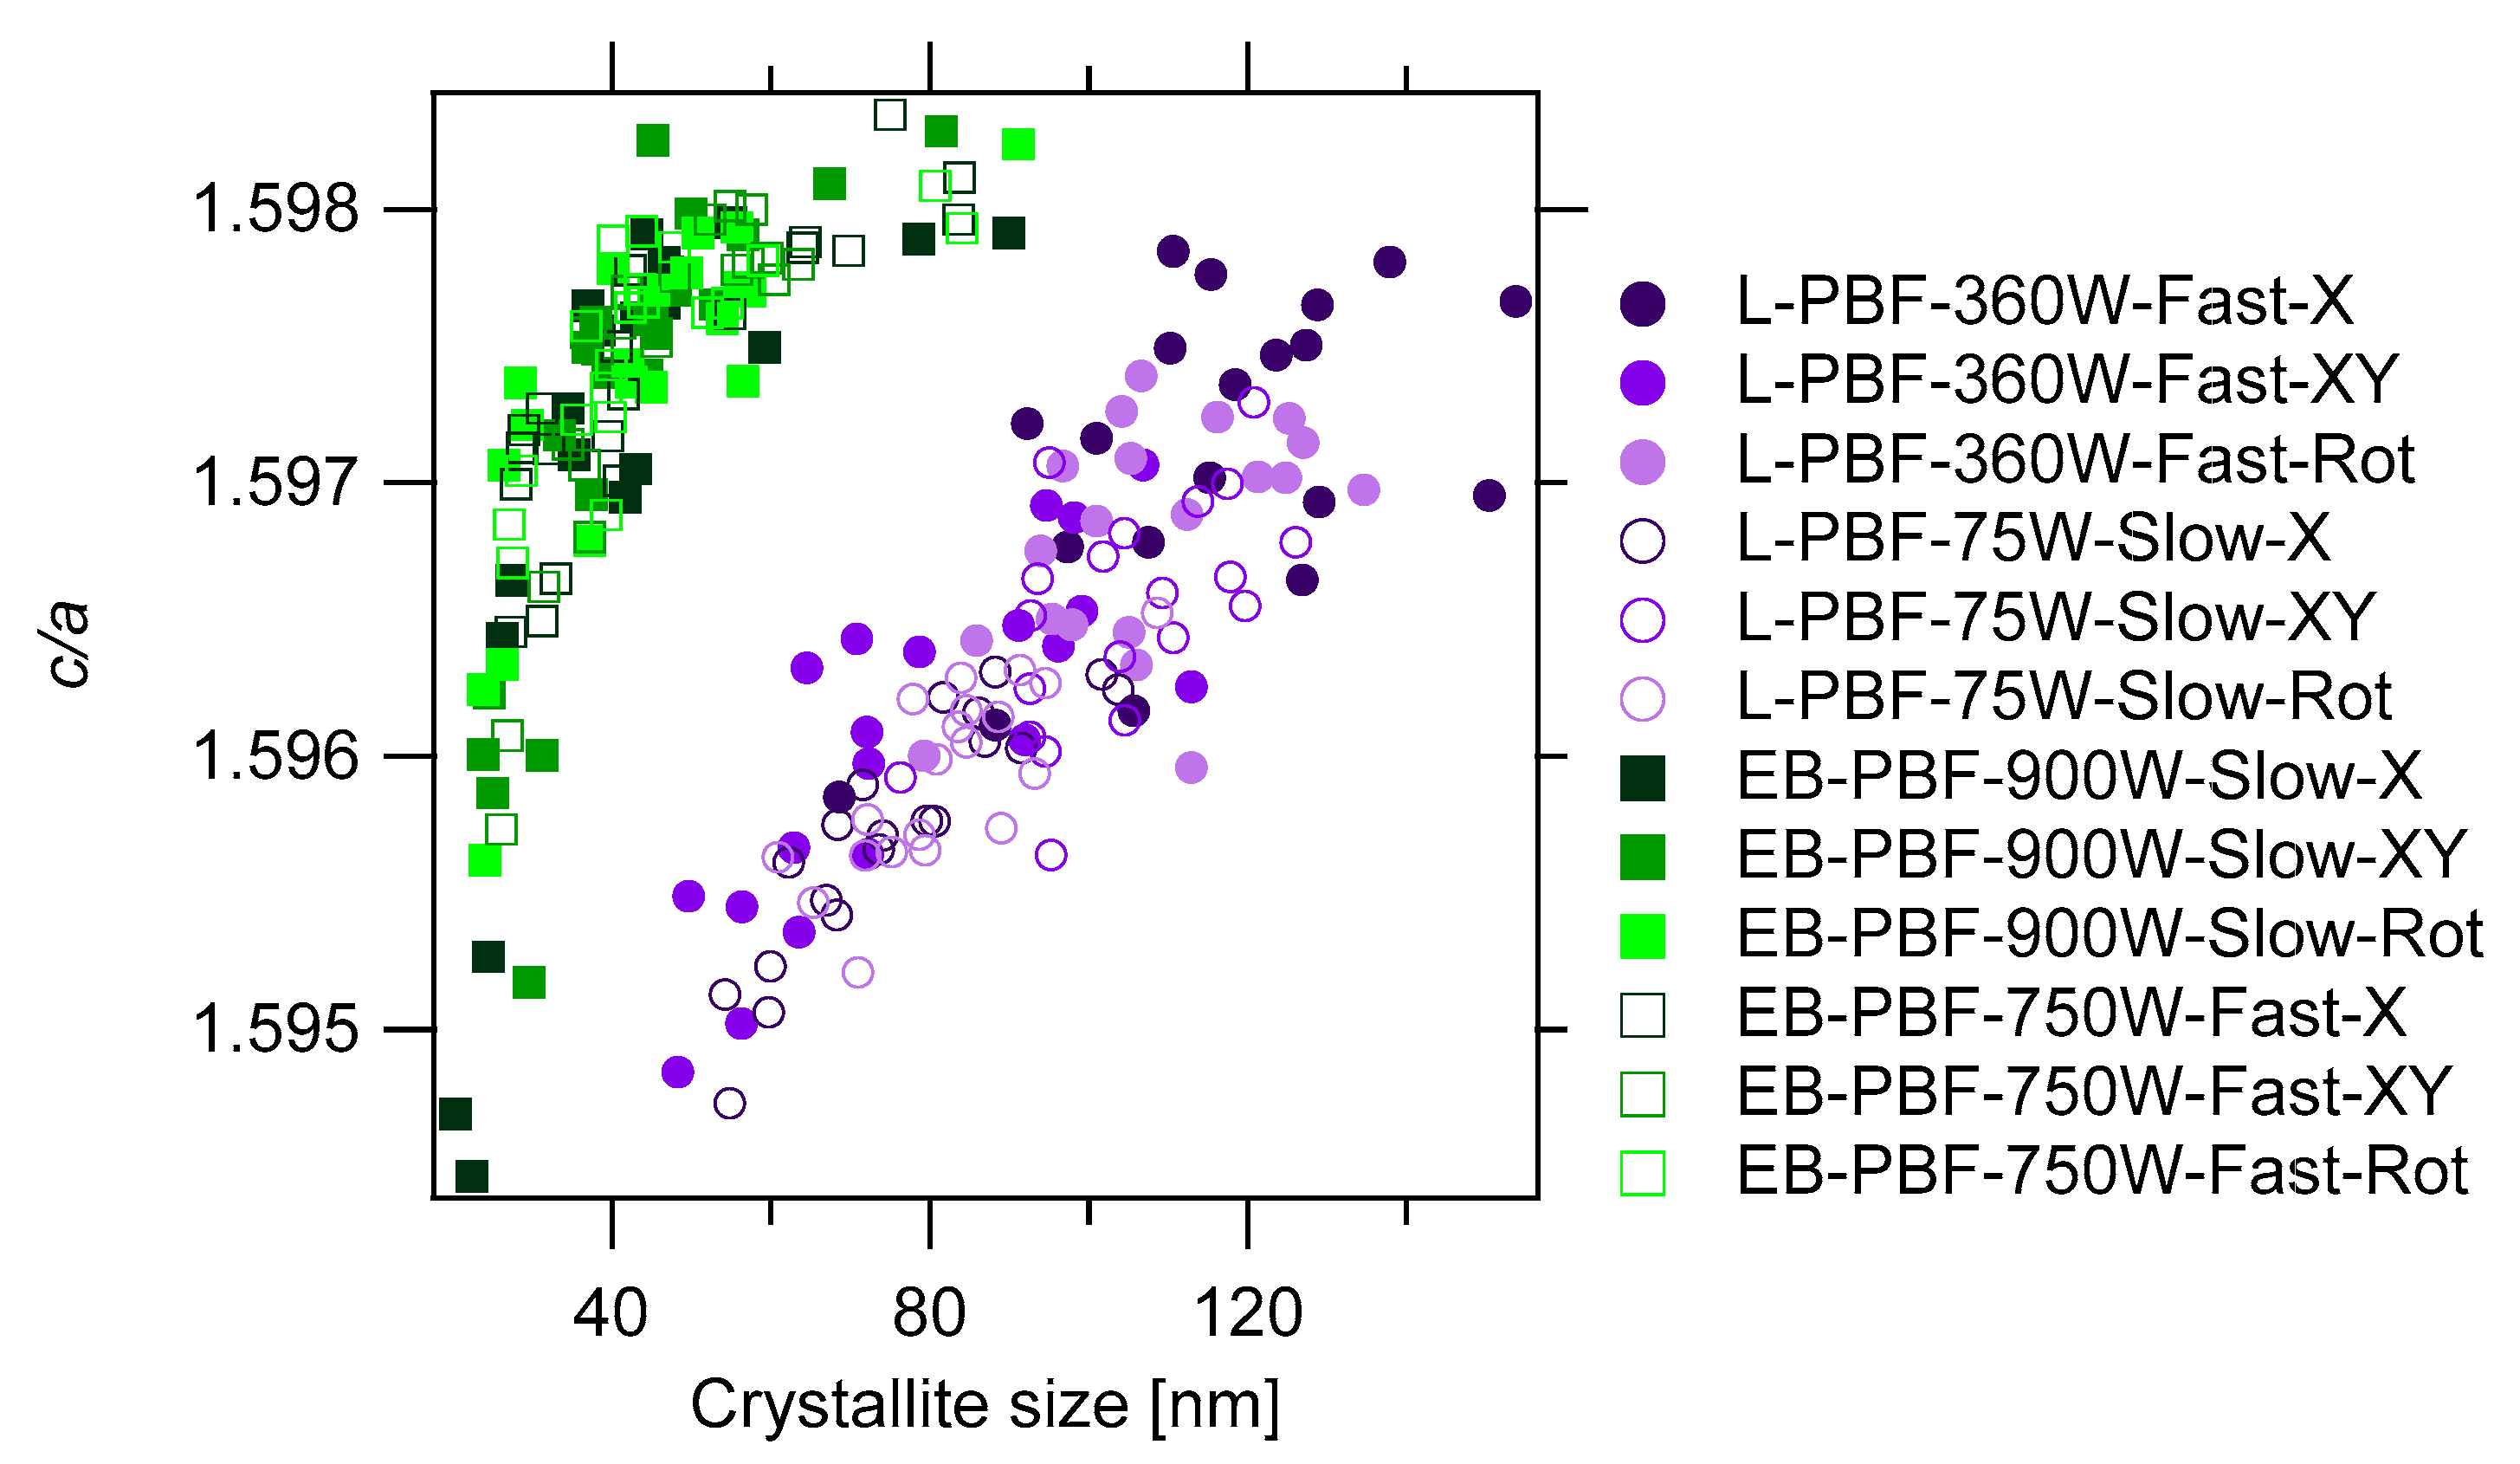
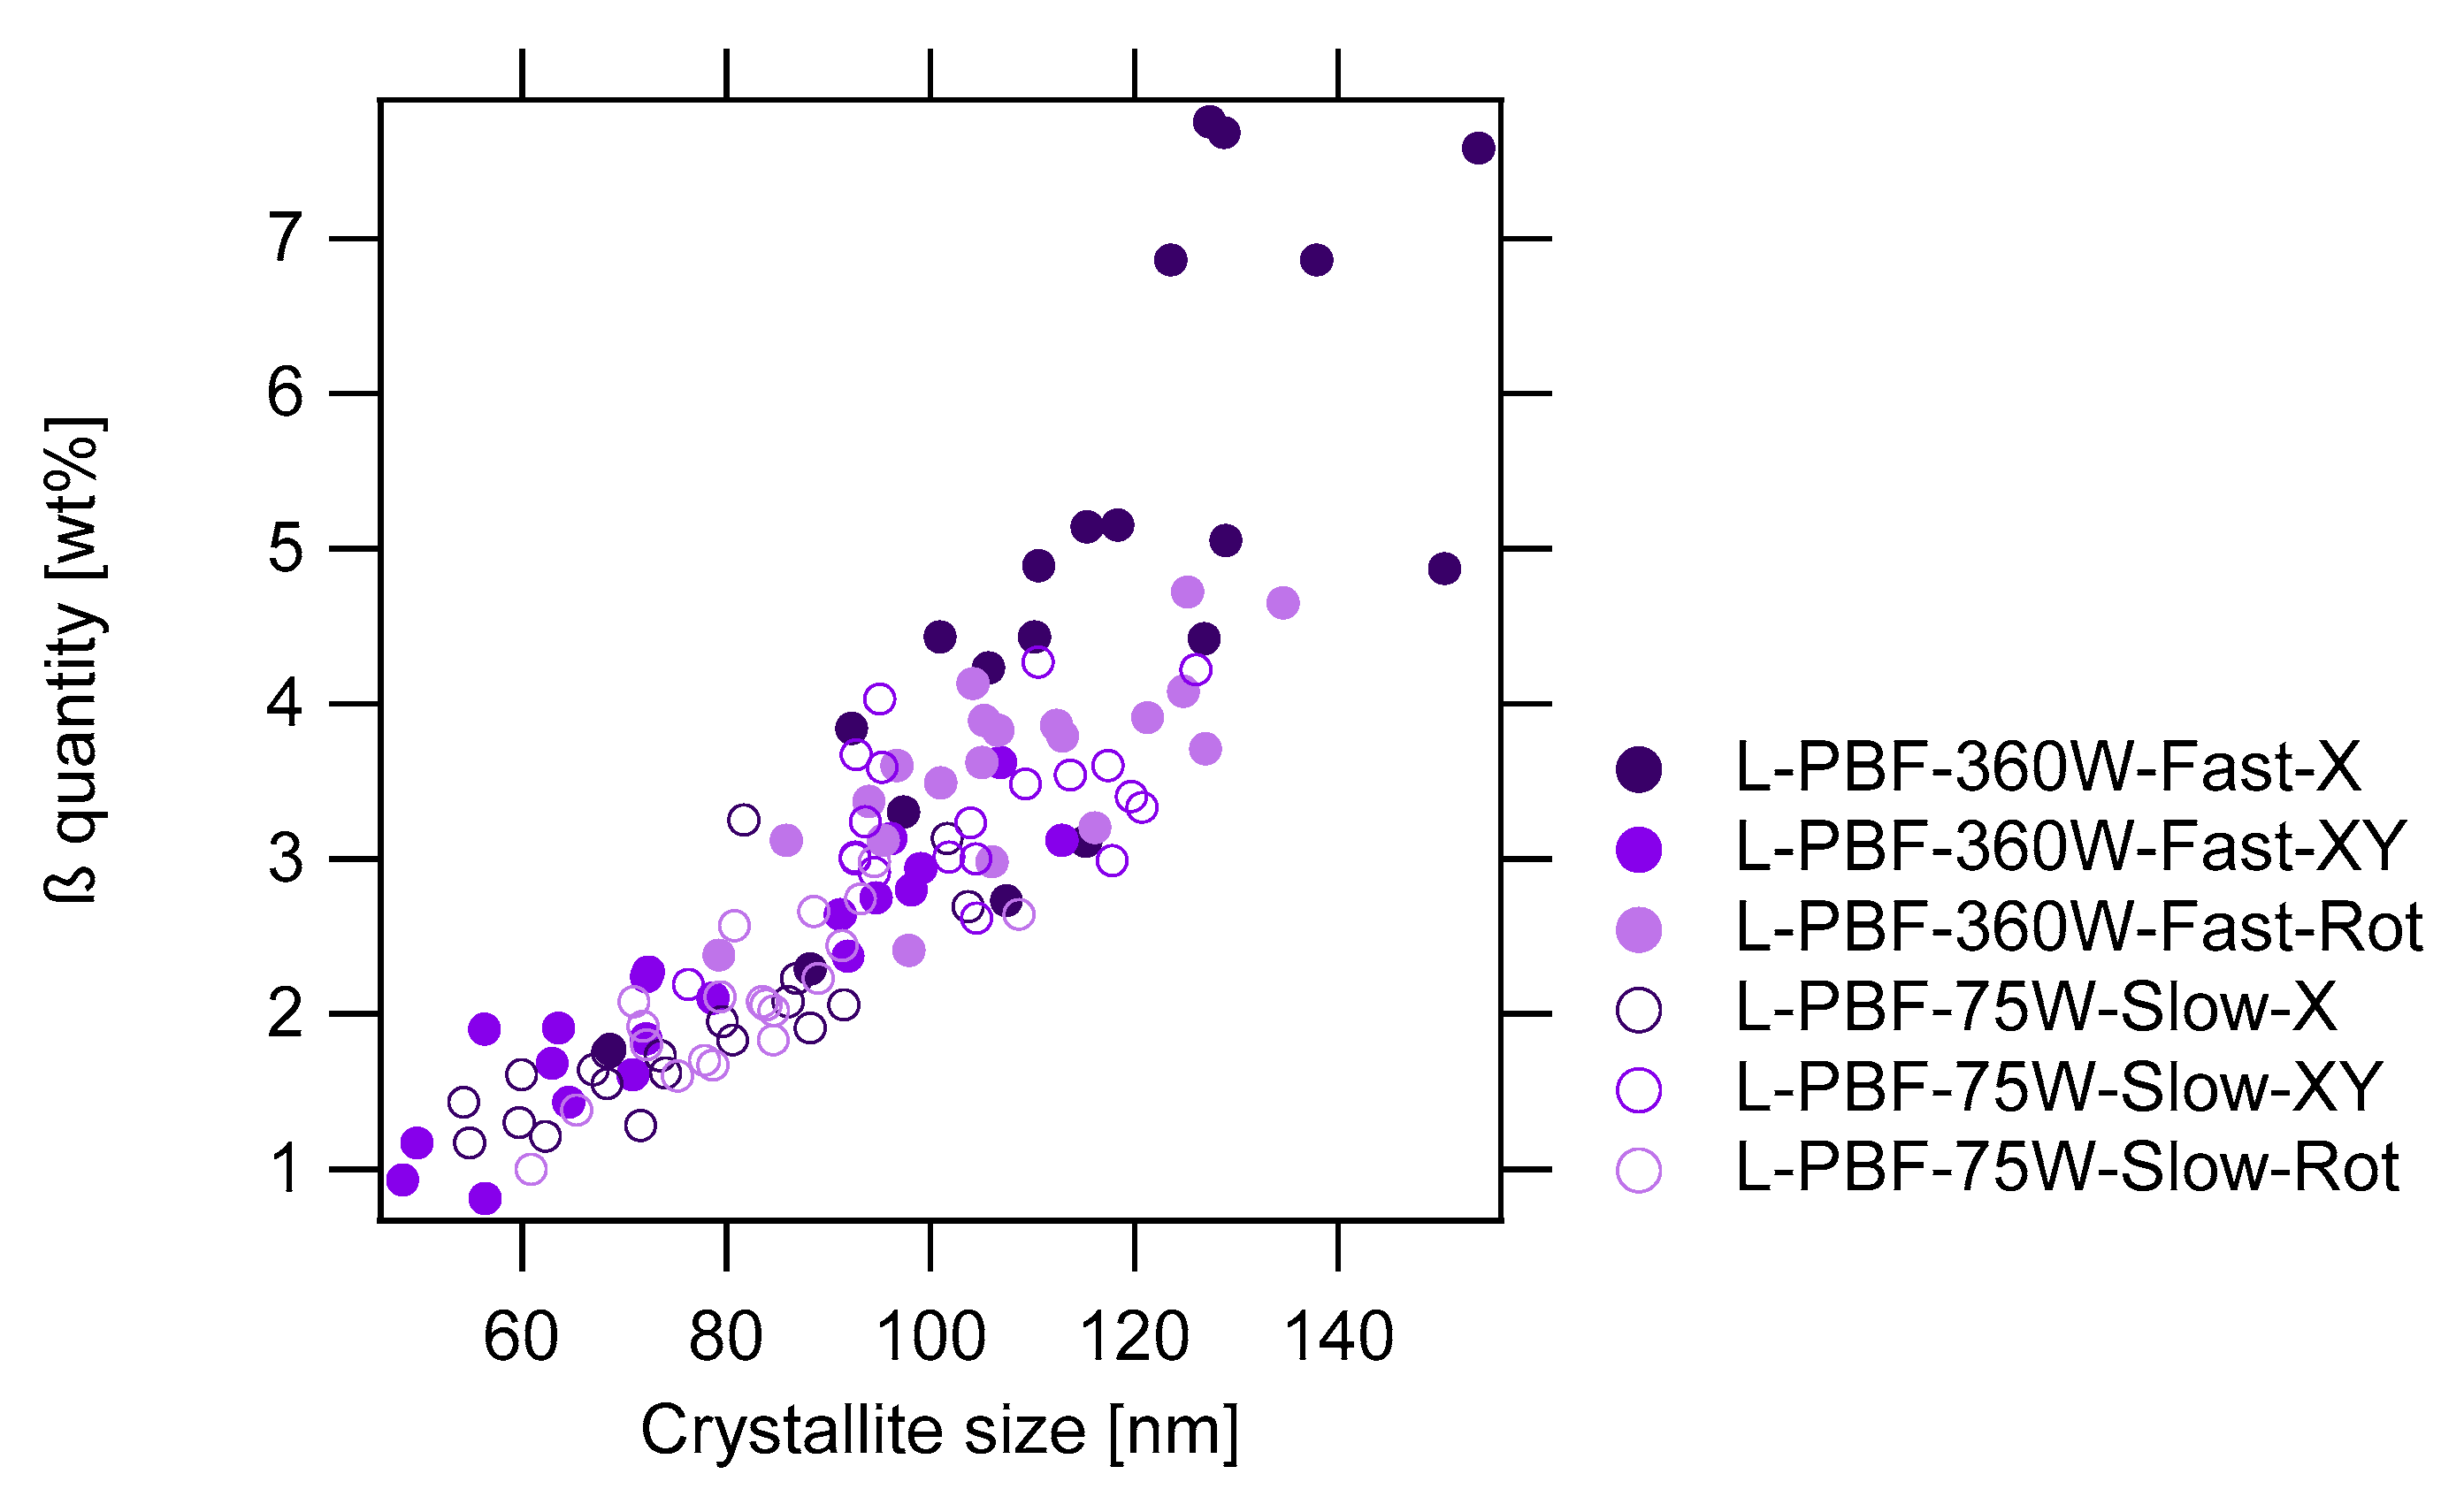
3.1. Crystallite Size, Random Lattice Strain, and Lattice Parameter Analyses
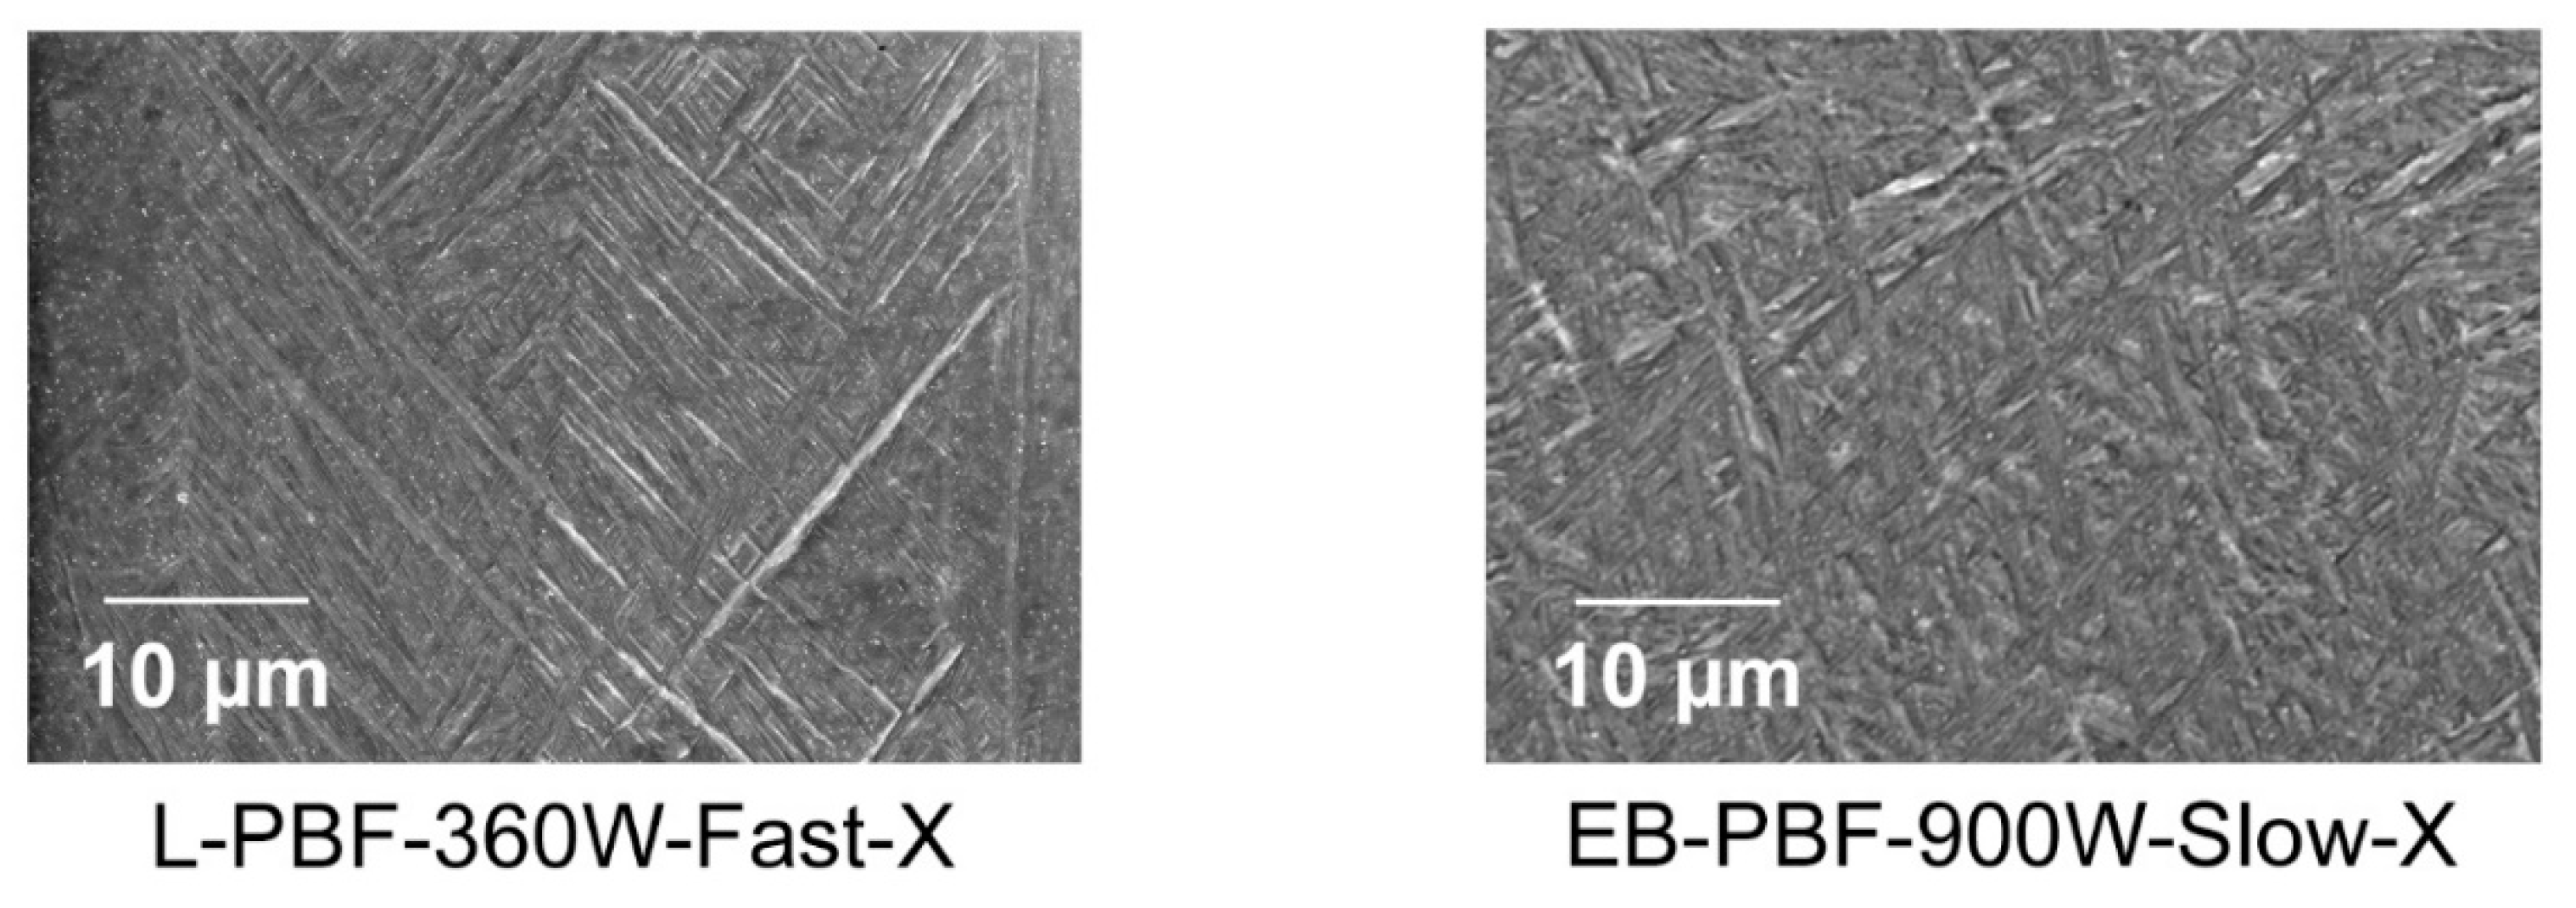
The WPF analysis result of L-PBF-360W-Fast-X on the XZ plane at Z = 25 mm is shown in Figure 4. The goodness of fit parameters Rwp and S [43] were 10.36% and 1.2556, respectively. All 240 points were analyzed in the same manner, and the crystallite size, lattice parameters a and c, and the random lattice strain parameters in the a and c directions of the α or α’ phases were refined. When the β phase was present, the quantity in weight% was also refined.
Figure 5, Figure 6 and Figure 7 show the random lattice strain of α or α’ phase in the a- and c-axis directions, c/a, and β quantity plotted against the crystallite size of the α or α’ phase, respectively. All parameters showed a strong correlation with the crystallite size, indicating that as the crystallites of the α or α’ phase grew, the random lattice strain decreased, and c/a increased. All these structural changes are related to the shift from α’ to α or α+β structures [9,10]. However, the same crystallite sizes of the α or α’ phases have different corresponding random lattice strains and c/a of the α or α’ phases in the L-PBF and EB-PBF parts. Furthermore, in the L-PBF parts, the β phase quantity increased as the crystallites grew, while the β phase was not detected in the EB-PBF-made parts. It is also notable that the random lattice strain in the c-axis direction was smaller than that in the a-axis direction. This result indicates that a greater number of dislocations cause atomic displacement in the a-axis direction [44], which is consistent with the fact that the preferred Burgers vector in the hcp system is 1/3 11 2 ¯ 0 [45].

3.2. Microstructure

The representative microstructures of the L-PBF and EB-PBF-made parts (L-PBF-360W-Fast-X and EB-PBF-900W-Slow-X) are shown in Figure 8. The α and α’ laths typical for PBF-made Ti-6Al-4V [1] were confirmed. The EB-PBF-made part showed thicker laths than L-PBF because of the repeated heating above the martensitic start temperature caused by the preheating [46]. It should be noted that the lath size observed in the SEM images is different from the crystallite size measured by XRD, as mentioned before. One grain or lath is composed of multiple crystallites that share the general crystallographic orientation but do not consist of a coherent single crystal.

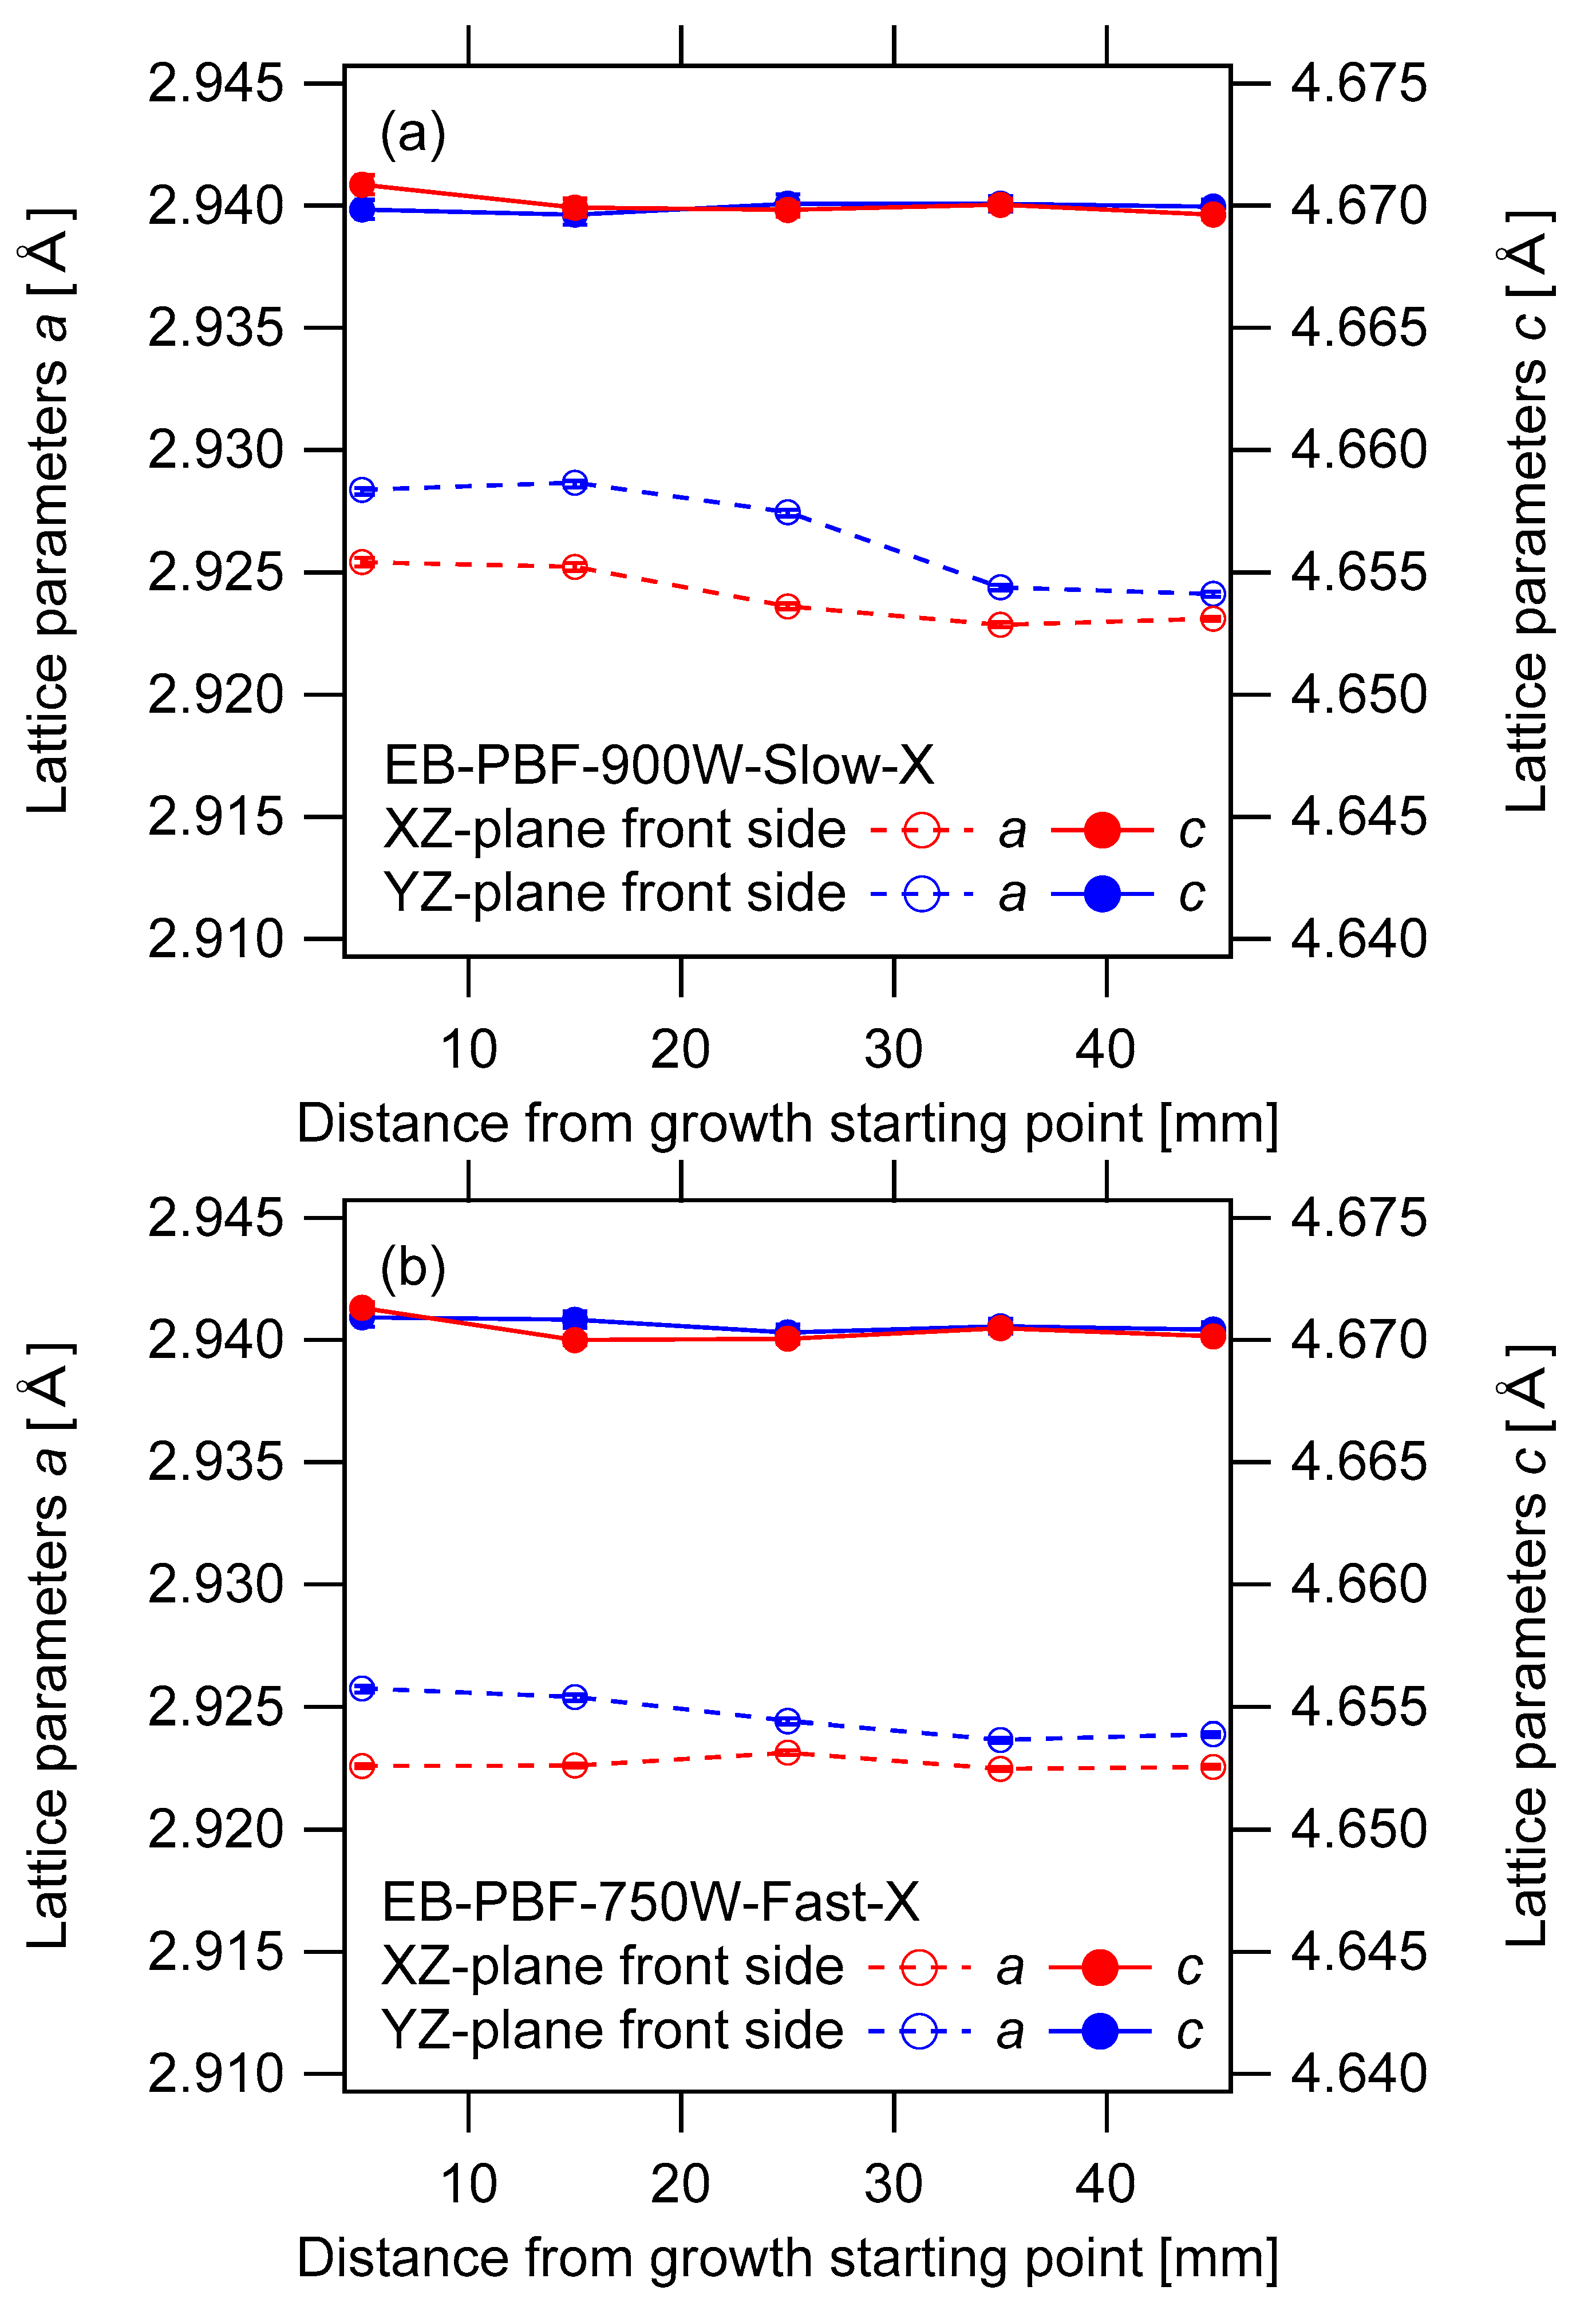
3.3. Lattice Parameter Location Dependency

To obtain further insight into the evolution of each phase, we investigated the location dependence of the random lattice strain, lattice parameters, crystallite size of the α or α’ phase, and β quantity. Figure 9 shows an example of the lattice parameter analysis on L-PBF-360W-Fast-X and L-PBF-75W-Slow-X. The lattice parameters a and c were plotted as a function of the Z position (growth height) for the XZ and YZ planes. The c-axis became longer as the parts grew in the Z-direction. This trend was more significant in L-PBF-360W-Fast-X than in L-PBF-75W-Slow-X. In L-PBF-360W-Fast-X, the c-axis on the XZ plane was longer overall than that on the YZ plane. Figure 10 shows an example of the lattice parameter analysis on EB-PBF-900W-Slow-X and EB-PBF-750W-Fast-X. The a-axis became shorter as the parts grew in the Z-direction. This trend is more significant on the YZ plane than on the XZ plane. The elongated c-axis observed in the L-PBF parts and the shrunken a-axis observed in the EB-PBF parts both correspond to greater c/a and shift from α’ to α structures [10]. Only the lattice parameter analysis results are shown as an example here; however, it should be noted that the change in the lattice parameters is correlated to all of the other parameters analyzed by HP-XRD, such as the random lattice strain and crystallite size of the α or α’ phase, and β phase quantity, as shown in Figure 5, Figure 6 and Figure 7.

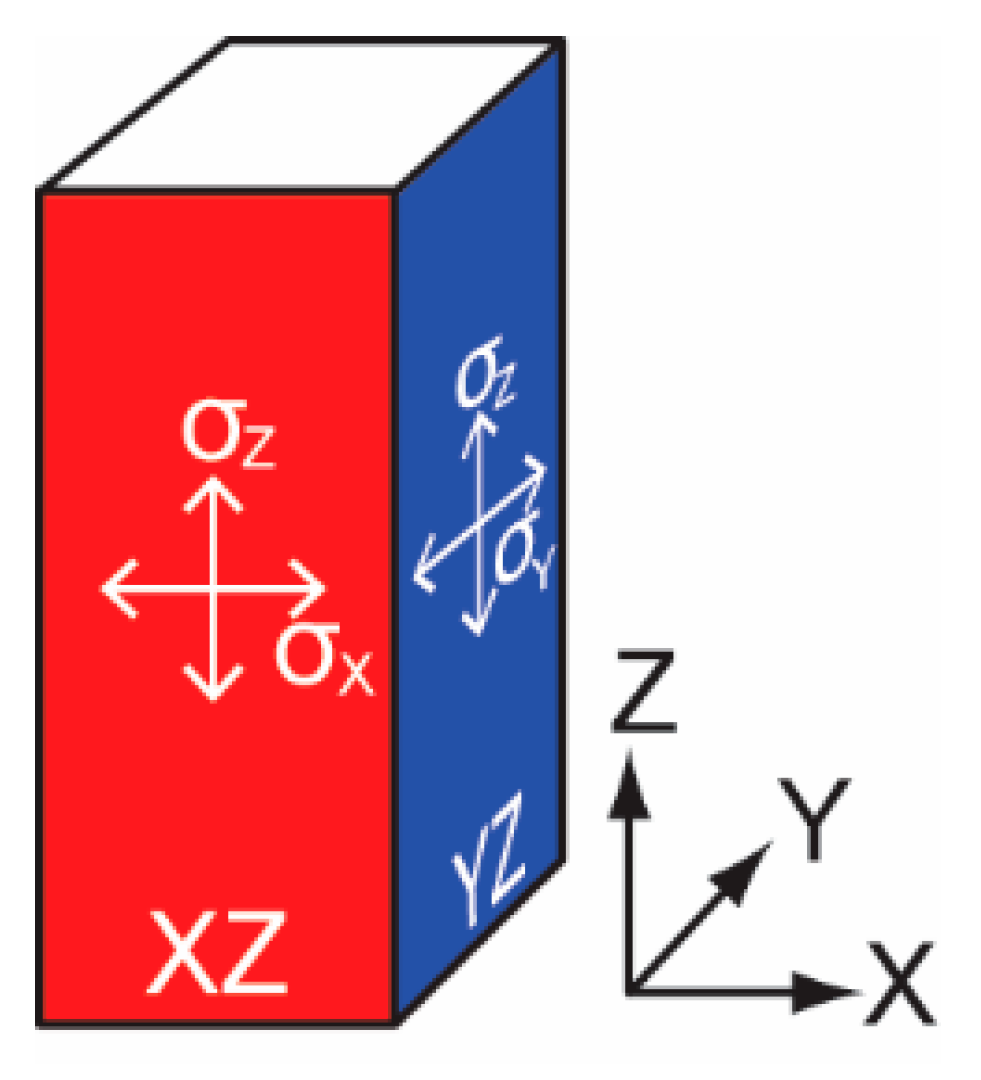
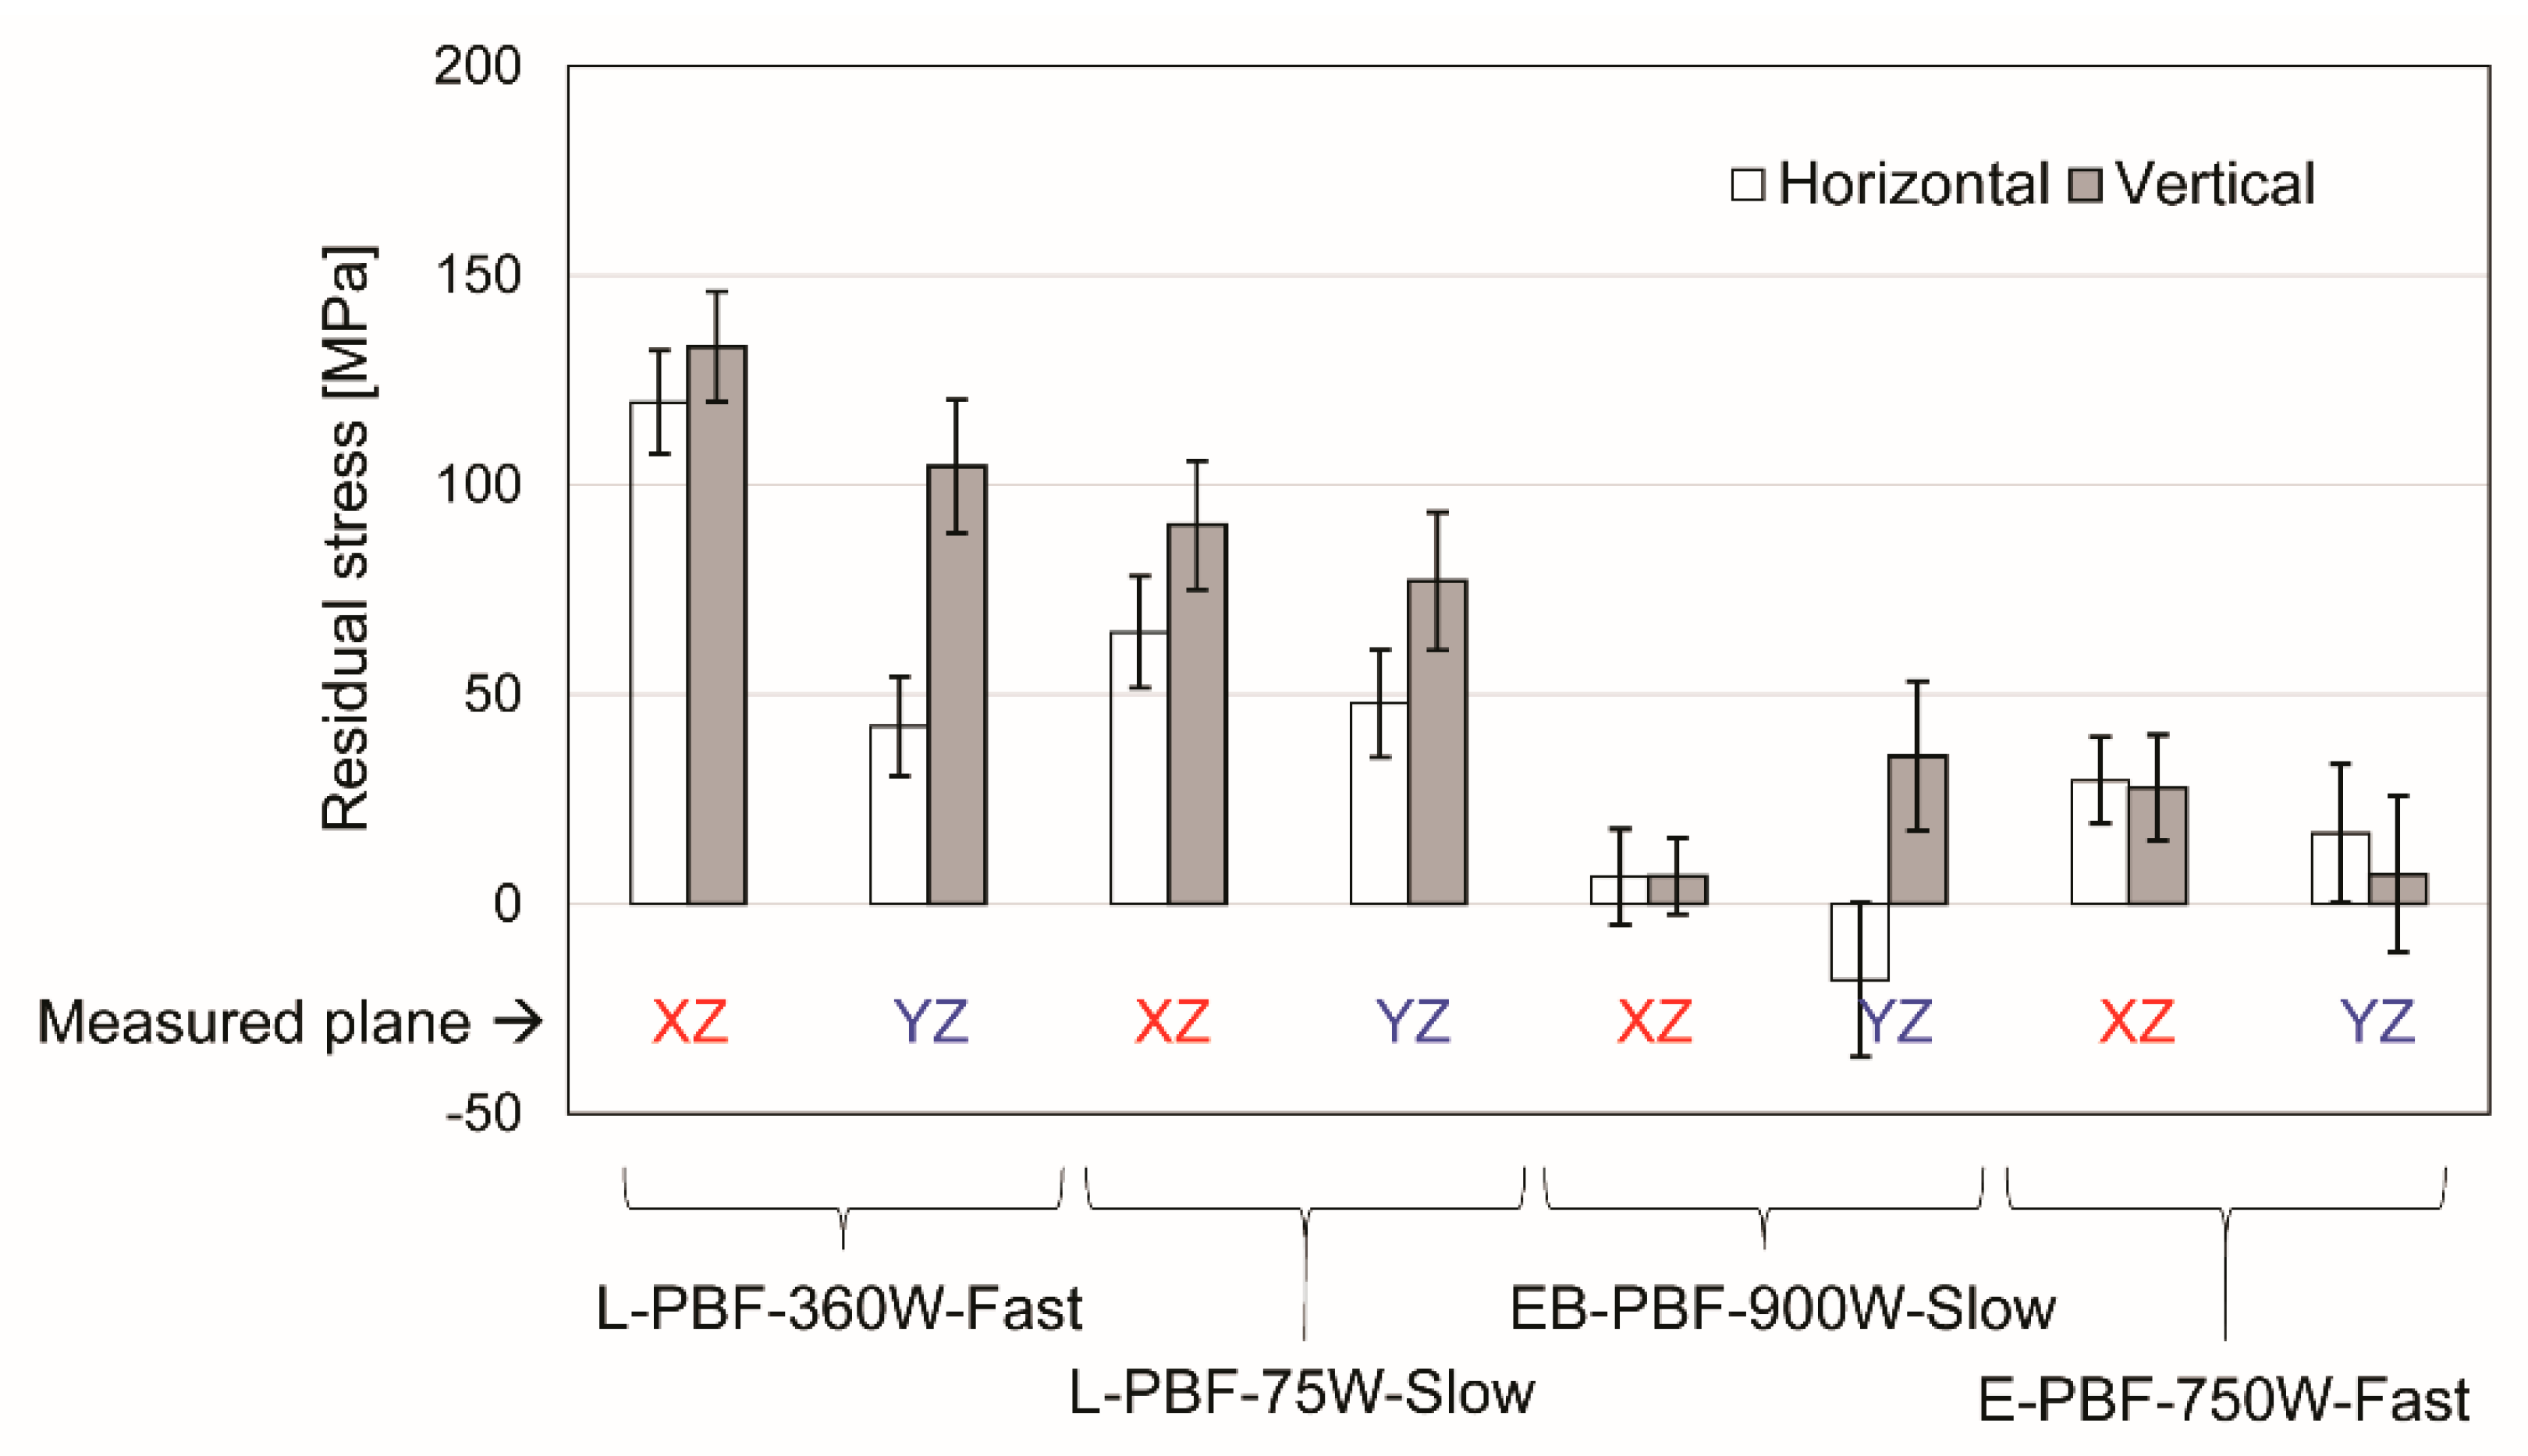
3.4. Residual Stress Analysis

The results of the residual stress analysis are shown in Figure 11. As there was no significant difference between the scan strategies and different Z positions, these values were averaged over five Z positions and three scan strategies, a total of 15 data points, to determine the difference between L-PBF and EB-PBF, beam power and scanning speed, measured planes (XZ and YZ planes), and residual stress directions (horizontal and vertical). The EB-PBF showed significantly lower residual stresses than the L-PBF. No systematic or noticeable difference was observed among the EB-PBF-made parts, considering the size of the error bars. In contrast, the L-PBF parts exhibited lower residual stresses under low power and low scanning speed conditions. The YZ plane exhibited lower stresses than the XZ plane. It should also be noted that the vertical residual stress is greater than the horizontal residual stress. All of these differences correspond to the difference in the heating and cooling rates immediately after the solidification occurring at a solidus temperature of 1605 °C [46].

4. Discussion

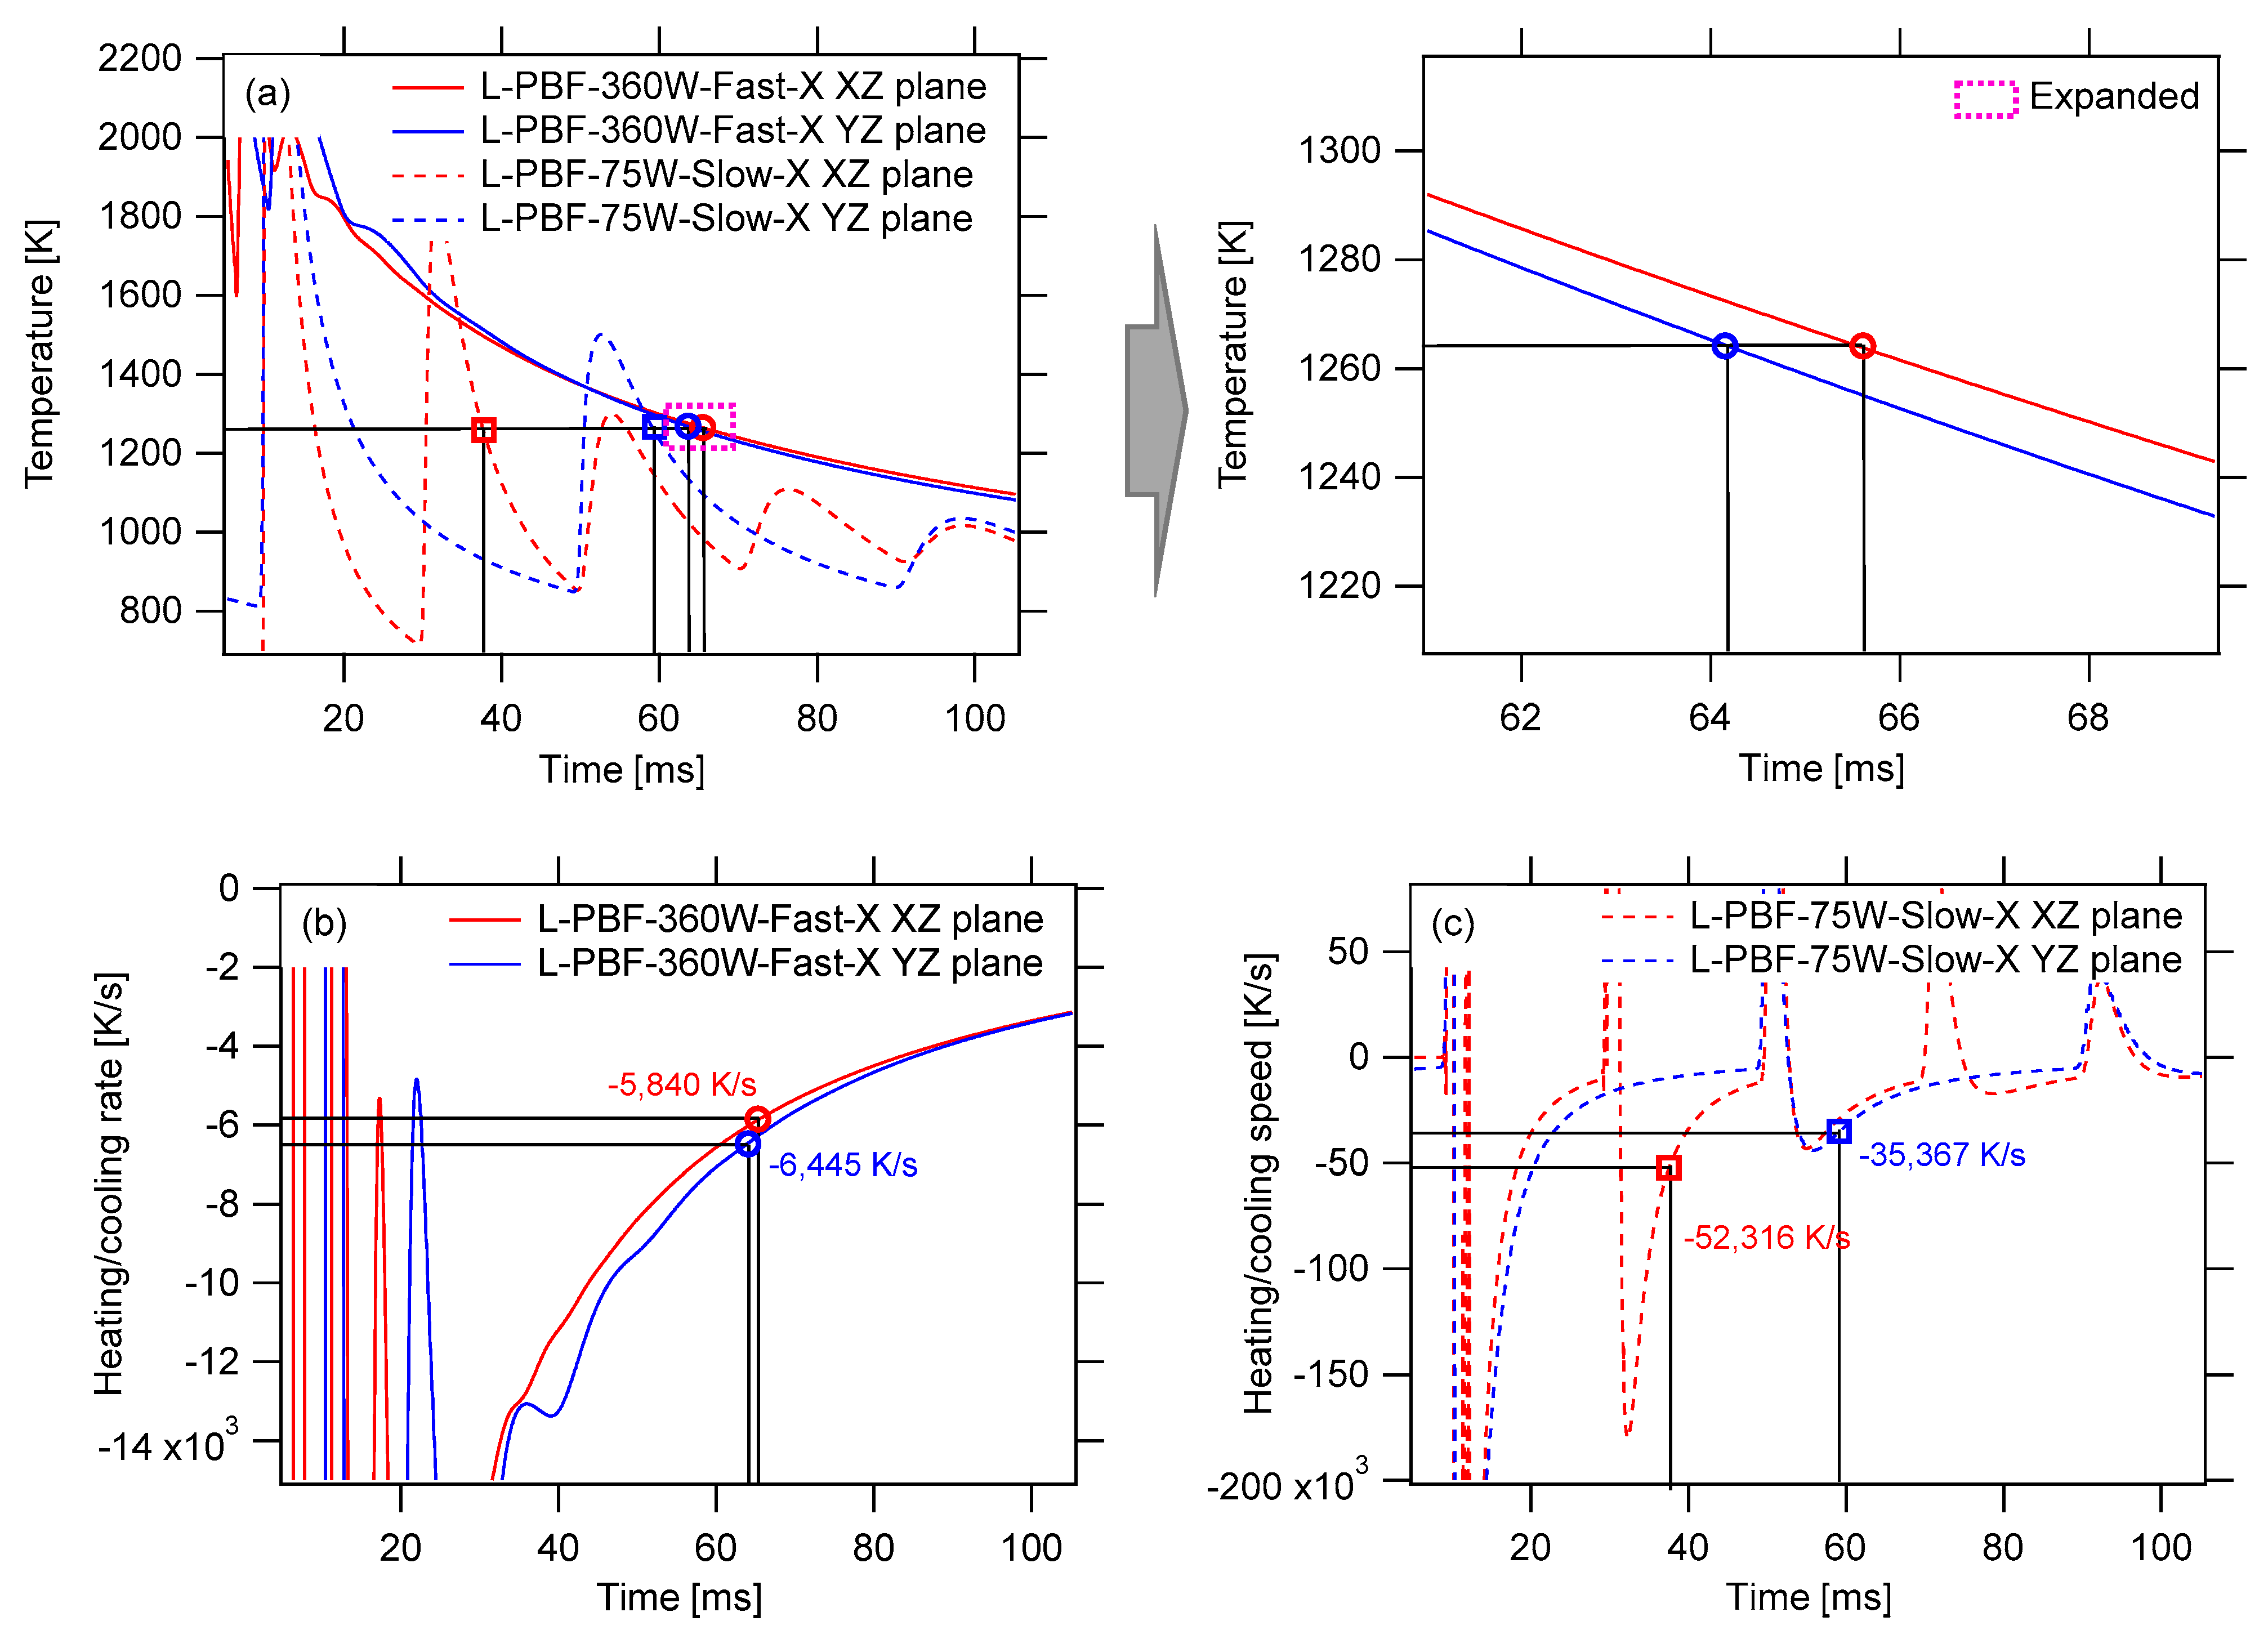
4.1. Heat Transfer Simulation

To investigate the origin of the phase structure dependency on the process parameters and measured locations observed in Section 3.1, we conducted heat transfer simulations for L-PBF-360W-Fast-X and L-PBF-75W-Slow-X. The temperatures and heating and cooling rates were calculated at a depth of 20 µm from the center of the XZ and YZ plane surfaces to match the area measured using HP-XRD. We focused on the area around the β transus temperature, 991 °C (1264.15 K) [47]. The simulated temperature, heating rate, and cooling rate are shown in Figure 12. The moments at which the temperature reaches the β transus temperature are denoted as a red circle for the L-PBF-360W-Fast-X XZ plane, a blue circle for the L-PBF-360W-Fast-X YZ plane, a red square for the L-PBF-75W-Slow-X XZ plane, and a blue square for the L-PBF-75W-Slow-X YZ plane in Figure 12a. These points are marked in Figure 12b,c to determine the cooling rate at each point.
As shown in Figure 12b,c, the cooling rate of L-PBF-75W-Slow-X was an order of magnitude higher than that of L-PBF-360W-Fast-X. When the scan speed was low, the laser beam was still scanning the vicinity of the points analyzed by HP-XRD even after the temperatures of those points reached the β transus temperature. It takes 20 ms to scan a 5 mm line with the slow scan speed at 250 mm/s. Therefore, when the temperature reached the β transus temperature on the L-PBF-75W-Slow-X XZ plane (red square) at t = 37.55 ms, the laser beam was still scanning a line only 0.1 mm away, causing a rapid change of the temperature at the point analyzed by HP-XRD on the XZ plane. On the other hand, when the scan speed was high, the laser beam was scanning rather far locations from those points and did not cause a rapid temperature change by the time the temperature reached the β transus temperature. It takes only 4.2 ms to scan a 5 mm line with the fast scan speed at 1200 mm/s. In this case, when the temperature reached the β transus temperature on the L-PBF-360W-Fast-X XZ plane (red circle) at t = 65.55 ms, the laser beam was already scanning a line 1.5 mm away without causing a rapid change of the temperature at the point analyzed by HP-XRD on the XZ plane. In Figure 12b, it can also be seen that, for L-PBF-360W-Fast-X, the YZ plane experienced a slightly higher cooling rate than the XZ plane.
These results explain why (1) the L-PBF-75W-Slow-X showed a more α’-like structure (smaller c/a, smaller crystallite size, and high level of random lattice strain) compared to L-PBF-360W-Fast-X, and (2) the YZ plane of PBF-360W-Fast-X showed a more α’-like structure compared to the XZ plane.

4.2. Process Techniques, Process Parameters, and Resulting Parts’ Characteristics

Previous studies have suggested that the α’ phase contains more dislocations than the α phase [10], and α’ has a shorter c/a than that of α [9]. Furthermore, Yang et al. [48] has reported that the α+β structure evolves through the β to α’ martensitic transformation and the growth of the α’ phase into greater α laths or the decomposition of the α’ phase into the α+β structure during the rapid cooling of the L-PBF process. Based on these factors, we can interpret the crystal structure parameters analyzed by HP-XRD as indicators of different stages of the α’ to α or α+β structure evolution.
For the L-PBF parts, as shown in Figure 13, the cooling rate around the β transus temperature, which is related to the scan power and speed, is a critical factor that dictates the resulting structure. When the cooling rate was high (calculated rate in this study: −5 × 10⁴ to −3 × 10⁴ K/s), the resulting parts showed a predominantly α’-like structure. As the cooling rate decreased (calculated rate in this study: ~−6 × 10³ K/s), the resulting parts shifted toward the α+β-like structure. In contrast, the level of residual stress was dictated more by the heating and cooling rates immediately after solidification.
In addition, at the beginning of the growth process (low Z position), the crystal structure was more α’-like than at the later stage (high Z position), as shown in Figure 9. The α or α’ phase structure changed while the process parameters remained the same because the cooling rate decreased during the growth process. At the beginning of the growth process, the heat generated by the laser beam immediately escapes to the base plate, and the overall growth layer temperature drops rapidly [49,50]. As the specimens grow in height, it takes longer for the heat to escape to the base plate because more heat starts to dissipate from the 5 mm × 5 mm specimen surface to the atmosphere, which is a slower cooling process.
The most significant feature of the EB-PBF parts is the low to negligible amount of residual stress. Preheating at 520 °C lowers the cooling rate, resulting in a reduced temperature gradient and residual stress [51]. The cooling rate also affects the α or α’ phase structure. Unlike the L-PBF parts, no significant differences among different beam powers and scanning speeds were observed. However, the structure of the α or α’ phase showed similar growth height dependency as the L-PBF-made parts did. At the beginning of the growth process (low Z position), the crystal structure was more α’-like than at the later stage (high Z position), as shown in Figure 10. This growth height dependency is also caused by the change in the main heat transfer mechanism, as in the case of the L-PBF parts.
The results summarized in Figure 13 and Figure 14 demonstrate that the relationship between the process parameters and the resulting phase structures is remarkably different between L-PBF and EB-PBF. Furthermore, these results show that one needs to adjust the L-PBF process parameters to optimize the cooling rates at specific temperature regions to precisely control residual stresses and phase structures as well as ultimately achieve the desired part’s performance.

5. Conclusions

This study systematically and quantitatively investigated the difference between L-PBF and EB-PBF techniques and their process parameters in surface residual stresses and phase structures of α- or α’ + β-type Ti-6Al-4V. Specimens fabricated by L-PBF and EB-PBF and different process parameters were analyzed using HP-XRD. Different levels of residual stress and a wide range of phase structures from α’ to α and α + β were observed. These parameters are correlated with the cooling rates. The results are summarized as follows:
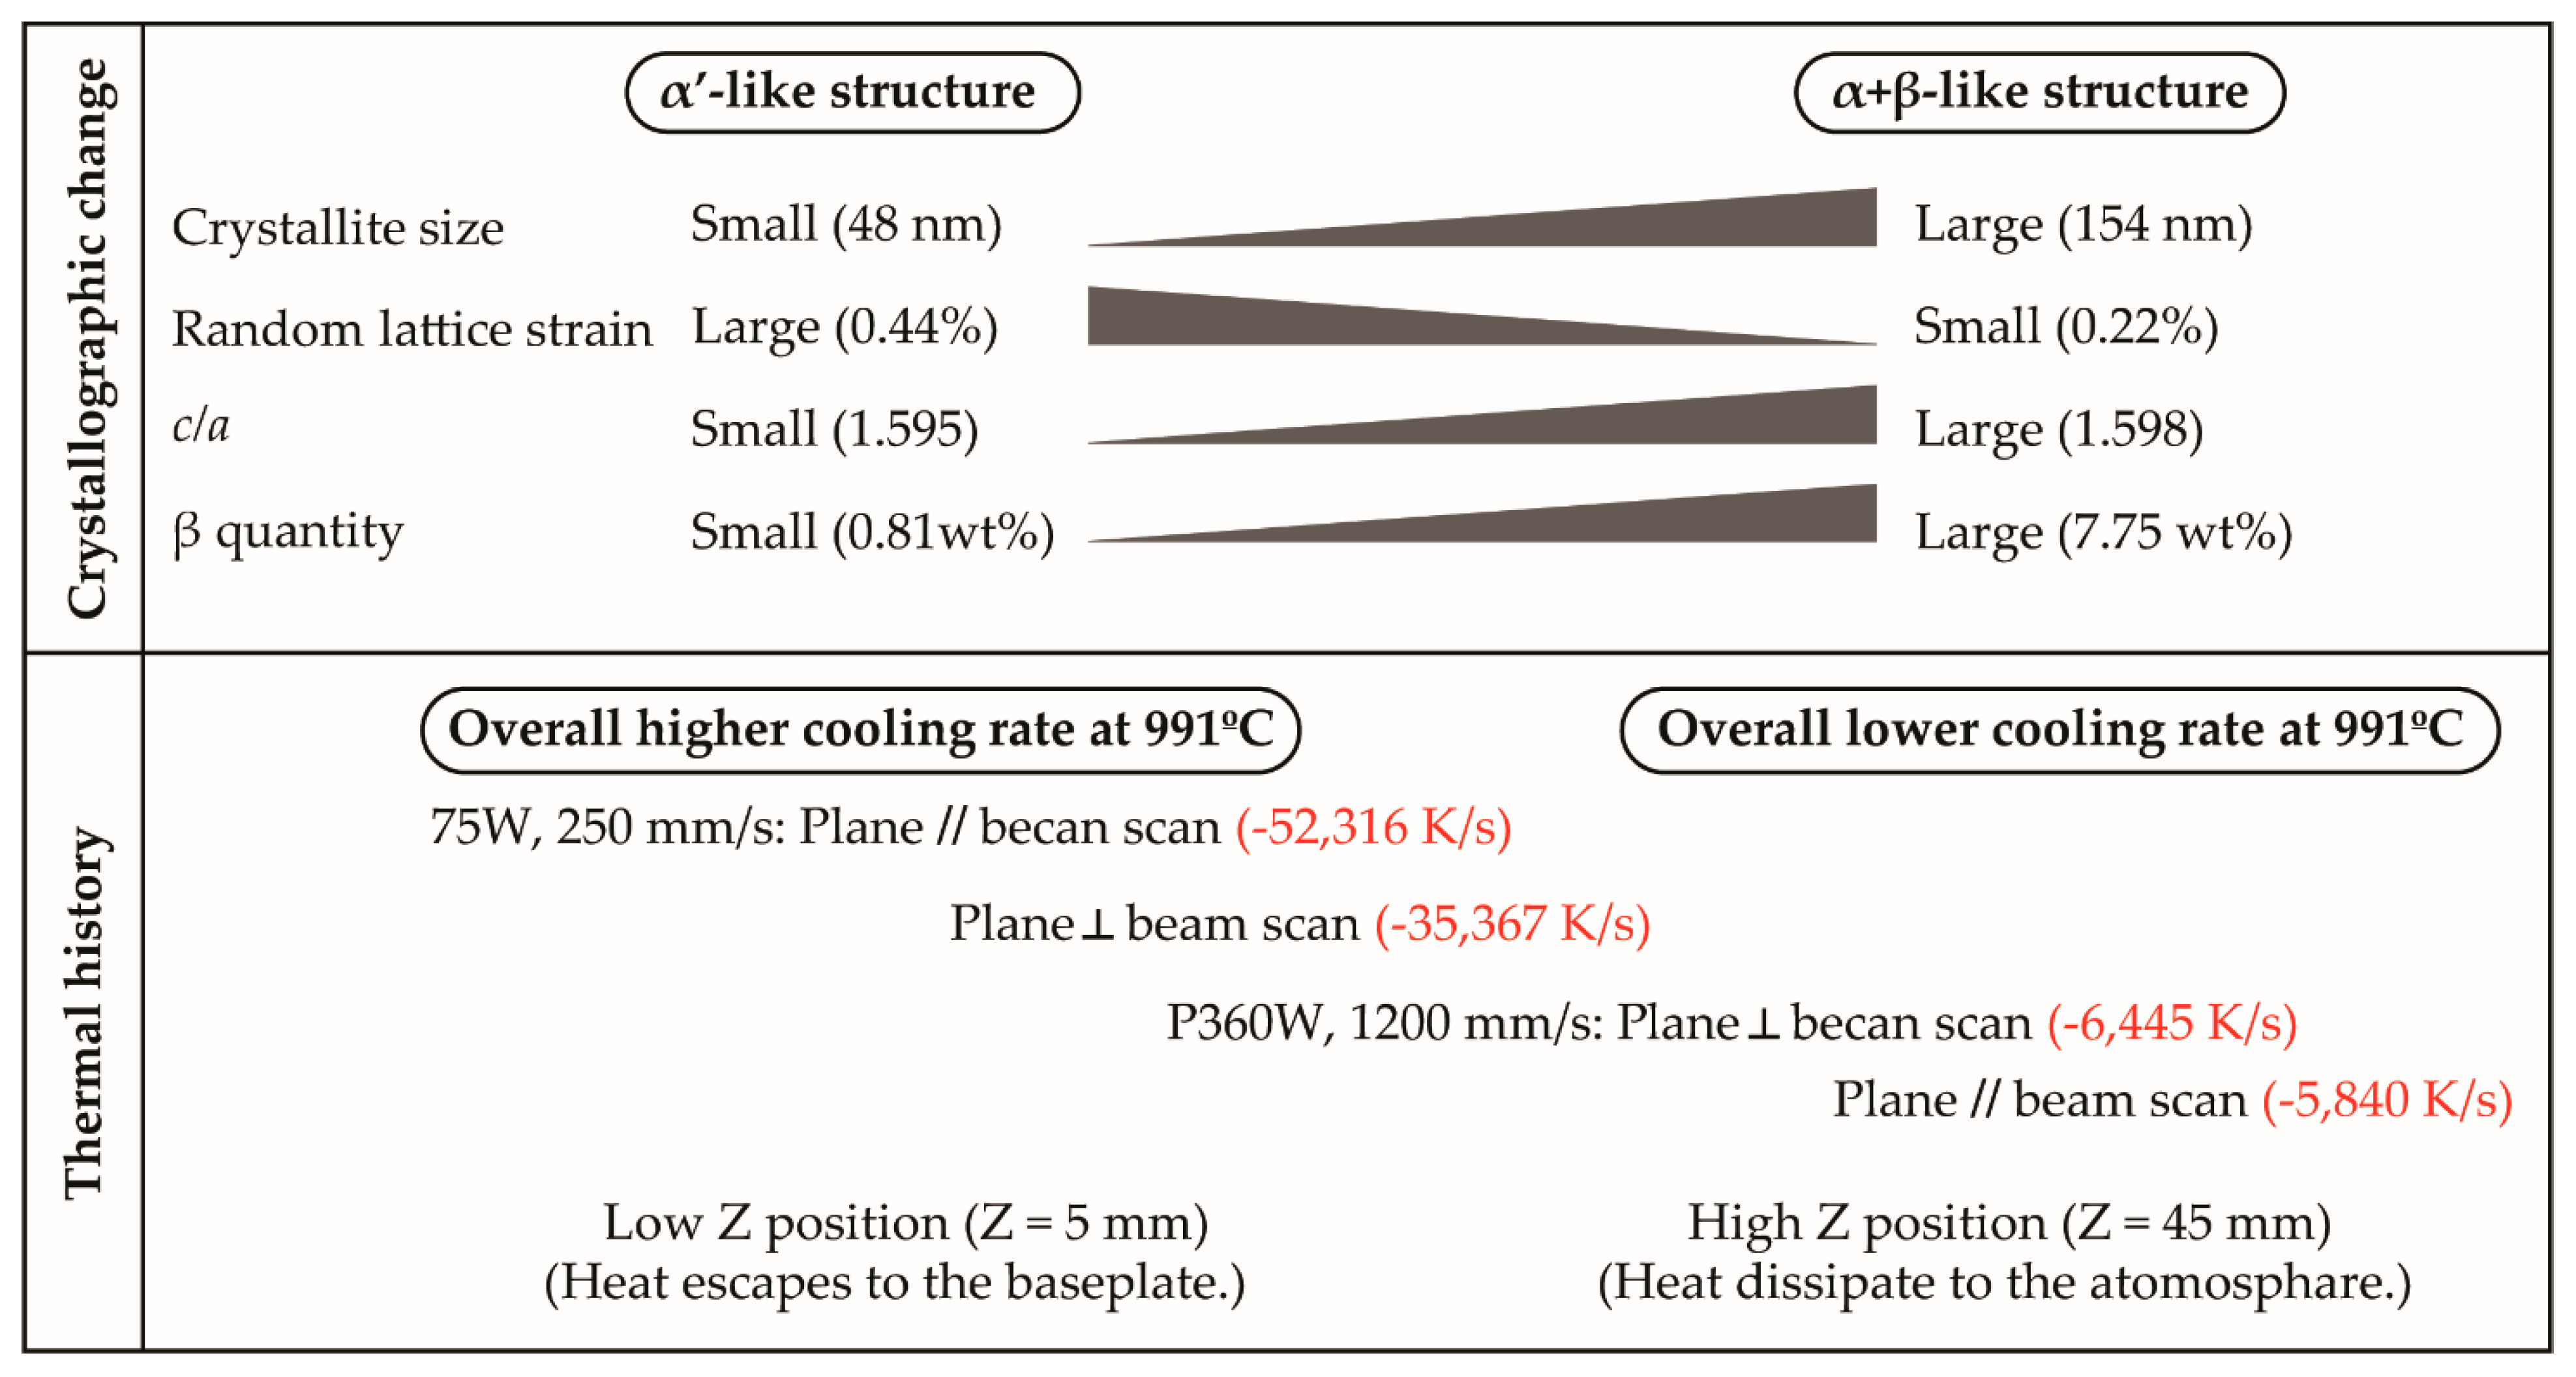
  • For the L-PBF parts, the cooling rate around the β transus temperature was found to be the critical factor that dictates the resulting structure. When the cooling rate was high (low laser power and low scan speed), the resulting parts predominantly exhibited an α’-like crystal structure. As the cooling rate decreased (high laser power and high scan speed), the resulting parts shifted toward an α+β-like structure. In contrast, the level of residual stress was dictated more by the heating and cooling rates immediately after solidification.
  • No significant residual stress was observed in the EB-PBF-made parts. In addition, unlike the L-PBF parts, no significant difference among different beam power and scanning speed was observed in the EB-PBF parts. No significant amount of β phase was observed.
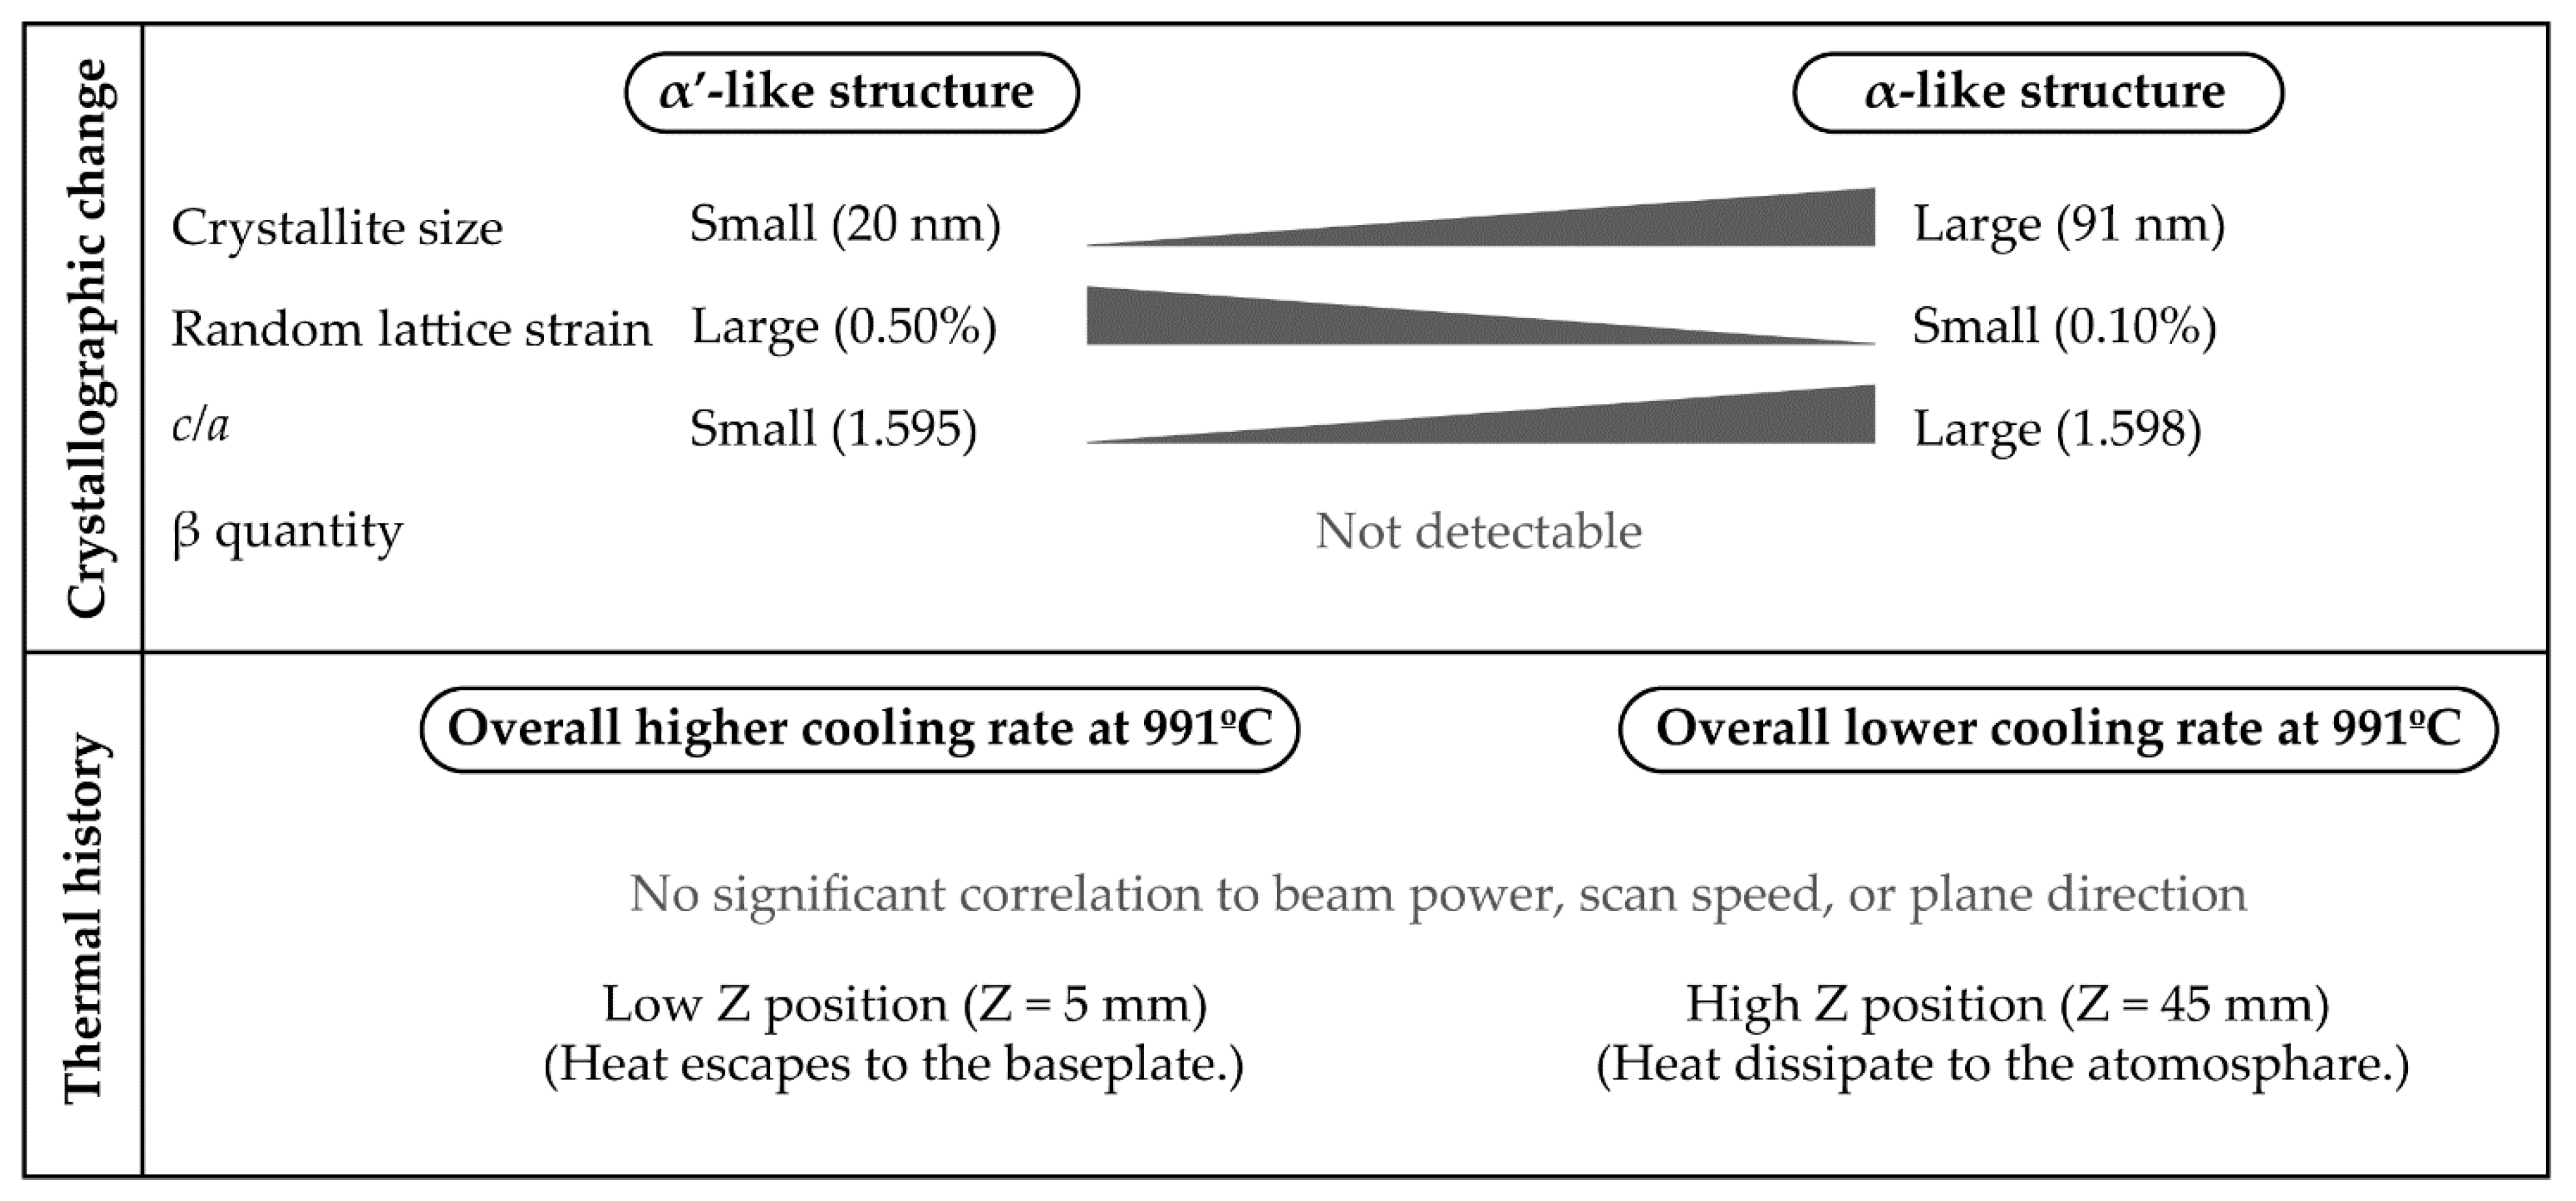
  • Growth height (Z location) dependency was observed in both the L-PBF and EB-PBF parts. The change in the cooling rate during the growth process due to the change in the main heat transfer mechanism affects the resulting structure. The higher cooling rate at the beginning of the growth stage resulted in a more α’-like structure. Conversely, the lower cooling rate at the later stage resulted in a more α- or α+β-like structure.
In AM processes, the control of the residual stress of the resulting parts and phase structure is often discussed in the context of a generalized overall cooling rate or an even more reduced parameter, such as energy density. However, the findings of the present study suggest that the cooling rates at specific temperatures and part locations need to be considered to control the residual stresses and phase structures as well as ultimately achieve the desired mechanical performance.

Author Contributions

Conceptualization, A.T. and T.N.; Formal analysis, A.T.; Funding acquisition, T.N.; Investigation, A.T., T.I., N.M. and N.I.; Methodology, A.T.; Project administration, T.N.; Supervision, T.N.; Validation, A.T.; Visualization, A.T.; Writing—original draft, A.T.; Writing—review and editing, T.I. and T.N. All authors have read and agreed to the published version of the manuscript.

Funding

This work was supported by Grants-in-Aid for Scientific Research (JP18H05254) from the Japan Society for the Promotion of Science (JSPS). This work was also partly supported by the Cross-Ministerial Strategic Innovation Promotion Program (SIP), Materials Integration for Revolutionary Design System of Structural Materials, Domain C1: “Development of Additive Manufacturing Process for Ni-based Alloy” from the Japan Science and Technology Agency (JST).

Institutional Review Board Statement

Not applicable.

Informed Consent Statement

Not applicable.

Data Availability Statement

The data that support the findings of this study are available from the corresponding author upon reasonable request.

Conflicts of Interest

The authors declare no conflict of interest.

References

  1. Liu, S.; Shin, Y.C. Additive Manufacturing of Ti6Al4V Alloy: A Review. Mater. Des. 2019, 164, 107552. [Google Scholar] [CrossRef]
  2. Froes, F.H.; Dutta, B. The Additive Manufacturing (AM) of Titanium Alloys. Adv. Mater. Res. 2014, 1019, 19–25. [Google Scholar] [CrossRef]
  3. Wang, P.; Li, X.; Luo, S.; Nai, M.L.S.; Ding, J.; Wei, J. Additively Manufactured Heterogeneously Porous Metallic Bone with Biostructural Functions and Bone-like Mechanical Properties. J. Mater. Sci. Technol. 2021, 62, 173–179. [Google Scholar] [CrossRef]
  4. Sidambe, A. Biocompatibility of Advanced Manufactured Titanium Implants—A Review. Materials 2014, 7, 8168–8188. [Google Scholar] [CrossRef] [PubMed] [Green Version]
  5. Zhang, L.-C.; Attar, H. Selective Laser Melting of Titanium Alloys and Titanium Matrix Composites for Biomedical Applications: A Review. Adv. Eng. Mater. 2016, 18, 463–475. [Google Scholar] [CrossRef]
  6. Li, P.; Warner, D.H.; Fatemi, A.; Phan, N. Critical Assessment of the Fatigue Performance of Additively Manufactured Ti–6Al–4V and Perspective for Future Research. Int. J. Fatigue 2016, 85, 130–143. [Google Scholar] [CrossRef]
  7. Schmidt, M.; Merklein, M.; Bourell, D.; Dimitrov, D.; Hausotte, T.; Wegener, K.; Overmeyer, L.; Vollertsen, F.; Levy, G.N. Laser Based Additive Manufacturing in Industry and Academia. CIRP Ann. 2017, 66, 561–583. [Google Scholar] [CrossRef]
  8. DebRoy, T.; Wei, H.L.; Zuback, J.S.; Mukherjee, T.; Elmer, J.W.; Milewski, J.O.; Beese, A.M.; Wilson-Heid, A.; De, A.; Zhang, W. Additive Manufacturing of Metallic Components—Process, Structure and Properties. Prog. Mater. Sci. 2018, 92, 112–224. [Google Scholar] [CrossRef]
  9. Wang, S.C.; Aindow, M.; Starink, M.J. Effect of Self-Accommodation on α/α Boundary Populations in Pure Titanium. Acta Mater. 2003, 51, 2485–2503. [Google Scholar] [CrossRef]
  10. Sofinowski, K.; Šmíd, M.; Kuběna, I.; Vivès, S.; Casati, N.; Godet, S.; Van Swygenhoven, H. In Situ Characterization of a High Work Hardening Ti-6Al-4V Prepared by Electron Beam Melting. Acta Mater. 2019, 179, 224–236. [Google Scholar] [CrossRef]
  11. De Formanoir, C.; Martin, G.; Prima, F.; Allain, S.Y.P.; Dessolier, T.; Sun, F.; Vivés, S.; Hary, B.; Bréchet, Y. Micromechanical Behavior and Thermal Stability of a Dual-Phase A+α’ Titanium Alloy Produced by Additive Manufacturing. Acta Mater. 2019, 162, 149–162. [Google Scholar] [CrossRef] [Green Version]
  12. Shipley, H.; McDonnell, D.; Culleton, M.; Coull, R.; Lupoi, R.; O’Donnell, G.; Trimble, D. Optimisation of Process Parameters to Address Fundamental Challenges during Selective Laser Melting of Ti-6Al-4V: A Review. Int. J. Mach. Tools Manuf. 2018, 128, 1–20. [Google Scholar] [CrossRef]
  13. Raghavan, S.; Nai, M.L.S.; Wang, P.; Sin, W.J.; Li, T.; Wei, J. Heat Treatment of Electron Beam Melted (EBM) Ti-6Al-4V: Microstructure to Mechanical Property Correlations. Rapid Prototyp. J. 2018, 24, 774–783. [Google Scholar] [CrossRef]
  14. Günther, J.; Krewerth, D.; Lippmann, T.; Leuders, S.; Tröster, T.; Weidner, A.; Biermann, H.; Niendorf, T. Fatigue Life of Additively Manufactured Ti–6Al–4V in the Very High Cycle Fatigue Regime. Int. J. Fatigue 2017, 94, 236–245. [Google Scholar] [CrossRef]
  15. Gong, H.; Rafi, K.; Gu, H.; Janaki Ram, G.D.; Starr, T.; Stucker, B. Influence of Defects on Mechanical Properties of Ti–6Al–4V Components Produced by Selective Laser Melting and Electron Beam Melting. Mater. Des. 2015, 86, 545–554. [Google Scholar] [CrossRef]
  16. Takase, A.; Ishimoto, T.; Suganuma, R.; Nakano, T. Lattice Distortion in Selective Laser Melting (SLM)-Manufactured Unstable β-Type Ti-15Mo-5Zr-3Al Alloy Analyzed by High-Precision X-Ray Diffractometry. Scr. Mater. 2021, 201, 113953. [Google Scholar] [CrossRef]
  17. Ida, T.; Shimazaki, S.; Hibino, H.; Toraya, H. Diffraction Peak Profiles from Spherical Crystallites with Lognormal Size Distribution. J. Appl. Crystallogr. 2003, 36, 1107–1115. [Google Scholar] [CrossRef]
  18. Ishimoto, T.; Hagihara, K.; Hisamoto, K.; Sun, S.-H.; Nakano, T. Crystallographic Texture Control of Beta-Type Ti–15Mo–5Zr–3Al Alloy by Selective Laser Melting for the Development of Novel Implants with a Biocompatible Low Young’s Modulus. Scr. Mater. 2017, 132, 34–38. [Google Scholar] [CrossRef]
  19. Sun, S.-H.; Ishimoto, T.; Hagihara, K.; Tsutsumi, Y.; Hanawa, T.; Nakano, T. Excellent Mechanical and Corrosion Properties of Austenitic Stainless Steel with a Unique Crystallographic Lamellar Microstructure via Selective Laser Melting. Scr. Mater. 2019, 159, 89–93. [Google Scholar] [CrossRef]
  20. Standard Test Method for Verifying the Alignment of X-Ray Diffraction Instrumentation for Residual Stress Measurement—Designation: E 915—96 (Reapproved 2002); ASTM International: West Conshohocken, PA, USA, 2002.
  21. SAE_HS-784 Residual Stress Measurement by X-Ray Diffraction 2003 Edition; SAE International: Warrendale, PA, USA, 2003.
  22. Collings, E.W. The Physical Metallurgy of Titanium Alloys, 1st ed.; American Society for Metals: Metals Park, OH, USA, 1984; Volume 3, p. 116. [Google Scholar]
  23. John, A.S.; Robert, L.W., Jr. Certificate SRM 660c—Line Position and Line Shape Standard for Powder Diffraction (Lanthanum Hexaboride Powder); National Institute of Standards & Technology March 10 Edition; National Institute of Standards & Technology: Gaithersburg, MD, USA, 2015. [Google Scholar]
  24. Pawley, G.S. Unit-Cell Refinement from Powder Diffraction Scans. J. Appl. Crystallogr. 1981, 14, 357–361. [Google Scholar] [CrossRef]
  25. Mitsunaga, T.; Saigo, M.; Fujinawa, G. High-Precision Parallel-Beam X-Ray System for High-Temperature Diffraction Studies. Powder Diffr. 2002, 17, 173–177. [Google Scholar] [CrossRef]
  26. Takase, A. Effect of Systematic Errors on Lattice Parameter Refinement. 60th Annu. Conf. Appl. X-Ray Anal. 2011, D-81. [Google Scholar]
  27. Langford, J.; Delhez, R.; de Keijser, T.; Mittemeijer, E. Profile Analysis for Microcrystalline Properties by the Fourier and Other Methods. Aust. J. Phys. 1988, 41, 173. [Google Scholar] [CrossRef] [Green Version]
  28. Stephens, P.W. Phenomenological Model of Anisotropic Peak Broadening in Powder Diffraction. J. Appl. Crystallogr. 1999, 32, 281–289. [Google Scholar] [CrossRef]
  29. Bish, D.L.; Howard, S.A. Quantitative Phase Analysis Using the Rietveld Method. J. Appl. Crystallogr. 1988, 21, 86–91. [Google Scholar] [CrossRef]
  30. Willy, H.J.; Li, X.; Chen, Z.; Herng, T.S.; Chang, S.; Ong, C.Y.A.; Li, C.; Ding, J. Model of Laser Energy Absorption Adjusted to Optical Measurements with Effective Use in Finite Element Simulation of Selective Laser Melting. Mater. Des. 2018, 157, 24–34. [Google Scholar] [CrossRef]
  31. Knapp, G.L.; Raghavan, N.; Plotkowski, A.; DebRoy, T. Experiments and Simulations on Solidification Microstructure for Inconel 718 in Powder Bed Fusion Electron Beam Additive Manufacturing. Addit. Manuf. 2019, 25, 511–521. [Google Scholar] [CrossRef]
  32. Gokcekaya, O.; Ishimoto, T.; Hibino, S.; Yasutomi, J.; Narushima, T.; Nakano, T. Unique Crystallographic Texture Formation in Inconel 718 by Laser Powder Bed Fusion and Its Effect on Mechanical Anisotropy. Acta Mater. 2021, 212, 116876. [Google Scholar] [CrossRef]
  33. Chen, Q.; Liang, X.; Hayduke, D.; Liu, J.; Cheng, L.; Oskin, J.; Whitmore, R.; To, A.C. An Inherent Strain Based Multiscale Modeling Framework for Simulating Part-Scale Residual Deformation for Direct Metal Laser Sintering. Addit. Manuf. 2019, 28, 406–418. [Google Scholar] [CrossRef]
  34. EOS M 290—Industrial 3D Printed Parts from Metal Materials. Available online: https://www.eos.info/en/Additive-Manufacturing/3d-Printing-Metal/Eos-Metal-Systems/Eos-m-290 (accessed on 16 June 2021).
  35. Foroozmehr, A.; Badrossamay, M.; Foroozmehr, E.; Golabi, S. Finite Element Simulation of Selective Laser Melting Process Considering Optical Penetration Depth of Laser in Powder Bed. Mater. Des. 2016, 89, 255–263. [Google Scholar] [CrossRef]
  36. Pham, M.-S.; Dovgyy, B.; Hooper, P.A.; Gourlay, C.M.; Piglione, A. The Role of Side-Branching in Microstructure Development in Laser Powder-Bed Fusion. Nat. Commun. 2020, 11, 749. [Google Scholar] [CrossRef]
  37. Carslaw, H.S.; Jaeger, J.C. Conduction of Heat in Solids, 2nd ed.; Oxford University Press: Oxford, UK, 1986. [Google Scholar]
  38. Li, Y.; Gu, D. Parametric Analysis of Thermal Behavior during Selective Laser Melting Additive Manufacturing of Aluminum Alloy Powder. Mater. Des. 2014, 63, 856–867. [Google Scholar] [CrossRef]
  39. Umezawa, O.; Ishikawa, K. Electrical and Thermal Conductivities and Magnetization of Some Austenitic Steels, Titanium and Titanium Alloys at Cryogenic Temperatures. Cryogenics 1992, 32, 873–880. [Google Scholar] [CrossRef]
  40. Deem, H.W.; Wood, W.D.; Lucks, C.F. The Relationship between Electrical and Thermal Conductivities of Titanium Alloys. Trans. Met. Soc. AIME 1958, 212, 520–523. [Google Scholar]
  41. Cezairliyan, A.; McClure, J.L.; Taylor, R. Thermophysical Measurements on 90Ti-6al-4V Alloy above 1450 K Using a Transient (Subsecond) Technique. J. Res. Natl. Bur. Stand. Sect. Phys. Chem. 1977, 81A, 251. [Google Scholar] [CrossRef]
  42. NIST: National Institute of Standards and Technology. Available online: https://trc.nist.gov/cryogenics/materials/materialproperties.htm (accessed on 12 June 2021).
  43. Toby, B.H. R Factors in Rietveld Analysis: How Good Is Good Enough? Powder Diffr. 2006, 21, 67–70. [Google Scholar] [CrossRef] [Green Version]
  44. Cottam, R.; Palanisamy, S.; Avdeev, M.; Jarvis, T.; Henry, C.; Cuiuri, D.; Balogh, L.; Abdul Rahman Rashid, R. Diffraction Line Profile Analysis of 3D Wedge Samples of Ti-6Al-4V Fabricated Using Four Different Additive Manufacturing Processes. Metals 2019, 9, 60. [Google Scholar] [CrossRef] [Green Version]
  45. Hull, A.; Bacon, D.J. Introduction to Dislocations, 5th ed.; Butterworth-Heinemann: Oxford, UK, 2009; p. 111. [Google Scholar]
  46. Welsch, G.; Boyer, R.; Collings, E. Materials Properties Handbook: Titanium Alloys, Materials Properties Handbook; ASM International: Geauga County, OH, USA, 1993. [Google Scholar]
  47. Sabban, R.; Bahl, S.; Chatterjee, K.; Suwas, S. Globularization Using Heat Treatment in Additively Manufactured Ti-6Al-4V for High Strength and Toughness. Acta Mater. 2019, 162, 239–254. [Google Scholar] [CrossRef]
  48. Yang, J.; Yu, H.; Yin, J.; Gao, M.; Wang, Z.; Zeng, X. Formation and Control of Martensite in Ti-6Al-4V Alloy Produced by Selective Laser Melting. Mater. Des. 2016, 108, 308–318. [Google Scholar] [CrossRef]
  49. Sames, W.J.; Unocic, K.A.; Dehoff, R.R.; Lolla, T.; Babu, S.S. Thermal Effects on Microstructural Heterogeneity of Inconel 718 Materials Fabricated by Electron Beam Melting. J. Mater. Res. 2014, 29, 1920–1930. [Google Scholar] [CrossRef] [Green Version]
  50. Wang, Z. Effect of Processing Parameters on Microstructure and Tensile Properties of Austenitic Stainless Steel 304L Made by Directed Energy Deposition Additive Manufacturing. Acta Mater. 2016, 10, 226–235. [Google Scholar] [CrossRef] [Green Version]
  51. Galarraga, H.; Warren, R.J.; Lados, D.A.; Dehoff, R.R.; Kirka, M.M.; Nandwana, P. Effects of Heat Treatments on Microstructure and Properties of Ti-6Al-4V ELI Alloy Fabricated by Electron Beam Melting (EBM). Mater. Sci. Eng. A 2017, 685, 417–428. [Google Scholar] [CrossRef] [Green Version]
Figure 1. (a) Appearance of L-PBF-made parts. From the left, L-PBF-360W-Fast-X, XY, Rot, L-PBF-75W-Slow-X, XY, Rot; (b) The appearance of EB-PBF-made parts. From the left, EB-PBF-900W-Slow-X, XY, Rot, EB-PBF-750W-Fast-X, XY, Rot; (c) Measurement locations are shown with the part dimensions, coordinate axes, and layer growth direction. Each of the “measured spots” is 4 mm long in the Z direction and 1–3 mm wide in the X or Y direction, depending on the X-ray incident angle.
Crystals 11 00796 g001
Figure 2. X-scan, XY-scan, and Rot-scan strategies.
Crystals 11 00796 g002
Figure 3. Horizontal and vertical residual stress components, σX, σY, and σZ shown at the center of the Z-axis.
Crystals 11 00796 g003
Figure 4. WPF analysis result of L-PBF-360W-Fast-X on the XZ plane at Z = 25 mm.
Crystals 11 00796 g004
Figure 5. Crystallite size of the α or α’ phase versus random lattice strain of the α or α’ phase scatter plots for all L-PBF and EB-PBF parts. Random lattice strain in (a) the a-axis and (b) the c-axis directions. A correlation between the crystallite size and the random lattice strain, and the separation of the L-PBF and EB-PBF data points are seen.
Crystals 11 00796 g005aCrystals 11 00796 g005b
Figure 6. Crystallite size of the α or α’ phase versus c/a of the α or α’ phase scatter plot for all L-PBF and EB-PBF parts. A correlation between the crystallite size and c/a, and the separation of the L-PBF and EB-PBF data points are seen.
Crystals 11 00796 g006
Figure 7. Crystallite size of the α or α’ phase versus the β quantity scatter plot for all L-PBF parts. A correlation between the crystallite size and the β quantity is seen.
Crystals 11 00796 g007
Figure 8. SEM images of the representative microstructures: (left) L-PBF-360W-Fast-X; (right) EB-PBF-900W-Slow-X.
Crystals 11 00796 g008
Figure 9. α or α’ phase lattice parameters measured at different locations on (a) L-PBF-360W-Fast-X and (b) L-PBF-75W-Slow-X. The data points on the front sides, colored red and blue in Figure 1, are shown. The c-axis became longer as the parts grew in the Z-direction. This trend was more significant in L-PBF-360W-Fast-X than in PBF-75W-Slow-X. In L-PBF-360W-Fast-X, the c-axis on the XZ plane was longer than that on the YZ plane.
Crystals 11 00796 g009
Figure 10. α or α’ phase lattice parameters measured at different locations on (a) EB-PBF-900W-Slow-X and (b) EB-PBF-750W-Fast-X. The data points on the front sides, colored red and blue in Figure 1, are shown. The a-axis was long at the beginning of the growth process and then became shorter as the parts grew in the Z direction. This trend is more significant on the YZ plane than on the XZ plane.
Crystals 11 00796 g010
Figure 11. Averaged residual stresses over all Z positions and scan strategies for four types of process conditions.
Crystals 11 00796 g011
Figure 12. Heat transfer simulation for L-PBF-360W-Fast-X and L-PBF-75W-Slow-X: (a) Temperatures calculated at 20 µm depth from the center of the XZ and YZ plane surfaces for L-PBF-360W-Fast-X and L-PBF-75W-Slow-X; (b) Heating/cooling rates calculated at the same location for L-PBF-360W-Fast-X; (c) Heating/cooling rates calculated at the same location for L-PBF-75W-Slow-X. The moments the temperature reached the β transus temperature are marked as a red circle for the L-PBF-360W-Fast-X XZ plane, a blue circle for the L-PBF-360W-Fast-X YZ plane, a red square for the L-PBF-75W-Slow-X XZ plane, and a blue square for the L-PBF-75W-Slow-X YZ plane.
Crystals 11 00796 g012
Figure 13. L-PBF process parameters and α’ → α+β phase evolution.
Crystals 11 00796 g013
Figure 14. EB-PBF process parameters and α’ → α phase evolution.
Crystals 11 00796 g014
Table 1. Process conditions.
NameTechnique Beam Power (W)Scan Speed (mm/s)Scan Strategy
L-PBF-360W-Fast-XL-PBF 3601200X
L-PBF-360W-Fast-XYL-PBF 3601200XY
L-PBF-360W-Fast-RotL-PBF 3601200Rot
L-PBF-75W-Slow-XL-PBF 75250X
L-PBF-75W-Slow-XYL-PBF 75250XY
L-PBF-75W-Slow-RotL-PBF 75250Rot
NameTechniqueBeam Current (mA)Beam Power (W)Scan Speed (mm/s)Scan Strategy
EB-PBF-900W-Slow-XEB-PBF159005000X
EB-PBF-900W-Slow-XYEB-PBF159005000XY
EB-PBF-900W-Slow-RotEB-PBF159005000Rot
EB-PBF-750W-Fast-XEB-PBF12.57506000X
EB-PBF-750W-Fast-XYEB-PBF12.57506000XY
EB-PBF-750W-Fast-RotEB-PBF12.57506000Rot
Publisher’s Note: MDPI stays neutral with regard to jurisdictional claims in published maps and institutional affiliations.

