Abstract
Two glass-ceramics sealants for solid-oxide fuel cells (SOFC) in the system BaO/SrO-MgO-B2O3-SiO2 have been analysed according to relevant sealing parameters such as sintering and crystallization of the glass powders and dilatation and viscosity evolution with crystallization of glass-ceramic compacts. Special emphasis is given to the crystallization kinetics and mechanism, crystalline phases formed and the role of viscosity in the whole sealing process. The slower crystallization rate of the strontium-containing glass composition results in good joining with the interconnect steel before the glass starts to crystallize and increases its viscosity. This avoids and excessive sealing temperature and offers better compatibility with the start up and working temperature of an SOFC (750–850 °C).
1. Introduction
Solid oxide fuel cells (SOFC) have experienced a great development due to their high efficiency in electrical energy generation without the emission of pollutant gases [1,2]. The improvement of these devices includes the production of glass-ceramic sealants with suitable mechanical properties to fulfil the cells requirements in order to prevent gas leakages and ensure the optimal cell performance [3,4].
The glass sealant application is carried out in powder form, which requires a milling and sieving process to obtain suitable particle sizes for each sealing application method (paste technology with a robot dispenser, tape casting, screen printing, etc…). The glass powder will sinter and crystalize following the start-up heating program of the SOFC up to the operation temperature around 800 °C with the subsequent increase in viscosity in the transformation from glass into a glass-ceramic, which leads to a stable and rigid seal. The presence of crystalline phases in the glass-ceramic with thermal expansion coefficient compatible with those of the stack components ensures a good thermomechanical behavior after prolonged thermal treatment at the operation temperature and versus thermal cycling of the stack. The glass composition must be designed then to ensure a good fitting of its thermal properties to this thermal program, and the glass crystallization must provide highly stable and compatible crystalline phases [5,6]. There is a vast body of research done on this topic that has been reflected in more than 500 papers (Scopus) in the last twenty years. Some papers are dealing directly with the optimization of the processing parameters of the sealant glass-ceramics, and some examples can be found in [7,8,9,10,11,12,13].
Two glass compositions within the system BaO/SrO-MgO-B2O3-SiO2, 7.5B(Ba) and 10B(Sr) have been selected due to their suitable thermal expansion coefficient, sinterability and adherence to the substrates to be sealed (mainly the interconnect material Crofer22APU or Crofer22H and the YSZ electrolyte). The thermal, mechanical and gas-tightness properties of these compositions have been discussed in previous papers [14,15], and in this work, we only focus on the sintering/crystallization behaviour of glass powders of different particle sizes optimized to obtain dense glass-ceramic pieces for the dilatation or viscosity measurements and/or suitable sealing pastes to produce glass-ceramic coating layers. The crystallization kinetics and mechanism have also been studied using differential thermal analysis (DTA). Finally, the evolution of the glass-ceramics thermal expansion and viscosity with the crystallization thermal treatment has been measured, identifying the best glass composition for sealing.
2. Materials and Methods
Two glass compositions in the system BaO/SrO-MgO-B2O3-SiO2 were prepared, one with BaO and named 7.5B(Ba) (27BaO.18MgO.7.5B2O3.47.5SiO2mol%.) and another containing SrO and named 10B(Sr) (27SrO.18MgO.10B2O3.45SiO2 mol%.). They were melted following the same procedure previously described in [14]. The molten glass was poured into brass moulds to get bulk glass samples and also in water to obtain glass frits. The glass frits were milled in a planetary mill using agate mortars, and the powders were sieved to obtain fractions with different particle size (<40 μm, <63 μm, <80 μm, 80–20 µm and 100–20 μm). The particle size distributions were characterized with a Mastersizer from Malvern Panalytical.
The glasses were chemically analysed using a X-ray fluorescent spectrometer MagiX 2400 (Malvern Panalytical, Malvern, UK), and B2O3 was determined by inductively coupled plasma atomic emission spectroscopy (ICP-OES) in a spectrometer Agilent 700 Series (Agilent Scientific Instruments, Santa Clara, CA, USA) [16].
Differential thermal analyses (DTA) of the glass powders were performed with a DTA/DSC/TG model Q600 (TA Instruments, New Castle, DE, USA) at different heating rates from 2 to 40 K/min. Transition temperature (Tg), the temperature of beginning of crystallization (Tx) and crystallization peak temperatures (Tp) were determined. The following calculations were performed from DTA curves: Avrami parameter (n) by Ozawa [17] and Avramov equations [18,19]; the activation crystallization energy from Kissinger, Takhor and Augis- Bennet equations (KTAB) [20]; and m (dimensionality of crystal growth), determined with the help of Marseglia and Matusita equations [21,22].
The sintering and flow behaviours of the glass powders with different particle sizes were studied by hot-stage microscopy (HSM) with a Hesse Instruments microscope (Hesse Instruments, Lower Saxony, Germany) with Leica-Microsystems optics (Leica Microsystems, Wetzlar, Germany) and image analysis EMI. Alumina plates were used as substrates for the glass powder samples. More details about the procedure can be found in [13].
Pressed pellets of glass powders with particle sizes 80–20 µm (powders were sieved using a sieve of 80 µm and then another of 20 µm, and this is the fraction between the two sizes) for 7.5B(Ba) and <63 µm for 10B(Sr) were prepared (these sizes were optimal to obtain dense glass-ceramics). The pellets were treated during 24, 100, 300, 800 and 1500 h at 800 °C for 7.5B(Ba) and at 750 °C for 10B(Sr) (heating rate 5 °C/min, cooling rate 1 °C/min), and the samples were rectified for dilatometric measurements. The two glasses have different viscosity–temperature curves, so these different treatment temperatures were chosen in order to obtain high densification while avoiding deformation of the glass-ceramic pieces so they keep their shape.
Dilatometric curves for the original glasses and pressed pellets were measured at 5 °C/min up to 800 °C, and the TEC was calculated between 200 and 500 °C in order to be compared with the starting glass and the typical SOFC interconnect steal (Crofer22APU and Crofer22H). A Netzsch Gerätebau402 EP dilatometer (Netzsch, Selb, Germany) equipped with a silica support was used [13].
A beam-bending viscometer VIS401 Bahr Thermoanalyse (Bahr-Thermoanalyse GmbH, Hullhorst, Germany) was used with a three-point configuration with a separation of 40 mm between the two inferior points. The samples were rectangular bars of base glass and glass-ceramics ∼45 × 4 × 3 mm. The glass-ceramic bars were obtained by uniaxial press of glass powders followed by thermal treatments at 800 °C for 7.5B(Ba) and 750 °C for 10B(Sr) up to a maximum time of 100 hours. The measurements were carried out applying constant loads between 10 and 200 g and a heating rate of 2 °C/min [14].
3. Results and Discussion
3.1. Chemical Analysis
The chemical composition of the glasses was measured first in order to have control of the concentration of oxide formers and modifiers and then on the melting process. The second objective was the identification of the possible volatilization of B2O3 due to the high melting temperature employed and its low thermal stability compared with the alkaline-earth oxides [23] in these compositions. This oxide considerably improves the adherence of the sealing glass. Table 1 shows the theoretical and analyzed compositions in mol%. and weight %.

Table 1.
Theoretical and analyzed compositions.
No relevant changes have been detected in any of the analysed glasses. All the main components presented a minimum variation of the percentage, except for MgO, whose percentage diminishes in both glasses with losses of 6 and 14 wt% for the composition of Sr and Ba, respectively. These losses can be associated with volatilizations of this oxide at the melting temperature.
On the contrary, no volatilization of B2O3 was observed after the melting process, since both compositions showed practically the same analysed and theoretical values. There were several impurities in both compositions of alkaline and alkaline-earth oxides, which could have come from impurities in the raw materials and small contaminations during the melting process.
3.2. Sintering Behaviour
Initially, different particle sizes (<40 µm, <63 µm, <80 µm, 80–20 µm and 100–20 µm) were investigated in order to obtain the optimum densification of the glass-ceramics after thermal treatment. The highest densification for the glass powder pellets and bars was obtained with the particle size 80–20 µm for 7.5B(Ba) (treatments at 800 °C) and for 10B(Sr) with the size <63 µm (treatments at 750 °C). Relative densities between 0.99 and 0.98 and contraction in volume between 35 and 39% were obtained. These sizes together with that <40 µm with an average particle size of 13 µm, from now on designated as fine powder, were selected to study the sintering kinetics employing different heating rates using hot-stage microscopy (HSM). The size of this fine powder was optimized for the sealant application with a dispenser robot, tape casting or screen printing in an SOFC simulator. The selected particle size distributions are shown in Figure 1 and with detailed values in Table 2.
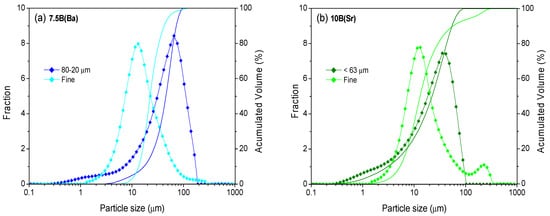
Figure 1.
Particle size distribution of the two studied fractions (a) 7.5B(Ba) and (b) 10B(Sr).
Table 2.
Particle sizes of the glass powders (± 0.5 µm).
Three heating rates were used for the study by HSM (2, 5 and 10 °C/min). The rate for the start-up and sealing in an SOFC is normally slow since a high rate can produce temperature gradients provoking stresses in the materials and leading to cracks and curvatures with the consequent failure of the stack. The more relevant heating rate for a SOFC is then 2 °C/min. Figure 2a,b shows the HSM curves (area variation A/A0 as a function of temperature) for both compositions 7.5B(Ba) and 10B(Sr), respectively. Table 3 summarizes the characteristic temperatures obtained from these experiments, which include first shrinkage (TFS), maximum shrinkage (TMS), softening temperature (TS), half ball (THB) and flow (TF) [24].
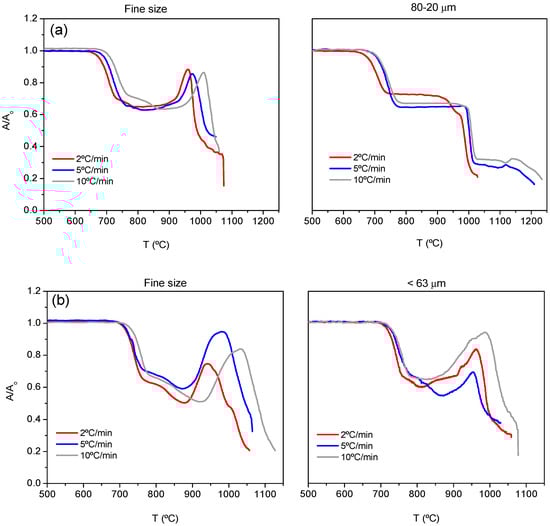
Figure 2.
HSM curves for compositions (a) 7.5(Ba) and (b) 10B(Sr).
Table 3.
Characteristic temperatures from HSM curves.
In Figure 2a,b, the increase in heating rate gives a delay in the beginning and end of sintering as well as the rest of the following processes: softening, half ball and flow. A greater particle size produces a similar effect. The values of these temperatures can be found in Table 3. An expansion of the samples is observed in the high-temperature region due to a foaming phenomenon, which is more remarkable with the smaller particle size. This foaming is due to the elimination of gases such as CO2 as described in [10]. It is not observed for a particle size of 80–20 μm. This phenomenon makes the determination of the softening as well as half-ball temperatures difficult.
The best densification was obtained for a heating rate of 5 °C/min for both fine powder and 80–20 μm but when pellets are prepared and treated at 800 °C for different times, the greater size leads to better relative density around 0.98, and in this way, this particle size was used for preparing bulk glass-ceramics pellets and bars for dilatometry and viscosity measurements.
In the case of 10B(Sr), both particle sizes provide good densification. The best results were obtained when pellets were prepared from the particle size <63 microns and treated at 750 °C for different times (heating rate 5 °C/min) so this size was used for pellets and bars preparation. The temperatures of 800 and 750 °C for 7.5B(Ba) and10B(Sr) were adjusted to avoid sample deformation.
3.3. Influence of the Glass Powder Particle Size and the Heating Rate in the DTA Characteristic Temperatures: Crystallization Mechanism
Figure 3 shows the DTA scans at different heating rates and for the two selected particle sizes for each composition. As previously mentioned, the very fine powder is the one practically used for the sealing application, but other particle sizes 80–20 microns and <63 were those optimized to obtain glass-ceramic well-densified pieces [14,15].
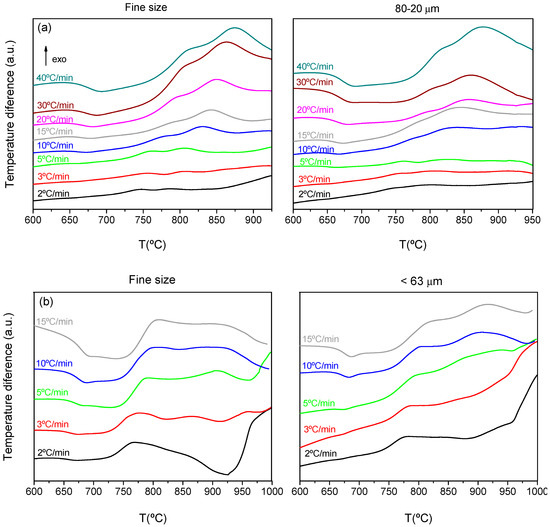
Figure 3.
DTA curves for (a) 7.5B(Ba) and (b) 10B(Sr) compositions at different heating rates.
The DTA curves provided the characteristic temperatures, which are represented in Table 4. There is a wide peak of crystallization with two maxima, which indicate the presence of two crystallization peaks occurring at similar temperatures. For the calculation of each peak temperature, the signal was adjusted to two Gaussian peaks and the maximum of each gaussian was taken as the peak temperature, Tp1 and Tp2 in Table 4. When increasing the heating rate, all the crystallization temperatures shifted to higher temperatures. The nucleation time decreased with higher heating rates, reducing the nuclei formation and further crystallization and leading to crystallization peaks appearing at higher temperatures [25,26].
Table 4.
Characteristic temperatures obtained from the DTA curves.
The particle size had a similar effect on the temperatures, so when increasing the particle size, the crystallization peaks shifted to higher temperatures.
Another relevant value in Table 4 is the parameter Tx − Tg; this difference indicates the glass stability versus crystallization. The largest this value, the higher the glass thermal resistance versus crystallization. This parameter is slightly higher for 10B(Sr), so this composition will crystallize slower than 7.5B(Ba).
In order to study the crystallization mechanism, the Avrami parameter (n) was calculated. The calculation has been done in two ways, firstly employing Ozawa equation [17] and then the Avramov equation [18,19] to confirm the obtained results. Figure 4 shows Ozawa plots for 7.5B(Ba) glass, and all the fits showed a regression (r2) equal to 0.97 or higher. Together with the fitted lines, the medium value of n is given with its deviation, so for both studied sizes n is ~1. No variation of the n parameter with temperature was observed.
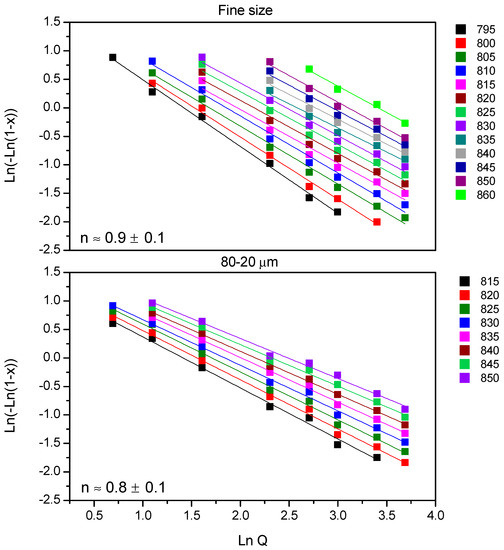
Figure 4.
Determination of the n parameter from Ozawa representation for 7.5B(Ba) glass.
Figure 5 shows the results using the Avramov equation for 7.5B(Ba) glass; all the fits gave a regression coefficient (r2) equal to 0.96 or higher. The medium value n is indicated inside the graphs together with its deviation, 1.2 ± 0.2 for the fine powder and 1.0 ± 0.2 for the size 80–20 µm, so for both studied sized n ~ 1. Again, no variation of this parameter with temperature was observed.
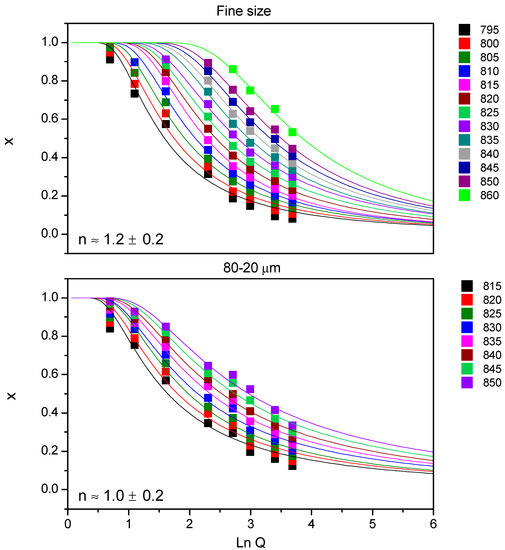
Figure 5.
Determination of the n parameter for 7.5B(Ba) glass: Avramov method.
The two employed methods for the calculation of n parameter are similar, although slightly superior values were obtained from the Avramov method, both can be approached to n ~ 1 in composition 7.5B(Ba).
The same procedure was employed for 10B(Sr) composition. The Ozawa plots (figure not shown) for the fine powder and for <63 μm provided fits with a regression coefficient (r2) equal to 0.97 or higher. The medium n value was 0.8 ± 0.1 for the fine size and 0.9 ± 0.1 for the size <63 µm, so for both studied sizes, n is ~ 1. Similar to the previous composition, there was no variation of the n parameter with temperature.
The results obtained by the Avramov method for the glass 10B(Sr) (figure not shown) provided fits with a regression coefficient (r2) of 0.96 or higher. The average value of n together with its deviation was 1.2 ± 0.1 for the fine size and 1.3 ± 0.1 for <63 µm, so for both sizes, n ~ 1 and similarly, no variation of n with temperature was observed.
Again, the two employed methods for the calculation of n parameter lead to similar results although also slightly higher for the Avrami method. All n values for this composition are close to 1.
Once the n value was determined, the calculation of the activation energy has been carried out for the two crystallization peaks, taking into account two hypotheses:
- (1)
- n = m, for which the KTAB equations have been employed.
- (2)
- n ≠ m, for which the Marseglia and Matusita equations have been employed, the m value has been obtained from this last equation.
The results of both hypotheses were applied for the two particle sizes for both compositions, and results are only shown for the fine size (Figure 6a,b). The values obtained for the activation energy from the fits of these equations are summarized in Table 5 and Table 6.
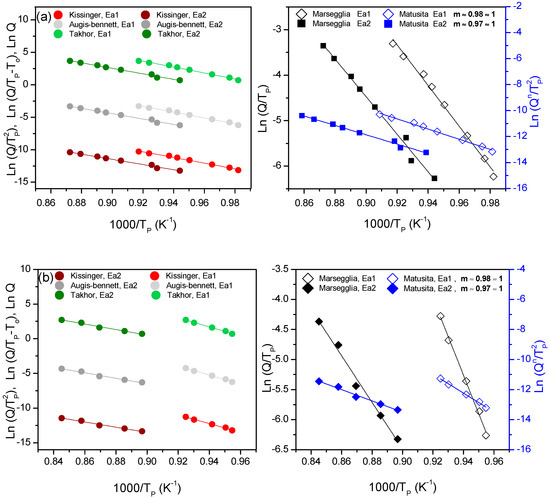
Figure 6.
Representations of Kissinger, Augis-Bennet and Takhor on the left and representations of Marseglia and Matusita on the right for the two crystallization peaks and the fine particle size for composition (a) 7.5B(Ba) and (b) 10B(Sr).
Table 5.
Activation energies for 7.5B(Ba) glass.
Table 6.
Activation energies for 10B(Sr) glass.
For both compositions, the m value is approximately 1 for all the studied sizes, so n ~ m ~ 1. Once the n and m values were obtained, and taking into account that n value does not change with temperature, the crystallization mechanism can be determined from Donald´s work [27], concluding that the studied glass powders have a preferential superficial crystallization mechanism.
The KTAB equations are valid in this case, since n ~ m ~ 1. The obtained values for 7.5B(Ba) do not show a large dependence of the activation energy with the particle size, although the size 80–20 µm shows slightly higher values in the second crystallization peak and practically equal for the first peak. Both peaks present similar activation energies for the two particle sizes; this is because they are very close in temperature. The barium glass (55(Ba)) (without boron) presents activation energies of 464 KJ/mol [28] about 100 KJ/mol more than the energy calculated for the 7.5B(Ba) composition, so the addition of B2O3 significantly reduces the crystallization activation energy.
Similarly, KTAB equations are valid for 10B(Sr) glass, since n ~ m ~ 1. The obtained values show a larger dependence of the activation energy with the particle size for the first peak. Similar values in the activation energy of the second peak were obtained for both sizes. The activation energy difference between the two peaks is higher due to their larger difference in temperature.
The two studied compositions undergo a surface crystallization mechanism, and the activation energy of the barium compositions is similar in both peaks and around 350 KJ/mol, while the activation energy for the strontium one is between 540–440 KJ/mol for the first crystallization peak and around 300 KJ/mol for the second one. These data are in agreement with a lower tendency for crystallization of the strontium glass.
3.4. Thermal Expansion
The study of the crystallization kinetics revealed a crystallization rate higher for the fine sizes, but the final crystalline phases after long thermal treatments (from 24 to 1500 hours) are the same employing a different particle size. The study of the evolution of the crystalline phases with the thermal treatment showed a stabilization of the main phases after 100h in both compositions. All the details of crystalline phases present and final microstructures were previously reported in [14,15]. The predominant crystalline phases were BaSi2O5 (BS2), BaMg2Si2O7 (BM2S2), Ba5Si8O21 (B5S8), Ba2Si3O8 (B2S3) and Ba3B6Si2O16 (B3B6S2) for composition 7.5B(Ba) and SrMgSi2O6 (SMS2), SiO2, SrSiO3 (SS) and SrB2Si2O8 (SB2S2) for composition 10B(Sr). The glass-ceramics microstructure investigated showed a low degree of crystallization for glass-ceramic 10B(Sr) with 24h of thermal treatment but much higher for 7.5B(Ba).
Figure 7a,b shows the dilatometric curves for 7.5B(Ba) and 10B(Sr) glass-ceramics as a function of the thermal treatment. The dilatometric values obtained are summarized in Table 7 together with the values for the starting glasses and the TEC of the interconnect and electrolyte.
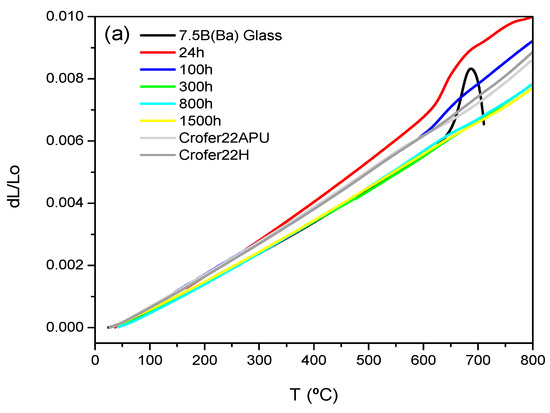
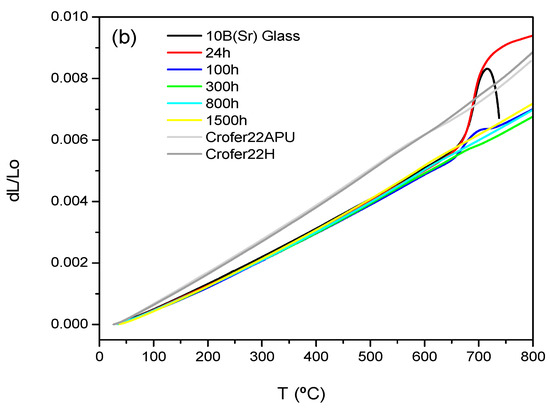
Figure 7.
Thermal expansion of the original glasses and glass-ceramics (a) 7.5B(Ba) treated at 800 °C and (b) 10B(Sr) treated at 750 °C at different times.
Table 7.
Thermal expansion coefficient of the studied glass-ceramics.
The TECs of 7.5B(Ba) and 10B(Sr) base glasses are 9.7∙10−6 K−1 and 9.2∙10−6 K−1, respectively, and both values fit well the 8YSZ TEC (10.5∙10−6 K−6) [29] and are very close to those of Crofer22APU and Crofer22H (typical interconnect materials) with a value of 11.2∙10−6 K−1. The composition 7.5B(Ba) showed an increase of TEC after 24 h and 100 h of thermal treatment with values of 12.4 and 11·10−6 K−1, respectively. After 24 h, the main crystalline phase in the glass-ceramic is BaSi2O5 with a high TEC (12.9∙10−6 K−1 between 100–800 °C) [30]. There is an increase in BaMg2Si2O7 (TEC = 10.0∙10−6 K−1 between 100–600 °C) [31] from increasing the treatment time, and new phases appear, albeit in a lower amount, such as Ba5Si8O21 (TEC = 14.5∙10−6 K−1 between 100–800 °C) and Ba2Si3O8 (TEC = 13.2∙10−6 K−1 between 100–800 °C) [31]. Despite the fact that the same crystalline phases were formed after 100 h exposure, their ratio still changed, as did the TEC. The decrease in TEC after 100 and 300 h is attributed to a greater presence BaMg2Si2O7 phase. After 300 h of thermal treatment, the TEC remained constant up to 1500 h, so the boron phase Ba3B6Si2O16 precipitating at 800 h seems not to affect TEC, since it is in less proportion in comparison to the other phases. The glass-ceramics softening after 24 and 100 h of thermal treatment occurring at high temperature in Figure 7a is due to the presence of residual glassy phase.
The 10B(Sr) glass-ceramics behave differently because thermal expansion seems not to be so much affected by crystallization; the TEC value keeps practically constant from the glass to the glass-ceramic with 1500 h of thermal treatment. As previously mentioned, the XRD characterization was published in [14,15]. The only thermal expansion data found in the literature correspond to the SrSiO3 phase (TEC = 11.2∙10−6 K−1 between 100–800 °C) [32]. In spite of the high TEC of the SrSiO3 phase, the global value of the glass-ceramic is similar to that of the starting glass, so the rest of the phases could present TECs that do not differ much from that of the glass. The softening after 24 and 100 h of thermal treatment (Figure 7b) is again attributed to the presence of the residual glass, which is especially relevant in the glass-ceramic of 24 h, also observed in the corresponding microstructure [14].
3.5. Glass-Ceramics Viscosity
The increase in viscosity of the glass-ceramics with respect to the starting glass is a key issue, since the seal must acquire a certain mechanical stability for the suitable performance of the stack. The evolution of viscosity of the glass-ceramics at high temperature as a function of the crystallization degree has been studied by the “beam-bending” method.
The thermal treatment temperature chosen for the 7.5B(Ba) composition was 800 °C, and the starting glass shows a viscosity of log η ~ 6.8 dPa.s at this temperature [15]. For the composition 10B(Sr), the chosen temperature for the thermal aging was 750 °C, and the starting glass has a viscosity of log η ~ 8.6 dPa.s at this temperature [15].
Glass-ceramic bars treated at 800 °C for 7.5B(Ba) (Figure 8) and 750 °C for 10B(Sr) (Figure 9) during different times were employed for the viscosity measurement. In both cases, the glass-ceramics viscosity has been compared with the starting glass viscosity determined with the same technique.
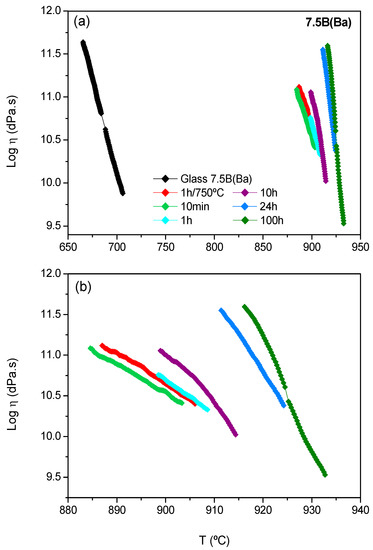
Figure 8.
(a) Viscosity of the 7.5B(Ba) glass-ceramics as a function of the crystallization degree. (b) Viscosity of the glass-ceramics (amplification). Treatment temperature: 800 °C.
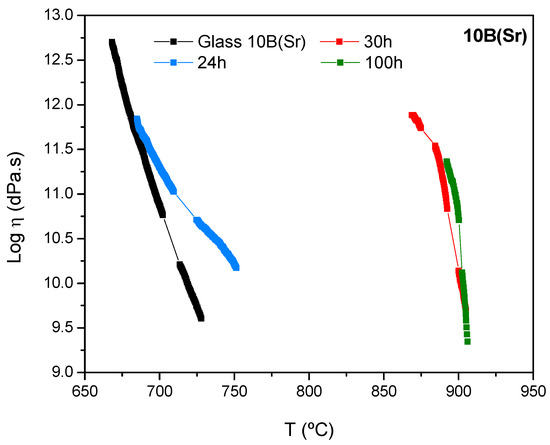
Figure 9.
Viscosity of the 10B(Sr) glass-ceramics as a function of the crystallization degree. Treatment temperature 750 °C.
In the case of 7.5B(Ba), the evolution of viscosity undergoes an important increase after 10 min of thermal treatment. This composition behaves as a rapid crystallizing glass. The increase in viscosity within the thermal treatment time takes place gradually, presenting the higher value after 100 h. Due to this high increase in viscosity, it is difficult to compare the viscosity values between the glass-ceramics and the starting glass, so the temperatures at which a viscosity of log η = 10.5 dPa.s is reached are calculated. The starting glass shows this viscosity at 690 °C, and the glass-ceramics treated during 10 min, 1 h, 10 h, 24 h and 100 h of thermal treatment have this viscosity at 901, 905, 909, 923 and 925 °C, respectively. An increase in temperature of ~ 200 °C between the glass and the glass-ceramic within 10 min of thermal treatment and other smaller increases of temperature of 10–15 °C between 10 h and 24 h took place. Finally, the viscosity values seemed to stabilize after 100 h, coinciding with the stabilization of the crystallized barium silicate phases.
The viscosity evolution with the treatment time is slower for 10B(Sr) with respect to 7.5B(Ba). The viscosity of the glass and the glass-ceramic after 24 h of treatment shows similar values at low temperature; this is due to the low crystalline fraction of the 24 h glass-ceramic. The high increase in viscosity occurs between 24 and 30 h of thermal treatment. The glass-ceramics at 30 and 100 h show similar viscosity values, probably due to a stabilization of the crystalline phases as observed by XRD [14,15].
In order to check the viscosity values, the same process was used for the 10B(Sr) composition. The base glass presents a viscosity of log η ~ 11 at 697 °C, and the glass-ceramics with 24, 30 and 100 h of thermal treatment had this viscosity value at 709, 891 and 898 °C, respectively. Again, there was an increase of temperature of ~ 200 °C between the glass and the glass-ceramic with 30 h of thermal treatment, which shows a strong increase in viscosity. Then, the values stabilized after 100 h of treatment.
The viscosity requirements at the operation temperature of the cell (> 109 dPa.s) are satisfied for both compositions. For the composition 7.5B(Ba), this viscosity was reached very quickly, but for 10B(Sr), an additional treatment time is necessary between 24 and 30 h to acquire the suitable viscosity.
The fast crystallization behaviour of the 7.5B(Ba) requires practical sealing temperatures of 1000 °C in order to get a good gas-tight seal with the SOFC interconnect materials Crofer22APU or Crofer22H; nevertheless, this is possible at lower temperatures (850 °C) with the 10B(Sr) composition [15].
4. Conclusions
The present article describes the influence of the glass powder particle size in the sintering/crystallization of two glass-ceramic compositions suitable for sealing SOFC, the crystallization mechanisms and the evolution of thermal expansion and viscosity due to crystallization during the sealing process.
The chemical analysis of the as-melted glasses shows that there is no volatilization of boron oxide during the calcination and melting. The glass-ceramics obtained after the optimization of the particle sizes and heating rate of both compositions presented relative densities around 0.98. These excellent densifications favour suitable gas-tightness properties of the seals.
The values of the Avrami parameter (n) are close to n ~ 1 for all studied compositions and sizes. Both methods for the determination of the n parameter, i.e., Ozawa and Avramov, provide similar values. Moreover, it was observed that this parameter does not significatively vary with temperature in any case. Both compositions showed a preferential surface crystallization mechanism independently of the particle size. The glass 10B(Sr) shows slightly less tendency versus crystallization, presenting activating energies of 540–300 KJ/mol, slightly higher than those of 7.5B(Ba) around 350 KJ/mol.
The evolution of the TEC with the degree of crystallization was kept between 9–12∙10−6 K−1; these values are suitable for sealing the SOFC interconnect and electrolyte. This property did not change for 10B(Sr) and kept practically constant up to the maximum thermal treatment time of 1500 h. There was an increase in TEC for 7.5B(Ba) at short treatment times, but it stabilized from 300 h keeping its value up to 1500 h.
The glass-ceramics viscosity showed values superior to log η = 9 dPa.s, in agreement with the viscosity requirements for the stack at the operation temperature of 750–800 °C. Composition 7.5B(Ba) behaves as a fast-crystallizing glass acquiring a high viscosity just only after 1h of thermal treatment. On the contrary, 10B(Sr) requires an additional time between 24 and 30 h to acquire the suitable viscosity. The slower crystallization rate of 10B(Sr) results in good joining with the interconnect steel before the glass starts to crystallize and increases its viscosity. This avoids an excessive sealing temperature and offers better compatibility with the start up and working temperature of a SOFC (750–850 °C).
Author Contributions
Conceptualization, M.J.P.; methodology, S.R.-L., M.J.P.; validation, S.R.-L., M.J.P.; formal analysis, S.R.-L.; investigation, S.R.-L., M.J.P.; resources, M.J.P.; data curation, S.R.-L., M.J.P.; writing—original draft preparation, S.R.-L., M.J.P.; writing—review and editing, S.R.-L., M.J.P.; visualization, S.R.-L., M.J.P.; supervision, M.J.P.; project administration, M.J.P.; funding acquisition, M.J.P. All authors have read and agreed to the published version of the manuscript.
Funding
This research was funded by European project FP7-JTI-CP-FCH, Working toward Mass Manufactured, Low Cost, and Robust SOFC stacks (MMLRC = SOFC), nº 278525 and PIE-CSIC 201960E016.
Institutional Review Board Statement
Not applicable.
Informed Consent Statement
Not applicable.
Data Availability Statement
Not applicable.
Conflicts of Interest
The authors declare no conflict of interest. The funders had no role in the design of the study; in the collection, analyses, or interpretation of data; in the writing of the manuscript; or in the decision to publish the results.
References
- Blum, L.; Buchkremer, H.P.; Gross, S.; Gubner, A. Solid oxide fuel cell development at Forschungszentrum Juelich. Fuel Cells 2007, 7, 204–210. [Google Scholar] [CrossRef]
- Wachsman, E.D.; Marlowe, C.A.; Lee, K.T. Role of solid oxide fuel cells in a balanced energy strategy. Energy Env. Sci. 2012, 5, 5498. [Google Scholar] [CrossRef]
- Weil, K.S. The state-of-the-art in sealing technology for solid oxide fuel cells. J. Miner. Met. Mater. Soc. 2006, 58, 37–44. [Google Scholar] [CrossRef]
- Lessing, P.A. A review of sealing technologies applicable to solid oxide electrolysis cells. J. Mater. Sci. 2007, 42, 10–3465. [Google Scholar] [CrossRef]
- Fergus, J.W. Sealants for solid oxide fuel cells. J. Power Sources 2005, 147, 46–57. [Google Scholar] [CrossRef]
- Mahapatra, M.K.; Lu, K. Glass-based seals for solid oxide fuel and electrolyzer cells- A review. Mater. Sci. Eng. Rep. 2010, 67, 65–85. [Google Scholar] [CrossRef]
- Gross, S.M.; Koppitz, T.; Remmel, I.; Reisgen, U.; Verlotski, V.; Conradt, R. Glass-ceramic composite as a new sealing material for SOFCs. Proc. Electrochem. Soc. PV 2005, 2005–2007, 1924–1931. [Google Scholar] [CrossRef]
- Goel, A.; Reddy, A.A.; Pascual, M.J.; Gremillard, L.; Malchere, A.; Ferreira, J.M.F. Sintering behavior of lanthanide-containing glass-ceramic sealants for solid oxide fuel cells. J. Mater. Chem. Chem. 2012, 22, 10042–10054. [Google Scholar] [CrossRef]
- Ertugrul, T.Y.; Celik, S.; Mat, M.D. Optimum processing parameters to improve sealing performance in solid oxide fuel cells. Ceram. Int. 2015, 41, 9834–9842. [Google Scholar] [CrossRef]
- Agea-Blanco, B.; Reinsch, S.; Müller, R. Sintering and foaming of barium silicate glass powder compacts. Front. Mater. 2016, 3, 45. [Google Scholar] [CrossRef] [Green Version]
- Silva, L.D.; Rodrigues, A.M.; Rodrigues, A.C.M.; Pascual, M.J.; Durán, A.; Cabral, A.A. Sintering and crystallization of SrO-CaO-B2O3-SiO2 glass-ceramics with different TiO2 contents. J. Non-Cryst. Solids 2017, 473, 33–40. [Google Scholar] [CrossRef]
- Javed, H.; Sabato, A.G.; Herbrig, K.; Ferrero, D.; Walter, C.; Salvo, M.; Smeacetto, F. Design and characterization of novel glass-ceramic sealants for solid oxide electrolysis cell (SOEC) applications. Int. J. Appl. Ceram. Technol. 2018, 15, 999–1010. [Google Scholar] [CrossRef]
- De Pablos-Martín, A.; Rodríguez-López, S.; Pascual, M.J. Processing technologies for sealing glasses and glass-ceramics. Int. J. Appl. Glass. Sci. 2020, 11, 552–568. [Google Scholar] [CrossRef] [Green Version]
- Rodriguez-López, S.; Wei, J.; Laurenti, K.C.; Mathias, I.; Justo, V.M.; Serbena, F.C.; Baudín, C.; Malzbender, J.; Pascual, M.J. Mechanical properties of solid oxide fuel cell glass-ceramic sealants in the system BaO/SrO-MgO-B2O3-SiO2. J. Eur. Ceram. Soc. 2017, 37, 3579–3594. [Google Scholar] [CrossRef]
- Rodríguez-López, S.; Malzbender, J.; Justo, V.M.; Serbena, F.C.; Groß-Barsnick, S.M.; Pascual, M.J. Thermo-Mechanical Stability and Gas-Tightness of Glass-Ceramics Joints for SOFC in the System MgO-BaO/SrO-B2O3-SiO2. Front. Mater. 2020, 7, 19. [Google Scholar] [CrossRef] [Green Version]
- Rodríguez-López, S.; Haanappel, V.A.C.; Durán, A.; Muñoz, F.; Mather, G.C.; Pascual, M.J.; Gross-Barsnick, S.M. Glass-ceramic seals in the system MgO-BaO-B2O3-SiO2 operating under simulated SOFC conditions. Int. J. Hydrog. Energy 2016, 41, 15335–15345. [Google Scholar] [CrossRef]
- Ozawa, T. Kinetics of non-isothermal crystallization. Polymer 1971, 12, 150–158. [Google Scholar] [CrossRef]
- Avramov, I.; Avramova, K.; Rüssel, C. Useful method to analyze data on overall transformation kinetics. J. Non. Cryst. Solids 2010, 356, 1201–1203. [Google Scholar] [CrossRef]
- Avramov, I.; Avramova, K.; Rüssel, C. New method to analyze data on overall crystallization kinetics. J. Cryst. Growth. 2005, 285, 394–399. [Google Scholar] [CrossRef]
- Kissinger, H.E. Variation of peak temperature with heating rate in differential thermal analysis. J. Res. Natl. Bur. Stand. 1956, 57, 217–221. [Google Scholar] [CrossRef]
- Marseglia, E.A. Kinetic theory of crystallization of amorphous materials. J. Non. Cryst. Solids 1980, 41, 31–36. [Google Scholar] [CrossRef]
- Matusita, K.; Sakka, S. Kinetic study of crystallization of glass by differential thermal analysis—criterion on application of Kissinger plot. J. Non. Cryst. Solids 1980, 38–39, 741–746. [Google Scholar] [CrossRef]
- Geasse, P. Development of Crystallizing Glass Sealants for High Temperature Planar Solid Oxide Fuel Cells. Ph.D. Thesis, RWT Aachen, Aachen, Germany, 2003. [Google Scholar]
- Pascual, M.J.; Prado, M.O.; Durán, A. A new method for determining fixed viscosity points of glasses. Phys. Chem. Glas. 2005, 46, 512–520. [Google Scholar]
- Erol, M.; Küçükbayrak, S.; Ersoy-Meriçboyu, A. Influence of particle size on the crystallization kinetics of glasses produced from waste materials. J. Non-Cryst. Solids 2011, 357, 211–219. [Google Scholar] [CrossRef]
- Karamanov, A.; Avramov, I.; Arrizza, L.; Pascova, R.; Gutzow, I. Variation of Avrami parameter during non-isothermal surface crystallization of glass powders with different sizes. J. Non-Cryst. Solids 2012, 358, 1486–1490. [Google Scholar] [CrossRef]
- Donald, I.W. Crystallization kinetics of a lithium zinc silicate glass studied by DTA and DSC. J. Non. Cryst. Solids. 2004, 345–346, 120–126. [Google Scholar] [CrossRef]
- Pascual, M.J.; Lara, C.; Durán, A. Non-isothermal crystallization kinetics of devitriying RO-BaO-SiO2 (R = Mg, Zn) glasses. Phys. Chem. Glasses Eur. J. Glass Sci. Technol. Part B 2006, 47, 572–581. [Google Scholar]
- Skarmoutsos, D.; Tietz, F.; Nikolopoulos, P. Structure-Property Relationships of Ni/YSZ and Ni/(YSZ+TiO2)Cermets. Fuel Cells 2001, 1, 243–248. [Google Scholar] [CrossRef]
- Kerstan, M.; Rüssel, C. Barium silicates as high thermal expansion seals for solid oxide fuel cells studied by high-temperature X-ray diffraction (HT-XRD). J. Power Sources 2011, 196, 7578–7584. [Google Scholar] [CrossRef]
- Kerstan, M.; Müller, M.; Rüssel, C. Thermal expansion of Ba2ZnSi2O7, BaZnSiO4 and the solid solution series BaZn2−xMgxSi2O7 (0 ≤ x ≤ 2) studied by high-temperature X-ray diffraction and dilatometry. J. Solid State Chem. 2012, 188, 84–91. [Google Scholar] [CrossRef]
- Thieme, C.; Rüssel, C. Thermal expansion behavior of SrSiO3 and Sr2SiO4 determined by high-temperature X-ray diffraction and dilatometry. J. Mater. Sci. 2015, 50, 5533–5539. [Google Scholar] [CrossRef]
Publisher’s Note: MDPI stays neutral with regard to jurisdictional claims in published maps and institutional affiliations. |
© 2021 by the authors. Licensee MDPI, Basel, Switzerland. This article is an open access article distributed under the terms and conditions of the Creative Commons Attribution (CC BY) license (https://creativecommons.org/licenses/by/4.0/).