Article

Conductivity Transitions of La0.7Sr0.3MnOδ and La0.6Sr0.4Co0.2Fe0.8O3−δ in Ce0.9Gd0.1O2−δ Matrix for Dual-Phase Oxygen Transport Membranes

1
School of Materials Science and Engineering, Chonnam National University, Gwangju 61186, Korea
2
Advanced Materials & Devices Laboratory, Korea Institute of Energy Research, 152 Gajeong-ro, Daejeon 305-343, Korea
*
Author to whom correspondence should be addressed.
Crystals 2021, 11(6), 712; https://doi.org/10.3390/cryst11060712
Submission received: 3 April 2021 / Revised: 6 June 2021 / Accepted: 15 June 2021 / Published: 21 June 2021

Abstract

:
Using van der Pauw method, the conductivity of disk samples of La 0.7 Sr 0.3 MnO 3 ± δ (LSM) and La 0.6 Sr 0.4 Co 0.2 Fe 0.8 O 3 δ (LSCF) in a Ce 0.9 Gd 0.1 O 2 δ (GDC) matrix was accurately quasi-continuously measured over 800 °C to −73 °C, and the transition points in Arrhenius behavior were systematically obtained from the extremum points of the second derivatives. While LSM-containing samples showed reproducible conductivity trajectories, the LSCF system exhibited unsystematic changes which may be related to the substantial oxidation/reduction reactions accompanying the ferroelastic–paraelastic transitions with a substantial thermal hysteresis at 650 °C to 750 °C, corresponding to conductivity maxima. A sudden decrease in activation energies on cooling corresponds to the para-to-ferromagnetic, weak insulator–metal transitions and the Curie temperature of LSM appears to gradually decrease in composites to 90 °C, while LSCF composites exhibit blurred transitions at approximately 40 °C. Relatively insulating paramagnetic phases are characterized by activation energy values ~0.2 eV, change to the high temperature phase exhibiting activation energy 0.1 eV for small polaron hopping mechanisms at 300 °C to 500 °C with increasing GDC content in the LSM composites and by two transitions at 60 °C and 245 °C for the LSCF composites. LSCF single phase shows distinctly lower transition points which appear to match with the singularly large c lattice parameter whereas the composites exhibit decreasing c with LSCF amount together with increasing lattice parameter of GDC. Van der Pauw conductivity is a feasible and sensitive in situ tool for monitoring the status of oxygen transport membranes.

1. Introduction

A promising technology for the production of pure oxygen in oxy-fuel combustion and pre-combustion applications at low cost and high efficiency is the oxygen transport membranes (OTM). The particular composition La 0.6 Sr 0.4 Co 0.2 Fe 0.8 O 3 δ , abbreviated in this work as LSCF, is one of the earliest and most demonstrated perovskite-type oxides for use as catalytic membranes for oxidative coupling of methane [1,2]. Although these mixed-conductive membranes exhibit high electronic and ionic conductivities and thus high oxygen permeability in oxidizing conditions, chemical and mechanical instability under large oxygen chemical potential gradients and reactivity with CO 2 and H 2 O prompted the development of the dual-phase membranes, consisting of a composite of an oxide ionic-conductor, representatively, a Gd-doped ceria Ce 1 x Gd x O 2 δ , and an electronically conducting phase, e.g., La 0.7 Sr 0.3 MnO 3 ± δ , LSM, which perform heterogeneously ambipolar diffusion for oxygen permeation [3,4]. Gd-doped ceria and LSM show similar thermal expansion coefficients over a wide temperature range allowing mechanical stability in preparation and operation. Mixed conducting perovskites are also made into composites with ionic conductors for better stability [5,6,7,8,9].
Fluorite materials and perovskites are often mixed comparably, e.g., 50:50 volume or weight percents [3,4,5,9,10]. Recently, LSCF or LSM with surface modification, in an amount just above the percolation limit, 20 vol%, in 10 mol% Gd-doped ceria, Ce 0.9 Gd 0.1 O 2 δ (here abbreviated as GDC), demonstrated oxygen permeation performance higher than the mixed conductive LSCF similarly catalyzed [7,11,12].
As this composition is close to the percolation threshold [7,11], processing condition-dependent distribution of the electronically or mixed conducting phase can critically affect the performance [8]. Composition dependences of conductivity of GDC:LSCF composites [7] and GDC:LSM composites [11] were shown at 300 C where the percolative electronic conductivity of the perovskites is contrasted to the very ionic conductivity of GDC-rich compositions below the percolation threshold. Percolation behavior becomes less distinct at higher temperatures such as the membrane operation temperature, 850 C , when the ionic conductivity of GDC strongly increases, while the electronic conductivity of the perovskite phases known to operate by small polaron hopping, is much less temperature-dependent. As the dual-phase membrane requires the percolation of both the electronically conducting phase and the ionic conductor, percolation behavior fitted to a general effective-media (GEM) equation with multiparameters such as conductivity of the GDC and perovskite phase, percolation exponent and threshold concentration [7,11], does not seem very informative, without consideration of the ambipolar mechanism for dual-phase membranes,
There are two to three orders of magnitude variation in the conductivity of the composites between 20 and 100 vol.% perovskite content at 300 C [7,11]. Temperature dependence of the conductivity of these composites has not been reported. The question that motivated this work is whether the temperature dependence of conductivity of the single phase perovskites would remain the same (and thus fixed) in the composites whose magnitude difference in conductivity is determined by the volume percents of each phase and their connectivity.
For LSM and LSCF the small polaron hopping mechanism (occurring via thermally activated disproportionation of Mn 3 + ions and Co 3 + ions, respectively) of activation energy, E A in σ T exp ( E A / k T ) , ~0.1 eV is discussed for the temperature range 600 C –800 C and 100 C –500 C , respectively [13,14,15]. For LSCF, the conductivity maximum around 500 C –600 C which was largely attributed to the oxygen loss which decreases the carrier concentration, described as an order–disorder transition of oxygen vacancies [14,15], was related to a second order rhombohedral-cubic or ferroelastic-paraelastic phase transition between 650 C and 750 C [16,17,18]. Such a phase transition was also shown to occur for LSM at 850 C by in situ XRD [19] but a corresponding conductivity transition has not been discussed. Both LSM and LSCF exhibit ferro-paramagnetic transitions around 90 C [20,21,22,23] and approximately 40   C [17,24], which are also more or less distinctively reflected in the temperature dependence of conductivity.
Note that the electronic structure and transport behavior in the temperature range 600 C –900 C is of interest for high temperature applications such as solid oxide fuel cells and oxygen transport membranes, while around room temperature (and lower) they are related to to the magnetic interactions [20,21,22,23] or to electrocatalytic performance [25]. While in the former redox reactions in equilibrium should be considered, in the latter, the oxygen exchange reaction and diffusion does not appreciably occur, and thus only electronic equilibrium is considered. The properties thus depend on sample preparation and previous thermal history. Not much discussed is the conductivity behavior in the temperature range between these high and low temperature ranges.
In this work, the van der Pauw method was applied to disk samples of composites and the transition points in GDC:LSM and GDC:LSCF were systematically determined from the extremum points of the conductivity curves or of the second derivatives of the Arrhenius plots for changes in conduction mechanisms using quasi-continuously measured temperature-dependent conductivity. The variation of transition points with composite compositions can be related to the mechanical or chemical interactions in dual-phase membranes. In contrast to the conventional bar geometry for the four-probe method, the van der Pauw method can be applicable to the membrane geometry. In situ conductivity measurements using the van der Pauw method can be a viable tool to monitor the state of OTM materials such as oxidation/reduction state and structural phase transitions for monitoring of transport and mechanical properties.

2. Experimental

Two different types of dual-phase pellets GDC:LSM and GDC:LSCF were prepared using commercial powders of GDC ( Ce 0.9 Gd 0.1 O 2 δ Anan Kasei, Osaka, Japan), LSM ( La 0.7 Sr 0.3 MnO 3 ± δ , Kceracell, Geumsan-gun, Chungcheongnam-do, Korea), and LSCF ( La 0.6 Sr 0.4 Co 0.2 Fe 0.8 O 3 δ , Kceracell, Geumsan-gun, Chungcheongnam-do, Korea). Mixtures of GDC:LSM, GDC:LSCF with different volume ratios were prepared using density values as 7.21   g / c m 3 , 6.27   g / c m 3 , and 6.36   g / c m 3 for GDC, LSM, and LSCF, respectively. Mixtures were homogenized by ball milling for 24 h in ethanol and dried cakes were ground, cold-isostatically pressed (CIP) at 1500 k g / c m for 15 min, and sintered at 1400 C for 3 h. As-received powders of GDC, LSM, and LSCF were similarly pressed and sintered. Samples with high fluorite amount or perovskite phase below 20% were prepared using a mold of 7 mm diameter using a powder mass of ~0.2 g. Samples with perovskite phase of 20% and above were prepared using a bigger mold of 24 mm size with a powder mass of around 6 g, for disk samples of radius 17 mm and thickness ~2 mm for a high temperature van der Pauw setup previously reported [26].
For backscattered electron imaging (JEOL, JSM- 7500F, USA), the samples were mirror-polished using 1 μ m diamond suspension after 4000 grit SiC paper and thermally etched at 1200 C for 1 h. The disk samples after electrical measurements were polished using a 2000 grit SiC paper and analysed by a Multipurpose X-ray Diffractometer suited to bulk samples (EMPyrean, Malvern PANalytical, Almelo, the Netherlands)) using Cu K α radiation (1.8 kW Max. 60 kV 55 mA) over a scan range of 5–90 2 θ and scan speed of 0.026 / s .
Sintered disk samples of diameter ~17 mm with perovskite phase 20% and higher were polished with a 2000 grit SiC paper to have a homogeneous thickness d of ∼2.0 mm. Four symmetrical grooves were made at the lateral side along the thickness direction as shown in Figure 1, where Au or Ag paste (Pelco, Ted Pella, Reddings, CA, USA) was applied, and connected to a source meter (Keithley 2400, Tektronix, Beaverton, OR, USA) for current supply, I 12 , and a digital multimeter (DMM) (Keithley 2700, Tektronix, Beaverton, OR, USA) for voltage measurement, V 34 , respectively, for the resistance R 12 , 34 = V 34 / I 12 . Measurements with reversed polarity and reciprocally, i.e., measurements with current-voltage electrodes interchanged, were subsequently made. Similarly, four measurements were done for R 23 , 41 = V 41 / I 23 , thus in total eight resistance values are obtained. Circuit connections for automated eight resistance measurements were designed using a channel card (Keithley 7708, Tektronix, Beaverton, OR, USA) installed in the DMM. Input current was varied between 10 4 to 0.2 A, depending on sample resistances. High current values are needed to obtain voltage values of good signal-to-noise ratio but high current above 0.2 A damaged the circuits of the channel card. Reversed polarity and reciprocal measurements reduces the errors due to thermal voltages and poor electrode condition. LabVIEW automated DC van der Pauw conductivity measurement involving eight voltage measurements and the numerical calculation takes about 44 s. Measurements were performed quasi-continuously while temperature was controlled at 1   C /min between room temperature and 800 C for the samples loaded in a custom-designed sample holder [26] positioned in a vertical tube furnace with flowing synthetic air of humidity 50 ppm in 100 SCCM, and between 177 C –−73 C for the samples loaded in a cryostat with a high temperature option (Janis CCS-450, LakeShore Cryotronics, Westerville, OH, USA) in a vacuum condition. In the cryostat setup, control and monitoring of the temperature was made using two Pt sensors connected to a temperature controller (331, LakeShore Cryotronics, Westerville, OH, USA). For the furnace setup K-type thermocouples were used.

3. Results and Discussion

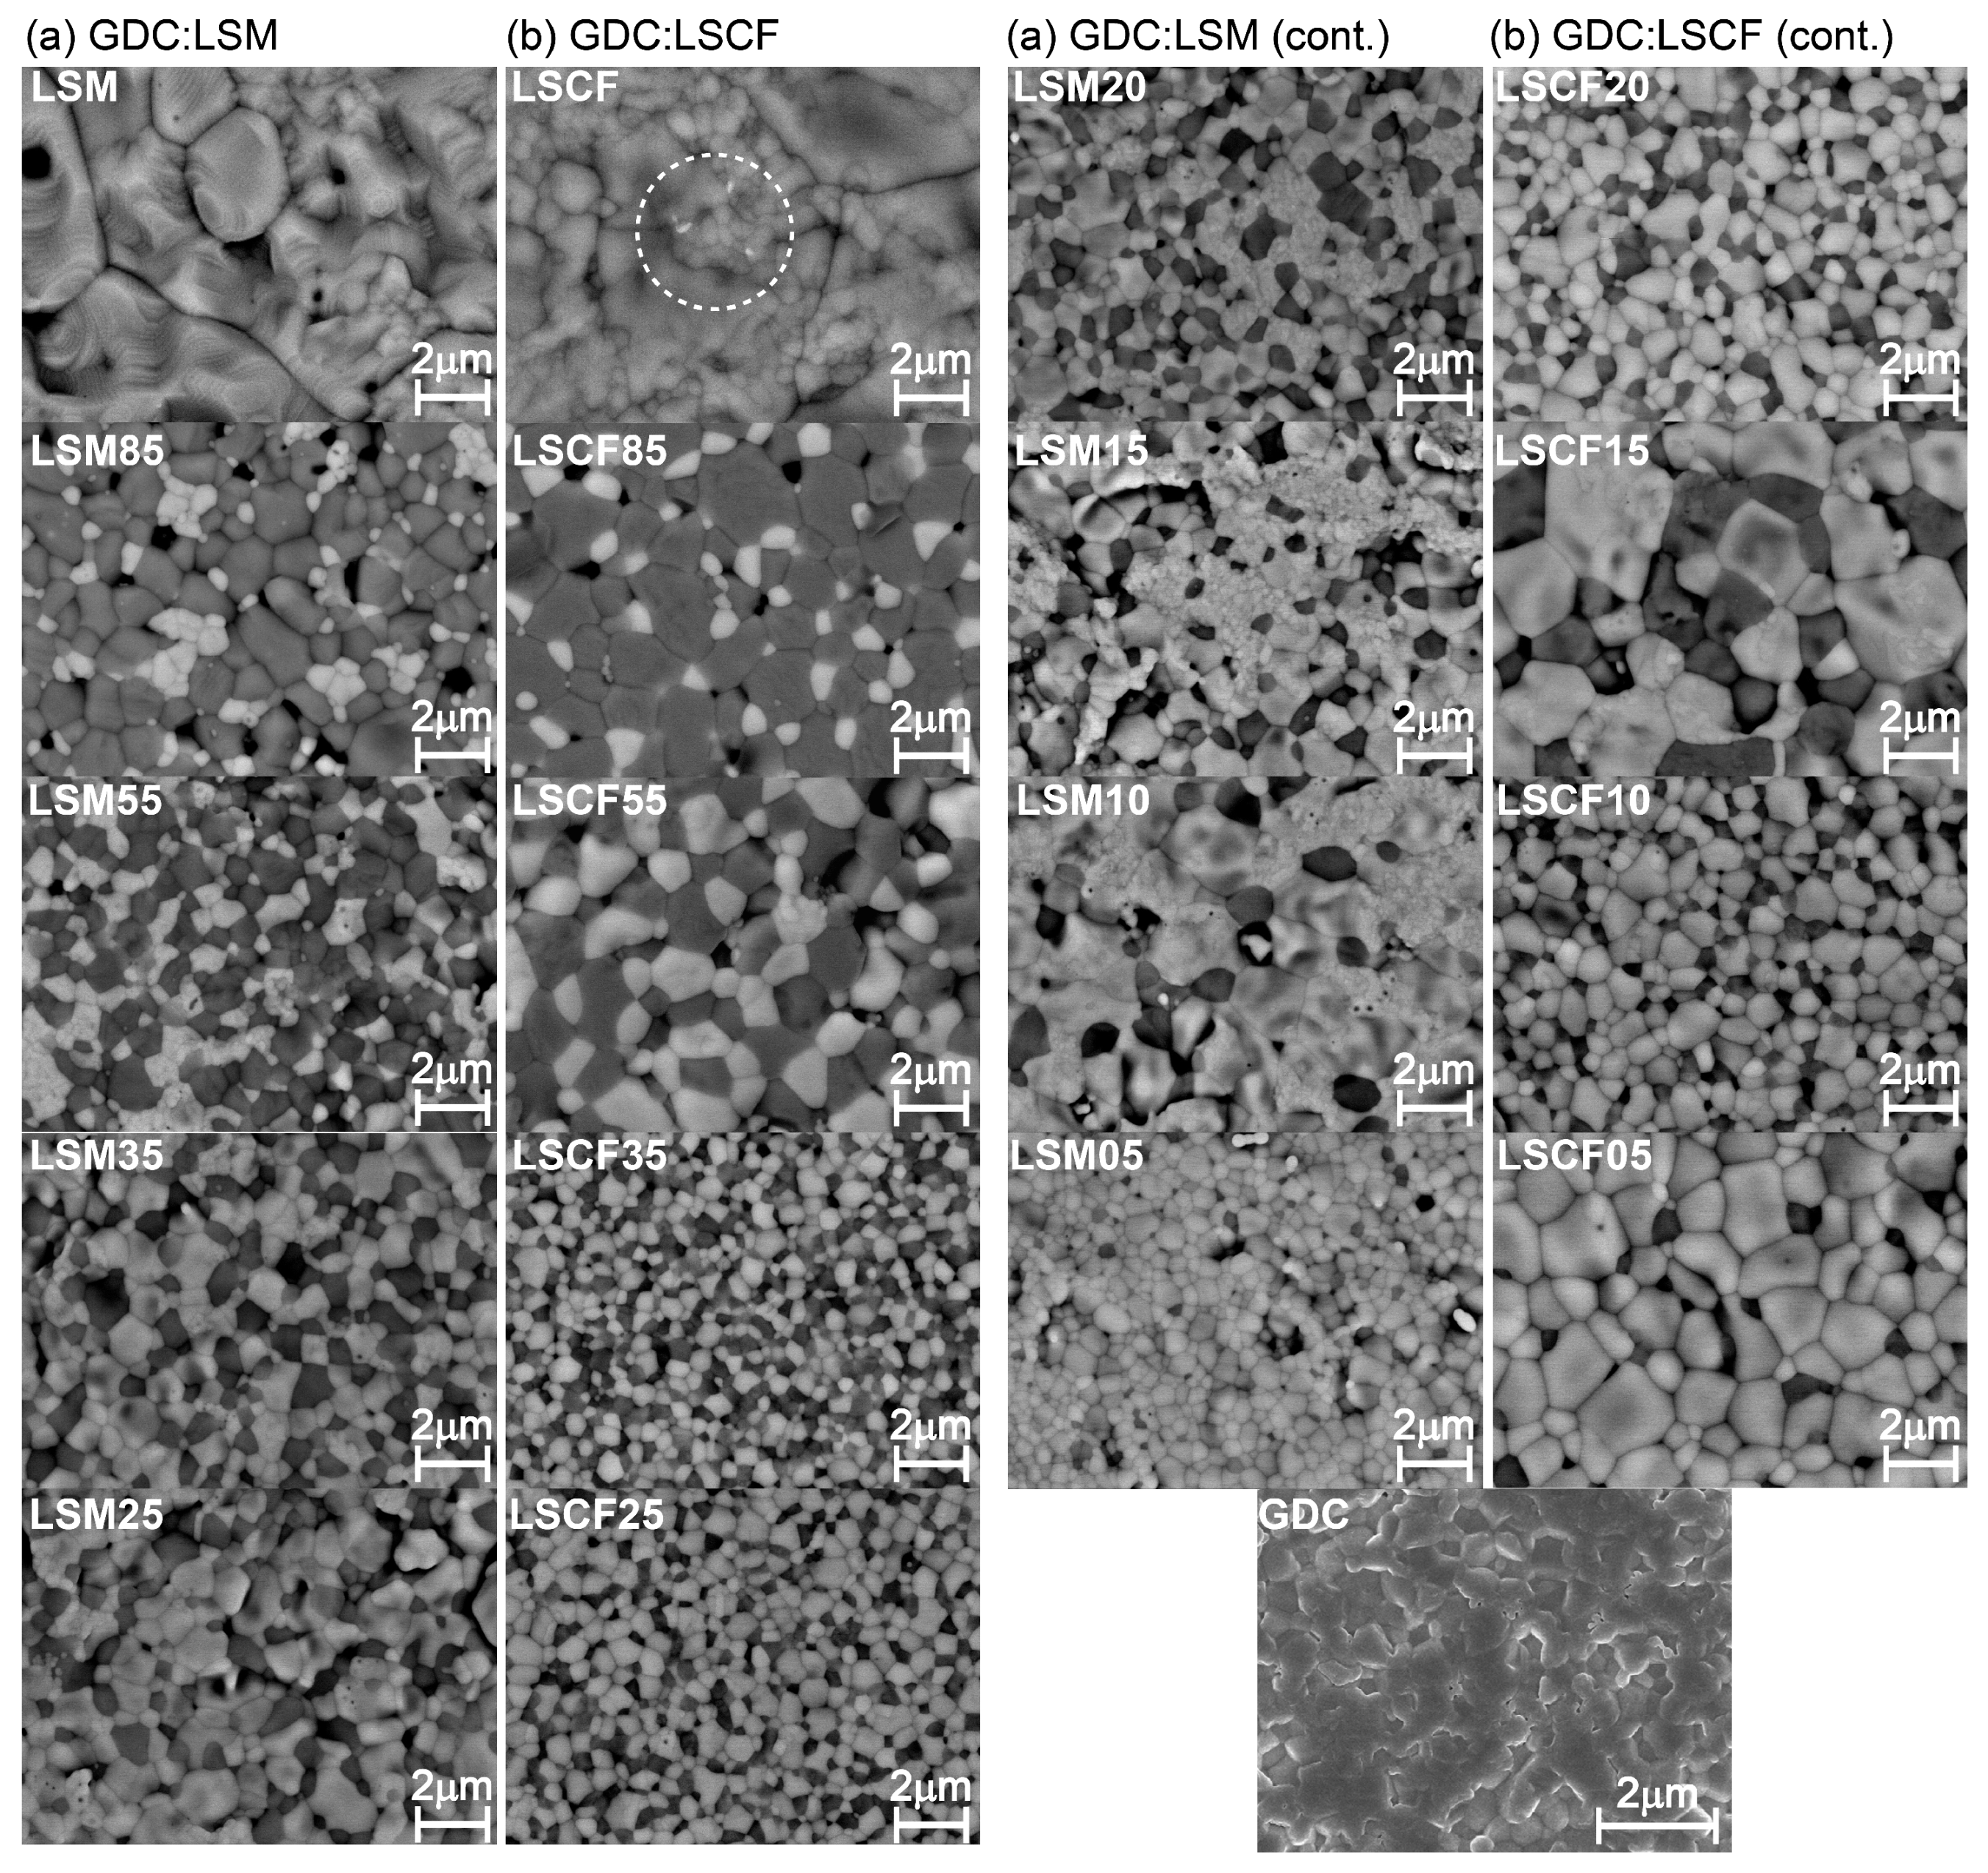
3.1. Microstructure Characterization

Figure 2 shows the microstructure of sintered pellets of single phases of GDC, LSM, and LSCF, and the composites. The brighter contrast represents the GDC phase, while LSM or LSCF exhibits darker contrast. Image analysis results using Image-Pro®, of some samples containing perovskites fraction of 20, 25, 35, 55, and 85%, ratios used for conductivity measurements, Figure 3, shows the images approximately represent the volume ratios of the samples as prepared. Somewhat higher values for 20% LSM and LSCF appear to be contributed due to contributions by pores. The phase proportion from XRD analysis is closer to the prepared ratios. LSM and LSCF exhibit strong topological development from thermal etching. Facets appear to be developed in LSM. On the other hand, in LSCF small and large grains appear to coexist and well-distinguished boundaries suggest mean grain size of 10   μ m . White spots indicated by a circle appear to be SrO particles from Sr surface segregation during thermal etching [27].
The finer grain sizes of perovskites in the composites may be ascribed to the grain growth retardation effect by the second-phase GDC particles. (Surface structure was not developed for the smaller perovskite grains in the composites for the same thermal etching treatment.) While GDC:LSM composites show the expected variation in grain size, the grain size of GDC:LSCF composites becomes very small in the compositions of 20%, 25%, and 35% compared to 15% and 55%. It is also notable the grain size of GDC, the brighter phase, is larger in LSCF composites than in LSM composites for the compositions 85%, 55%, 15%, and 5% perovskite. Rather unsystematic microstructural evolution in GDC:LSCF composites may be related with the stress/strain interactions suggested by the lattice parameter variations discussed below.

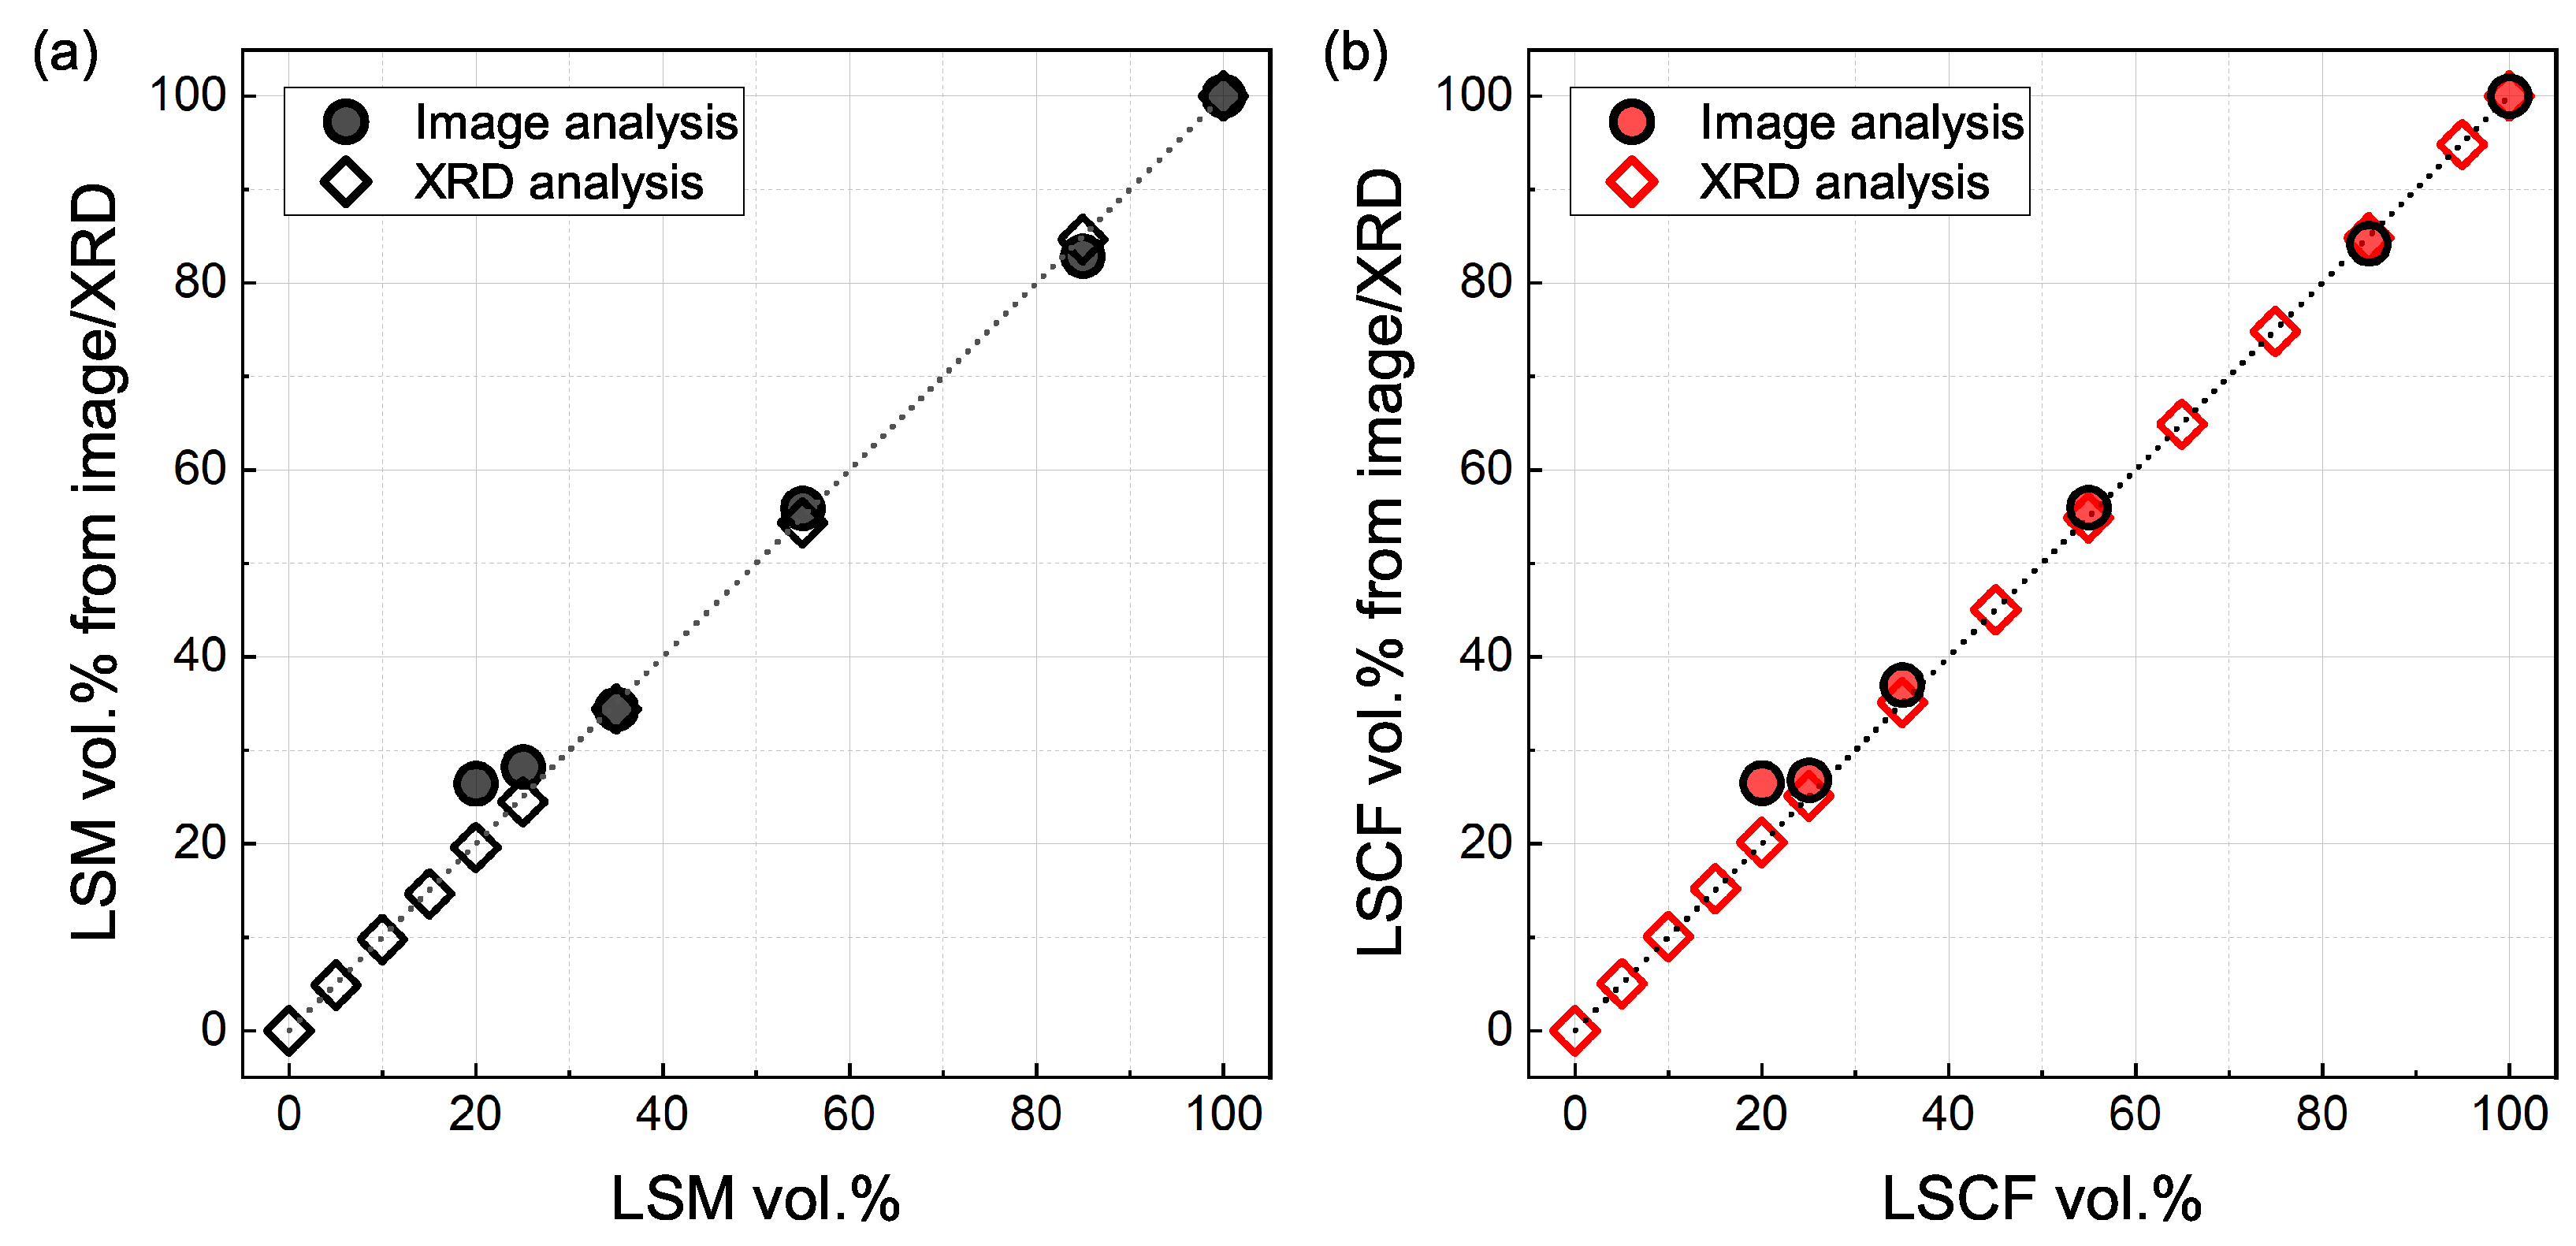
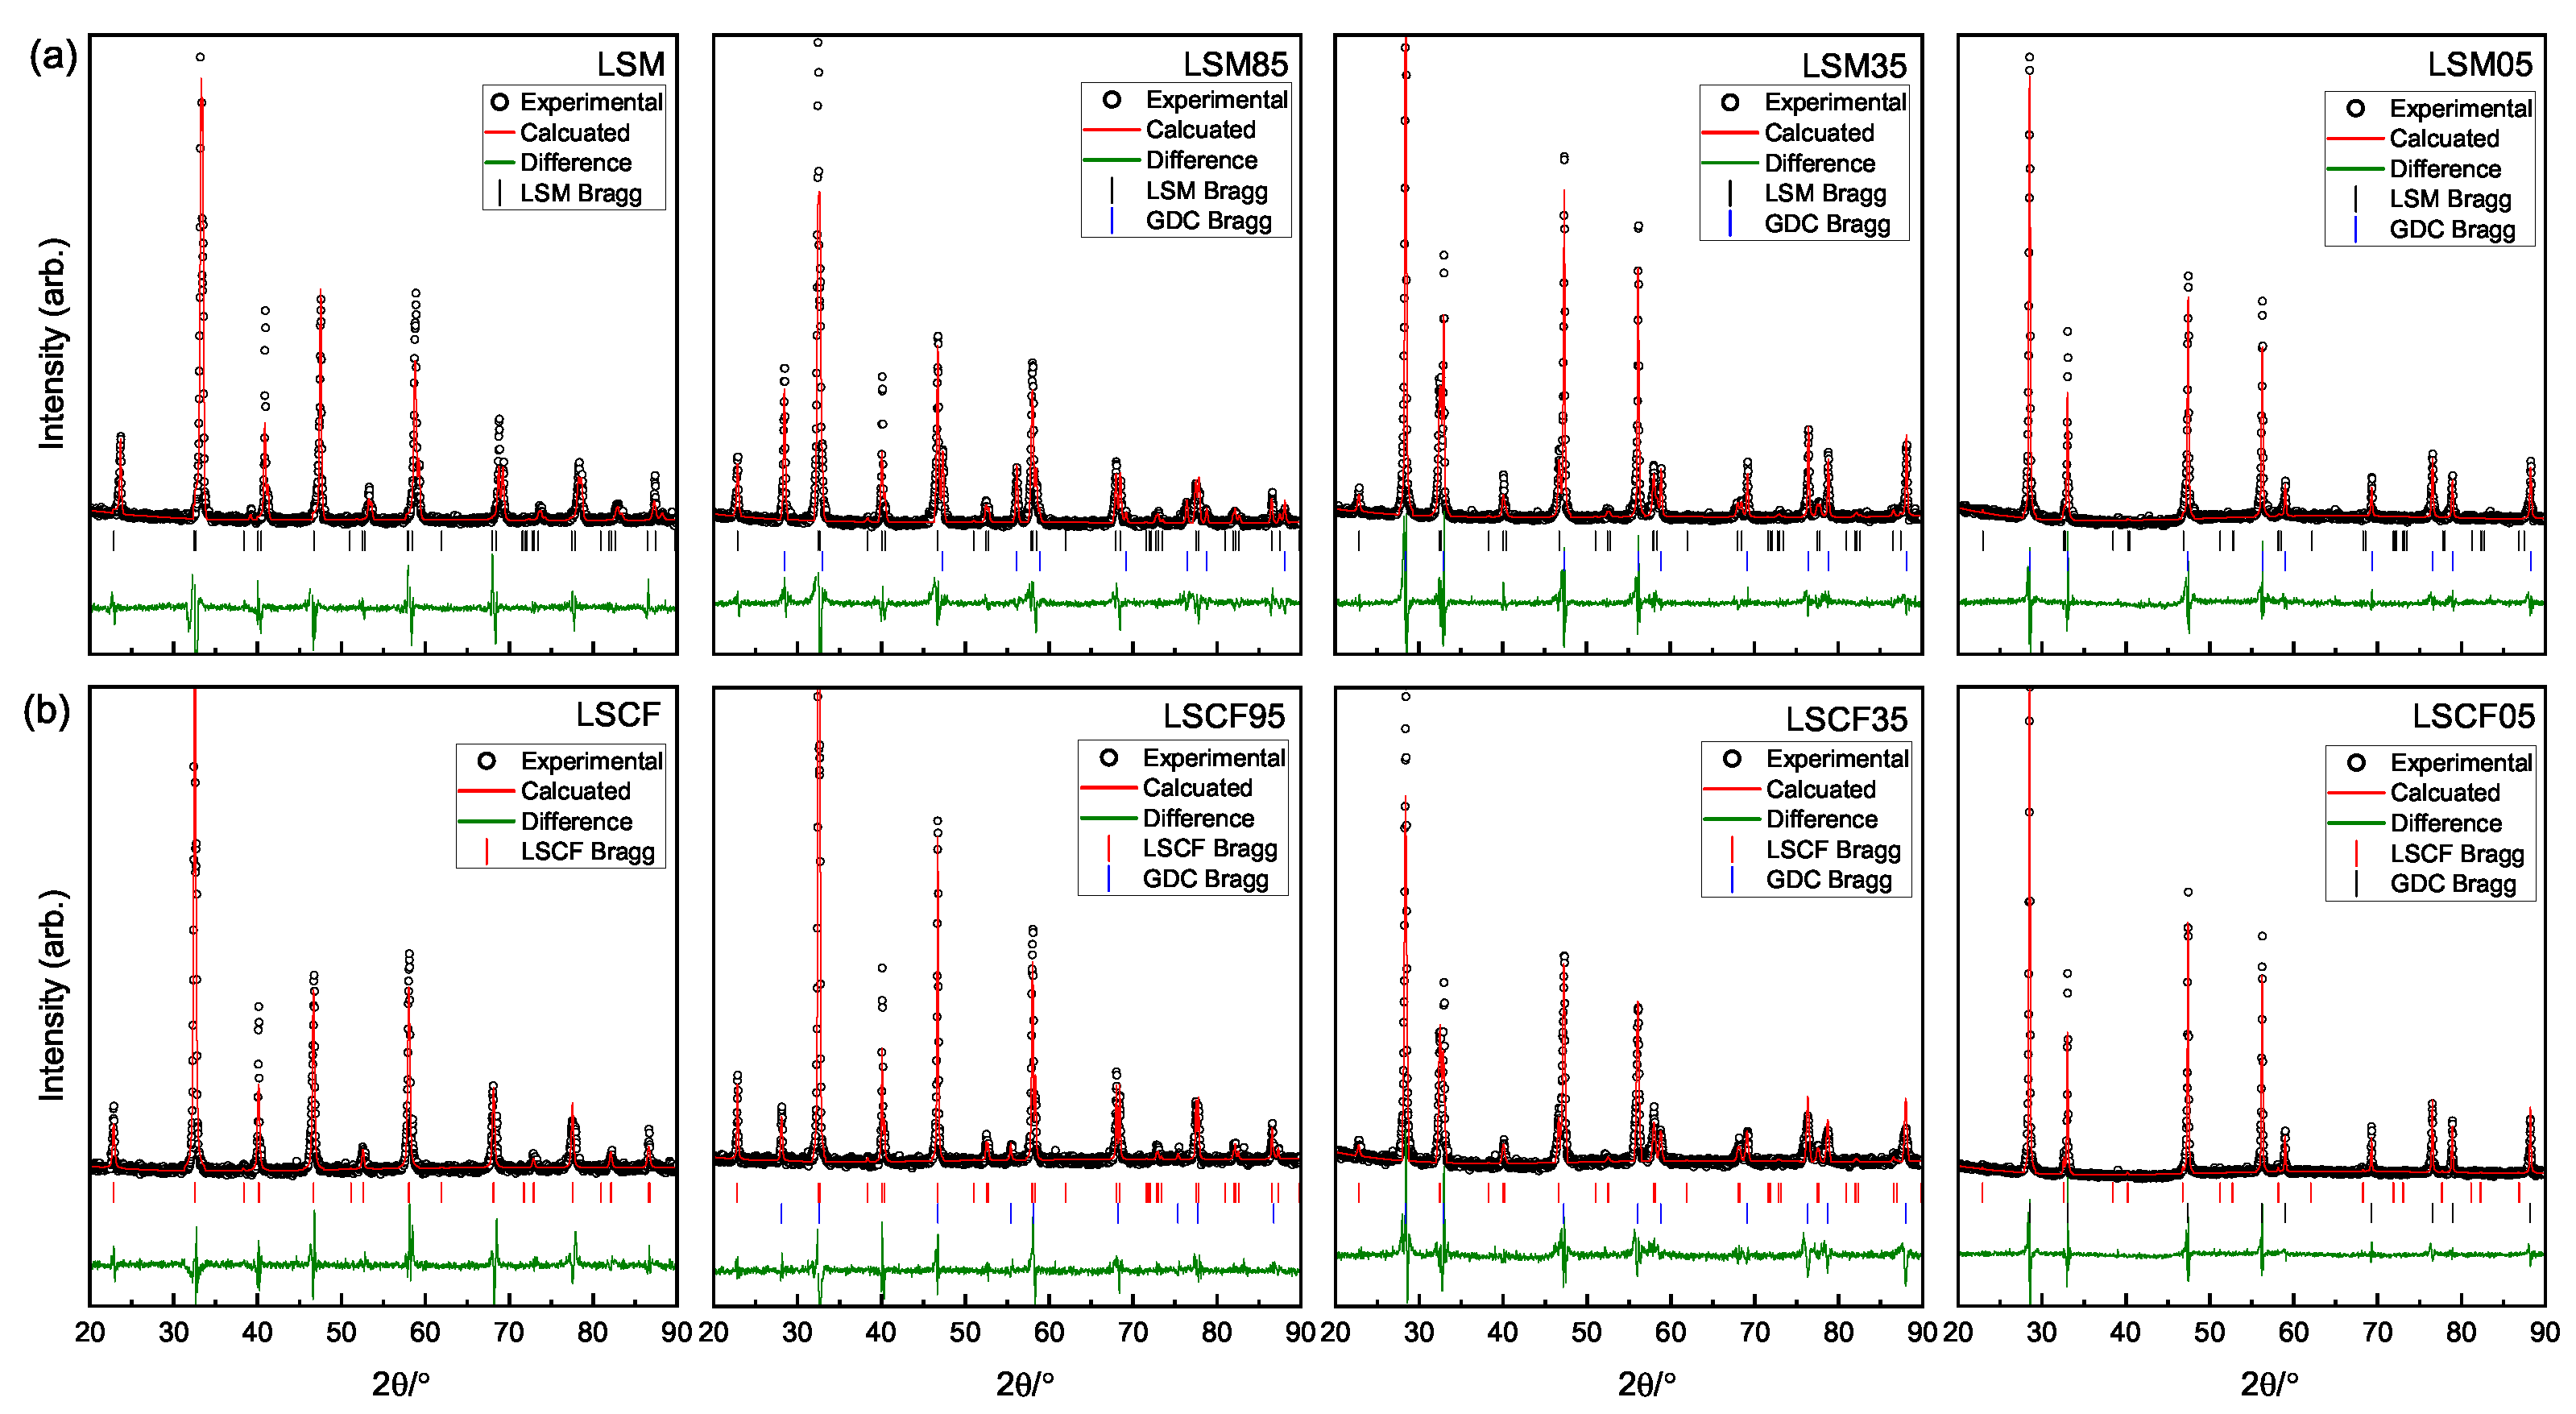
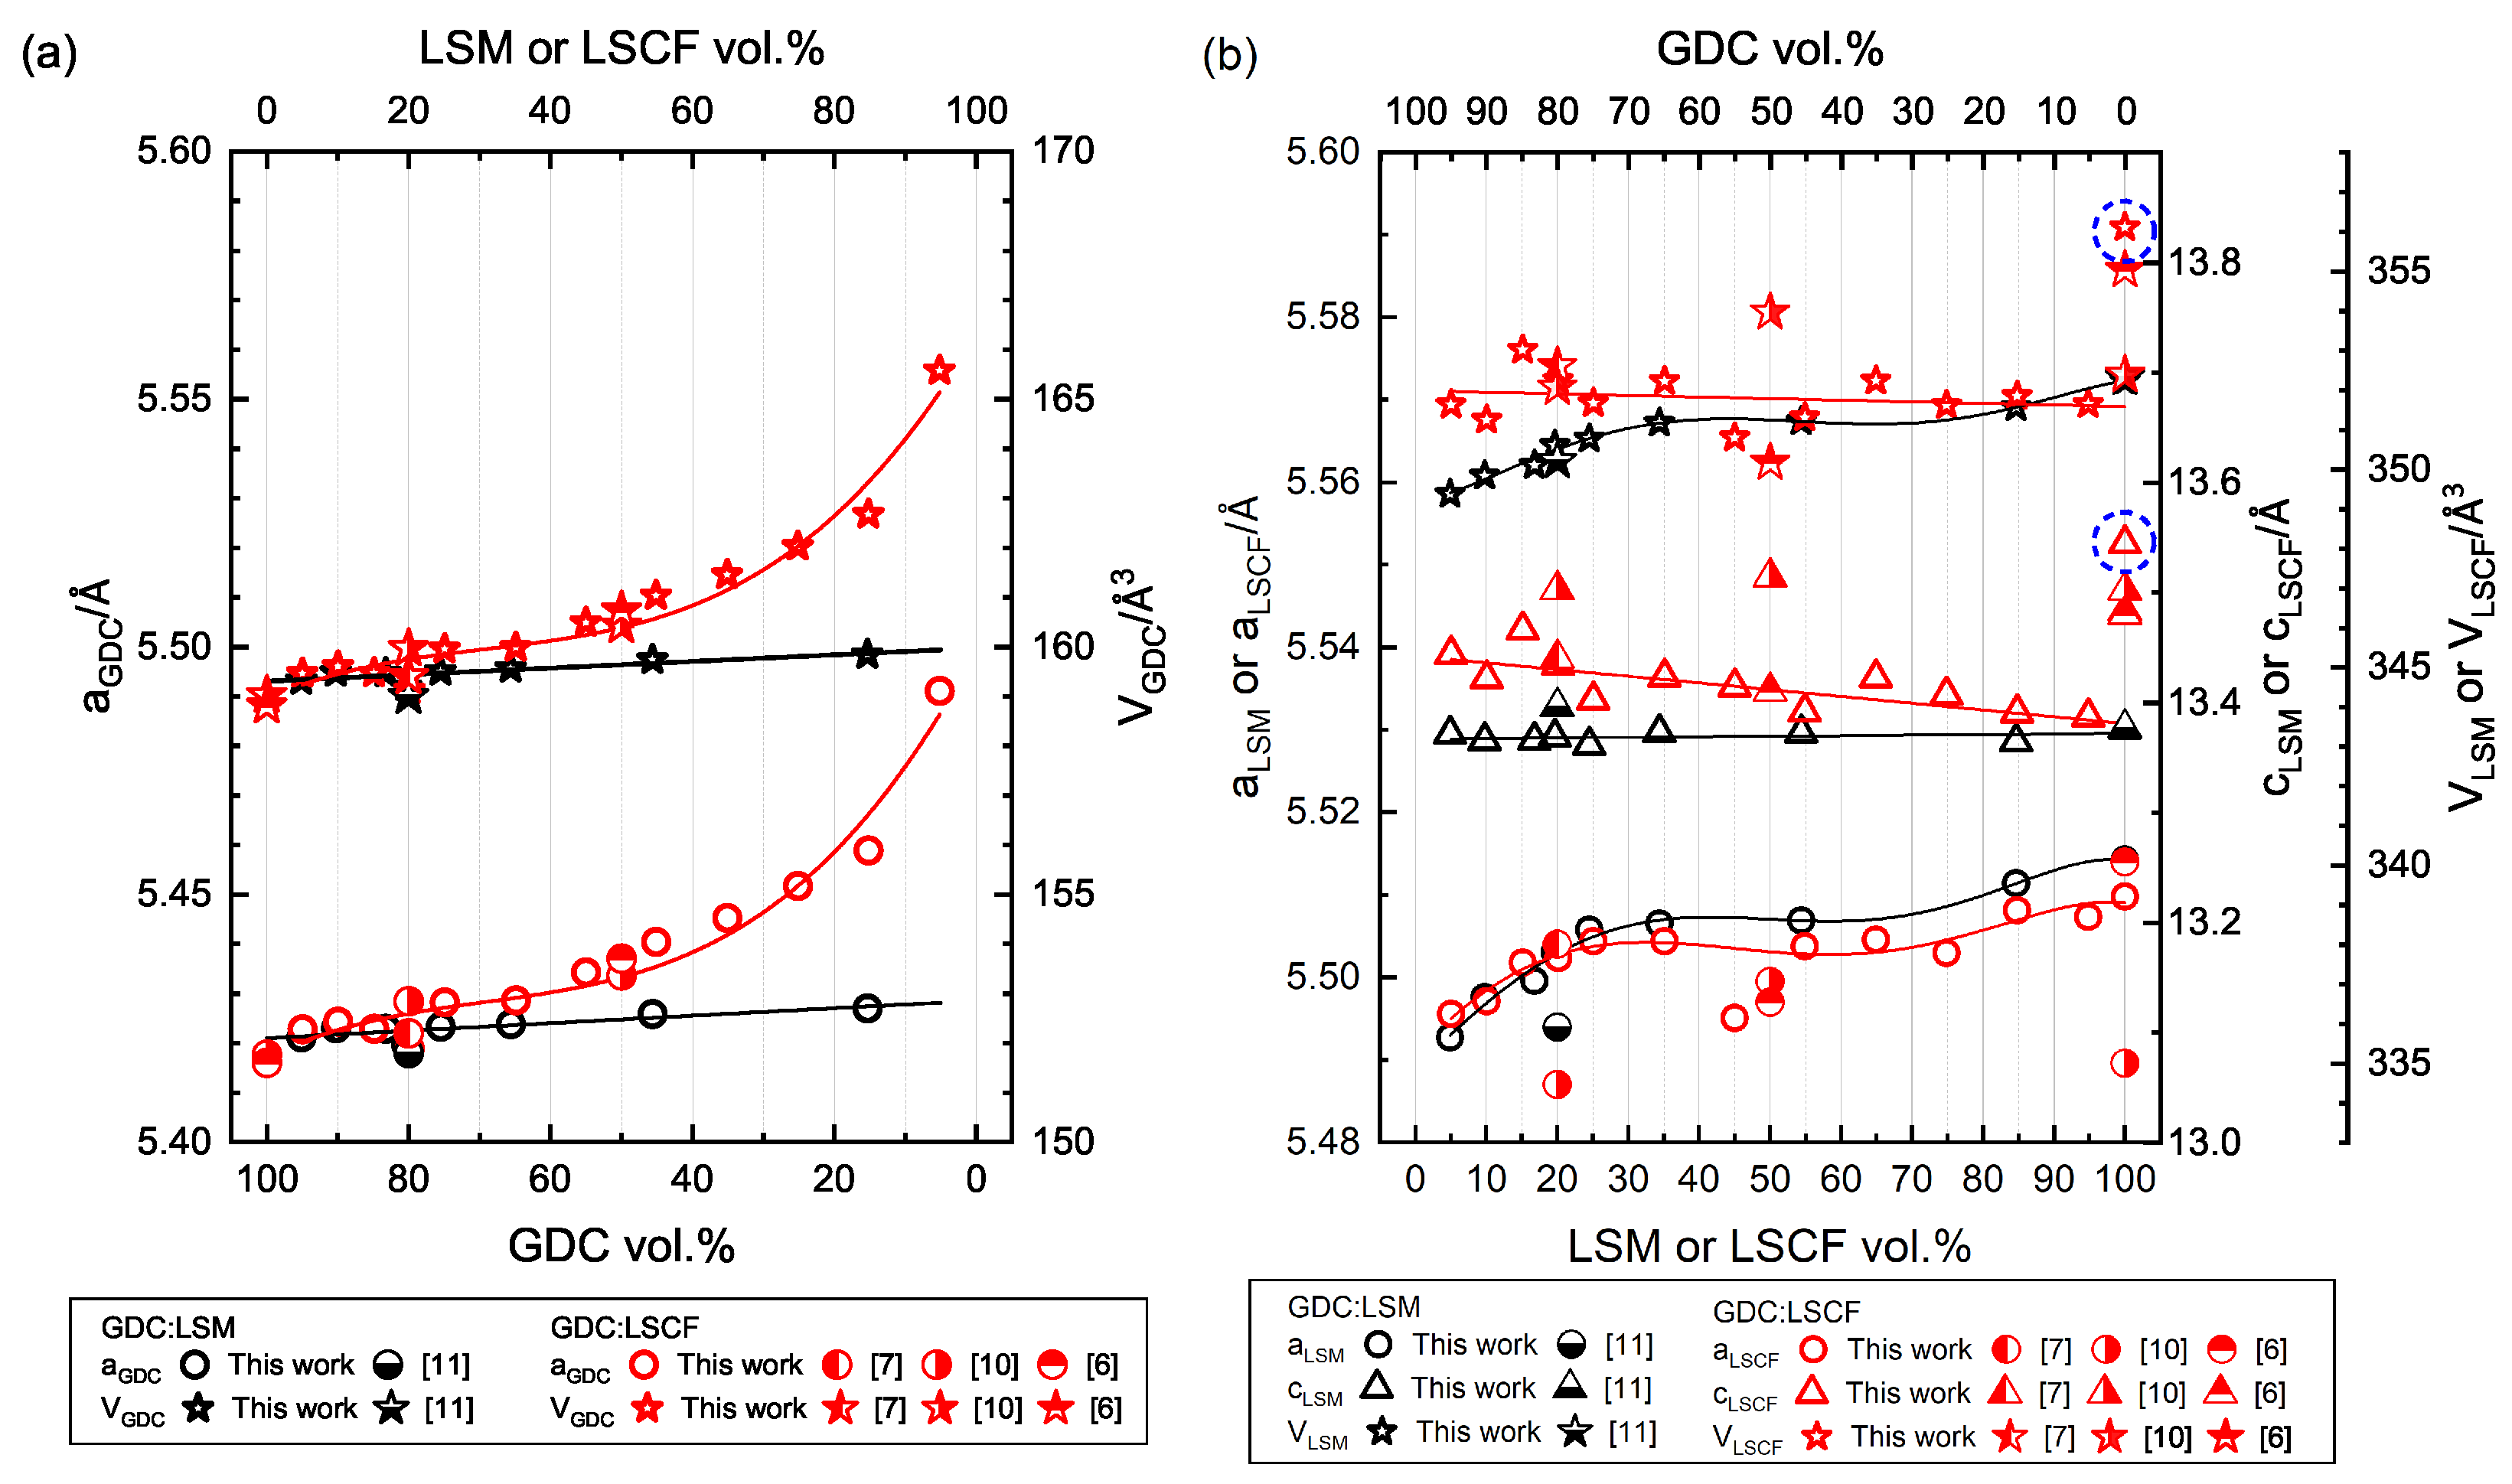
3.2. X-ray Diffraction Analysis

X-ray diffraction (XRD) patterns were obtained using a diffractometer mode optimized for solid samples. Rietveld-refined lattice parameters of GDC, LSM, and LSCF in composites have been previously reported for 20% and 50% perovskite phase [6,7,10,11]. In the present work, composition dependence can be systematically examined. Rietveld analysis was carried out using X’Pert HighScore Plus software ver. 3.0.5. Selected examples of Rietveld analysis are shown in Figure 4 and the results are presented in Table 1 and Table 2 and Figure 5. For GDC, a cubic fluorite structure of space group number 225, F m 3 ¯ m was considered and a rhombohedral structure of space group number 167, R 3 ¯ c , for LSM and LSCF. For all compositions the perovskites are ferroelastic and the phase at room temperature was investigated, as indicated in Figure 6. Phase fraction values from Rietveld analysis matched well the prepared compositions, Figure 3. Note that the as-prepared composition values are slightly changed using the density values from the present Rietveld analysis, which is applied in all graphs relevant below.
For GDC:LSM composites, the lattice parameter of GDC slightly increases in proportion with LSM amount from 5.418  Å for pure GDC to 5.427  Å for 85% LSM (and 159.04  Å3 to 159.84  Å3 in lattice volume), see Figure 4a. Compared to pure phase LSM, the c lattice parameter slightly decreases with decreasing amount of LSM. Lattice parameter a also decreases in the composites compared to that of pure LSM but more substantially and nonlinearly. It decreases from 13.376  Å to 13.372  Å for 55% LSM. Another decrease occurs in the composition below 25% near the percolation threshold. The lattice volume thus follows the variation of the a parameter. The results for LSM 20 vol% [11] showed smaller a parameter and larger c parameter resulting in the similar lattice volume as in this work. In [11], a membrane of thickness ~30 m was prepared from laminated tapes. The difference may be due to the stress involved with such geometry in view of the ferroelasticity of LSM.
The behavior of GDC:LSCF composites is rather intriguing. The lattice parameter of GDC increases strongly with decreasing GDC and increasing LSCF amount. The value of 5.418  Å for pure GDC increases up to 5.491  Å in the composite with 5% GDC (LSCF95). (See the XRD patterns in Figure 4b). Limited data of GDC and LSCF 50% and 20% from the previous work [6,7,10] also show approximate behavior. Lattice parameter a of LSCF shows similar variation as that of LSM. It decreases from 5.510  Å of pure LSCF to 5.504  Å in 55% LSCF. It decreases again below the percolation threshold (20% LSCF) to 5.496  Å for 5% LSCF. It may be said that the c parameter of LSCF decreased in the composites, as similarly reported [6,7]. Lattice parameters of LSCF and some composites (20 and 50 vol%) reported in [10], are again much different. Such discrepancies in room temperature structure may arise from the different thermal histories as large oxygen content variations occur at temperatures above 600 C [15,28] and thermal and chemical expansions can be differently involved [14,15,28,29,30]. It is notable that the a parameters of FDC in the previous reports are all consistent with the present results, Figure 5a, which are substantially different from those in LSM composites. They increase substantially strongly in the composites with decreasing GDC amount; it appears to be counteracting the decrease in c parameters of LSCF in the composites.
Systematic composition dependence is observed in the composites but the behavior of c parameters of LSCF (Δ) is nontrivial, as it decreases sharply with a small addition of GDC (5%) but increases with further GDC amount. These variations and differences in the Rietveld analysis results can be seen in the raw XRD data Figure 4. The behavior may be related to the microstructures displayed in Figure 2. LSCF single phase shows a corrugated surface upon thermal etching, which may represent different mechanical interactions from the composites with GDC. Due to the small amount of GDC (5%), the expanded lattice of GDC would not apply compressive pressure to LSCF but the small addition of the secondary particles can affect the microstructure development and thus residual strains. Such a non-trivial feature in the c lattice parameter appears also to fit with chemical expansion/contraction of LSCF upon reduction/oxidation which occurs more strongly in the c-axis direction, suggested from studies on La 0.6 Sr 0.4 Co O 3 δ (LSC) and La 0.6 Sr 0.4 Fe O 3 δ (LSF) [30]. The behavior of GDC:LSCF composites may be affected by strong mechanical interactions. Together with strong oxidation-reduction reactions of LSCF, this may contribute to the poorly reproducible conductivity behavior reported below.
On the other hand, no appreciable oxygen stoichiometry variation and chemical expansion is expected in the LSM composition of the present study, La 0.7 Sr 0.3 Mn O 3 ± δ [19,31]. Chemical expansion/contraction in small x = 0.2 occurs also mainly in the a lattice parameter. The conductivity of LSM and its composites was consistent for all heating and cooling cycles.

3.3. Electrical Conductivity

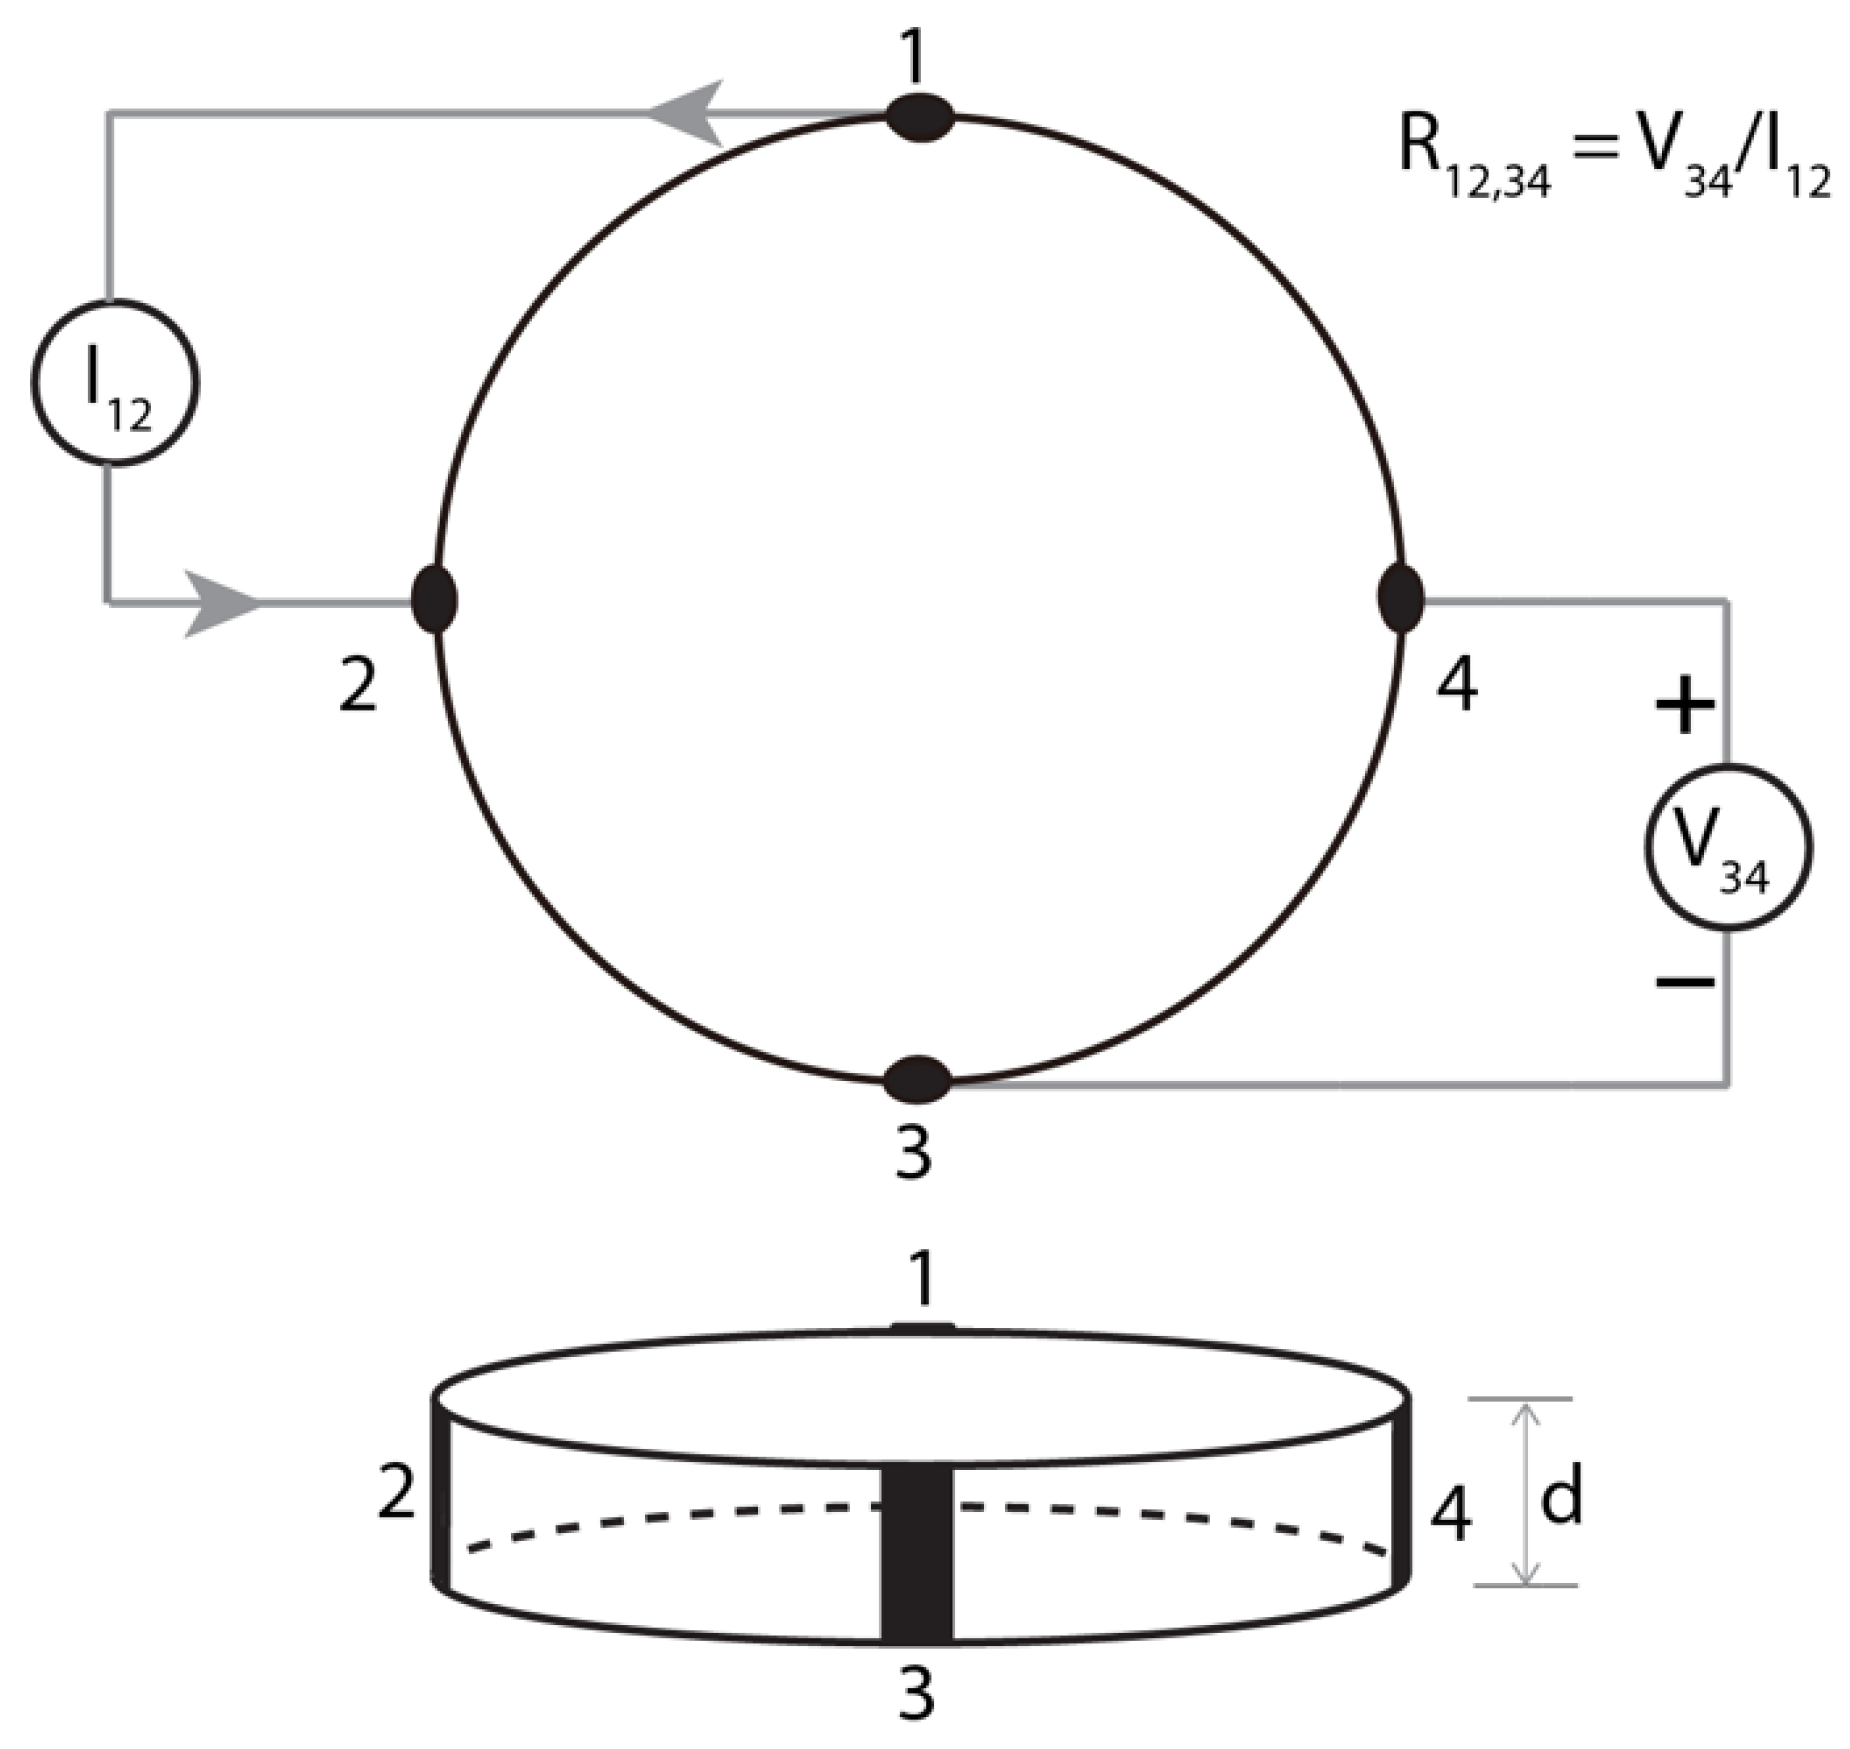
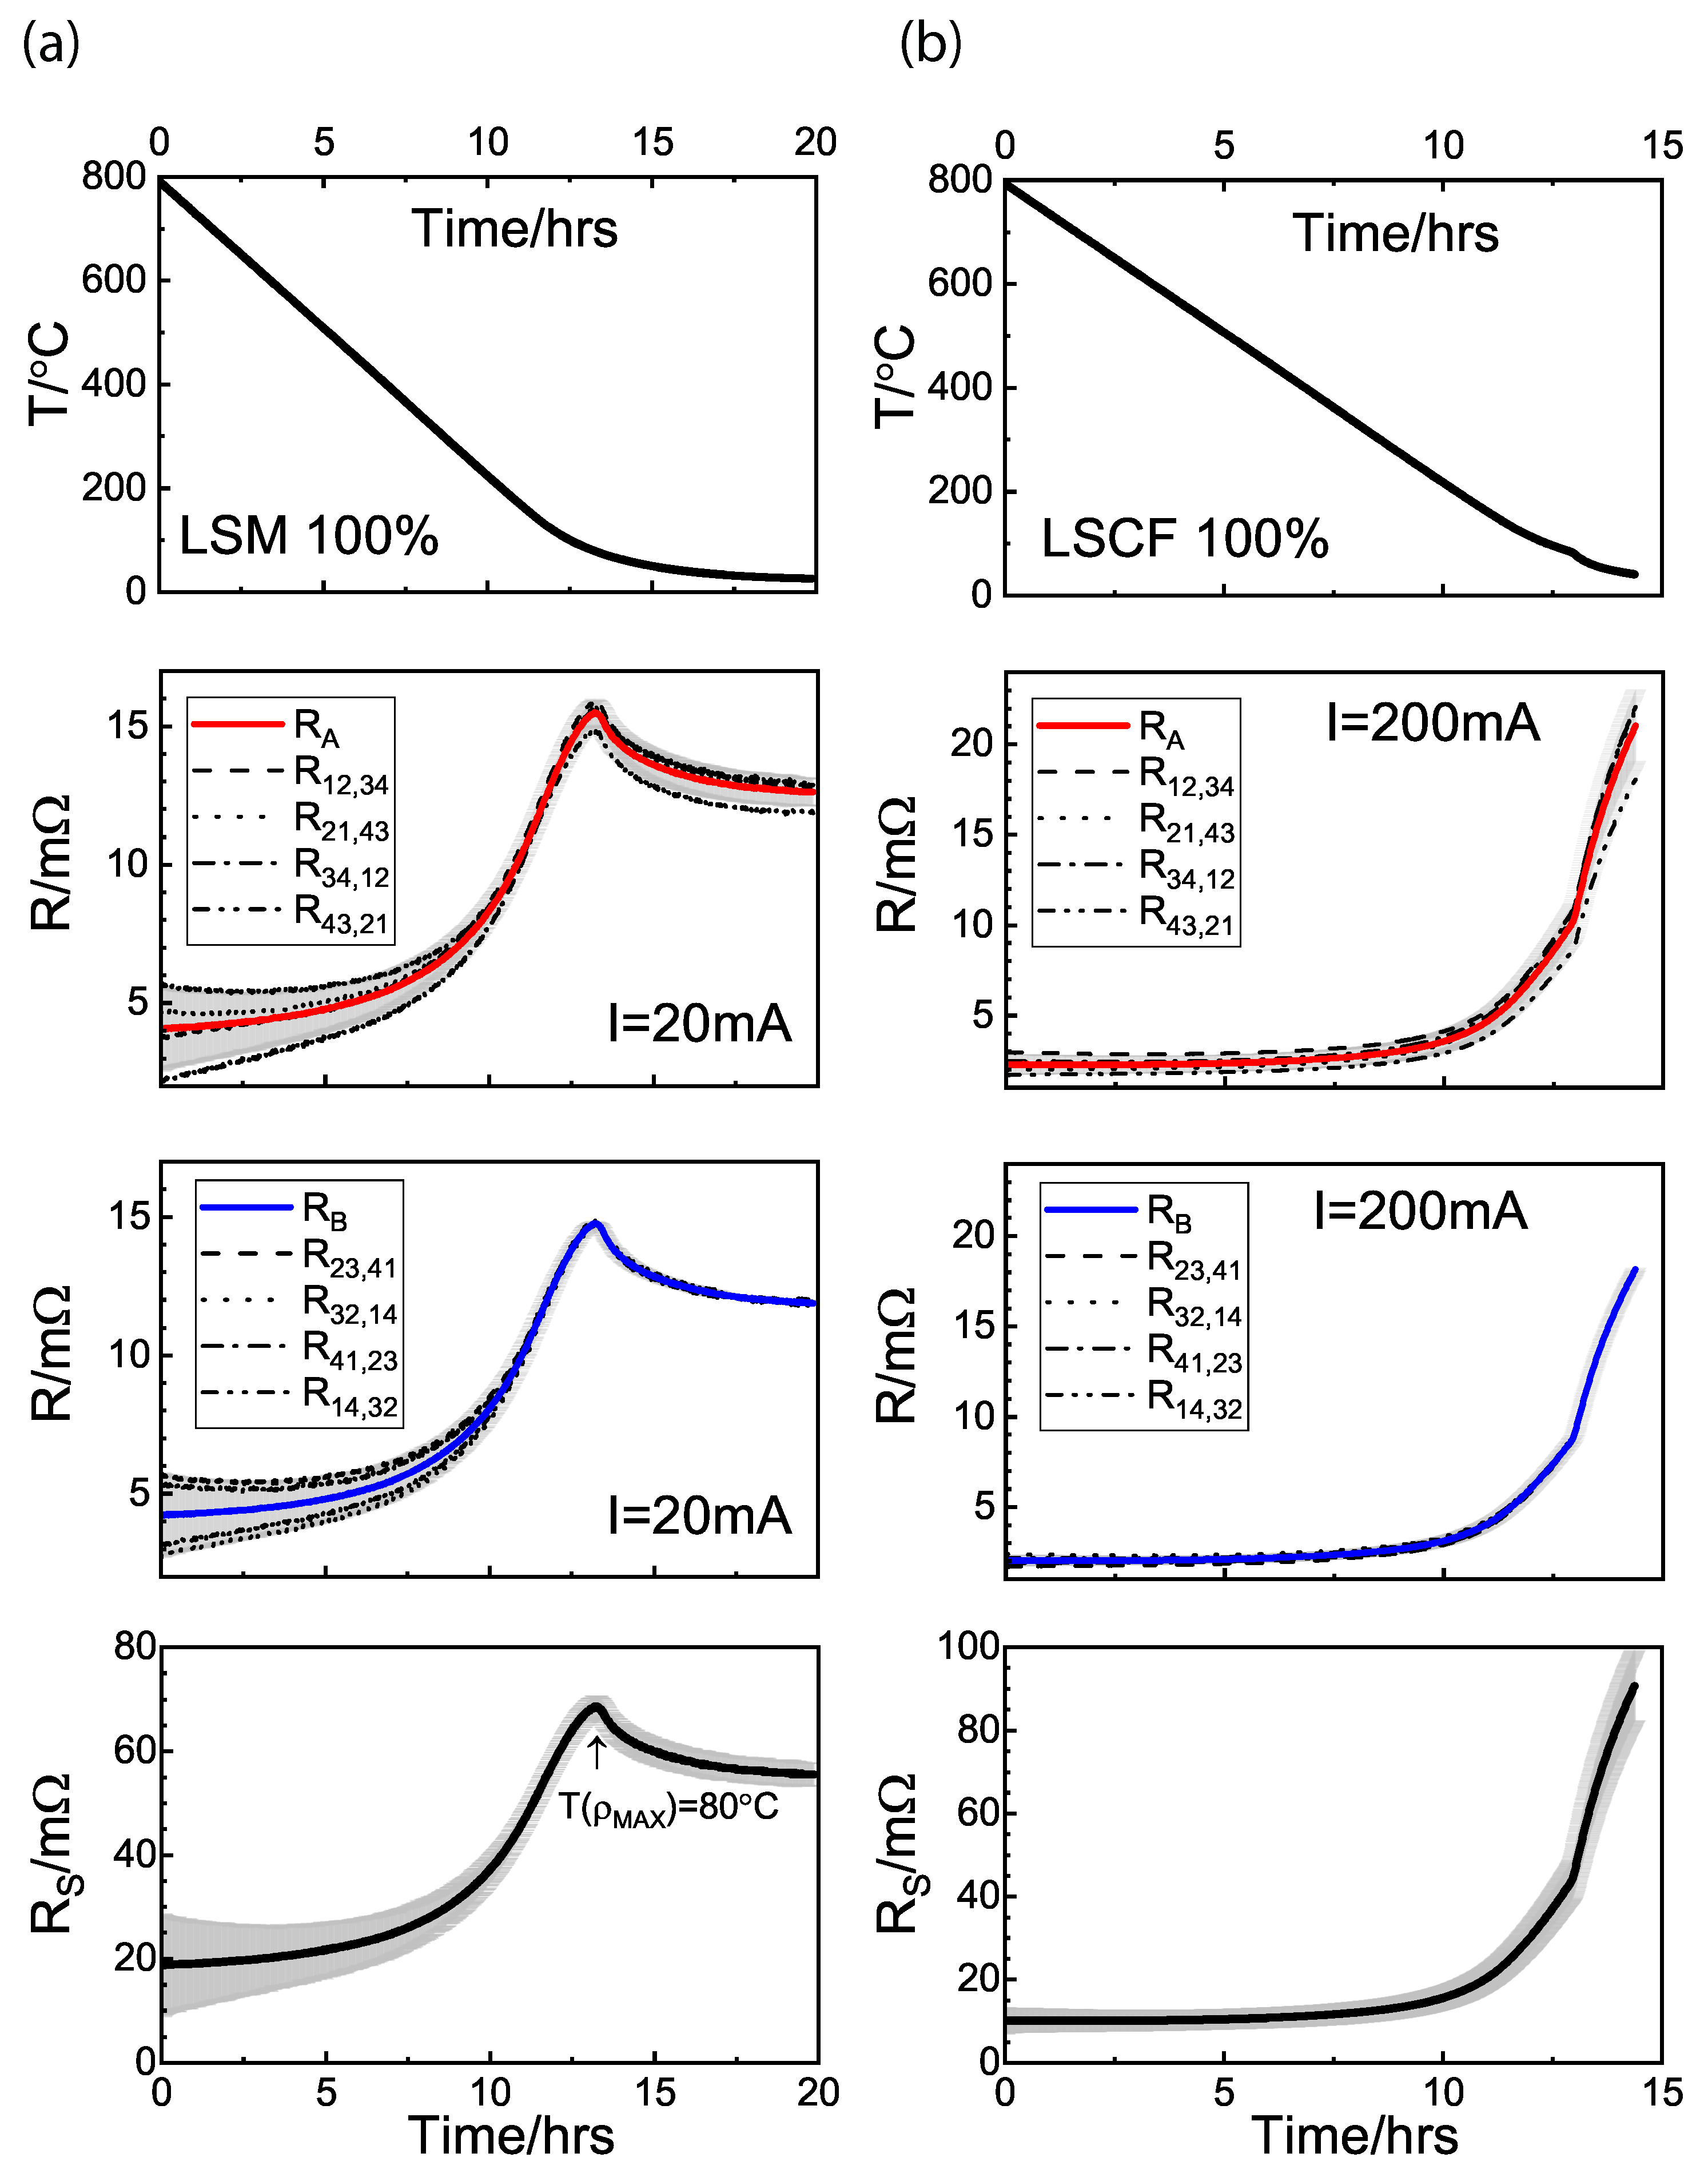
3.3.1. van Der Pauw Method

In the present work, the van der Pauw method was applied to disk-type samples as previously reported [26]. The technique can be accurately applicable for the bulk samples when the peripheral line contacts are made all through the thickness [32,33]. It can be also easily applied to thin samples prepared from laminated tapes or in operating membranes [7,9,11].
Conductivity, σ , was obtained from the sheet resistance R S = ( σ d ) 1 with d as disk thickness, using the average of four measurements for the respective electrode combinations [34,35], i.e.,
R A = R 12 , 34 + R 34 , 12 + R 21 , 43 + R 43 , 21 4
R B = R 23 , 41 + R 41 , 23 + R 32 , 14 + R 14 , 32 4
as
exp π R A R S + exp π R B R S = 1
Using the average of polarity reversed and reciprocal (current-voltage electrode interchanged) measurements can reduce the errors from thermal voltage from temperature inhomogeneity, electrode conditions not ideally suited for the van der Pauw principle, a drift in the zero-point of voltmeters, etc. If the electrode geometry is ideally as shown in Figure 1, R A , and R B , in fact, all R i j , k l ’s should be same, and Equation (3) becomes
2 exp π R A / B R S = 1
which allows a straightforward analytic evaluation. In some measurements of this study, R A and R B were found indeed to be very close. However, as some off-symmetry is generally involved in the preparation of the electrodes and installation, they are more or less different. The implicit Equation (3) was solved using LabVIEW Mathematics VI in situ [36] and recorded together with the raw data. The convergence limit was set to 0.05%.
The standard deviation of R A and R B , respectively, averaged over the reversed polarity and reciprocal measurements, Equations (1) and (2), varied from 0.001%, i.e., almost identical, up to a few 10% depending on the samples, electrode states, temperatures, and applied current values. Small voltage values resulting from small resistance can be strongly affected by the thermal voltages and other noises. As examples, Figure 7 shows the data of LSM and LSCF single phases from automated measurements containing time; temperature; current value; eight voltage values; and evaluated R A , R B , and R S values. The four reverse and reciprocal measurement results are shown to differ more at high temperature when the resistance is small and the applied current is small and hence the voltage becomes as small as 0.01 mV. The standard deviation of R A and R B and therefrom propagated errors for R S are shown to be as large as a few 10% in Figure 7a, at high temperature. The current level should be increased for a high voltage signal to noise ratio. Higher current, as shown in the case of LSCF, reduces the deviation. After several failures of the channel circuits from overcurrent, applied current levels are limited to 200 mA. Note that the difference in reversed polarity and reciprocal measurements is attributed to the small signal to noise ratio and also the quality of the electrode contacts. These issues are addressed by averaging the four measurements. The standard deviations or the differences between the four measurements and therefrom evaluated propagated errors of sheet resistance do not necessarily represent the uncertainty of the conductivity finally obtained. Large errors in the conductivity can result if only one or two measurements are made but no information or idea of the inaccuracy would be found.

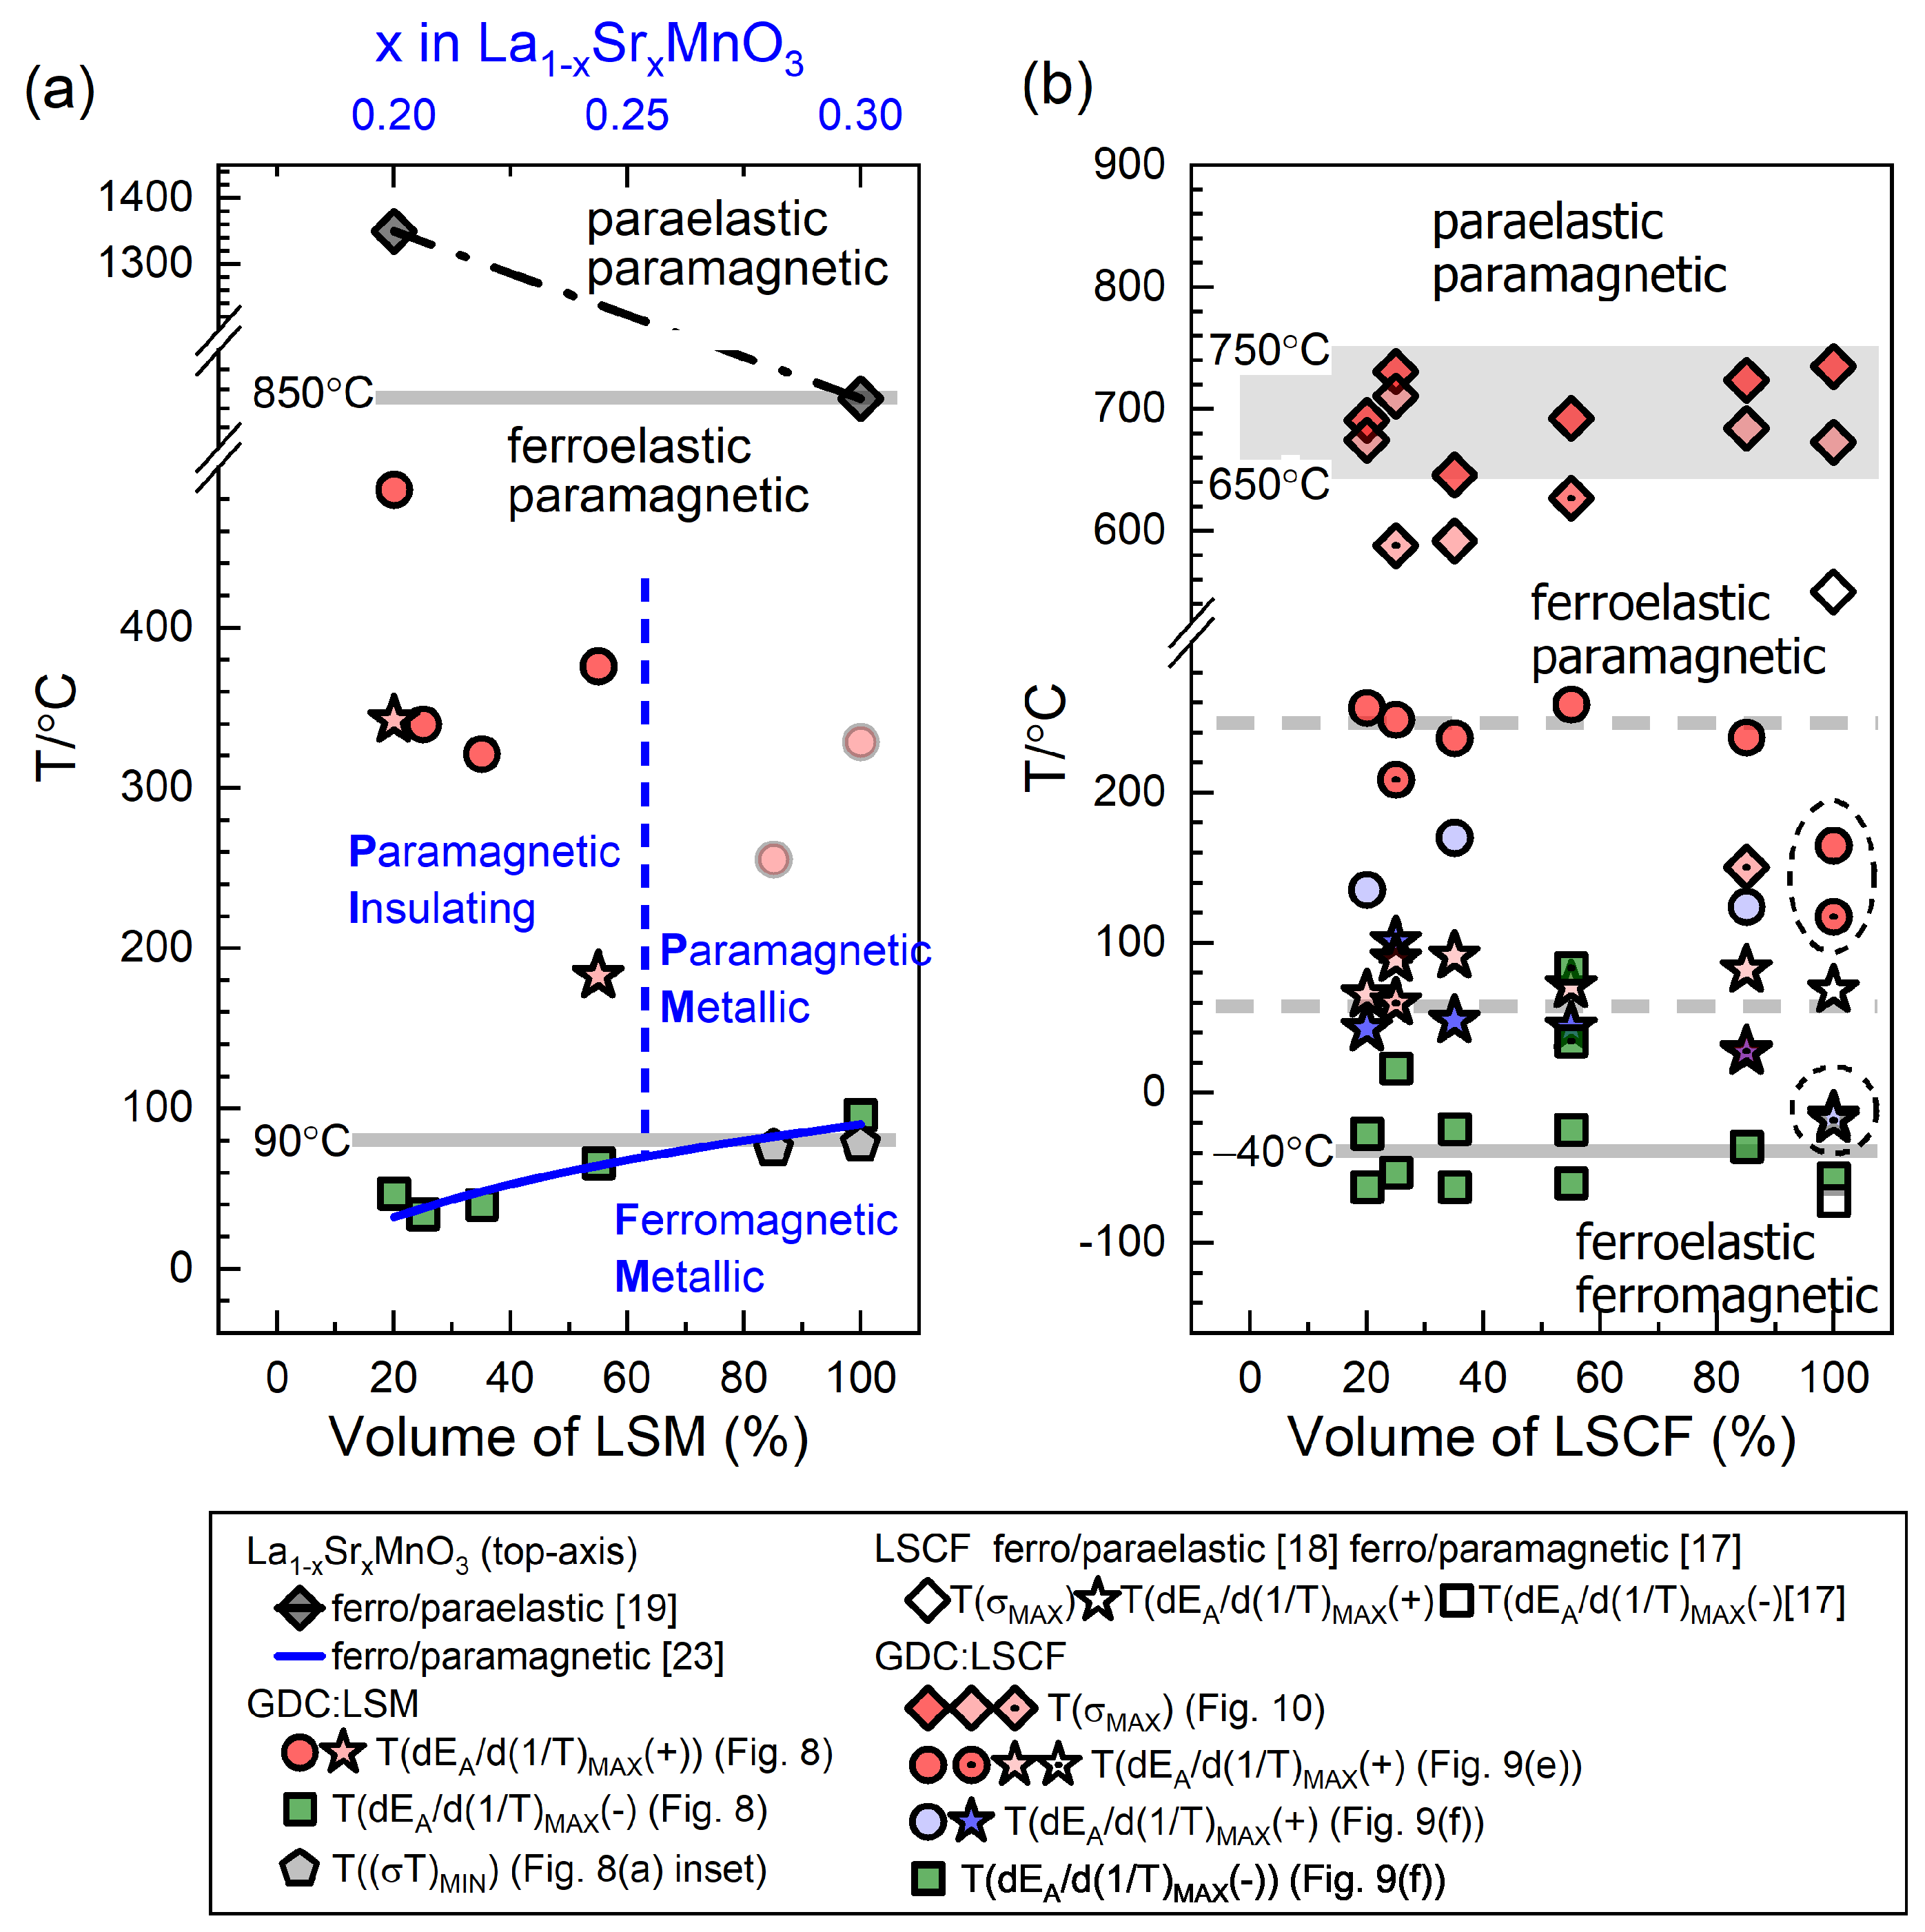
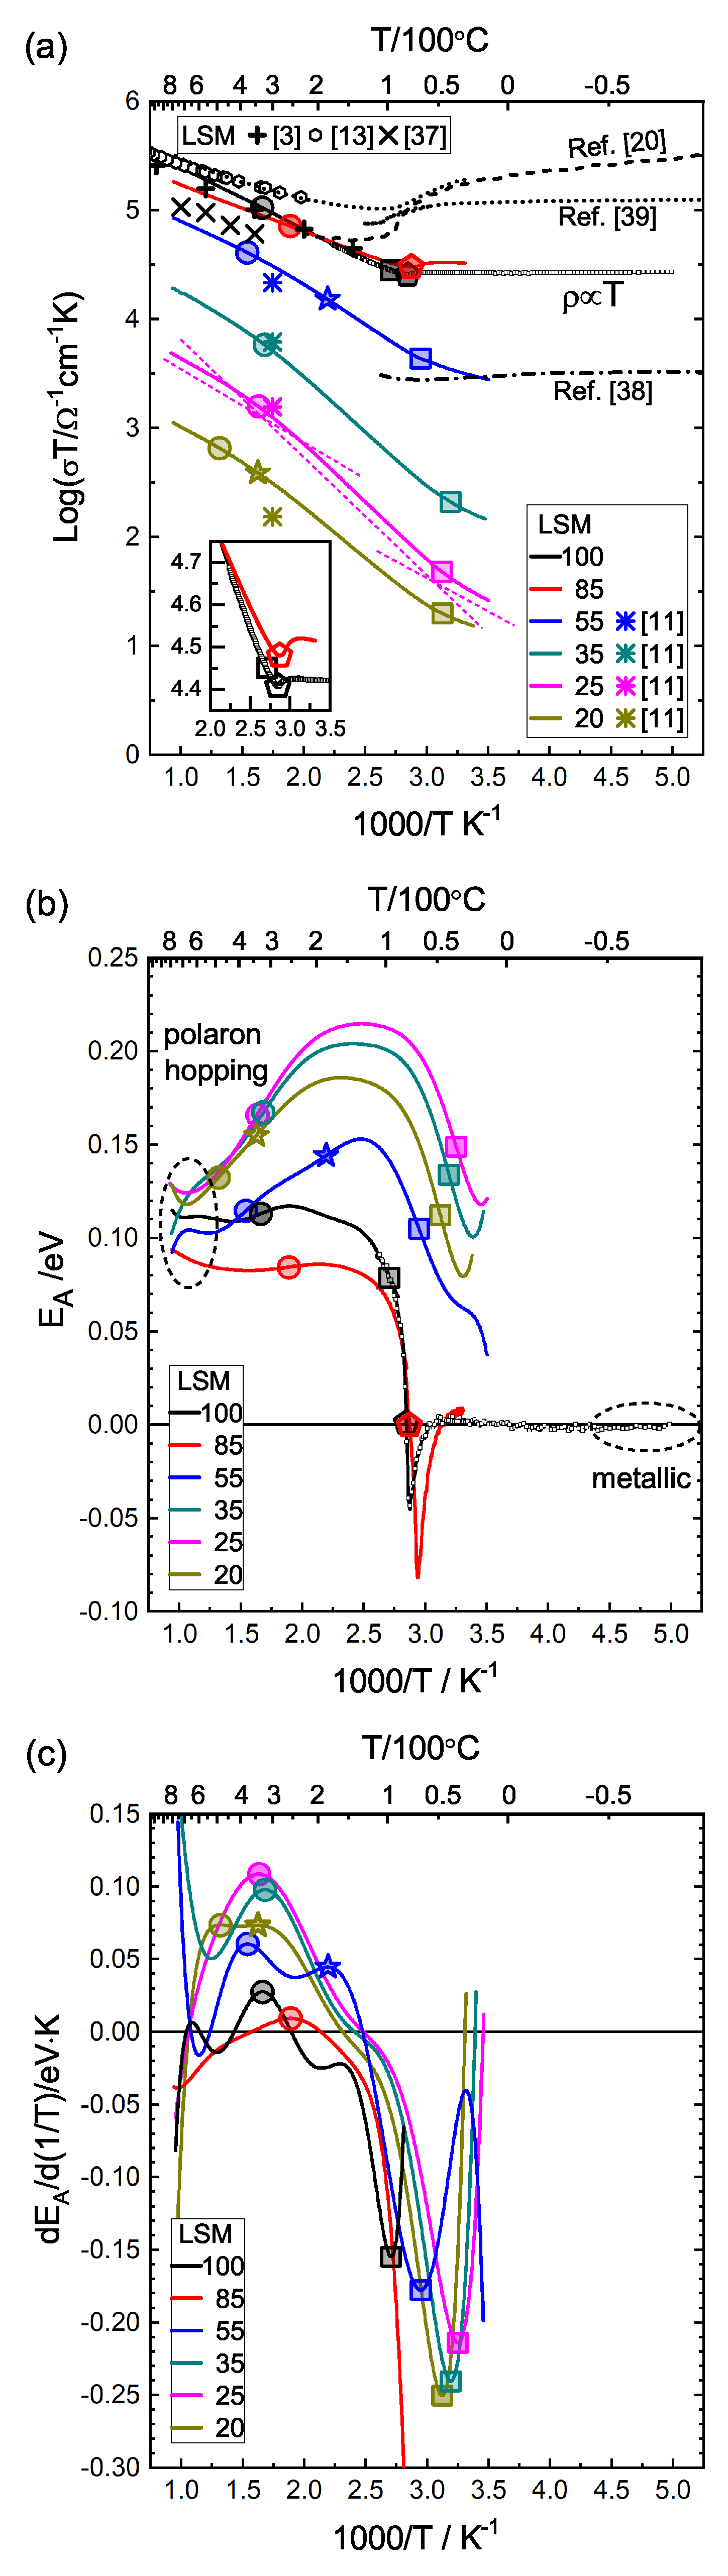
3.3.2. GDC:LSM Composites

Solid lines in Figure 8a present the conductivity of LSM and the composites with GDC in Arrhenius plots using the raw data as shown in Figure 7 for LSM. The conductivity has been measured on multiple heating and cooling cycles from room temperature to approximately 800 C at 1 C /min in flowing dry air. The temperature dependence of LSM and the composites was almost exactly reproducible, and the data presented are from the final cooling leg. Conductivity did not change appreciably in nitrogen gas. According to Mizusaki et al. [31], the composition above x = 0.3 in La 0.7 Sr 0.3 MnO 3 ± δ is almost stoichiometric, δ 0. The same LSM sample was loaded in a cryostat and the conductivity was similarly measured by the van der Pauw method from 177 C –−73 C . The inset graph shows clearly the exact consistency of the data measured in two different setups.
A sharp minimum of σ T shown at 78 C and also for the composite containing 85% at 75 C , indicated by a pentagon symbol, is related to para-to-ferromagnetic phase transitions observed for La 1 x Sr x MnO 3 d for x in the range 0.09–0.5 [21,22,23]. Note that the σ T maximum becomes slightly lower than the resistivity maximum, 80 C , as indicated in Figure 7. T C , Curie temperature, of LSM with x = 0.3 , is 90 C , approximately 10 C higher than the extremum points in conductivity or resistivity. These temperatures are indicated in Figure 6a as T ( ( σ T ) MIN ) . It is notable that the resistivity ( ρ ) of LSM measured at low temperature (LT) using a cryostat shows a linear dependence, or constant σ T , below room temperature, presenting metallic behavior of the ferromagnetic LSM phase [21,23]. The reported conductivity behavior of LSM with x = 0.3 is different from the present results and also widely varied as shown by the dashed line [20], dotted [39], and dash-dotted line [38], in the magnitudes as well as the temperature dependence. Single crystalline samples [20,38] and pellets or thin films [39] were measured. The magnitude and the temperature dependence were shown to vary widely in films of different thicknesses, oxygen contents, and substrates [40,41].
The ferro-paramagnetic transition of LSM is described as a metal-insulator transition (MIT) [21]. However, as discussed in the reports [38,39] the dotted line and dash-dotted line does not present an insulating or semiconducting behavior above T C . Metallic conduction mechanism at temperatures sufficiently below T C is clearly indicated in all cases. In fact, as indicated in Figure 6a using the top-axis, there is a phase boundary in the paramagnetic phase at x 0.26 [21,23] close to x = 0.3 , the nominal composition, dividing paramagnetic insulating and paramagnetic metallic states.
The reported conductivity of GDC:LSM composites of LSM 55, 35, 25, and 20 vol%, prepared from the same raw materials, at 300 C [11] are indicated by ∗ in the respective colors for the composite compositions. Considering the variation between samples especially close to the percolation threshold, the present results are more or less consistent. Conductivity of the composites with LSM 85% is similar to that of LSM but somewhat lower E A of 0.09 eV (vs. 0.11 eV of LSM). A crossover exists approximately 200 C . The conductivity is lower than pure LSM at high temperature as expected but higher at low temperature. As LSM and all composites exhibit more or less thermally activated σ T , and the composites with LSM less than 85% do not show the conductivity cusps, the temperature where the strongest change in the activation energies may be considered as an indication of a weak metal–insulator transition (MIT). This is illustrated for the conductivity curve of LSM 25% in Figure 8a, pink line. The transition point corresponds to the crossing point of two Arrhenius plots, indicated by a large open square, either graphically or by linear regression, as shown by the guide lines, shifted for visibility. As the changes are not strong and are an estimation, the evaluation is subject to arbitrariness.
To examine the temperature dependence of the composites systematically, first and second derivatives of the Arrhenius plots are prepared as shown in Figure 8b,c. The first derivative of σ T provides the E A = d ( σ T ) / d ( 1 / T ) · k values as a function of temperature. The inflections in the Arrhenius plots for large change in the temperature dependence correspond to the extremum points in the second derivative or d E A / d ( 1 / T ) = d 2 ( σ T ) / d ( 1 / T ) 2 · k . Numerical differentiation was performed on the ninth order polynomial fitted curves of the smooth raw conductivity curves excluding the sharp transitions in the LSM and LSM 85% samples near T C . The ninth order is the highest order in polynominal fitting provided in OriginLab®. As known for the thermocouple polynomials [42], polynomial fitted curves are indistinguishable from the experimental data curves. An equal interval of 2000 data allowed a good quality numerical differentiation up to second order, while the irregular data interval and small fluctuations in the real data result in the noisy first derivatives, and noisier second derivatives. Numerical differentiation of the fitted curve and the experimental low temperature data of LSM were found to match nicely, see Figure 8b. The differential plots near the data limits are associated with artifacts generally involved in the numerical analysis using discrete data.
Conductivity inflection points indicating ferro-to-paramagnetic or metal–insulator transitions obtained by the negative extrema of the derivative of the activation energy curves, T ( d E A / d ( 1 / T ) MAX ( ) ) , are indicated by large open squares consistently in Figure 8a–c. The transition points are found to be gradually decreasing in the composites, Figure 6a. The change in T C is compared with the variation with x in La 1 x Sr x MnO 3 δ [21,23], represented using the top axis in Figure 6a. Comparison with the phase diagram of x is further notable, as the paramagnetic insulating and paramagnetic metallic transition around x = 0.26 divides the composites exhibiting higher activation energy around 0.2 eV, 20, 25, 35%, from those exhibiting activation energy around 0.1 eV or lower, 85% and 100%, in the intermediate temperature range 100 C –200 C above T C , Figure 8b.
This composition dependence of the conductivity of GDC:LSM composites corresponds to the dependence at 300 C for percolation behavior [11], which is also indicated for the compositions above the percolation threshold, see Figure 8. Conductivity decreases by three orders of magnitude in 20% LSM. The variation was fitted to a percolation theory using a percolation exponent and threshold depending on the microstructure for connectivity. Strong decrease in the composites with 55, 35, 25, and 20% LSM above the percolation threshold, at 300 C and lower temperatures should be ascribed to the higher activation energies of the composites with a paramagnetic insulating behavior, see Figure 6a.
At high temperatures above 500 C all the composites show the similar temperature dependence 0.09–0.13 eV, as can be seen in Figure 8b, which is well known for LSM as an indication of the small polaron hopping conduction of electron holes in e g levels by the Mn disproportionation reaction [13] Therefore, an inflection exists for the composites of a paramagnetic insulating character, which correspond to the positive extrema of Figure 8c, T ( d E A / d ( 1 / T ) MAX ( + ) ) . Composites with 20 and 55 vol% LSM appear to indicate two transitions. The transition points are indicated by large circles with the secondary ones indicated by stars, consistently in Figure 8a–c, and in the phase diagram, see Figure 6a. Such points may be also found for 100 and 85% LSM but there is little difference in activation energy values. Therefore, as indicated in Figure 6a, in GDC:LSM composites, the composition variation has similar effects as concentration in La 1 x Sr x MnO 3 ± δ . Lattice parameter increase in GDC in composites, as shown in Figure 5a was ascribed to the La 3 + incorporation and the consequent A-site deficiency may induce Ce incorporation in perovskites. The increase of GDC lattice parameter in GDC:LSM composites is not much notable, especially compared to that of GDC:LSCF composites. Cation interdiffusion or segregation can occur at high temperature and the evidence was reported [5,7,11]. The interaction is generally inhomogeneous and limited to the phase boundaries, but overall effects and processes for the stoichiometry or non-stoichiometry of the two phases present are generally difficult to explain.
In Figure 6a, the rhomobohedral-cubic or ferroelastic-paraelastic transtion of LSM x = 0.3 , 850 C and for x = 0.2 , 1350 C , from in situ XRD [19] is also indicated. The transition temperature is higher than the maximum temperature of this work, 800 C . This phase transition does not appear to have an appreciable effect on the conductivity [13].
As shown in Figure 5a, GDC lattice parameters increase with increasing LSM amount in the composites, almost linearly. In view of the chemical expansion, GDC may become slightly non-stoichiometric (reduced) in composites [43]. For LSM, while c parameters of LSM remains essentially the same, a parameters in(de)crease non-linearly with increasing LSM (GDC) amount Figure 5b. LSM in composites may become slightly oxidized compared to single phase LSM, according to the chemical expansion observed for x = 0.2 [19]. Chemical expansion/contraction is found to be anisotropic in LSM, preferentially in the a parameters, which appears consistent with the lattice variations observed. Presently, it cannot be concluded whether there exists certain variations in cation compositions or oxygen content and how these variations and/or lattice parameter variations are related to the observed conductivity variation in GDC:LSM composites.

3.3.3. GDC:LSCF Composites

Figure 9 presents the electrical properties of GDC:LSCF composites, similarly prepared as for GDC:LSM composites, see Figure 8. As the para-ferromagnetic transition of LSCF is 40   C , low temperature measurements using a cryostat were made for all samples. For the data visibility, the two measurements are shown in separate graphs and the comparison of two measurements can be easily made by overlapping the two graphs. Activation energy values from the differentiation of the Arrhenius plots in (c) and (d), and the derivatives of the activation energy curves in (e) and (f) are, respectively, shown. Similarly as for Figure 8, conductivity transition points are obtained from the extrema points of the secondary derivatives of the conductivity curves, which are consistently indicated by large open circles, stars and squares.
High-temperature conductivity plots in Figure 9a may look similar to that of the LSM system, Figure 8a, but, unlike the LSM system, the results of LSCF and the composites were poorly reproducible on the repeated cycling between room temperature and 800 C , and more or less a mismatch exists between the consecutive measurements using an electric furnace (Figure 9a) and a cryostat, see Figure 9b.
Stevenson et al. [15] reported a reproducible oxygen content variation and conductivity in air from room temperature to 1000 C –1200 C on heating and cooling rates 1.6, 2, 5 C /min in air. The conductivity from in [15] is indicated by the symbol “×” in Figure 9a, which is also consistent with the data from in [16] (symbol “+”) and from in [17] including at low temperature. The LSCF conductivity of the present work is largely similar to these reports but the conductivity below 200 C became smaller upon repeated cycling, as shown by the dashed line, and saturated to the solid line in Figure 9a. The conductivity shown by the solid line was consistently measured in the cryostat for the overlapping temperature range (see Figure 9b), which displays a considerable difference from the previous reports at low temperature. In the present work, heating and cooling rates were 1 C /min and due to the thermal mass of the furnace, cooling below 100   C became even slower, as can be seen in Figure 7a. Therefore, the conductivity in the present work, different from literature below 200   C could be closer to the equilibrium value.
Composites showed unsystematic variations upon repeated cycling. The first heating curves (not shown) indicated sporadic events which were not reproduced. Conductivity plots reproducible at least for a consecutive heating/cooling run are presented in dashed lines in Figure 9a together with the results exhibiting more or less “regular” temperature dependence in solid lines. Such behavior can be first attributed to large oxygen content variation at high temperature within the measurement range of the present work. Oxygen content was shown to decrease substantially above 600   C [14,15,28,44]. Substantial decrease in oxygen content is reflected in the conductivity decrease above 600   C , which was ascribed to the decrease in the hole carrier concentration [15]. This report is reproduced in Figure 10. Conductivity increased to 250 Ω 1 c m 1 or σ / σ MAX = 0.619 at 100   C , reached a maximum of 402 Ω 1 c m 1 at 550   C , T ( σ MAX ) , and decrease to 223 Ω 1 c m 1 or σ / σ MAX = 0.556 at 940   C and further to 140 Ω 1 c m 1 or σ / σ MAX = 0.350 at 1100   C . Similar behavior was reported by Araki et al. [45], the dash-dotted line. This behavior was described as order-disorder transitions of oxygen vacancies [15], which is in fact accompanied by a second order structural transition from ferroelastic rhombohedral to paraelastic cubic phase [16,17,18]. From in situ XRD the phase transition temperature was defined rather broadly between 650 C and 750 C [18], which is indicated in the gray box in Figure 6b. This range for ferro-to-paraelastic transitions appear more consistent with the observation of the present work. As shown in Figure 10, the conductivity maximum on heating at 735 C , indicated in closed diamonds, and at 673 C on cooling, indicated in open diamonds, has a difference of 128 C . Mechanical stress/strain associated phase transitions, well known by martensitic transitions, often involve large thermal hystereses. Recently, a thermal hysteresis in dielectric response in a ferroelectric perovskite was also reported, which can be similarly ascribed to the rhomobohderal-cubic phase transition [46]. It can be seen that the conductivity keeps decreasing during the dwell at 800 C for 30 min, so the cooling curve behavior would depend on the thermal schedule.
Figure 10 presents the normalized conductivity to plot together the conductivity of composites that differ by orders of magnitude, see Figure 9a. Similar hystereses were observed for GDC:LSCF composites and the conductivity maximum points, T ( σ MAX ) , as presented in Figure 6b appear to decrease with increasing GDC fraction or with decreasing LSCF fraction as 85, 55, 35 vol%.
The conductivity curve of 25% LSCF in the dashed line in Figure 9 exhibits T ( σ MAX ) , following the trend, but the data of 25% and 20% in solid lines exhibits similar T ( σ MAX ) as 85% and 100%. Eccentric behavior of the conductivity curve of 85% in the dashed line shows the maximum conductivity at 150 C . As noted above, the different conductivity curves were measured stably and reproducibly for some cycles. The solid line and dashed line for the respective samples are shown to merge at low temperature or at high temperature at the temperatures indicated by large circes and starts, where the temperature dependence becomes steeper on cooling in the regular conductivity curves, T ( d E A / d ( 1 / T ) MAX ( + ) , 245   C (large circles) and 60   C (stars). Upon repeated cycling the conductivity curves appear to choose either to change the temperature dependence or to stay similarly, at these characteristic transition points.
Unlike the much studied La 1 x Sr x MnO 3 ± δ system, the electronic structure of La 1 x Sr x Co 1 y Fe y O 3 δ , with the complication of the presence of two transition metals, has not been yet definitely studied. For the present composition, La 0.6 Sr 0.4 Co 0.2 Fe 0.8 O 3 δ , despite the smaller amount of Co than Fe, the electronic structure is shown to be closer to Co-rich compositions and conduction mechanism is attributed to small polaron hopping via disproportionation of Co 3 + into Co 2 + and Co 4 + ions [14,47].
More or less regular conductivity behavior was consecutively followed in the low temperature setup, as shown in Figure 9b. Para-ferromagnetic transitions have been reported to be around 40   C [17,48]. Anomalous variation of the mechanical behavior during the magnetic transition was also reported [48]. The conductivity of the composites measured in a cryostat in Figure 9b was found not exactly matching with the data from high temperature in Figure 9a but somewhat shifted downward. From the results of LSM, this may not be ascribed to artifacts or errors associated with the measurement method or setup. As suggested by the changes upon repeated cycling in high temperature measurements, the conduction properties of LSCF and composites appear to vary in a subtle way. Some reduction may occur in the cryostat operating in vacuum. No conductivity cusps as for LSM appear in LSCF but similarly weak metal–insulator transitions can be found near T C , which are indicated by large squares in Figure 9b,d,f. Broad transitions were analyzed into two inflections. As shown in Figure 6b, the transition points roughly coincide with the known magnetic transition points.
Although scattered looking from broad transitions and from different conductivity curves, conductivity transition points from the derivative curves, T ( d E A / d ( 1 / T ) MAX ( + ) ) in circles and stars and T ( d E A / d ( 1 / T ) MAX ( ) ) in squares in Figure 9, as shown in Figure 6b, indicate temperatures as 245   C and 60   C as well as ∼−40 C near Curie temperature, without any notable dependence on the composite composition. LSCF of the present work as well as the literature data [17] exhibit substantially lower transition points than the composites. This behavior may be related to the room temperature XRD analysis shown in Figure 5. The c parameter of LSCF decreased in composites with a small addition of GDC as 5%, which however increases with further addition. Concomitantly, GDC lattice parameter increases strongly in composites. The effect of small GDC amount may be the grain growth control and the resultant difference in microstructure may be responsible for the difference of single phase LSCF from the composites.

4. Conclusions

Conductivity of disk samples of GDC:LSM and GDC:LSCF composites containing 20, 25, 35, 55, 85 vol% as well as single phase perovskite was accurately evaluated from the four resistances measured in reversed polarity and reciprocal configuration for the respective two pairs of electrodes in the van der Pauw method. Quasi-continuously measured conductivity plots over a wide temperature range using two setups for high and low temperature ranges for 800 C –−73 C , with overlapped range between 177 C and room temperature, allowed for polynomial fitting and numerical differentiation so that the transition points in the Arrhenius behavior were systematically obtained for different composite compositions from the extremum points of the second derivatives. While LSM containing samples showed reproducible conductivity trajectories, the LSCF system exhibited unsystematic changes which may be related to the substantial oxidation/reduction accompanying ferroelastic-paraelastic transitions at 650 C –750 C . The transitions are indicated by conductivity maxima and substantial hyteresis was identified, which appeared to decrease in composites with increasing GDC amounts.
A sudden decrease in activation energies on cooling, indicating a weak insulator–metal transition, corresponds to para-to-ferromagnetic transitions. T C = 90 C of LSM appears to gradually decrease in composites to 40   C for 20 vol%. On the other hand, multiple, less clear transitions in LSCF composites of 20 to 55 vol% were identified around T C 40 C of LSCF. Relatively insulating phases above T C are characterized by the activation energy values around 0.2 eV, which are higher than the values around 0.1 eV known for small polaron hopping mechanisms in LSM and LSCF at higher temperatures 600 C –800 C for LSM and 300 C –500 C for LSCF. For LSM, GDC-rich composites as 20, 25, and 35% LSM exhibit higher transition points and larger activation energies, which suggests variation with decreasing x together with the decrease in T C suggests the transition to more insulating phase with decreasing x in La 1 x Sr x MnO 3 ± δ . Similar transitions of increasing activation energies, although scattered, appear to exist in LSCF composites around 245   C and 60   C without any clear trend but LSCF shows distinctly lower transition points. The singular behavior of LSCF appears matching with the structural analysis. The GDC:LSCF composites showed with increasing LSCF amount, decreasing c parameters, increasing a parameters, and thus constant lattice volumes of LSCF and substantially increasing GDC lattice parameter. The c parameter of single phase LSCF is much larger than that for the composites with a small amount of GDC. The role of a small amount of GDC on the crystal structures may be the grain size control, which may affect the elastic properties and also oxidation/reduction in a subtle way.

Author Contributions

J.-S.L. designed the experiments, reviewed the data. T.L.P. prepared the samples, performed the experiments, and wrote the draft of the manuscript. J.-S.L. and J.H.Y. revised the manuscript. All authors have read and agreed to the published version of the manuscript.

Funding

This research was funded by the Korea Institute of Energy Research (KIER) grant number B8-2415. Finalization of the work was partly supported by the National Research Foundation (NRF) of Korea funded by the Ministry of Science and ICT (MSIT) (NRF-2018R1A5A1025224).

Data Availability Statement

The data presented in this study are available in doi:10.5281/zenodo.4996965.

Acknowledgments

The authors thank John G. Fisher (Chonnam National University) for carefully proofreading the manuscript.

Conflicts of Interest

The authors declare no conflict of interest.

References

  1. Xu, S.J.; Thomson, W.J. Stability of La0.6Sr0.4Co0.2Fe0.8O3−δ perovskite membranes in reducing and nonreducing environments. Ind. Eng. Chem. Res. 1998, 37, 1290–1299. [Google Scholar] [CrossRef]
  2. Xu, S.J.; Thomson, W.J. Oxygen permeation rates through ion-conducting perovskite membranes. Chem. Eng. Sci. 1999, 54, 3839–3850. [Google Scholar] [CrossRef]
  3. Kharton, V.; Kovalevsky, A.; Viskup, A.; Figueiredo, F.; Yaremchenko, A.; Naumovich, E.; Marques, F. Oxygen Permeability of Ce0.8Gd0.2O2−δ-La0.7Sr0.3MnO3−δ Composite Membranes. J. Electrochem. Soc. 2000, 147, 2814. [Google Scholar] [CrossRef]
  4. Kharton, V.; Kovalevsky, A.; Viskup, A.; Figueiredo, F.; Yaremchenko, A.; Naumovich, E.; Marques, F. Oxygen permeability and Faradaic efficiency of Ce0.8Gd0.2O2−δ-La0.7Sr0.3MnO3−δ composites. J. Eur. Ceram. Soc. 2001, 21, 1763–1767. [Google Scholar] [CrossRef]
  5. Shaula, A.; Kharton, V.; Marques, F.; Kovalevsky, A.; Viskup, A.; Naumovich, E. Oxygen permeability of mixed-conducting composite membranes: Effects of phase interaction. J. Solid State Electrochem. 2006, 10, 28–40. [Google Scholar] [CrossRef]
  6. Joo, J.H.; Park, G.S.; Yoo, C.Y.; Yu, J.H. Contribution of the surface exchange kinetics to the oxygen transport properties in Ce0.9Gd0.1O2−δ-La0.6Sr0.4Co0.2Fe0.8O3−δ dual-phase membrane. Solid State Ionics 2013, 253, 64–69. [Google Scholar] [CrossRef]
  7. Joo, J.H.; Yun, K.S.; Lee, Y.; Jung, J.; Yoo, C.Y.; Yu, J.H. Dramatically enhanced oxygen fluxes in fluorite-rich dual-phase membrane by surface modification. Chem. Mater. 2014, 26, 4387–4394. [Google Scholar] [CrossRef]
  8. Raju, K.; Kim, S.; Kang, E.J.; Yun, K.S.; Seong, Y.H.; Han, I.S.; Lee, H.K.; Yu, J.H. Two-step sintering technique for enhancing mechanical and oxygen permeation properties of dual-phase oxygen transport membranes. J. Eur. Ceram. Soc. 2021, 41, 4884–4895. [Google Scholar] [CrossRef]
  9. Kim, S.; Kim, S.H.; Lee, K.S.; Yu, J.H.; Seong, Y.H.; Han, I.S. Mechanical properties of LSCF (La0.6Sr0.4Co0.2Fe0.8O3−δ)-GDC (Ce0.9Gd0.1O2−δ) for oxygen transport membranes. Ceram. Int. 2017, 43, 1916–1921. [Google Scholar] [CrossRef]
  10. Raju, K.; Kim, S.; Yu, J.H.; Kim, S.H.; Seong, Y.H.; Han, I.S. Rietveld refinement and estimation of residual stress in GDC-LSCF oxygen transport membrane ceramic composites. Ceram. Int. 2018, 44, 10293–10298. [Google Scholar] [CrossRef]
  11. Joo, J.H.; Yun, K.S.; Kim, J.H.; Lee, Y.; Yoo, C.Y.; Yu, J.H. Substantial oxygen flux in dual-phase membrane of ceria and pure electronic conductor by tailoring the surface. ACS Appl. Mater. Interfaces 2015, 7, 14699–14707. [Google Scholar] [CrossRef] [PubMed]
  12. Na, B.T.; Park, J.H.; Park, J.H.; Yu, J.H.; Joo, J.H. Elucidation of the oxygen surface kinetics in a coated dual-phase membrane for enhancing oxygen permeation flux. ACS Appl. Mater. Interfaces 2017, 9, 19917–19924. [Google Scholar] [CrossRef]
  13. Mizusaki, J.; Yonemura, Y.; Kamata, H.; Ohyama, K.; Mori, N.; Takai, H.; Tagawa, H.; Dokiya, M.; Naraya, K.; Sasamoto, T.; et al. Electronic conductivity, Seebeck coefficient, defect and electronic structure of nonstoichiometric La1−xSrxMnO3. Solid State Ionics 2000, 132, 167–180. [Google Scholar] [CrossRef]
  14. Tai, L.W.; Nasrallah, M.; Anderson, H.; Sparlin, D.; Sehlin, S. Structure and electrical properties of La1−xSrxCo1−yFeyO3. II: The system La1−xSrxFe0.8O3. Solid State Ionics 1995, 76, 273–283. [Google Scholar] [CrossRef]
  15. Stevenson, J.; Armstrong, T.; Carneim, R.; Pederson, L.; Weber, W. Electrochemical properties of mixed conducting perovskites La1−xMxCo1−yFeyO3−δ (M = Sr, Ba, Ca). J. Electrochem. Soc. 1996, 143, 2722. [Google Scholar] [CrossRef]
  16. Araki, W.; Malzbender, J. Electrical conductivity of La0.58Sr0.4Co0.2Fe0.8O3−δ during ferroelastic deformation under uniaxial compressive loading. Solid State Ionics 2013, 233, 67–72. [Google Scholar] [CrossRef]
  17. Araki, W.; Arai, Y.; Malzbender, J. Transitions of Ba0.5Sr0.5Co0.8Fe0.2O3−δ and La0.58Sr0.4Co0.2Fe0.8O3−δ. Mater. Lett. 2014, 132, 295–297. [Google Scholar] [CrossRef]
  18. Zou, Y.; Ziegner, M.; Malzbender, J.; Krüger, M. Investigation of rhombohedral-cubic phase transition of La0.58Sr0.4Co0.2Fe0.8O3−δ using high temperature XRD. Ceram. Int. 2018, 44, 2822–2826. [Google Scholar] [CrossRef]
  19. Grande, T.; Tolchard, J.R.; Selbach, S.M. Anisotropic thermal and chemical expansion in Sr-substituted LaMnO3+δ: Implications for chemical strain relaxation. Chem. Mater. 2012, 24, 338–345. [Google Scholar] [CrossRef]
  20. Urushibara, A.; Moritomo, Y.; Arima, T.; Asamitsu, A.; Kido, G.; Tokura, Y. Insulator-metal transition and giant magnetoresistance in La1−xSrxMnO3. Phys. Rev. B 1995, 51, 14103. [Google Scholar] [CrossRef] [PubMed]
  21. Imada, M.; Fujimori, A.; Tokura, Y. Metal-insulator transitions. Rev. Mod. Phys. 1998, 70, 1039. [Google Scholar] [CrossRef] [Green Version]
  22. Anane, A.; Dupas, C.; Le Dang, K.; Renard, J.; Veillet, P.; de Leon Guevara, A.; Millot, F.; Pinsard, L.; Revcolevschi, A. Transport properties and magnetic behaviour of La1−xSrxMnO3 single crystals. J. Phys. Condens. Matter 1995, 7, 7015. [Google Scholar] [CrossRef]
  23. Tsuda, N.; Nasu, K.; Fujimori, A.; Siratori, K. Electronic Conduction in Oxides; Springer Science & Business Media: New York, NY, USA, 2013; Volume 94. [Google Scholar]
  24. Huang, B.; Steinbrech, R.; Malzbender, J. Direct observation of ferroelastic domain effects in LSCF perovskites. Solid State Ionics 2012, 228, 32–36. [Google Scholar] [CrossRef]
  25. Sun, C.; Alonso, J.A.; Bian, J. Recent advances in perovskite-type oxides for energy conversion and storage applications. Adv. Energy Mater. 2021, 11, 2000459. [Google Scholar] [CrossRef]
  26. Kim, G.R.; Seo, H.H.; Jo, J.M.; Shin, E.C.; Yu, J.H.; Lee, J.S. Moving boundary diffusion problem for hydration kinetics evidenced in non-monotonic conductivity relaxations of proton conducting perovskites. Solid State Ionics 2015, 272, 60–73. [Google Scholar] [CrossRef]
  27. Araki, W.; Yamaguchi, T.; Arai, Y.; Malzbender, J. Strontium surface segregation in La0.58Sr0.4Co0.2Fe0.8O3−δ annealed under compression. Solid State Ionics 2014, 268, 1–6. [Google Scholar] [CrossRef]
  28. Tai, L.; Nasrallah, M.; Anderson, H. Thermochemical stability, electrical conductivity, and seebeck coefficient of Sr-doped LaCo0.2Fe0.8O3−δ. J. Solid State Chem. 1995, 118, 117–124. [Google Scholar] [CrossRef]
  29. Chen, X.; Grande, T. Anisotropic Chemical Expansion of La1−xSrxCoO3−δ. Chem. Mater. 2013, 25, 927–934. [Google Scholar] [CrossRef]
  30. Chen, X.; Grande, T. Anisotropic and Nonlinear Thermal and Chemical Expansion of La1−xSrxFeO3−δ (x = 0.3, 0.4, 0.5) Perovskite Materials. Chem. Mater. 2013, 25, 3296–3306. [Google Scholar] [CrossRef]
  31. Mizusaki, J.; Mori, N.; Takai, H.; Yonemura, Y.; Minamiue, H.; Tagawa, H.; Dokiya, M.; Inaba, H.; Naraya, K.; Sasamoto, T.; et al. Oxygen nonstoichiometry and defect equilibrium in the perovskite-type oxides La1−xSrxMnO3+d. Solid State Ionics 2000, 129, 163–177. [Google Scholar] [CrossRef]
  32. Kasl, C.; Hoch, M. Effects of sample thickness on the van der Pauw technique for resistivity measurements. Rev. Sci. Instrum. 2005, 76, 033907. [Google Scholar] [CrossRef]
  33. Preis, W. Modelling of surface exchange reaction, oxygen diffusion, and conductivity relaxation of solid oxides: Application to the van der Pauw method on disk-shaped samples. Comput. Mater. Sci. 2015, 103, 237–243. [Google Scholar] [CrossRef]
  34. Van der Pauw, L.J. A method of measuring specific resistivity and Hall effect of discs of arbitrary shape. Philips Res. Rep. 1958, 13, 1–9. [Google Scholar]
  35. Van der Pauw, L.J. A method of measuring the resistivity and Hall coefficient on lamellae of arbitrary shape. Philips Tech. Rev. 1959, 20, 220–224. [Google Scholar]
  36. Iterative Numeric Solution to Van Der Pauw Equation Using LabVIEW. 2009. Available online: https://forums.ni.com/t5/Example-Code/Iterative-Numeric-Solution-to-Van-Der-Pauw-Equation-using/ta-p/3518294?profile.language=en (accessed on 20 June 2021).
  37. Godoi, G.S.; de Souza, D.P. Electrical and microstructural characterization of La0.7Sr0.3MnO3 (LSM), Ce0.8Y0.2O2 (CY) and LSM–CY composites. Mater. Sci. Eng. B 2007, 140, 90–97. [Google Scholar] [CrossRef]
  38. Taran, S.; Chaudhuri, B.; Chatterjee, S.; Yang, H.; Neeleshwar, S.; Chen, Y. Critical exponents of the La0.7Sr0.3MnO3, La0.7Ca0.3MnO3, and Pr0.7Ca0.3MnO3 systems showing correlation between transport and magnetic properties. J. Appl. Phys. 2005, 98, 103903. [Google Scholar] [CrossRef]
  39. Snyder, G.J.; Hiskes, R.; DiCarolis, S.; Beasley, M.; Geballe, T. Intrinsic electrical transport and magnetic properties of La0.67Ca0.33MnO3 and La0.67Sr0.33MnO3 MOCVD thin films and bulk material. Phys. Rev. B 1996, 53, 14434. [Google Scholar] [CrossRef]
  40. Nikolaenko, Y.M.; Varyukhin, V.; Medvedev, Y.V.; Efros, N.; Zhikharev, I.; Kara-Murza, S.; Tikhii, A. Optimum oxygen content in La0.7Sr0.3MnO3 thin films. arXiv 2011, arXiv:1111.7180. [Google Scholar]
  41. Tikhii, A.; Gritskih, V.; Kara-Murza, S.; Korchikova, N.; Nikolaenko, Y.M.; Revenko, Y.F.; Reshidova, I.Y.; Zhikharev, I. Optical and magnetoresistive properties of polycrystalline La0.7Sr0.3MnO3 films on crystalline Al2O3 and Gd3Ga5O12 substrates. Low Temp. Phys. 2014, 40, 756–760. [Google Scholar] [CrossRef]
  42. Ripple, D. NIST 60. NIST ITS-90 Thermocouple Database. In World Wide Web-Internet and Web Information Systems; NIST: Gaithersburg, MD, USA, 1999. [Google Scholar]
  43. Bishop, S.; Duncan, K.; Wachsman, E. Defect equilibria and chemical expansion in non-stoichiometric undoped and gadolinium-doped cerium oxide. Electrochim. Acta 2009, 54, 1436–1443. [Google Scholar] [CrossRef]
  44. Dalslet, B.T.; Søgaard, M.; Bouwmeester, H.J.; Hendriksen, P.V. Defect chemistry and oxygen transport of (La0.6Sr0.4−xMx)0.99Co0.2Fe0.8O3−δ, M=Ca (x = 0.05, 0.1), Ba (= 0.1, 0.2), Sr: Part I: Defect chemistry. Solid State Ionics 2009, 180, 1173–1182. [Google Scholar] [CrossRef]
  45. Araki, W.; Malzbender, J. Ferroelastic deformation of La0.58Sr0.4Co0.2Fe0.8O3−δ under uniaxial compressive loading. J. Eur. Ceram. Soc. 2013, 33, 805–812. [Google Scholar] [CrossRef]
  46. Le, P.G.; Tran, T.L.; Kim, H.P.; Jo, W.; Lee, J.S.; Fisher, J.G. Growth of single crystals of 0.75(Na0.5Bi0.5)TiO3-0.25(Sr0.7Ca0.3)TiO3 and characterisation of their electrical properties. Open Ceram. 2021, 6, 100099. [Google Scholar] [CrossRef]
  47. Ritzmann, A.M.; Dieterich, J.M.; Carter, E.A. Density functional theory+ U analysis of the electronic structure and defect chemistry of LSCF (La0.5Sr0.5Co0.25Fe0.75O3−δ). Phys. Chem. Chem. Phys. 2016, 18, 12260–12269. [Google Scholar] [CrossRef] [PubMed]
  48. Araki, W.; Abe, T.; Arai, Y. Anomalous variation of the mechanical behaviour of ferroelastic La0.6Sr0.4Co0.2Fe0.8O3−δ during the ferro-to-paramagnetic transition. Scr. Mater. 2015, 99, 9–12. [Google Scholar] [CrossRef]
Figure 1. Van der Pauw configuration for a disk sample. Electrode contacts are positioned across the lateral sides using Au or Ag paste.
Crystals 11 00712 g001
Figure 2. Back-scattered electron images of (a) GDC:LSM, (b) GDC:LSCF composites with perovskite phase volume in 100, 85, 55, 35, 25, 20, 15, 10, and 5%, and GDC.
Crystals 11 00712 g002
Figure 3. Volume % of LSM (a) and LSCF (b) from image analysis and Rietveld analysis of Table 1 and Table 2.
Crystals 11 00712 g003
Figure 4. Room temperature XRD patterns and Rietveld analysis of the single phase and selected composites: (a) LSM single phase and composites with 85%, 35%, and 5% LSM and (b) LSCF single phase and composites with 95%, 35%, and 5% LSCF. Selected examples from Table 1 and Table 2.
Crystals 11 00712 g004
Figure 5. Lattice parameters and lattice volume of (a) GDC and (b) LSM and LSCF as a function of vol%. from Rietveld refinement in Table 1 and Table 2. Literature data [6,7,10,11] are compared.
Crystals 11 00712 g005
Figure 6. Transitions of (a) GDC:LSM and (b) GDC:LSCF indicated in the conductivity curves in comparison with the phase transitions reported [17,18,19,23]. The phase diagram of La 1 x Sr x MnO 3 ± δ [23] is overlaid using top-axis in (a).
Crystals 11 00712 g006
Figure 7. Temperature, eight resistance values (voltage divided by the applied current) and thereby R A , R B , and R S as a function of the measurement time for the single phase LSM (a) and LSCF sample (b). The standard deviations of R A (Equation (1)), R B (Equation (2)), and the propagated errors of R S (Equation (3)) are indicated in gray.
Crystals 11 00712 g007
Figure 8. (a) Arrhenius plots of conductivity of GDC-LSM composites in comparison with literature [3,11,13,20,37,38,39] (see the text for details). (b) Temperature-dependent activation energies from the derivative of the conductivity curves of (a). (c) Derivative of the differential activation energy curves or second derivative of the conductivity curves whose extrema points corresponding to the inflections of the conductivity Arrhenius plots (a).
Crystals 11 00712 g008
Figure 9. Conductivity of GDC-LSCF composites measured in a furnace (a) and in a cryostat (b) with the data from in [7,15,16,17]. Activation energies from differential conductivity curves (c,d), and the differential activation energy curves (e,f), respectively. The positive and negative maximum points of panels (e,f) are consistently indicated in panels (a,d).
Crystals 11 00712 g009
Figure 10. Conductivity hysteresis in GDC:LSCF composites upon heating-cooling at 1   C /min with dwell at approximately 800 C for 30 min. The curves are normalized with respect to σ MAX on the cooling leg. The diamond symbols indicate the maximum conductivity points presented in Figure 6. Literature data [15,16] are similarly plotted.
Crystals 11 00712 g010
Table 1. Crystallographic data for GDC:LSM composites by Rietveld refinement. Volume percentages corrected using Rietveld refinements are provided.
Sample NameLSM100LSM85LSM55LSM35LSM25LSM20LSM15LSM10LSM5LSM0
Weight % (exp)10083.1351.5231.8922.4717.8513.308.814.350
Weight % (Rietveld)10085.455.634.323.720.415.310.23.40
Volume % (exp) *10084.6654.3434.4224.5119.6014.649.744.860
Volume % (Rietveld)10086.7658.3836.9225.8122.3316.8111.263.780
GDC
phase
( F m 3 ¯ m )
a (Å) 5.42705.42595.42395.42325.41975.42295.42305.42115.4180
Volume of a unit cell ( Å 3 ) 159.84159.74159.56159.51159.20159.47159.48159.32159.04
Density 7.19057.19507.20317.20557.21977.20707.20667.21407.2266
LSM
phase
( R 3 ¯ c )
a (Å)5.51405.51145.50695.50655.50585.50315.49965.49765.4927
c (Å)13.376013.364413.372013.372813.361313.368313.365813.365213.3713
Volume of a unit cell ( Å 3 )352.23351.56351.20351.16350.77350.60350.10349.83349.37
Density6.40576.41806.42466.42536.43256.43556.44486.44986.4582
Reliability
factors
R exp ( % ) 6.206.406.596.666.729.629.089.159.63
R p ( % ) 6.546.215.735.936.366.926.547.456.79
R wp ( % ) 12.0510.048.859.5810.448.859.7511.589.97
χ 2 ( % ) 3.782.461.802.072.410.851.151.611.07
* estimated using the density from Rietveld analysis.
Table 2. Crystallographic data for GDC:LSCF composites by Rietveld refinement. Volume percentages corrected using Rietveld refinements are provided.
Sample NameLSCF100LSCF95LSCF85LSCF75LSCF65LSCF55LSCF45LSCF35LSCF25LSCF20LSCF15LSCF10LSCF5LSCF0
Weight % (exp)10094.3783.3372.5862.1051.8841.9232.2022.7218.0713.478.934.440
Weight % (Rietveld)10095.985.274.265.756.645.335.222.719.512.69.73.90
Volume % (exp) *10094.8584.8474.8364.9254.9044.9535.1225.0720.1715.1410.045.030
Volume % (Rietveld)10096.2686.5776.3668.3859.5645.3038.2325.0521.7314.1810.904.430
GDC
phase
( F m 3 ¯ m )
a (Å) 5.49125.45895.45175.44535.44055.43435.42875.42835.41895.42295.42435.42285.4180
Volume of a unit cell ( Å 3 ) 165.57162.68162.03161.46161.03160.48159.98159.95159.12159.47159.60159.46159.04
Density 6.94157.06517.09327.11857.13737.16167.18407.18557.22307.20707.20117.20757.2266
LSCF
phase
( R 3 ¯ c )
a (Å)5.51005.50735.50815.50305.50465.50385.49515.50445.50445.50235.50185.49715.4956
c (Å)13.545013.386913.390913.406913.422613.392013.414313.423113.402013.434313.466013.421713.4440
Volume of a unit cell ( Å 3 )356.10351.64351.84351.61352.22351.31350.79352.21351.66352.24353.00351.24351.62
Density6.23536.31456.31086.31526.30406.32046.32966.30426.31406.30366.29006.32166.3147
Reliability
factors
R exp ( % ) 5.285.315.773.253.536.033.537.606.448.239.508.968.97
R p ( % ) 4.813.773.614.504.034.444.925.815.806.476.676.126.48
R wp ( % ) 8.566.335.187.446.216.657.968.8910.0111.7710.208.949.61
χ 2 ( % ) 2.631.420.815.243.101.225.081.372.412.051.151.001.15
* estimated using density from Rietveld analysis.
Publisher’s Note: MDPI stays neutral with regard to jurisdictional claims in published maps and institutional affiliations.

