Article

Correlation between Solution Treatment Temperature, MicroStructure, and Yield Strength of Forged Ti-17 Alloys

1
Graduate Scholl of Frontier Sciences, The University of Tokyo, Kashiwa 277-8561, Japan
2
Research Center of Structural Materials, National Institute for Materials Science, Tsukuba 305-0047, Japan
3
Materials Manufacturing and Engineering Station, National Institute for Materials Science, Tsukuba 305-0047, Japan
4
Kobe Steel, Ltd., Takasago 676-8670, Japan
*
Author to whom correspondence should be addressed.
Crystals 2021, 11(6), 625; https://doi.org/10.3390/cryst11060625
Submission received: 23 May 2021 / Accepted: 28 May 2021 / Published: 31 May 2021

Abstract

:
The Ti compressor disks of aviation jet engines are produced by forging. Their microstructure, which depends on the forging conditions, strongly affects their mechanical properties. In this study, changes in the microstructure of Ti-17 alloy as a result of different solution-treatment (ST) temperatures and the related tensile yield strengths were investigated to elucidate the correlation between the ST temperature, microstructure, and yield strength. Ti-17 alloys ingots were isothermally forged at 800 °C and solution-treated at 750, 800, and 850 °C. The microstructure and yield strength were investigated for samples subjected to different ST temperatures. The primary α phase formed during the ST, and the secondary α phase formed during the aging treatment at 620 °C. The yield strength increased with increasing volume fraction of the primary α phase and increased further upon formation of the secondary α phase during the tensile test at room temperature. The correlation of the primary and secondary α phases with yield strength was clarified for tensile properties at room temperature, 450, and 600 °C. An equation to predict the yield strength was constructed using the volume fraction of the primary and secondary α phases.

1. Introduction

The compressor disks of aviation jet engines are manufactured by forging using Ti alloys such as α + β Ti-6Al-4V (wt %), near-β Ti-6246 (Ti-6Al-2Sn-4Zr-6Mo), and Ti-17 (Ti-5Al-2Sn-2Zr-4Cr-4Mo) alloys. However, compressor failure due to fatigue seriously damages aviation jet engines [1,2]. From a materials perspective, controlling the microstructure of Ti alloys by thermomechanical processing and/or heat treatment has been used to extend their fatigue life. For example, the hot deformation behavior of Ti-6246 samples 10 mm in diameter and 12 mm in height was investigated under dynamic material modeling theory and a processing map showing the optimum processing conditions was constructed [3]. An investigation of the hot deformation behavior of industrial-sized disc-shaped Ti-6246 revealed the optimum processing conditions to attain a microstructure that led to the desired mechanical properties [4]. The influence of a solution treatment followed by an aging treatment on the microstructure and mechanical properties of industrial-sized Ti-6246 was investigated, revealing that a solution treatment at a temperature near the β-transus temperature gave the highest strength and ductility [5]. Globularization of the α phase and recrystallization of Ti-6246 forged in the α + β region were systematically investigated, and a prediction model developed using the Avrami approach and the machine learning approach was suggested for modeling dynamic globularization [6].
Another near-β alloy, Ti-17, has been considered for use in compressor disks because of its high specific strength, high fracture toughness, low cycle fatigue capability, and good corrosion resistance [7]. Ti-17 is used in compressor disks that operate at temperatures as high as 400 °C, and its β-transus temperature is approximately 890 °C [7]. Because a globularized α microstructure exhibits better balance in terms of strength and ductility, formation processing and prediction models to induce globularization of the α phase have been extensively investigated [7,8,9,10,11]. A review paper on globularization indicates that the strain introduced during forging and the strain rate of deformation affect the kinetics of globularization of the lamellar structure [12]; specifically, higher strain and a lower strain rate promote globularization. The deformation temperature also affects the globularization mechanism in that a high deformation temperature promotes the formation of a granular α phase by dynamic recrystallization and a low deformation temperature promotes the formation of a granular α phase by boundary splitting [12].
The strain introduced by forging is nonuniform and therefore varies by position in forged materials [4,12]. Controlling the strain in forged materials requires an understanding of the processing. Numerous studies on the processing of Ti-17 alloys have been reported (e.g., [13,14,15,16,17]). A constitutive equation indicating the strain rate for forging in the α + β region has been suggested, as have the forging conditions necessary to obtain a homogeneous microstructure; specifically, a homogeneous microstructure was obtained at a temperature and strain rate of 857 °C and 0.001 s−1, respectively [13].
The instability criterion has been investigated to elucidate the instability behavior during processing, where lower strain rates were found to lead to stable processing [14]. In other studies, a wide range of deformation conditions was used to elucidate the deformation behavior [15] and an artificial neural network (ANN) was applied to obtain an accurate constitutive equation [16]. The predicted flow stresses obtained from the ANN showed good agreement with experimental stresses [16]. Microstructural predictions related to modeling of a processing map were carried out, and the distribution of microstructural factors such as the β grain size, average aspect ratio of the α phase, and the fraction of dynamic globularization were successfully drawn in three-dimensional images [17,18]. The constitutive equation and the processing maps for Ti-17 alloys for forging in the β-phase field were also investigated [19]. Flow instability was observed at high strain rates, and dynamic recovery, which is necessary to obtain an equiaxed microstructure, occurred at lower strain rates [19].
Although the aforementioned studies on processing were conducted for small samples (~10 mm), large forged Ti-17 samples have been used in investigations of the alloy’s mechanical properties. For example, a disk with dimensions of ⌀ 365 mm × 100 mm was forged at 930 °C with a deformation ratio of 40%, followed by cooling at various cooling rates to produce different lamellar features [20]. Long and thick α platelets were found to lead to a good combination of fracture toughness and strength [20]. The fracture toughness and fatigue crack growth behavior of Ti-17 alloy with the bimodal structure produced by processing in the α + β-phase field and the lamellar structure obtained by processing in the β-phase field were investigated [21]. The lamellar structure exhibited superior fracture toughness and a greater fatigue crack growth resistance than the bimodal structure [21]. The effect of globularization of the α phase on the tensile properties was also investigated [22]. Cylindrical samples 13.5 mm in diameter and 70 mm in length were prepared from bar-form materials with a diameter of 75 mm processed in the β phase and were subsequently deformed with different extents of reduction to obtain different globularizations. The tensile strength increased linearly with increasing globularization fraction at both room temperature and 400 °C [22]. The tensile properties and fatigue properties of forged and solution-treated Ti-17 alloys were investigated [23,24]. A Ti-17 ingot with a diameter of 120 mm and height of 240 mm was forged at 800 °C, and the forged disk-like sample was solution-treated at different temperatures in the α + β- and β-phase fields. The 0.2% proof strength, high cycle fatigue limit, and the low cycle fatigue life increased with increasing solution-treatment (ST) temperature in the α + β-phase field, whereas they decreased with increasing ST temperature in the β-phase field. The low cycle fatigue life was well correlated with the tensile true strain and the volume fraction of the primary α phase, and a constitutive equation to predict fatigue life was constructed using the tensile true strain and the volume fraction of the primary α phase.
In previous studies, we investigated the dependence of the microstructure evolution of Ti-17 alloy on the forging conditions, along with the corresponding tensile properties [25,26]. Cylindrical Ti-17 ingots with a diameter of 134 mm and height of 192 mm were isothermally forged using a 1500 t forging press and then air-cooled. The effect of the forging temperature [25] and the reduction ratio [26] on the microstructure and tensile properties were investigated. The volume fraction of the primary and secondary α phases was found to be the same for all of the tested samples because the same solution-treatment followed by aging (STA) was performed, although the initial microstructure depended on the forging temperature and the reduction ratio. Thus, the tensile properties were approximately the same for these forging conditions. These results indicate that only changing the ST temperature can change the microstructure. Therefore, in the present study, we investigated the effect of the ST temperature on the microstructure and tensile properties of Ti-17 alloy.

2. Materials and Methods

Cylindrical Ti-17 ingots with a diameter of 134 mm and height of 192 mm were isothermally forged at 800 °C with a strain rate of 0.033 s−1 and with a 75% reduction ratio using a 1500 t forging press and were subsequently air-cooled. The forged pancake-like materials with final dimensions of ⌀ 270 mm × 50 mm were solution-treated at three different temperatures (750, 800, and 850 °C) for 4 h, followed by water-quenching. The solution-treated pancakes were cut in half; one half of the solution-treated samples was aged at 620 °C for 8 h and cooled by air-cooling, and the remaining half of each pancake was kept in the solution-treated state.
Tensile test samples with a 6 mm diameter and 25 mm gate length were cut parallel to the direction of circumference from the position at D/4 (D is diameter) from the solution-treated pancake and the aged pancake. The tensile test was performed under the conditions specified in standard ASTM E8 (room temperature) and under those specified in standard ASTM E21 (450 and 600 °C).
The samples for microstructure observation were cut from positions near the location of the tensile test sample at the D/4 position. Each sample was embedded in resin and sequentially polished using sandpaper, diamond powder (9 μm and 3 μm), and SiO2 powder. The microstructure observations were carried out by scanning electron microscopy (SEM, JEOL 7200F, JEOL, Tokyo, Japan) in conjunction with electron backscatter diffraction (EBSD) at an accelerating voltage of 20 kV. The volume fractions of the primary α phase and grain-boundary (GB) α phase were identified from the microstructure by image analysis using the ORYMPUS Stream software. The total volume fraction of the α phase was measured by X-ray diffraction (XRD, Rigaku SmartLab, Tokyo, Japan), as described in the next paragraph, because the secondary α phase was too small for measurement of its volume fraction from the microstructure images. The volume fraction of secondary α phase was obtained by subtracting the volume fraction of primary α and GB α from the total volume fraction of the α phase obtained by XRD analysis. The length and thickness of the primary α phase was also measured from the microstructure images. The microstructure of the sample solution-treated at 850 °C after the tensile test at 450 °C was observed by transmission electron microscopy (TEM, JEM 2010F, JEOL, Tokyo, Japan) at an acceleration voltage of 200 kV. The samples 3 mm in a diameter and 100 μm in thickness were prepared for TEM observation via electrolytic polishing using a solution containing 300 mL of methanol, 25 mL of perchloric acid, and 175 mL of n-butyl alcohol. The electrolytic polishing was performed using a twin-jet polisher at 20 V at −20 °C, where the samples were cooled using liquid N2.
The XRD measurements to obtain the total volume fraction of α phase were performed on plate samples with dimensions of 5 mm × 10 mm × 1 mm at room temperature using Cu Kα radiation (λ = 1.54056 Å) generated at 45 kV and 200 mA and with the sample mounted on an αβ sample stage. The diffraction data were collected in the 2θ range from 30° to 80° with a step size of 0.02° and a scan speed of 20° min−1 using a one-dimensional X-ray detector (D/teX Ultra 250). To reduce the effect of texture, samples were rotated 360° along the β-rotation axis at a rotation speed of 30° min−1 during the measurement. In addition, the scan was performed with a tilted angle (α-axis) from 0° to 90° in 5° steps. Finally, the diffraction data corresponding to each α-axis scan were summed. The volume fraction was estimated from the ratio between the ideal and experimental intensities of the α and β phases, as described elsewhere [25].

3. Results

3.1. Microstructure

The backscattered images of the solution-treated and the solution-treated-and-aged samples are shown in Figure 1. As described in detail in our previous paper [25], the plate-like phase and the matrix were identified as the α and β phase, respectively, by EBSD phase analysis. In the solution-treated samples, the primary α phase precipitated in the β phase. In our previous study, the primary α phase precipitated with a plate- or needle-like morphology with a Burgers orientation relationship during cooling after forging [25]. The plate-like primary α phase observed in the solution-treated samples was considered to grow and redistribute, leading to the equilibrium phase composition and the volume fraction at the ST temperature during the ST. The volume fraction and size of the primary α phase obtained from the microstructure are summarized in Table 1. The volume fraction of the primary α phase decreased with increasing ST temperature (Figure 1a–c) because the β phase became more stable at high ST temperatures close to the β-transus temperature.
As shown in Figure 1e, a film-like α phase was also formed at GBs. The morphology of the GB α phase was governed by the forging temperature. We previously found that the granular GB α phase forms at forging temperatures of 700 and 750 °C, whereas the film-like α phase forms at forging temperatures of 800 and 850 °C [25]. In the present study, the forging temperature was fixed at 800 °C; the morphology of the GB α phase was therefore the same (film-like morphology) among the tested samples. The volume fraction of GB α phase obtained from image analysis was approximately 4% (Table 1), although the results varied depending on the observed position because of experimental error.
After STA, the secondary α phase precipitated in the remaining β matrix, as shown in the enlarged images of the samples solution-treated at 800 and 850 °C (Figure 1e,f). Only a small amount of the secondary α phase was observed in the sample solution-treated at 750 °C (Figure 1d). The volume fraction of the primary α phase in the ST samples at 750 °C was 60%, which is similar to the equilibrium and maximum volume fraction of 67% of the α phase in Ti-17 alloys aged at 620 °C [27]. During ST, the GB α phase formed at a volume of fraction of ~5.5% and the total volume fraction of the α phase was already 65.5%. As a result, only small amount of the secondary α phase formed in the sample solution-treated at 750 °C and aged at 620 °C. The volume fraction of the secondary α phase in the samples is summarized in Table 1.
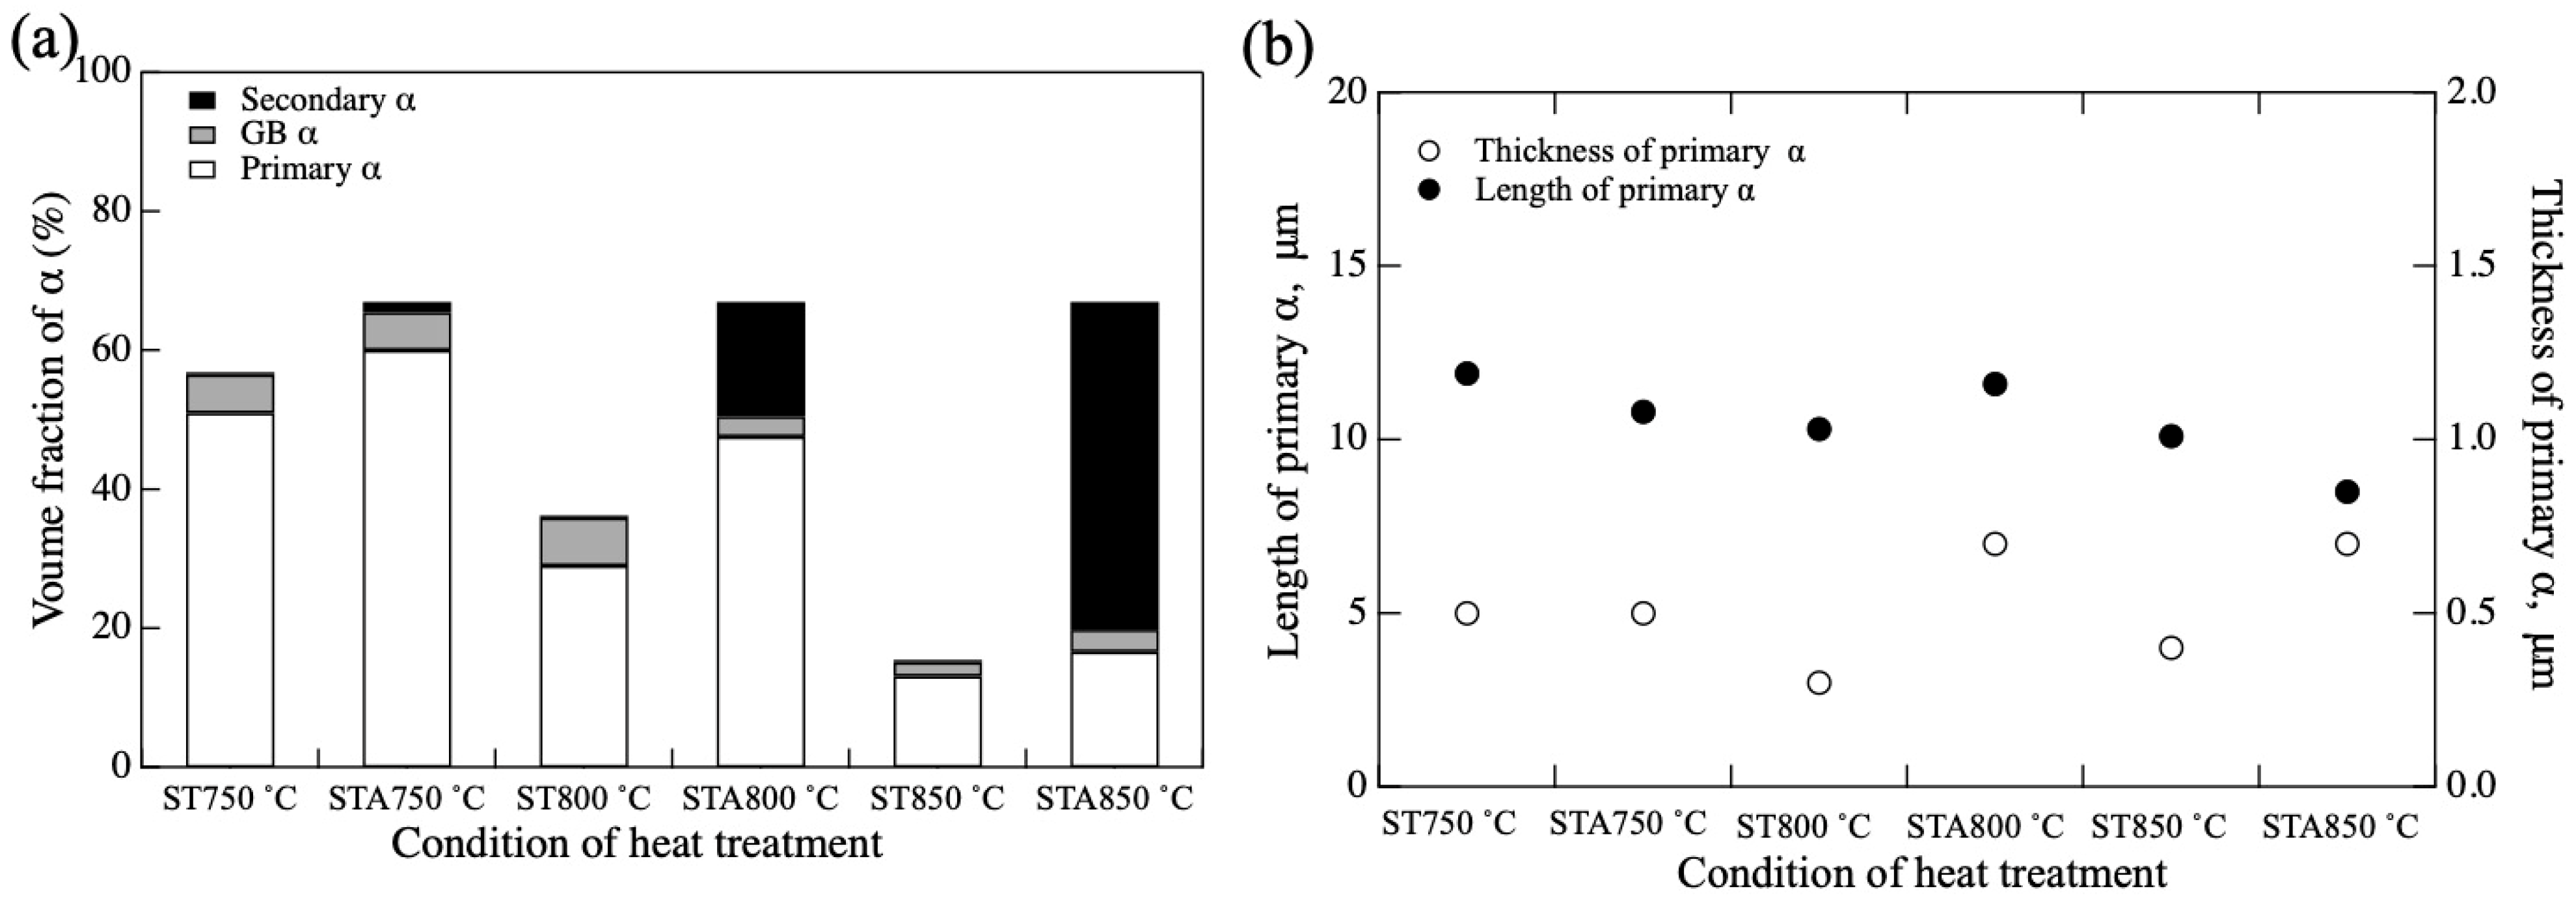
The volume fraction of the primary, secondary, the GB α phases and the length and thickness of the primary α phase are shown in Figure 2 as functions of the heat-treatment conditions. Microstructure factors are presented in Table 1. The volume fraction of the primary α phase clearly decreased with increasing ST temperature (Figure 2a). A small increase of the volume fraction of the primary α phase was also observed during aging because of growth of the primary α phase. Aging-induced formation of the secondary α phase was clearly observed, and the volume fraction of the secondary α phase drastically increased with increasing ST temperature. These results are attributed to the small volume fraction of the primary α phase in the sample solution-treated at 850 °C triggering the formation of the secondary α phase during aging to achieve an equilibrium volume fraction at the aging temperature. The length and thickness of the primary α phase was approximately the same, although the data vary because of experimental error. The average length and thickness were 10.5 μm and 0.6 μm, respectively.

3.2. Mechanical Properties

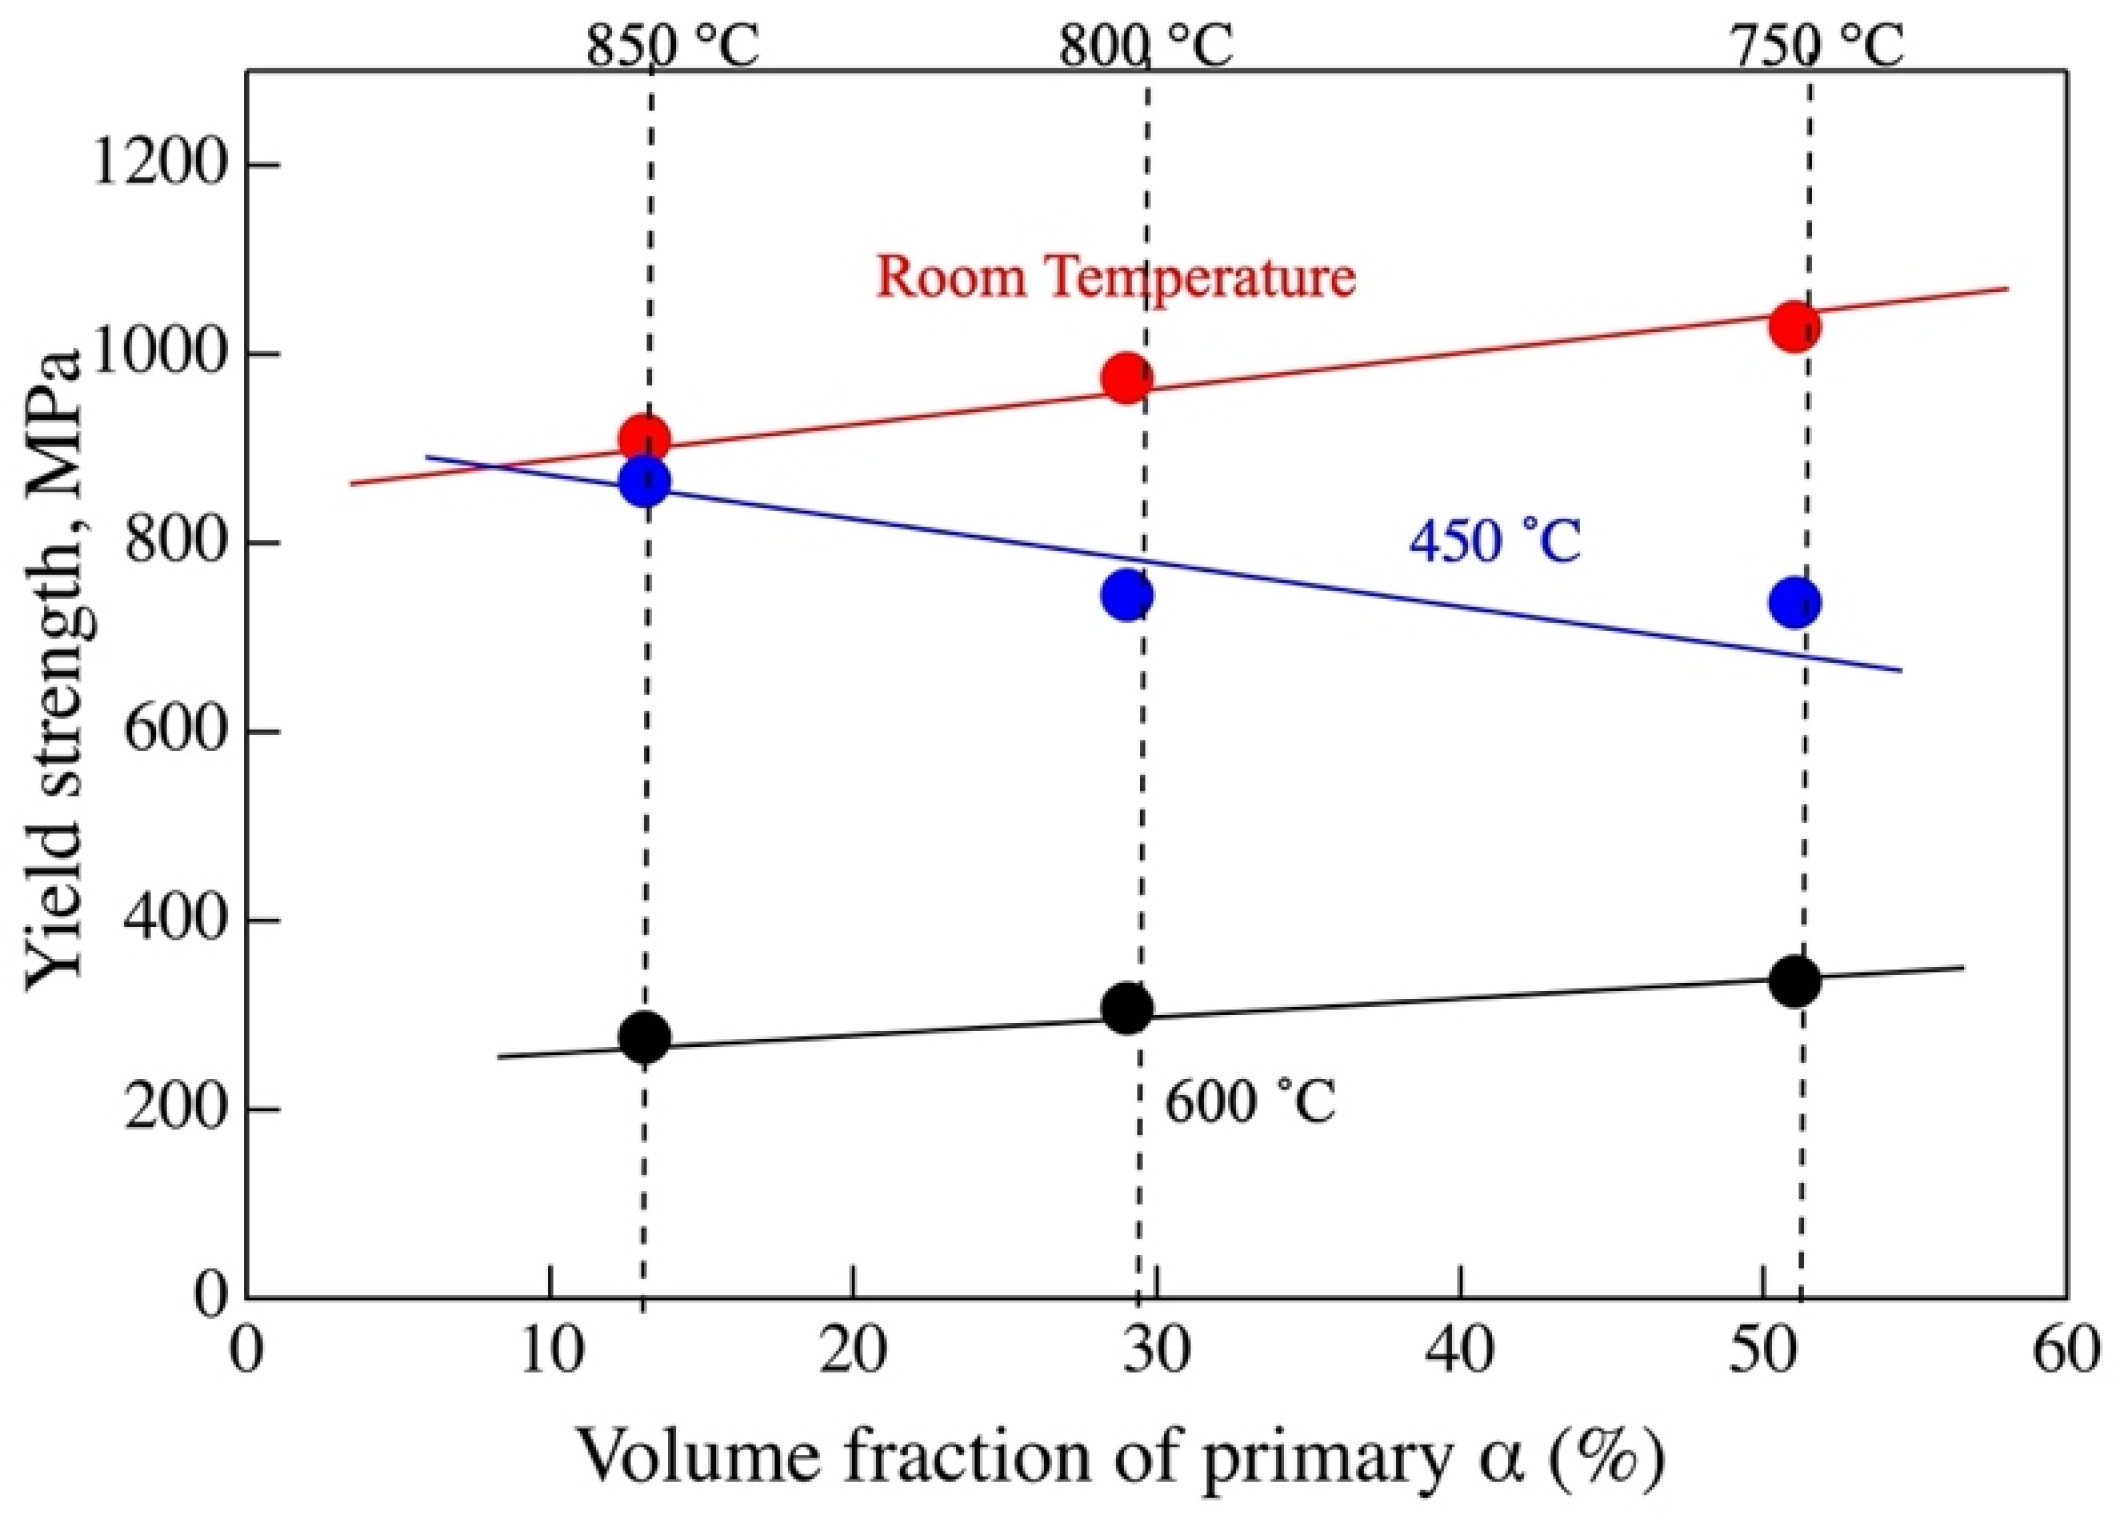
The yield strengths of the solution-treated samples, as measured at room temperature, 450, and 600 °C, are plotted as a function of the volume fraction of the primary α phase in Figure 3. The yield strength strongly depended on the test temperature. At room temperature and 600 °C, the yield strength increased linearly with increasing volume fraction of the primary α phase. However, the opposite relationship was observed at 450 °C; that is, the strength decreased with increasing volume fraction of the α phase.
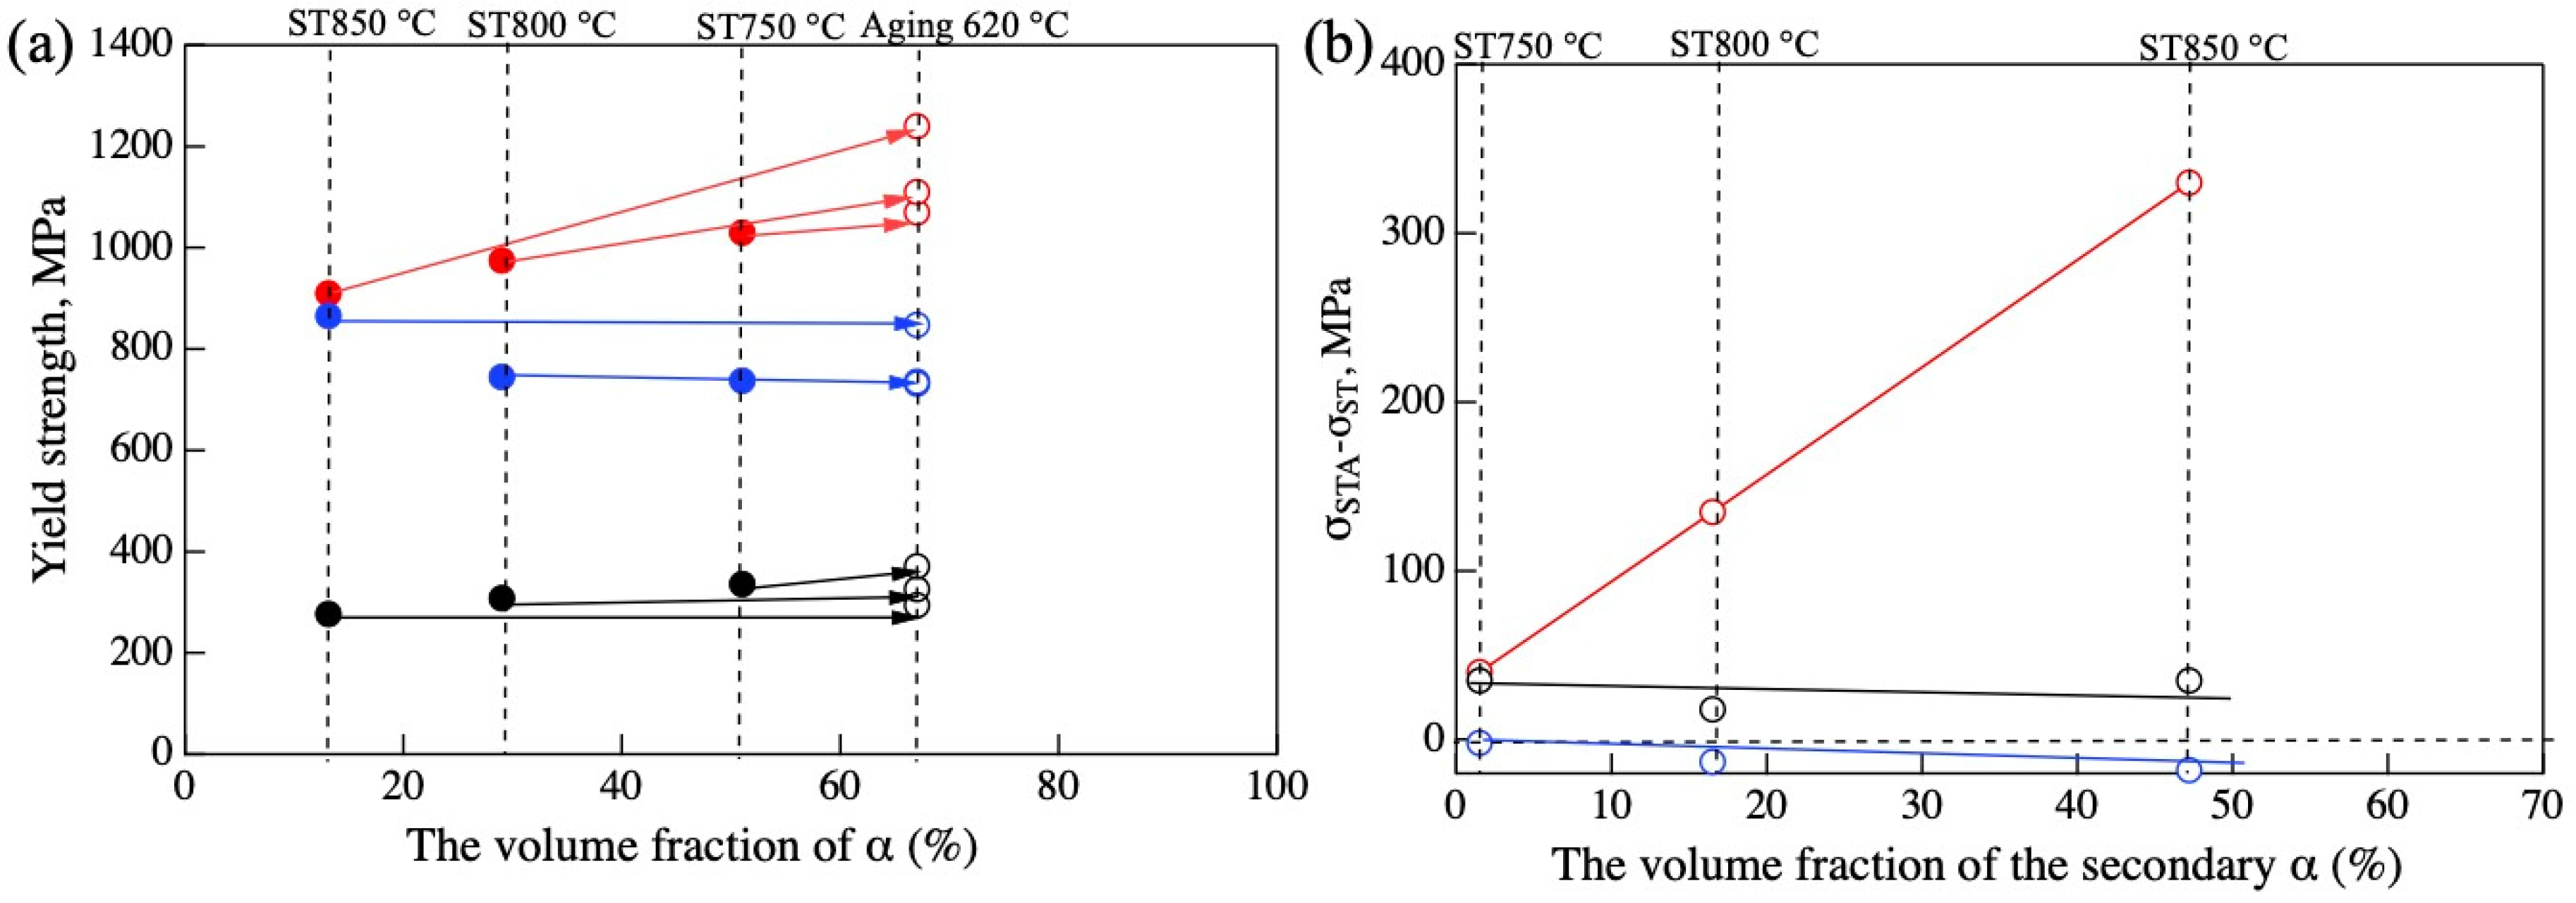
In Figure 4a, the yield strength of the solution-treated-and-aged samples is plotted as a function of the total volume fraction of the α phase, together with the yield strength of the solution-treated samples. Because the secondary α phase formed to reach the equilibrium volume fraction of the α phase, the total volume fraction of the α phase is the same among the aged alloys. At room temperature, the yield strength of all of the samples increased after the aging treatment. The magnitude of the increase in strength was larger for the samples with a small volume fraction of the primary α phase; that is, samples solution-treated at higher temperatures exhibited greater increases in yield strength. However, in the tests at 450 and 600 °C, the yield strength of the solution-treated sample and that of the solution-treated-and-aged sample were approximately the same. Figure 4b shows the difference in yield strength between the solution-treated and the solution-treated-and-aged samples, where the effect of the secondary α phase on the strength is plotted as a function of the volume fraction of the secondary α phase. The secondary α phase effectively strengthened the alloys at room temperature; however, the strengthening effect was diminished at higher test temperatures.

4. Discussion

4.1. Mechanical Properties at Different Testing Temperatures

The yield strength at room temperature was clearly affected by both the primary and secondary α phase (Figure 3 and Figure 4). The strength increased linearly with increasing volume fraction of the primary α phase, which is the precipitation strengthening effect of the α phase. The precipitation strengthening effect by the primary α phase was stronger in the samples solution-treated at lower temperatures because of their high volume fraction of the primary α phase. Further strengthening was obtained by precipitation of the secondary α phase, and the effect was stronger in the samples solution-treated at higher temperatures because of their high volume fraction of the secondary α phase. As a result, the solution-treated-and-aged samples solution-treated at higher temperatures exhibited greater increases in yield strength than the solution-treated-and-aged samples solution-treated at lower temperatures. The same trend has been reported elsewhere [23], where the strength of Ti-17 alloys aged at 620 °C after solution treatment was found to be greater for a sample solution-treated at 870 °C than for samples solution-treated at 790 and 850 °C. In addition to the primary and secondary α phases, a small amount of the GB α phase was observed; however, the volume fraction of the GB α phase was small and its effect was neglected here. However, in the tensile tests at 450 and 600 °C, the effect of the secondary α phase was not observed; that is, the strengths of the solution-treated and the solution-treated-and-aged samples were approximately the same. At high temperatures, especially temperatures greater than 450 °C, the strength of the α phase is known decrease drastically [28]. Thus, the secondary α phase may be easily cut by dislocations at high temperatures. In addition, thermal activity becomes high at high temperatures and dislocations can easily climb the small secondary α phase. Consequently, the effect of the secondary α phase is diminished at high temperatures.
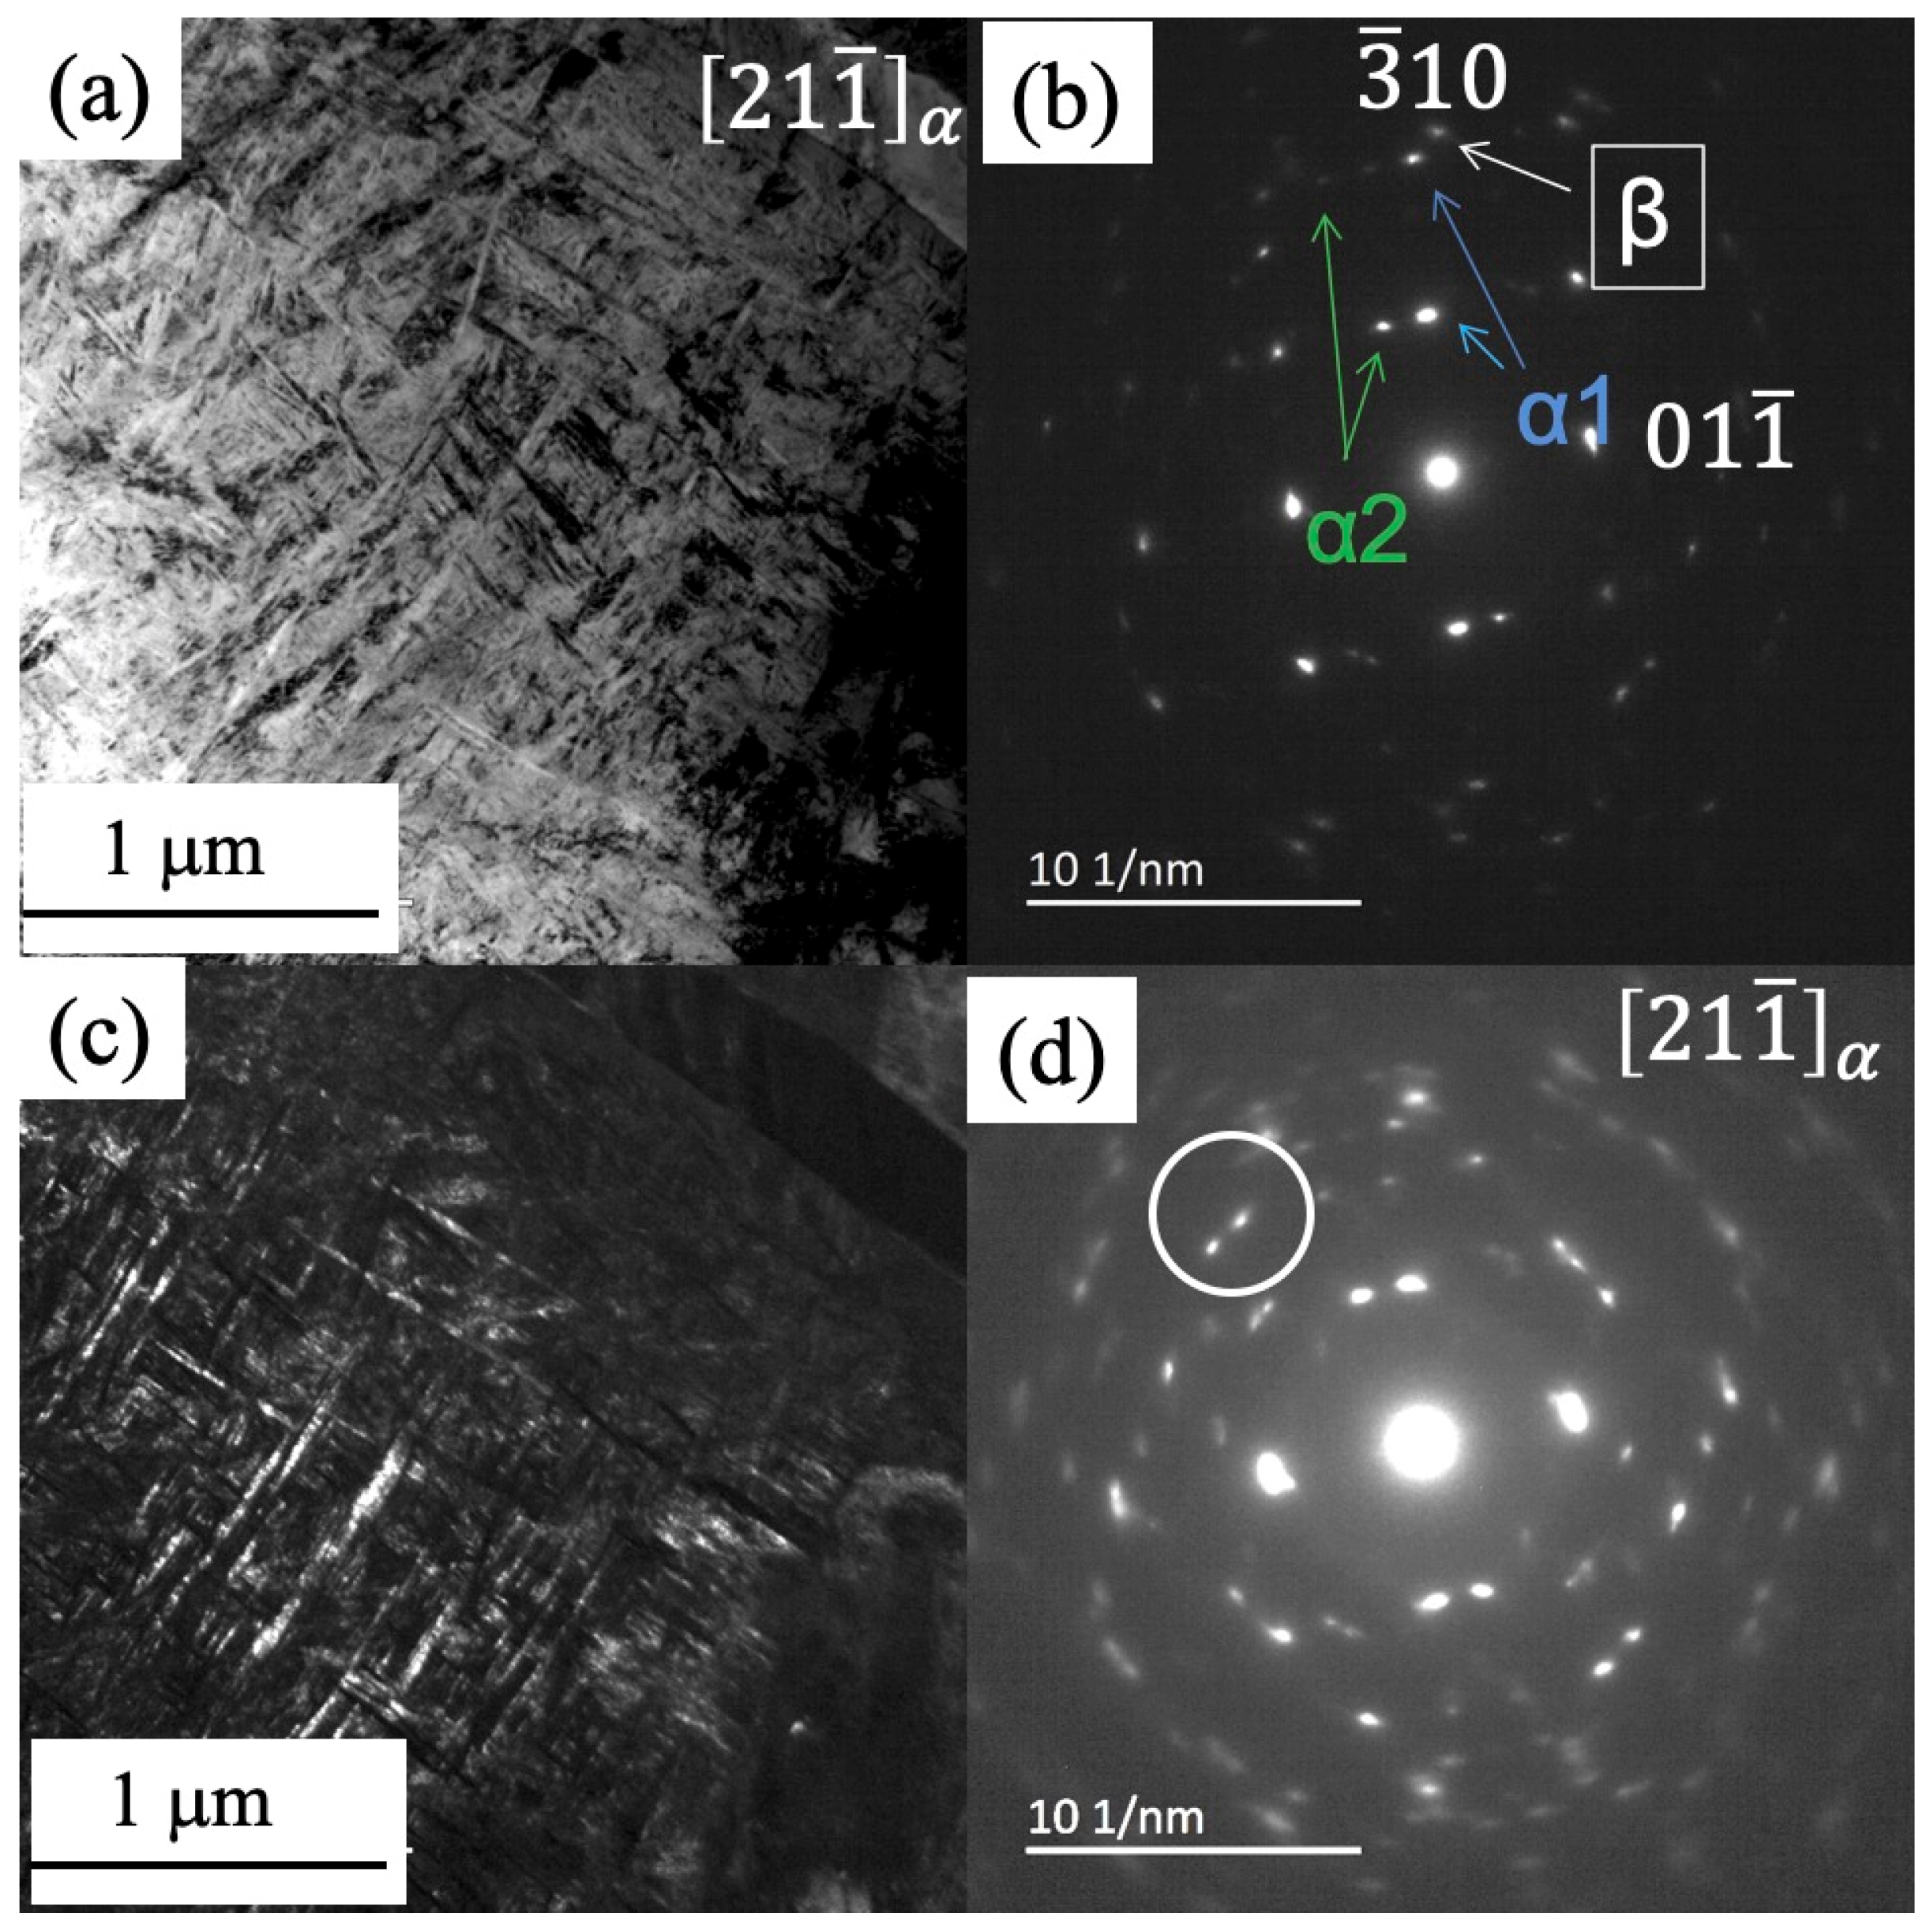
In the tensile tests at 450 °C, the behavior of the yield strength of the solution-treated samples was abnormal; that is, the yield strength decreased with increasing volume fraction of the primary α phase. To understand this behavior, we used TEM to observe the microstructure of samples solution-treated at 850 °C after the tensile test at 450 °C. In Figure 5a, the bright-field image shows fine needle-like precipitates in the matrix. The diffraction pattern corresponding to this image indicates that these fine precipitates are the α phase (Figure 5b). The dark-field image was taken using the diffraction spot of the α phase (Figure 5c,d). Some of the needle-like precipitates are brightened, indicating that these precipitates are the α phase. These results indicate that the α phase precipitated when the sample was maintained at the test temperature before the tensile test. Thus, during the test at 450 °C, the secondary α phase had already precipitated before the test. The yield strength of the sample solution-treated at 850 °C was the highest because the volume fraction of the secondary α phase formed during the holding time was the highest among the tested samples. The difference in strength between the solution-treated-and-aged samples and the solution-treated samples tested at 450 °C was negative (Figure 4b). We speculated that the volume fraction of the α phase formed at 450 °C was greater than that formed at 620 °C. The precipitation strengthening effect of the secondary α phase formed at 450 °C was therefore slightly stronger than that formed at 620 °C.
In the tensile test at 600 °C, the volume fraction of the secondary α phase formed during the holding time before the test was considered to be approximately the same as that formed during aging at 620 °C. The yield strengths of the solution-treated and the solution-treated-and-aged samples were therefore approximately the same. The precipitation strengthening effect by the secondary α phase was very weak (Figure 4b) because the small secondary α phase does not act as obstacles for dislocation movement at this temperature, as explained in the previous section. Only the primary α phase governs the yield strength at 600 °C.

4.2. Effect of the Primary and Secondary α Phase on the Yield Strength

As shown in Figure 3, the yield strength of the solution-treated samples measured at room temperature and at 600 °C shows a linear correlation with the volume fraction of the primary ɑ phase. The precipitation strengthening by the α phase is considered to be the effect of the α/β interface, i.e., the resistance of the α/β interface toward dislocation transmission. However, determining the surface area of the α/β interface is difficult. Therefore, in the present study, the yield strength was analyzed on the basis of its linear correlation with the volume fraction of the α phase. The yield strength of the solution-treated samples can be expressed for room temperature (Equation (1)) and 600 °C (Equation (2)) as
σ p = 3.1 V p + 875
σ p = 1.5 V p + 259
where σ p is the strength obtained by the primary α phase and V p is the volume fraction of the primary α phase. Because only the primary α phase affects the yield strength at 600 °C, the yield strength at 600 °C can be expressed as Equation (2). The effect of the primary and secondary α phases on the yield strength at 450 °C is complicated; the correlation at 450 °C is therefore not considered in the present study. Because the yield strength at room temperature is also affected by the volume fraction of the secondary α phase (Figure 4b), the linear correlation of the volume fraction of the secondary α phase can be expressed as
σ s = 6.3 V s + 30.4
where σ s is the strength obtained as a result of the secondary α phase and V s is the volume fraction of the secondary α phase.
If the total yield strength can be expressed as the sum of the effect of the primary and secondary α phases, then the yield strength at room temperature can be expressed simply as
σ = 3.1 V p + 6.3 V s + 905.4
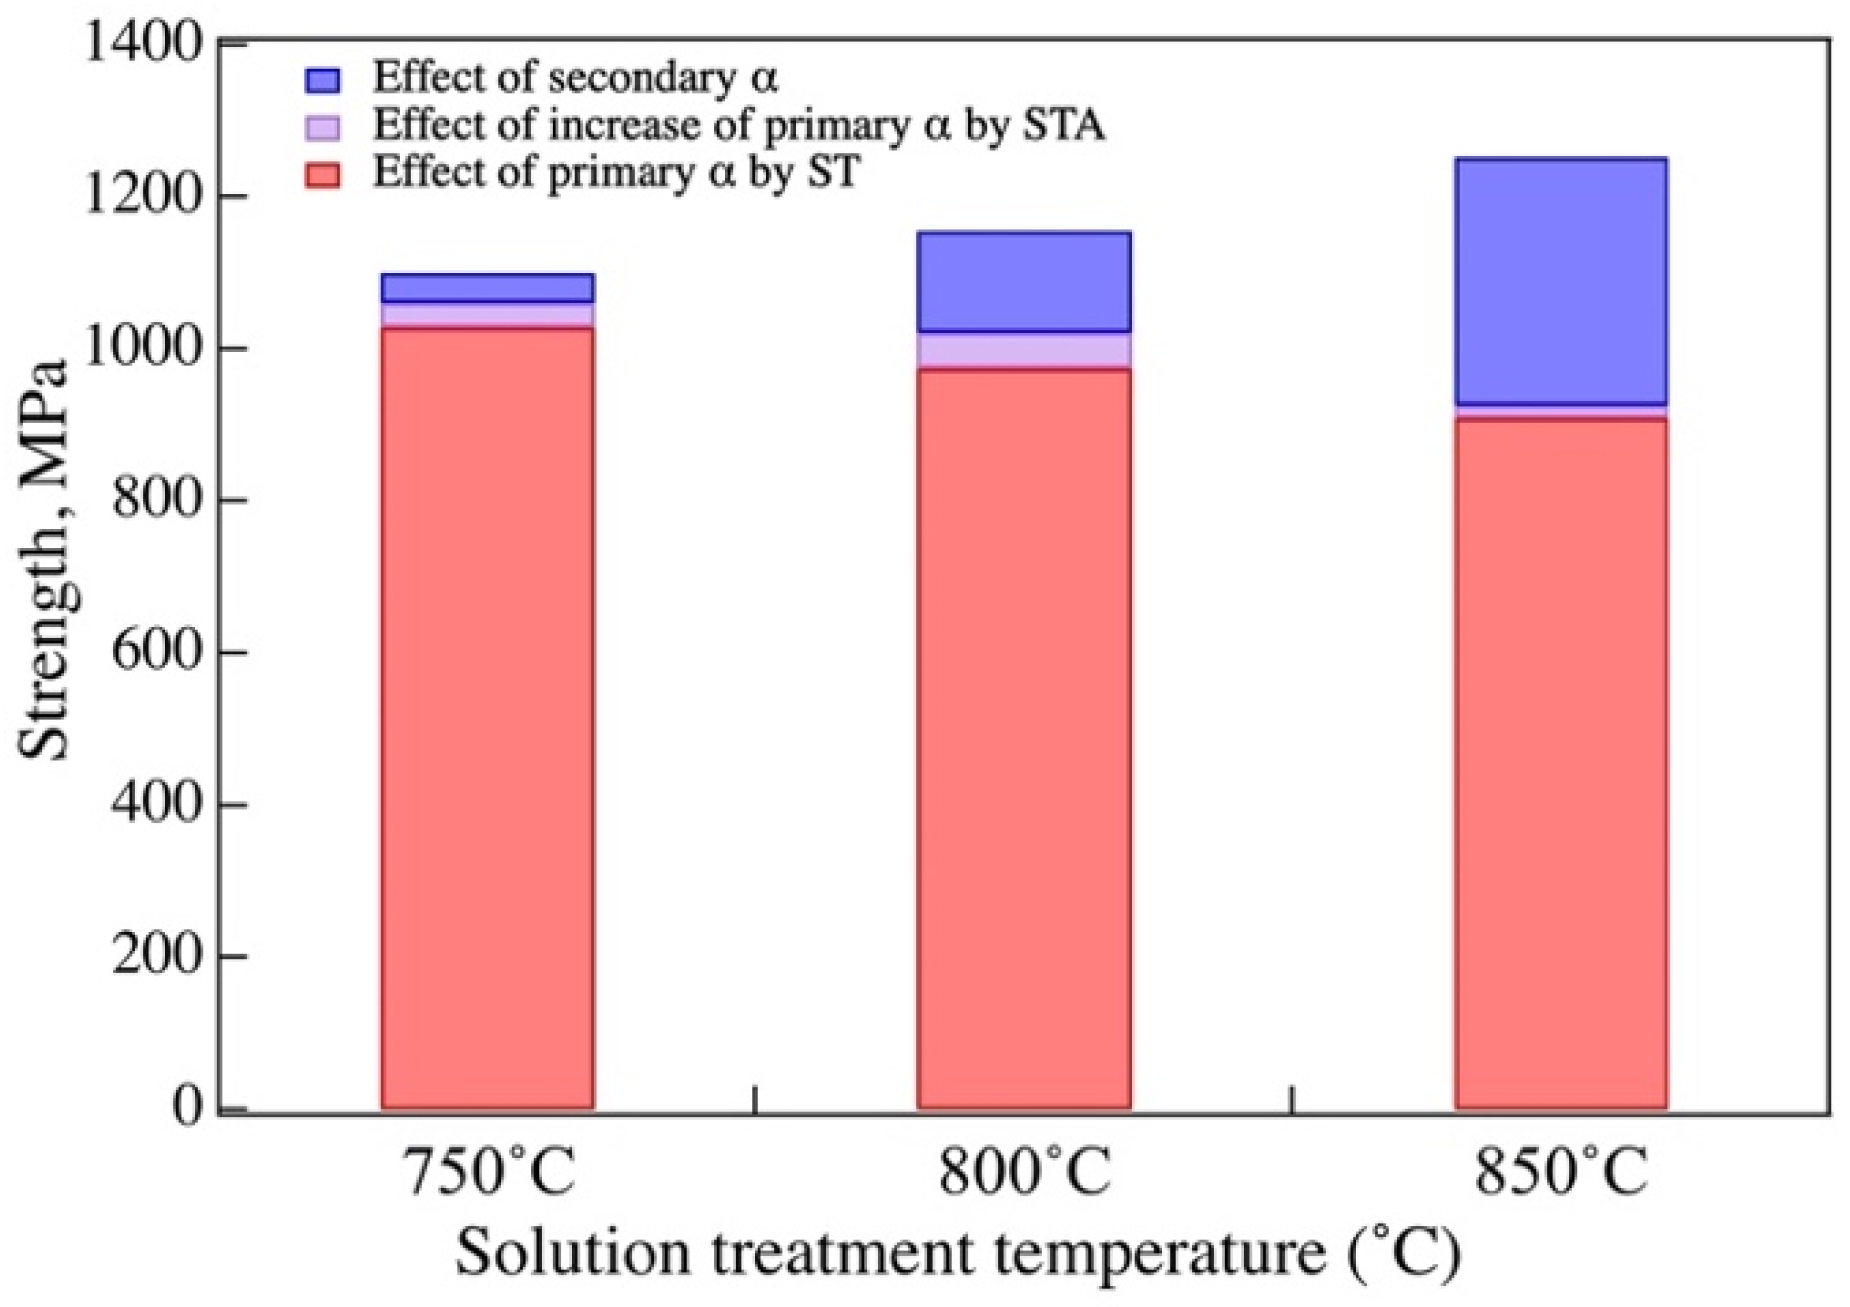
Using these equations, we calculated each effect of the primary and secondary α phases on the yield strength in the solution-treated-and-aged samples (Figure 6). We first used Equation (1) to calculate the effect of the primary α phase after ST; the effect is represented by the red bars in Figure 6. Because the primary α phase grew and the volume fraction of the α phase increased slightly during aging (Table 1), we calculated the effect of the increase of the volume fraction of the α phase during aging; the results are represented as purple bars in Figure 6. We then calculated the effect of the secondary α phase on the strength using Equation (3); the results are represented as blue bars in Figure 6. The results show that the effect of the primary α phase decreased and the effect of the secondary α phase increased with increasing ST temperature.
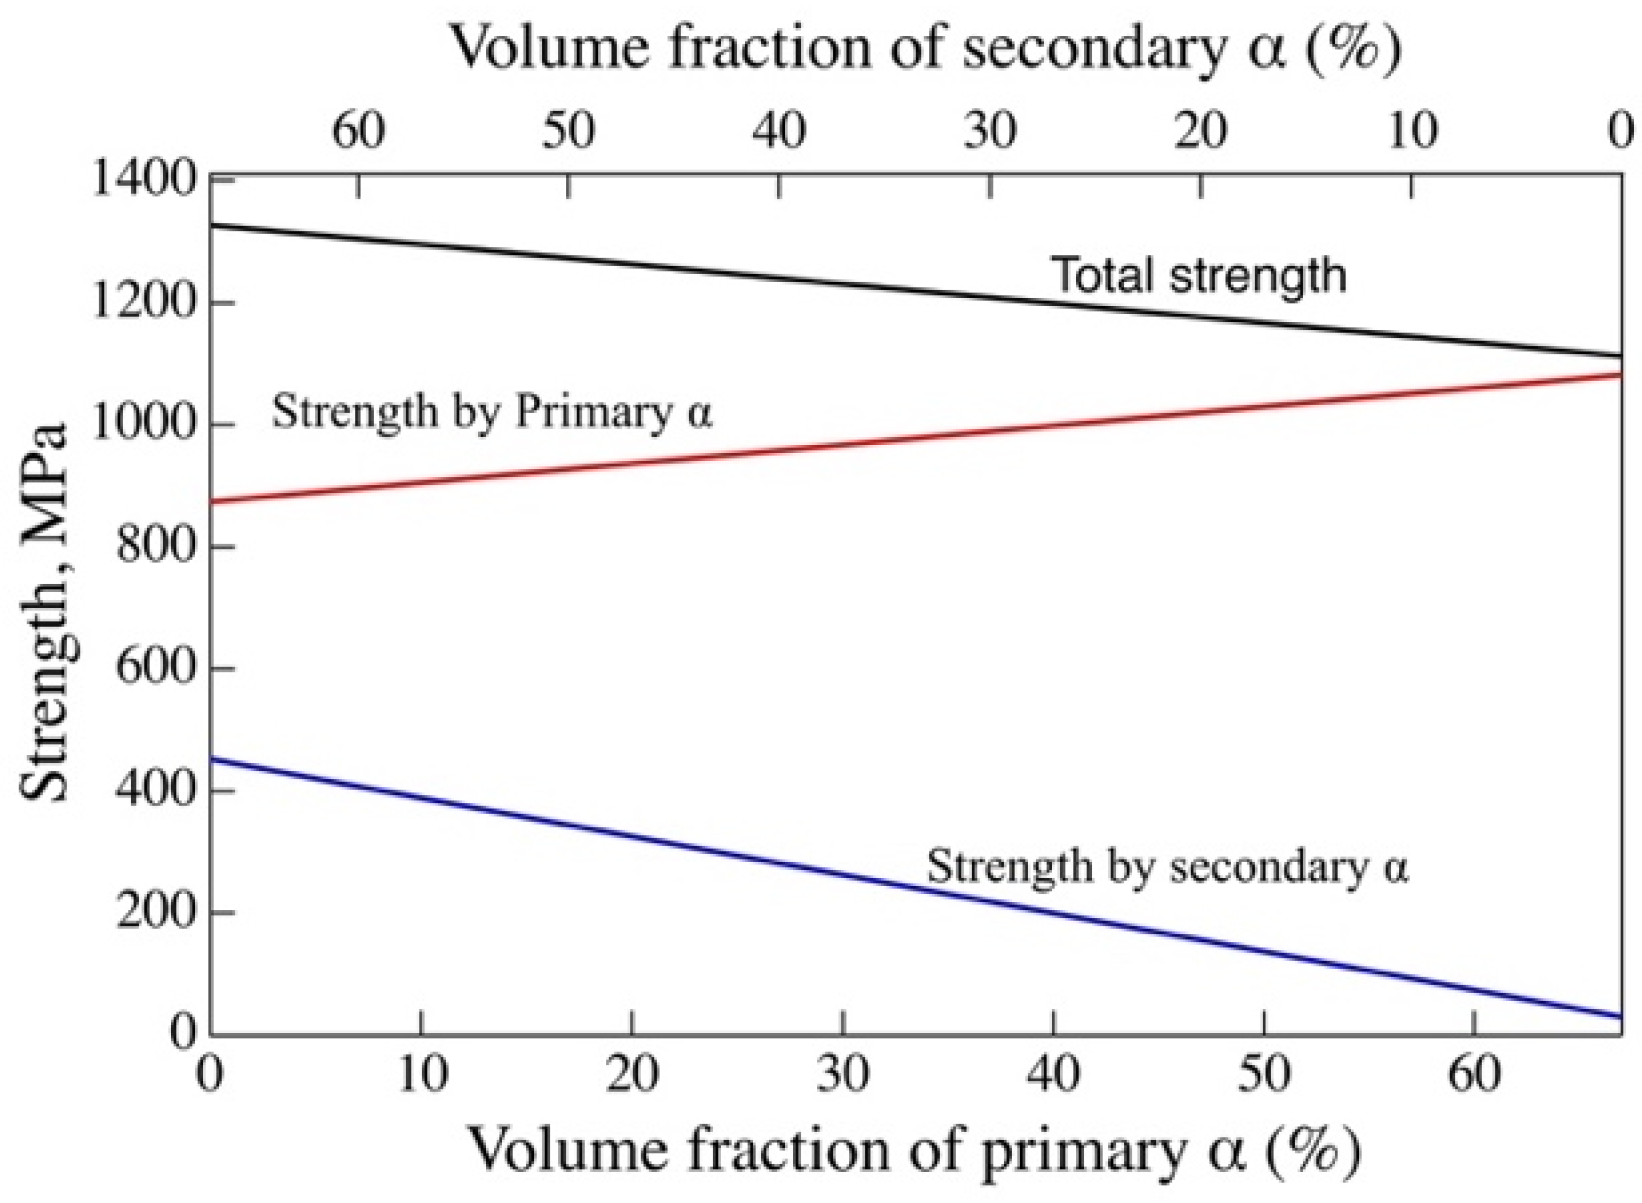
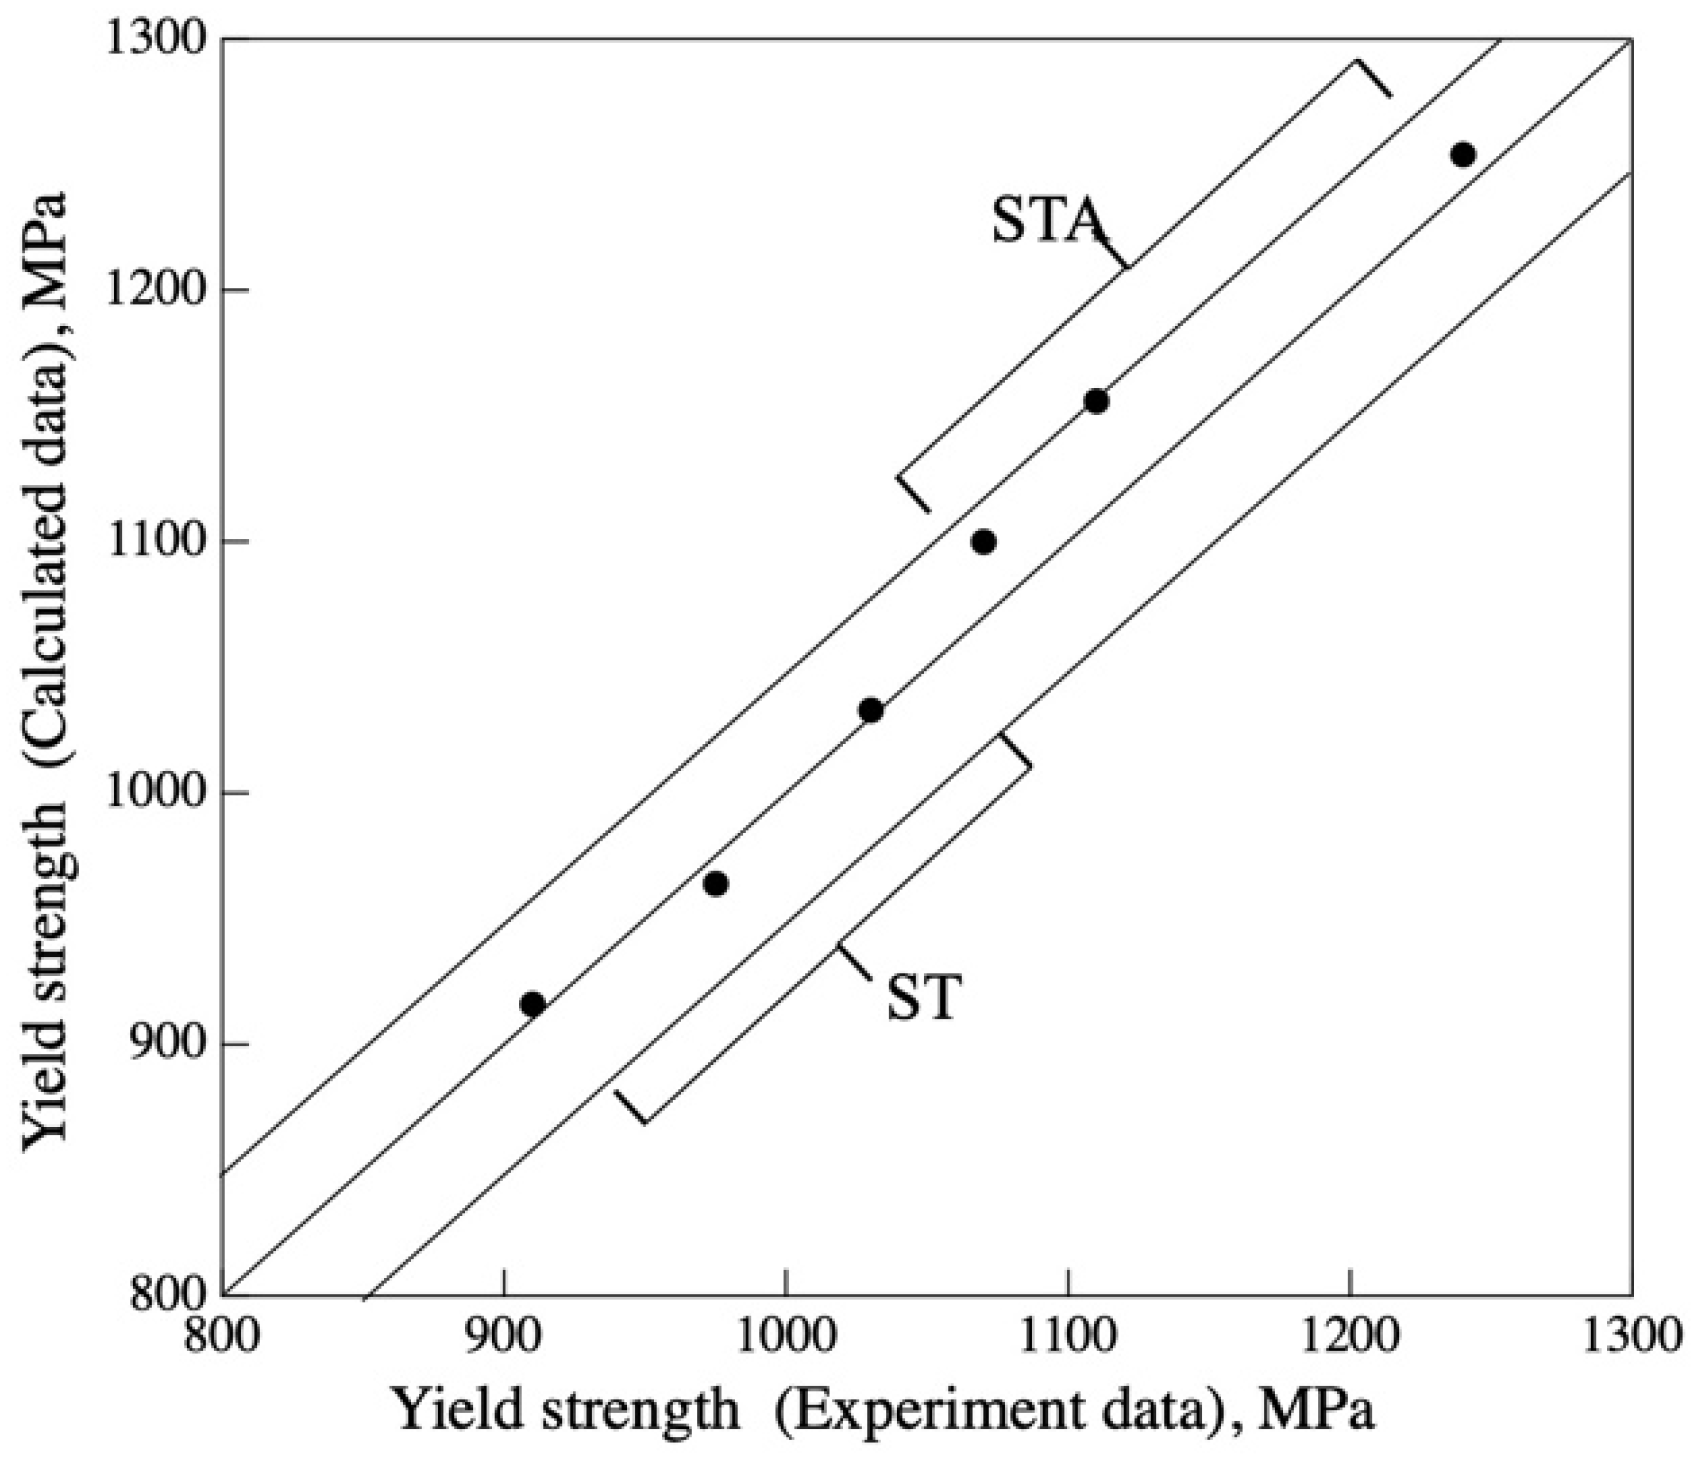
Figure 7 shows the relation of the yield strength obtained on the basis of the primary and secondary α phase as a function of the volume fraction. The yield strengths obtained by experiment and by calculation are plotted in Figure 8. The expected strengths are within 50 MPa, or approximately 5%, of the experimental data. Thus, the expected yield strengths well match the experimental data.

5. Conclusions

The correlation of microstructure factors such as the volume fraction of the primary and secondary α phases and the yield strength was investigated for Ti-17 alloy forged at 800 °C. The primary α phase was formed during ST between 750 and 850 °C, and the secondary α phase was formed during subsequent aging treatment at 620 °C. Tensile tests were performed on the solution-treated samples and the solution-treated-and-aged samples at testing temperatures between room temperature and 600 °C. The yield strength of the solution-treated samples linearly increased with increasing volume fraction of the primary α phase in tests conducted at room temperature and 600 °C. However, they decreased with increasing volume fraction of the primary α phase in the test conducted at 450 °C. This behavior is attributed to precipitation of the secondary α phase when the samples were held at the testing temperature before the tensile test. The yield strengths of the aged samples were greater than those of the solution-treated samples in the tensile tests at room temperature because of the precipitation strengthening effect of the secondary α phase. The volume fraction of the secondary α phase increased with increasing ST temperature because the volume fraction of the primary α phase decreased at high ST temperatures. The precipitation strengthening of the secondary α phase increased with increasing ST temperature. The precipitation strengthening effect of the secondary α phase decreased with increasing testing temperature; at 600 °C, no effect was observed. The yield strength at room temperature was expressed by an equation based on the volume fraction of the primary and secondary α phases. The effect of the microstructure factors on the yield strength was discussed in detail.

Author Contributions

Conceptualization, data curation, original draft preparation, funding acquisition, Y.Y.-M.; data curation, S.K., N.M., T.H., H.M., A.I.; and resources, Y.I. All authors have read and agreed to the published version of the manuscript.

Funding

This research was funded by Structural Materials for Innovation, Cross-ministerial Strategic Innovation Promotion Program, Cabinet Office, Government of Japan.

Data Availability Statement

Restrictions apply to the availability of these data. Data were obtained under the national project and are available with the permission of members involved in the project.

Acknowledgments

We are grateful to H. Gao and T. Bolotova for performing microstructure observations and analyses by SEM-EBSD and SEM image analysis using the OLYMPUS Stream software.

Conflicts of Interest

The authors declare no conflict of interest.

References

  1. Farrahi, G.H.; Tirehdast, M.; Masoumi Khalil Abad, E.; Parsa, S.; Motakefpoor, M. Failure analysis of a gas turbine compressor. Eng. Fail. Anal. 2011, 18, 474–484. [Google Scholar] [CrossRef]
  2. Shlyannikov, V.N.; Ishtyryakov, I.S. Crack growth rate and lifetime prediction for aviation gas turbine engine compressor disk based on nonlinear fracture mechanics parameters. Theor. Appl. Fract. Mech. 2019, 103, 102313. [Google Scholar] [CrossRef]
  3. Lypchanskyi, O.; Sleboda, T.; Wojtaszek, M.; Muszka, K.; Lukaszek-Solek, A.; Stanik, R.; Gude, M. The analysis of flow behavior of Ti-6Al-2Sn-4Zr-6Mo alloy based on the processing maps. Int. J. Mater. Form. 2020. [Google Scholar] [CrossRef] [Green Version]
  4. Choda, T.; Oyama, H.; Murakami, S. Technologies for process design of titanium alloy forging for aircraft parts. KOBELCO Technol. Rev. 2015, 33, 44–49. [Google Scholar]
  5. Alluaibi, M.H.I.; Cojocaru, E.M.; Rusea, A.; Serban, N.; Coman, G.; Cojocaru, V.D. Microstructure and mechanical properties evolution during solution and ageing treatment for a hot deformed, above, β-transus, Ti-6246 alloy. Metals 2020, 10, 1114. [Google Scholar] [CrossRef]
  6. Matsumoto, H. Globularization and recrystallization of a Ti-6Al-2Sn-4Zr-6Mo alloy under forging in the (α+β) region: Experiment, phenomenological modeling and machine learning. ISIJ Inter. 2021, 61, 1011–1021. [Google Scholar] [CrossRef]
  7. Xu, J.; Zeng, W.; Jia, Z.; Sun, X.; Zhou, J. Microstructure coarsening behavior of Ti-17 alloy with equiaxed alpha during heat treatment. J. Alloys Compd. 2015, 618, 343–348. [Google Scholar] [CrossRef]
  8. Xu, J.; Zeng, W.; Jia, Z.; Sun, X.; Zhou, J. Static globularization kinetics for Ti-17 alloy with initial lamellar microstructure. J. Alloys Compd. 2014, 603, 239–247. [Google Scholar] [CrossRef]
  9. Xu, J.; Zeng, W.; Sun, X.; Jia, Z.; Zhou, J. Static coarsening behavior of the lamellar alpha in Ti-17 alloy. J. Alloys Compd. 2015, 631, 248–254. [Google Scholar] [CrossRef]
  10. Jia, Z.; Zeng, W.; Xu, J.; Zhou, J.; Wang, Z. Development of the dynamic globularization prediction model for Ti-17 titanium alloy using finite element method. J. Mater. Eng. Perform. 2015, 24, 1771–1780. [Google Scholar] [CrossRef]
  11. Xu, J.; Zeng, W.; Sun, X.; Jia, Z. Microstructure evolution during isothermal forging and subsequent heat treatment of Ti-17 alloy with a lamellar colony structure. J. Alloys Compd. 2015, 637, 449–455. [Google Scholar] [CrossRef]
  12. Zhang, J.; Li, H.; Zhan, M. Review on globularization of titanium alloy with lamellar colony. Manuf. Rev. 2020, 7, 18. [Google Scholar] [CrossRef]
  13. Ning, Y.; Fu, M.W.; Hou, H.; Yao, Z.; Guo, H. Hot deformation behavior of Ti-5.0Al-2.40Sn-2.02Zr-3.86Mo-3.91Cr alloy with an initial lamellar microstructure in the α + β phase field. Mater. Sci. Eng. A 2011, 528, 1812–1818. [Google Scholar] [CrossRef]
  14. Ma, X.; Zeng, W.; Wang, K.; Lai, Y.; Zhou, Y. The investigation on the unstable flow behavior of Ti17 alloy in α + β phase field using processing map. Mater. Sci. Eng. A 2012, 550, 131–137. [Google Scholar] [CrossRef]
  15. Li, H.; Li, M.Q.; Han, T.; Liu, H.B. The deformation behavior of isothermally compressed Ti-17 titanium alloy in α + β field. Mater. Sci. Eng. A 2012, 546, 40–45. [Google Scholar] [CrossRef]
  16. Ma, X.; Zeng, W.; Sun, Y.; Wang, K.; Lai, Y.; Zhou, Y. Modeling constitutive relationship of Ti17 titanium alloy with lamellar starting microstructure. Mater. Sci. Eng. A 2012, 538, 182–189. [Google Scholar] [CrossRef]
  17. Matsumoto, H.; Naito, D.; Miyoshi, K.; Yamanaka, K.; Chiba, A.; Yamabe-Mitarai, Y. Forging property, processing map, and mesoscale microstructural evolution modeling of a Ti-17 alloy with a lamellar (α+β) starting microstructure. STAM 2017, 18, 893–904. [Google Scholar] [CrossRef] [PubMed] [Green Version]
  18. Matsumoto, H.; Yamanaka, K.; Chiba, A.; Yamabe-Mitarai, Y.; Itsumi, Y. Macro-mesoscale microstructural evolution modeling under hot forging of a Ti-17 alloy with a lamellar (α+β) starting microstructure. MATEC Web Conf. 2020, 13005. [Google Scholar] [CrossRef]
  19. Yamanaka, K.; Matsumoto, H.; Chiba, A. A Constitutive model and processing maps describing the high-temperature deformation behavior of Ti-17 alloy in the β -phase field. Adv. Eng. Mater. 2019, 21, 1800775. [Google Scholar] [CrossRef]
  20. Shi, X.; Zeng, W.; Zhao, Q. The effects of lamellar features on the fracture toughness of Ti-17 titanium alloy. Mater. Sci. Eng. A 2015, 636, 543–550. [Google Scholar] [CrossRef]
  21. Liang, R.; Ji, Y.; Wang, S.; Liu, S. Effect of microstructure on fracture toughness and fatigue crack growth behavior of Ti17 alloy. Metals 2016, 6, 186. [Google Scholar] [CrossRef] [Green Version]
  22. Xu, J.; Zeng, W.; Zhao, Y.; Jia, Z.; Sun, X. Effect of globularization behavior of the lamellar alpha on tensile properties of Ti-17 alloy. J. Alloys Compd. 2016, 673, 86–92. [Google Scholar] [CrossRef]
  23. Niinomi, M.; Akahori, T.; Nakai, M.; Koizumi, Y.; Chiba, A.; Nakano, T.; Kakeshita, T.; Yamabe-Mitarai, Y.; Kuroda, S.; Motohashi, N.; et al. Quantitative and qualitative relationship between microstructural factors and fatigue lives under load- and strain-controlled conditions of Ti-5Al-2Sn-2Zr-4Cr-4Mo (Ti-17) fabricated using a 1500-ton forging simulator. Mater. Trans. 2019, 60, 1740–1748. [Google Scholar] [CrossRef] [Green Version]
  24. Niinomi, M.; Akahori, T.; Nakai, M.; Koizumi, Y.; Chiba, A.; Nakano, T.; Kakeshita, T.; Yamabe-Mitarai, Y.; Kuroda, S.; Motohashi, N.; et al. Quantitative relationship between microstructural factors and fatigue life of Ti-5Al-2Sn-2Zr-4Cr-4Mo (Ti-17) fabricated using a 1500-ton forging simulator. MATEC Web Conf. 2020, 321, 11015. [Google Scholar] [CrossRef]
  25. Yamabe-Mitarai, Y.; Kuroda, S.; Motohashi, N.; Matsumoto, H.; Miyamoto, G.; Chandiran, E.; Yoshida, Y.; Itsumi, Y. Effect of forging temperature on microstructure evolution and tensile properties of Ti-17 alloys. Mater. Trans. 2019, 60, 1733–1739. [Google Scholar] [CrossRef] [Green Version]
  26. Yamabe-Mitarai, Y.; Kuroda, S.; Motohashi, N.; Matsumoto, H.; Miyamoto, G.; Yoshida, Y.; Yamanaka, K.; Niinomi, M.; Itsumi, Y. Effect of microstructure on tensile properties of Ti-17 alloys forged using a 1500-ton forging simulator. MATEC Web Conf. 2020, 321, 04014. [Google Scholar] [CrossRef]
  27. Chundiran, E.; Miyamoto, G.; Furuhara, T. Microstructure formation during thermomechanical processing in Ti-17 alloy. MATEC Web Conf. 2020, 321, 12006. [Google Scholar] [CrossRef]
  28. Shimagami, K.; Matsunaga, S.; Yumoto, A.; Ito, T.; Yamabe-Mitarai, Y. Solid solution hardening and precipitation hardening of α2-Ti3Al in Ti–Al–Nb alloys. Mater. Trans. 2017, 58, 1404–1410. [Google Scholar] [CrossRef]
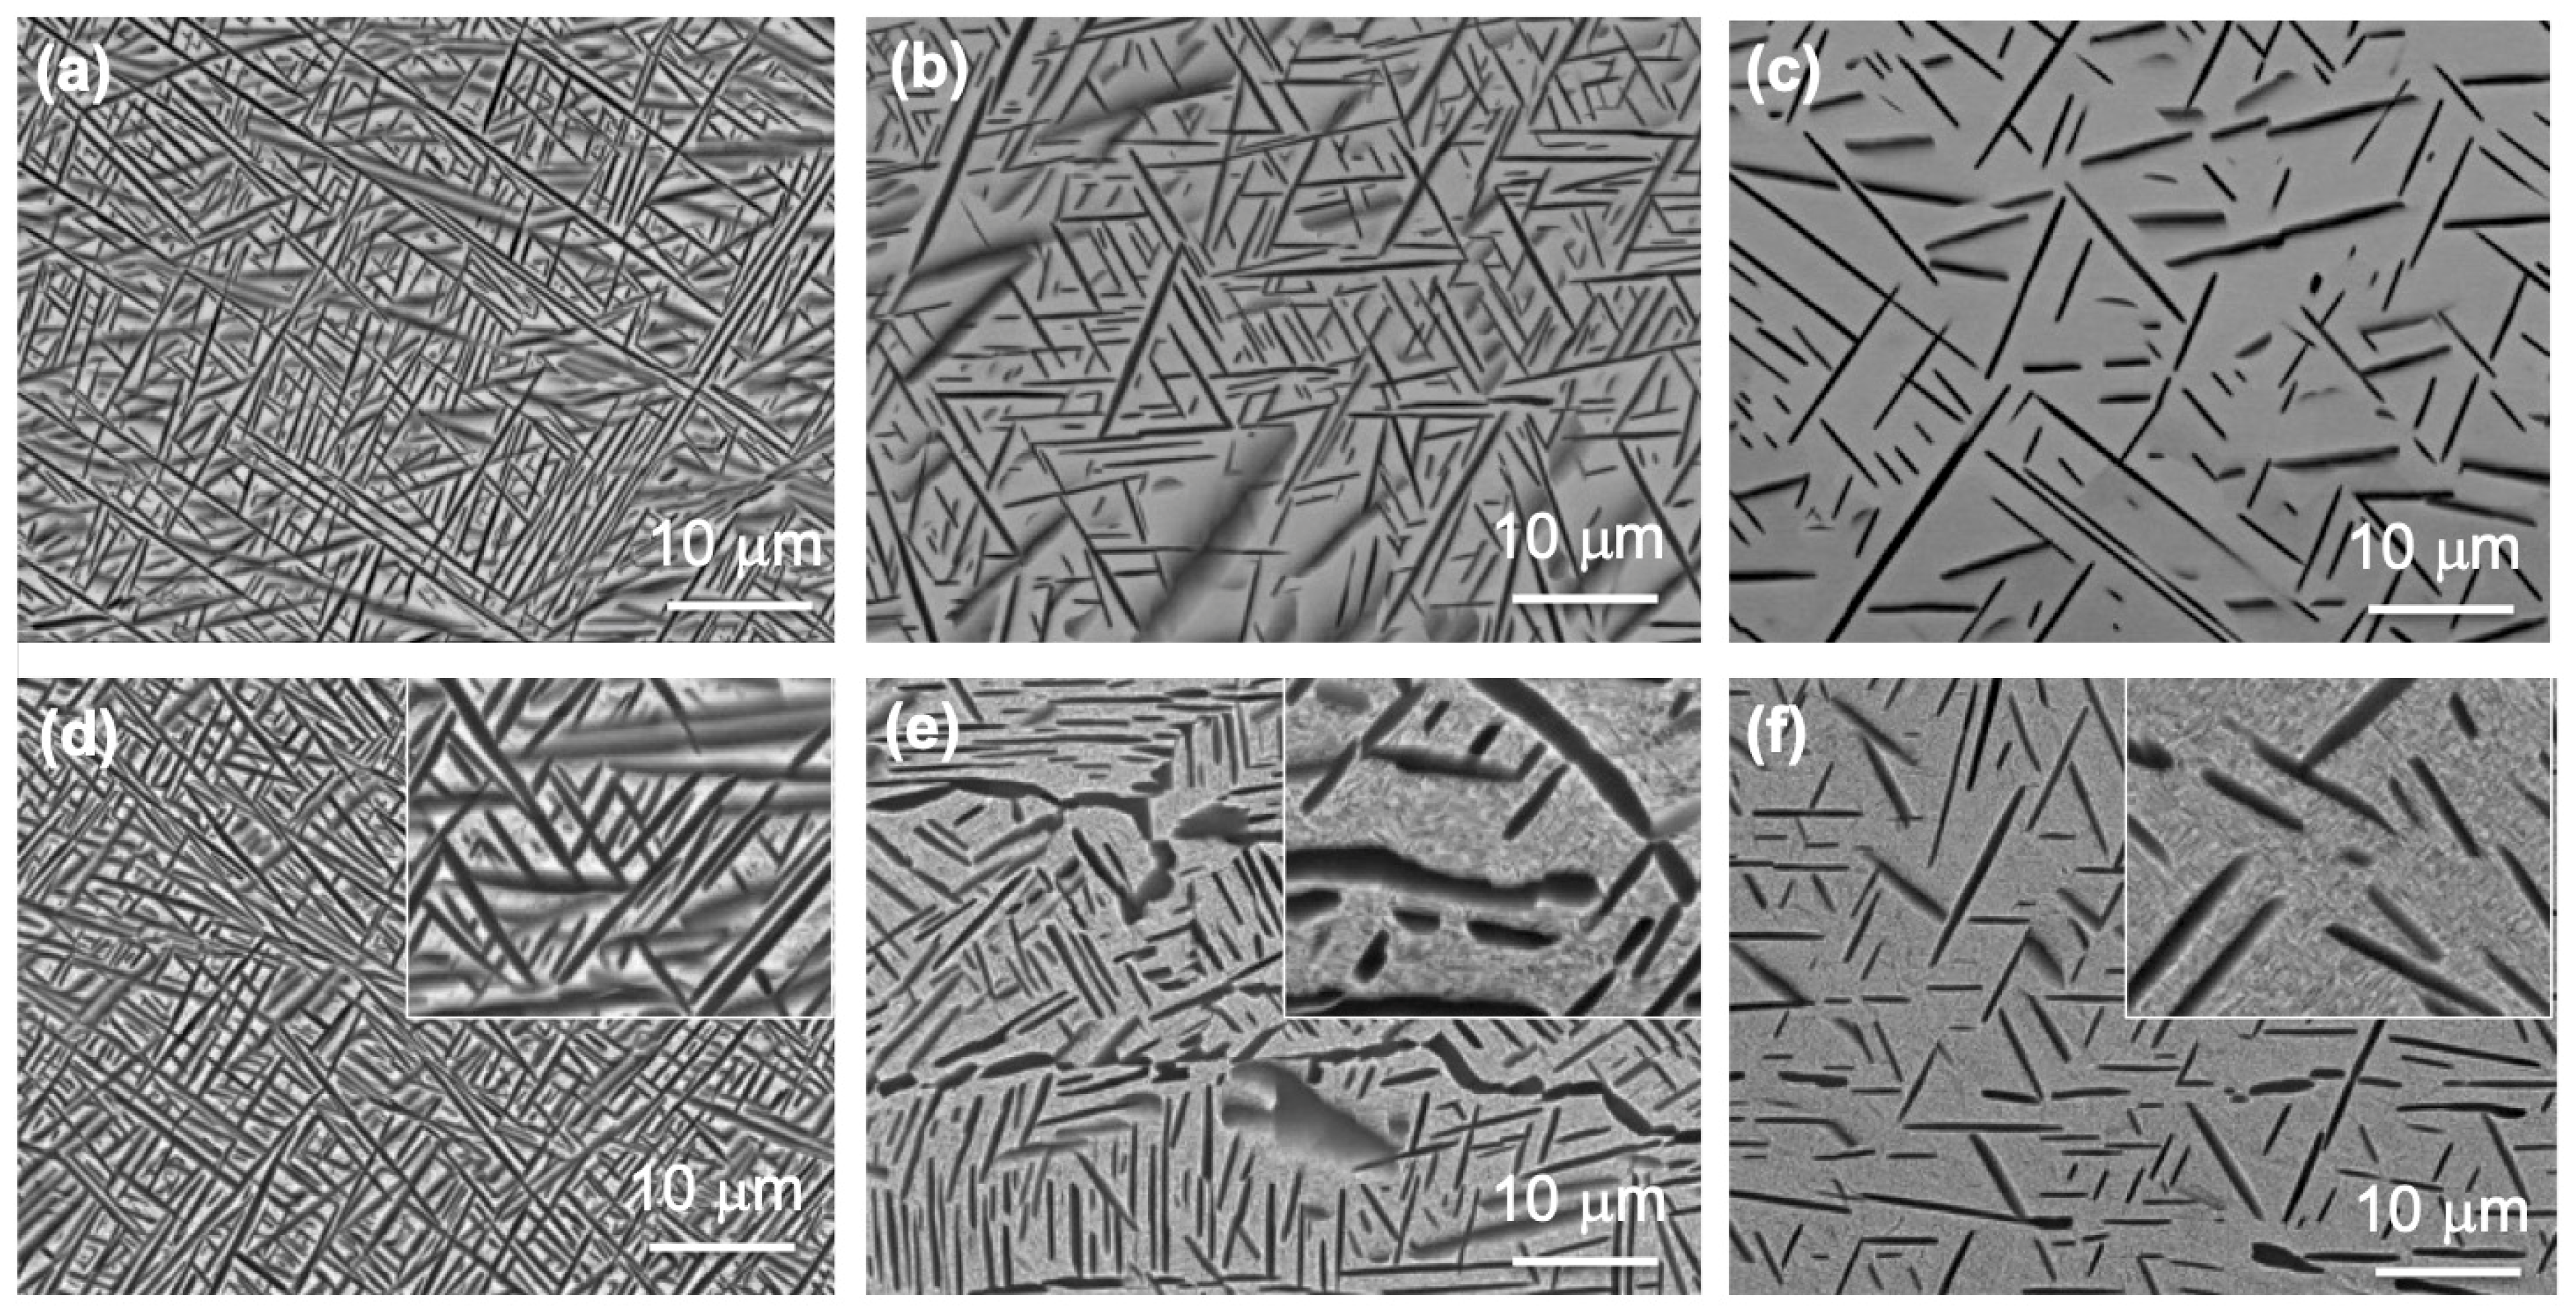
Figure 1. Backscattered electron images of the samples solution-treated at (a) 750 °C, (b) 800 °C, and (c) 850 °C for 4 h, followed by water quenching, and the samples aged at 620 °C for 8 h after ST at (d) 750 °C, (e) 800 °C, and (f) 850 °C.
Crystals 11 00625 g001
Figure 2. (a) Volume fraction of the primary, secondary, and GB α phases and (b) the length and thickness of the primary α phase of the solution-treated (ST) samples and the samples solution-treated and aged (STA).
Crystals 11 00625 g002
Figure 3. Yield strength of the solution-treated samples.
Crystals 11 00625 g003
Figure 4. (a) Yield strength of the solution-treated and the solution-treated-and-aged samples and (b) difference in yield strength between the solution-treated and the solution-treated-and-aged samples. Red, blue, and black symbols represent yield strengths measured at room temperature, 450 °C, and 600 °C, respectively.
Crystals 11 00625 g004
Figure 5. (a) The bright-field and (c) dark-field images and (b) and (d) the related diffraction patterns, respectively, of the samples solution-treated at 850 °C after the tensile test at 450 °C. The zone axis is [ 21 1 ¯ ] α .
Crystals 11 00625 g005
Figure 6. Effect of the primary and secondary α phases on the yield strength of the STA samples at room temperature.
Crystals 11 00625 g006
Figure 7. Effect of the primary and secondary α phases on the yield strength as a function of the volume fraction.
Crystals 11 00625 g007
Figure 8. Effect of the primary and secondary α phases on the yield strength as a function of the volume fraction.
Crystals 11 00625 g008
Table 1. Microstructure factors, including the volume fraction of the primary, secondary, and GB α phases and the length and the thickness of the primary α phase.
SampleVolume Fraction of Primary α (%)Volume Fraction of Secondary α (%)Volume Fraction of GB α (%)Length of Primary α (μm)Thickness of Primary α (μm)
ST at 750 °C5105.511.90.5
Aged after 750 °C ST 601.55.510.80.5
ST at 800 °C2906.910.30.3
Aged after 800 °C ST47.616.52.911.60.7
ST at 850 °C13.10210.10.4
Aged after 850 °C ST16.647.23.28.50.7
Publisher’s Note: MDPI stays neutral with regard to jurisdictional claims in published maps and institutional affiliations.