Article

DFT Study of Electronic Structure and Optical Properties of Kaolinite, Muscovite, and Montmorillonite

Department of Physics and Astronomy, University of Missouri-Kansas City, Kansas City, MO 64110, USA
*
Author to whom correspondence should be addressed.
Crystals 2021, 11(6), 618; https://doi.org/10.3390/cryst11060618
Submission received: 7 May 2021 / Revised: 24 May 2021 / Accepted: 25 May 2021 / Published: 30 May 2021
(This article belongs to the Special Issue First-Principles SimulationNano-Theory)

Abstract

:
Clay mineral materials have attracted attention due to their many properties and applications. The applications of clay minerals are closely linked to their structure and composition. In this paper, we studied the electronic structure properties of kaolinite, muscovite, and montmorillonite crystals, which are classified as clay minerals, by using DFT-based ab initio packages VASP and the OLCAO. The aim of this work is to have a deep understanding of clay mineral materials, including electronic structure, bond strength, mechanical properties, and optical properties. It is worth mentioning that understanding these properties may help continually result in new and innovative clay products in several applications, such as in pharmaceutical applications using kaolinite for their potential in cancer treatment, muscovite used as insulators in electrical appliances, and engineering applications that use montmorillonite as a sealant. In addition, our results show that the role played by hydrogen bonds in O-H bonds has an impact on the hydration in these crystals. Based on calculated total bond order density, it is concluded that kaolinite is slightly more cohesive than montmorillonite, which is consistent with the calculated mechanical properties.

1. Introduction

Clay-based minerals are extracted from many raw materials from a small to a large range of composites that make them appropriate for environmental applications and purposes. Clay minerals are formed as crystalline granule infinitesimals. They are a main constituent of soil and can comprise around 40% of minerals in sedimentary rocks. Moreover, they are hydrous aluminum phyllosilicates, with a general particle size of 2 µm or less [1]. They have very reactive surfaces that are capable of changing the soil environment [2]. The understanding of the structure and physical properties of clay minerals has always been of great interest, particularly in the multidisciplinary fields of physics, chemistry, and earth sciences. We need to know the atomic composition, electronic structure, interatomic bonding, charge transfer, optical properties, and mechanical properties that can help clarify essential issues such as bond strength, solvation effect, spectral characterization, optical absorption, elasticity, seismic wave velocities, etc. Even though there have been considerable experimental studies on clay minerals, detailed information on their structure and properties is still inadequate, especially in regard to bonding information, total density of states (TDOS), partial density of states (PDOS), and mechanical properties. Ab initio computational research seems to be the most suitable way to get such information due to recent development in supercomputing technology, in contrast to the costly experimental trial-and-error approach in the laboratory. Some examples of clay minerals, for which the electronic structure and bonding information are kind of unknown and ripe for such investigation, include kaolinite, muscovite, and montmorillonite (MMT).
Kaolinite, Al2Si2O5(OH)4, is one of the most common clay minerals. It comprises the principal ingredients of kaolin (china clay). The kaolin group includes nacrite, dickite, halloysite, and kaolinite. All of them have an identical chemical composition but in a different crystalline form. Kaolinite, a classification from the phyllosilicate group, is composed of alternating sheets of silicates and aluminum hydroxide, as shown in Figure 1. The lattice parameter, number of atoms, and space group of kaolinite is shown in Table 1. Studying kaolinite can aid in many important areas such as geology, agriculture, construction, and engineering applications [3]. Additionally, the world mining production of kaolin in 2016 was 37.0 Mt, making it the most mined clay [4]. Kaolinite is used in the adsorption of some heavy metals; furthermore, it is used to remove pollutants from water [5]. It is extensively used in the field of paper production, plastics, paints, adhesives, insecticides, medicines, food additives, bleach cements, fertilizers, cosmetics, crayons, pencils, detergents, paste, floor tiles, textiles, and many more [6]. One of the most important potential applications uses kaolinite in pharmaceutical applications especially for cancer treatment [7]. Additionally, kaolinite has a much simpler crystal structure that is not easily decomposable and has been studied in different aspects, such as its fiber mechanical properties, kinetics of metal adsorption [8], and far more. However, to further improve its application, it is important to conduct a thorough study of the electronic and mechanical properties.
Muscovite, KAl2(Si3Al)O10(OH)2 [9], consists of two tetrahedral sheets to one octahedral sheet, as shown in Figure 1. The lattice parameter, number of atoms, and space group of muscovite is shown in Table 1. Muscovite crystal has layered structures that enable nearly perfect cleavage that allows for the formation of a smooth surface at an atomic scale. Layer properties provide information on the surface interactions and related properties. There have been only a few studies related to layering so far [10]. Muscovite is present in metamorphic, igneous, and sedimentary rocks, and is among the most common minerals of the mica family. It is slightly larger than clay minerals and has a platy shape similar to clay minerals. It can be easily identified by its bright silvery sparkle and used to add “glitter” to paints and cosmetics. Since it can resist electricity and heat, it is also used as an insulator in electrical appliances and in ovens. Moreover, its slightly transparent nature allows for its high usage in windows and other construction industries.
Montmorillonite (MMT), Al2Si4O10(OH)2 [11], is a clay mineral of the smectite group that consists of two tetrahedral sheets to one octahedral sheet, as shown in Figure 1. The lattice parameter, number of atoms, and space group of MMT is shown in Table 1. Weathering of eruptive rock materials leads to the formation of MMT. It is capable of absorbing cations and is one of the most expandable clay minerals that can absorb a large quantity of water. Therefore, it can be used in numerous fields such as oil refining, pharmaceutical preparations, sugar refining, as a catalyst, and as a binder in many fields such as insulating materials. The major uses of MMT are as a sealant in many engineering applications, and as a barrier for landfills and toxic waste repositories [12]. In addition, montmorillonite is used to design polymer-clay nanocomposites, which are capable of changing their strength and resistance [13]. It can also form composites to biological entities such as proteins and amino acids. Computational modeling may be the only venue that can provide useful information about this clay mineral with extremely complex structures.
A deep analysis of the electronic structure in kaolinite, muscovite, and MMT can help to understand and modify clay minerals, which may significantly improve their surface properties and consequently increase their capacities and efficiencies in many applications, such as environmental cleanup applications [14]. This work presents a computational study on the structure and properties of these minerals. A fundamental understanding of the electronic structure and physical properties will have a broader impact on scientific advances in many frontiers. They range from medical applications such as kaolinite’s use in cancer diagnosis and treatment and electrical applications, muscovite’s use as an insulator and in engineering applications, and MMT’s use as a sealant. Additionally, they can be used to improve cements, as data for seismic wave velocities for geoscience, and much more.

2. Methods

In this study, we used two computational packages, Vienna ab initio Simulation Package (VASP) [19] and the Orthogonalized Linear Combination of Atomic Orbitals (OLCAO) [20]. Both are established based on density functional theory (DFT). VASP is utilized for the optimization of the structures and for the calculation of elastic and mechanical properties. Projector augmented wave potential (PAW-PBE) [21], as well as generalized gradient approximation (GGA) potential, was used for the exchange and correlation part of the DFT potential. A relatively high energy cutoff of 600 eV, with electronic force convergence at 10−5 eV, was used. The KPOINTS used were 6 × 6 × 4, 2 × 2 × 1, and 2 × 1 × 1 for kaolinite, muscovite, and MMT, respectively.
We used the optimized structure obtained from VASP as input into OLCAO for the calculation of the electronic structure, interatomic bonding, and optical properties. OLCAO is another DFT-based package, in which the atomic orbitals are used in the basis expansion [20]. The OLCAO method, in combination with VASP for structural relaxation, has been very successful in electronic property calculations, especially for large and complex systems, because of the flexibility and the economic use of the basis set. We used a full basis (FB) for the self-consistent potential, total density of state (TDOS), partial DOS (PDOS), and band structure calculations. For the bond order (BO) calculation, we used a minimal basis (MB) based on the Mulliken scheme. BO is the overlap population ρ α β between any pair of atoms ( α , β ) .
ρ α β = m ,   occ i , j C i α * m C j β m S i α , j β
where S i α , j β are the overlap integrals between the ith orbital in the αth atom and jth orbital in the βth atom. The C j β m are eigenvector coefficients of the mth band and jth orbital in the βth atom. Equation (1) defines the bond’s relative strength. A summation of all BOs of the crystal results in a total bond order (TBO), and by normalizing the TBO by the crystal’s volume, the total bond order density (TBOD) is generated. TBOD is a single metric that can be used for the evaluation of the interior cohesion of a crystal and can be further divided into the partial bond order density (PBOD) for different types of bond pairs. For optical properties, we used extended basis (EB), which includes a shell of unoccupied orbitals in addition to the FB. The interband optical properties are usually presented in the form of a frequency-dependent complex dielectric function.
ε ( ħ ω ) =   ε 1 ( ħ ω ) + i   ε 2 ( ħ ω )
where the real part ε 1   ( ħ ω ) is obtained from ε 2   ( ħ ω ) through a Kramers–Kronig transformation [21]. The effective charge Q * and the partial charge (PC) for every atom in these systems were obtained by using following equation.
Δ Q   =   Q 0 Q *
For the calculation of the elastic and mechanical properties, a stress ( σ j ) vs. strain ( ε j ) response analysis [22,23] scheme is applied to the fully relaxed structure to obtain the elastic coefficients C ij (i, j = 1, 2, 3, 4, 5, 6). From ε j and the calculated σ j , C ij is appraised by solving the linear equation.
σ j = j = 1 6 C ij ε j
From the elastic coefficients C ij , we can obtain mechanical properties: the bulk modulus (K), shear modulus (G), Young’s modulus (E), Poisson’s ratio (ɳ) and Pugh modulus ratio (G/K). The Pugh modulus ratio (G/K) is calculated using the Voight–Reuss–Hill (VRH) polycrystal approximation [24,25]. The Voight approximation assumes uniform strain distribution in the structure, which results in an upper limit of the polycrystalline bulk moduli. On the other hand, the Reuss approximation assumes a uniform stress distribution, resulting in the lower limits. The average of these two limits gives the so-called Hill approximation, which is more realistic and can be compared with measured elastic parameters.

3. Results and Discussion

3.1. Electronic Structure and Interatomic Bonding

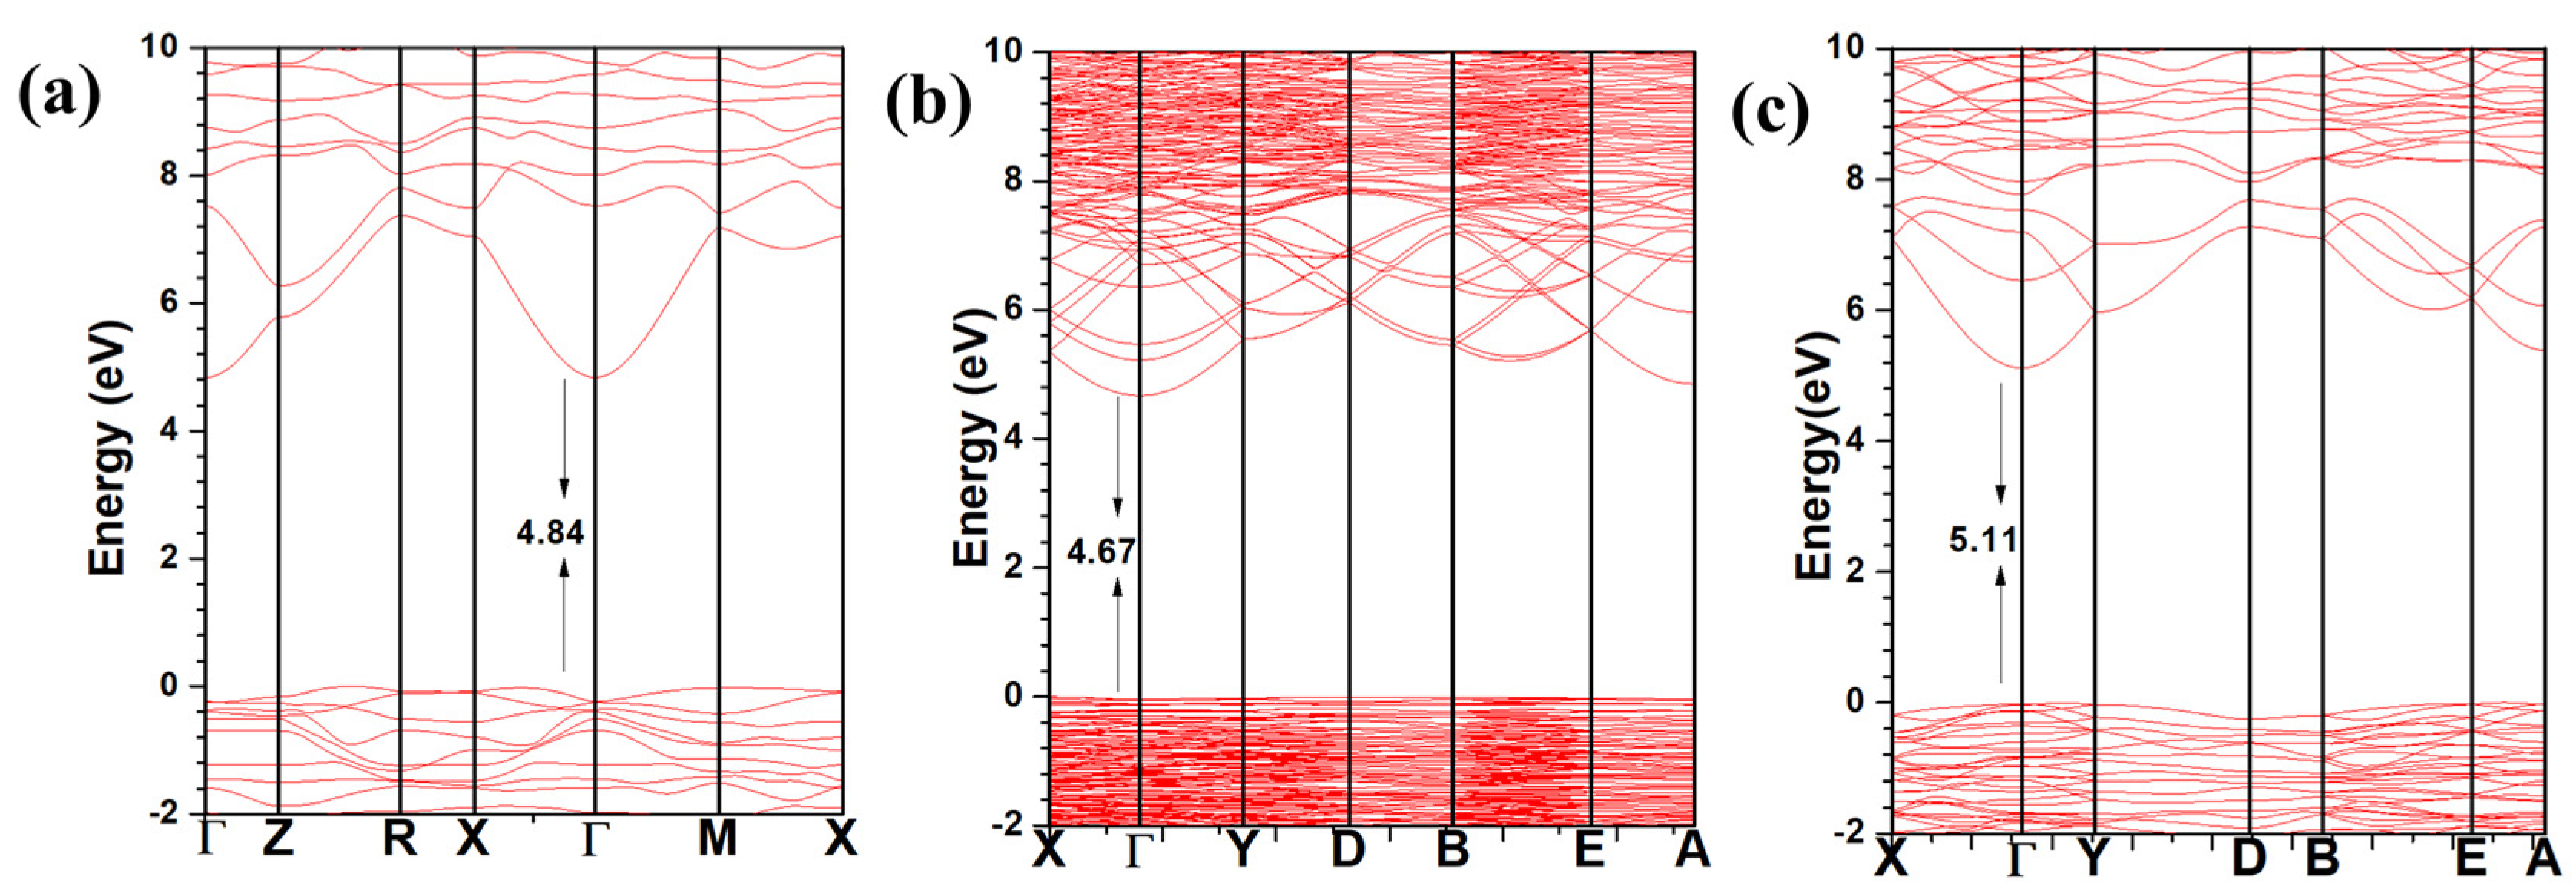
We obtained the atomic coordinates for kaolinite, muscovite, and MMT from Hess et al. [15], Radoslovich et al. [16], and Subramanian et al. [17], respectively. The calculated band structures of those three clay minerals’ crystal structures are shown in Figure 2. The bandgap results clearly show that they are insulators. According to the calculations, the bandgaps of kaolinite, muscovite, and MMT were 4.84 eV, 4.67 eV, and 5.11 eV, respectively. Our band gap results are consistent with a theoretical study [26] for kaolinite, which was 4.8 eV. In addition, for the muscovite, our findings are in accordance with a DFT study [27] with values ranging from 3.96 eV to 5.02 eV, which is significantly lower than the experimental value of 7.85 eV [28]. For MMT, our bandgap value was close to two other calculations, which were about 5.35 eV [11] and 5.52 eV [29]. All of them had a direct bandgap except for kaolinite. Among the three crystals, MMT had the widest bandgap. In muscovite, the bottom of the conduction band (CB) had a curvature, whereas the top of the valence band (VB) was very flat.
The calculated TDOS and further resolved PDOS for the three crystals in the energy ranged from −25 eV to 25 eV and are shown in Figure 3. The PDOS shows the relative contribution of each element to the TDOS, which helps to understand the bonding. Among the three crystals, kaolinite and MMT have same set of four elements, H, O, Si, and Al. Besides these four elements, muscovite also consists of K, which was responsible for the sharp peak at energy −11 eV, which was due to semi-core nature of the K-3p orbital. Most of the states and peaks in the TDOS for the three crystals were from O atoms. The states of Al, Si, H, and K in the same energy range with O atoms showed their bonding.
The interatomic interaction as BO vs. bond length (BL) distribution of these three crystals is shown in Figure 4. All of these three clay mineral crystals had O-H, Si-O, and Al-O, whereas O-K bonding was only present in muscovite, as depicted in Figure 4b. O-H bonds were the strongest bond in the three crystals, with a BO of 0.29 e and a BL of around 0.94 Å. Si-O bonds had a higher BO in muscovite at 0.30 e and MMT at 0.29 e, in comparison to kaolinite. Al-O bonds in muscovite were more scattered in comparison to kaolinite and MMT. In addition, there were some O-H bonds in the range between 2.8 and 3.4 Å, which represented hydrogen bonding.
The PBOD and TBOD of these three crystals are shown in Table 2. The TBOD is the sum of the BO values of all bond pairs divided by the volume of the crystal. TBOD is a good parameter to gauge the internal cohesion in the system [30]. The TBOD values for these three crystals were similar. However, kaolinite was slightly more cohesive than MMT and muscovite. TBOD can be further resolved into PBOD to identify the impact of different bonding in the system. Si-O bonds had higher contribution, which was followed by Al-O bonds in the three crystals. The O-H bonds in muscovite and MMT showed the same PBOD value of 0.003 e/Å3 and a much lower value of 0.007 e/Å3 in kaolinite.
The PC of each atom is defined as the deviation of the effective charge from the neutral charge. The PC for every atom of the three crystals is shown in Figure 5. It is noted that O had a negative PC in all three crystals and the other elements had a positive PC, as expected. It simply means that the oxygen gained more electrons from the other positively charged atoms. Minor variations in the PC of O, Al, and Si represent site variation.
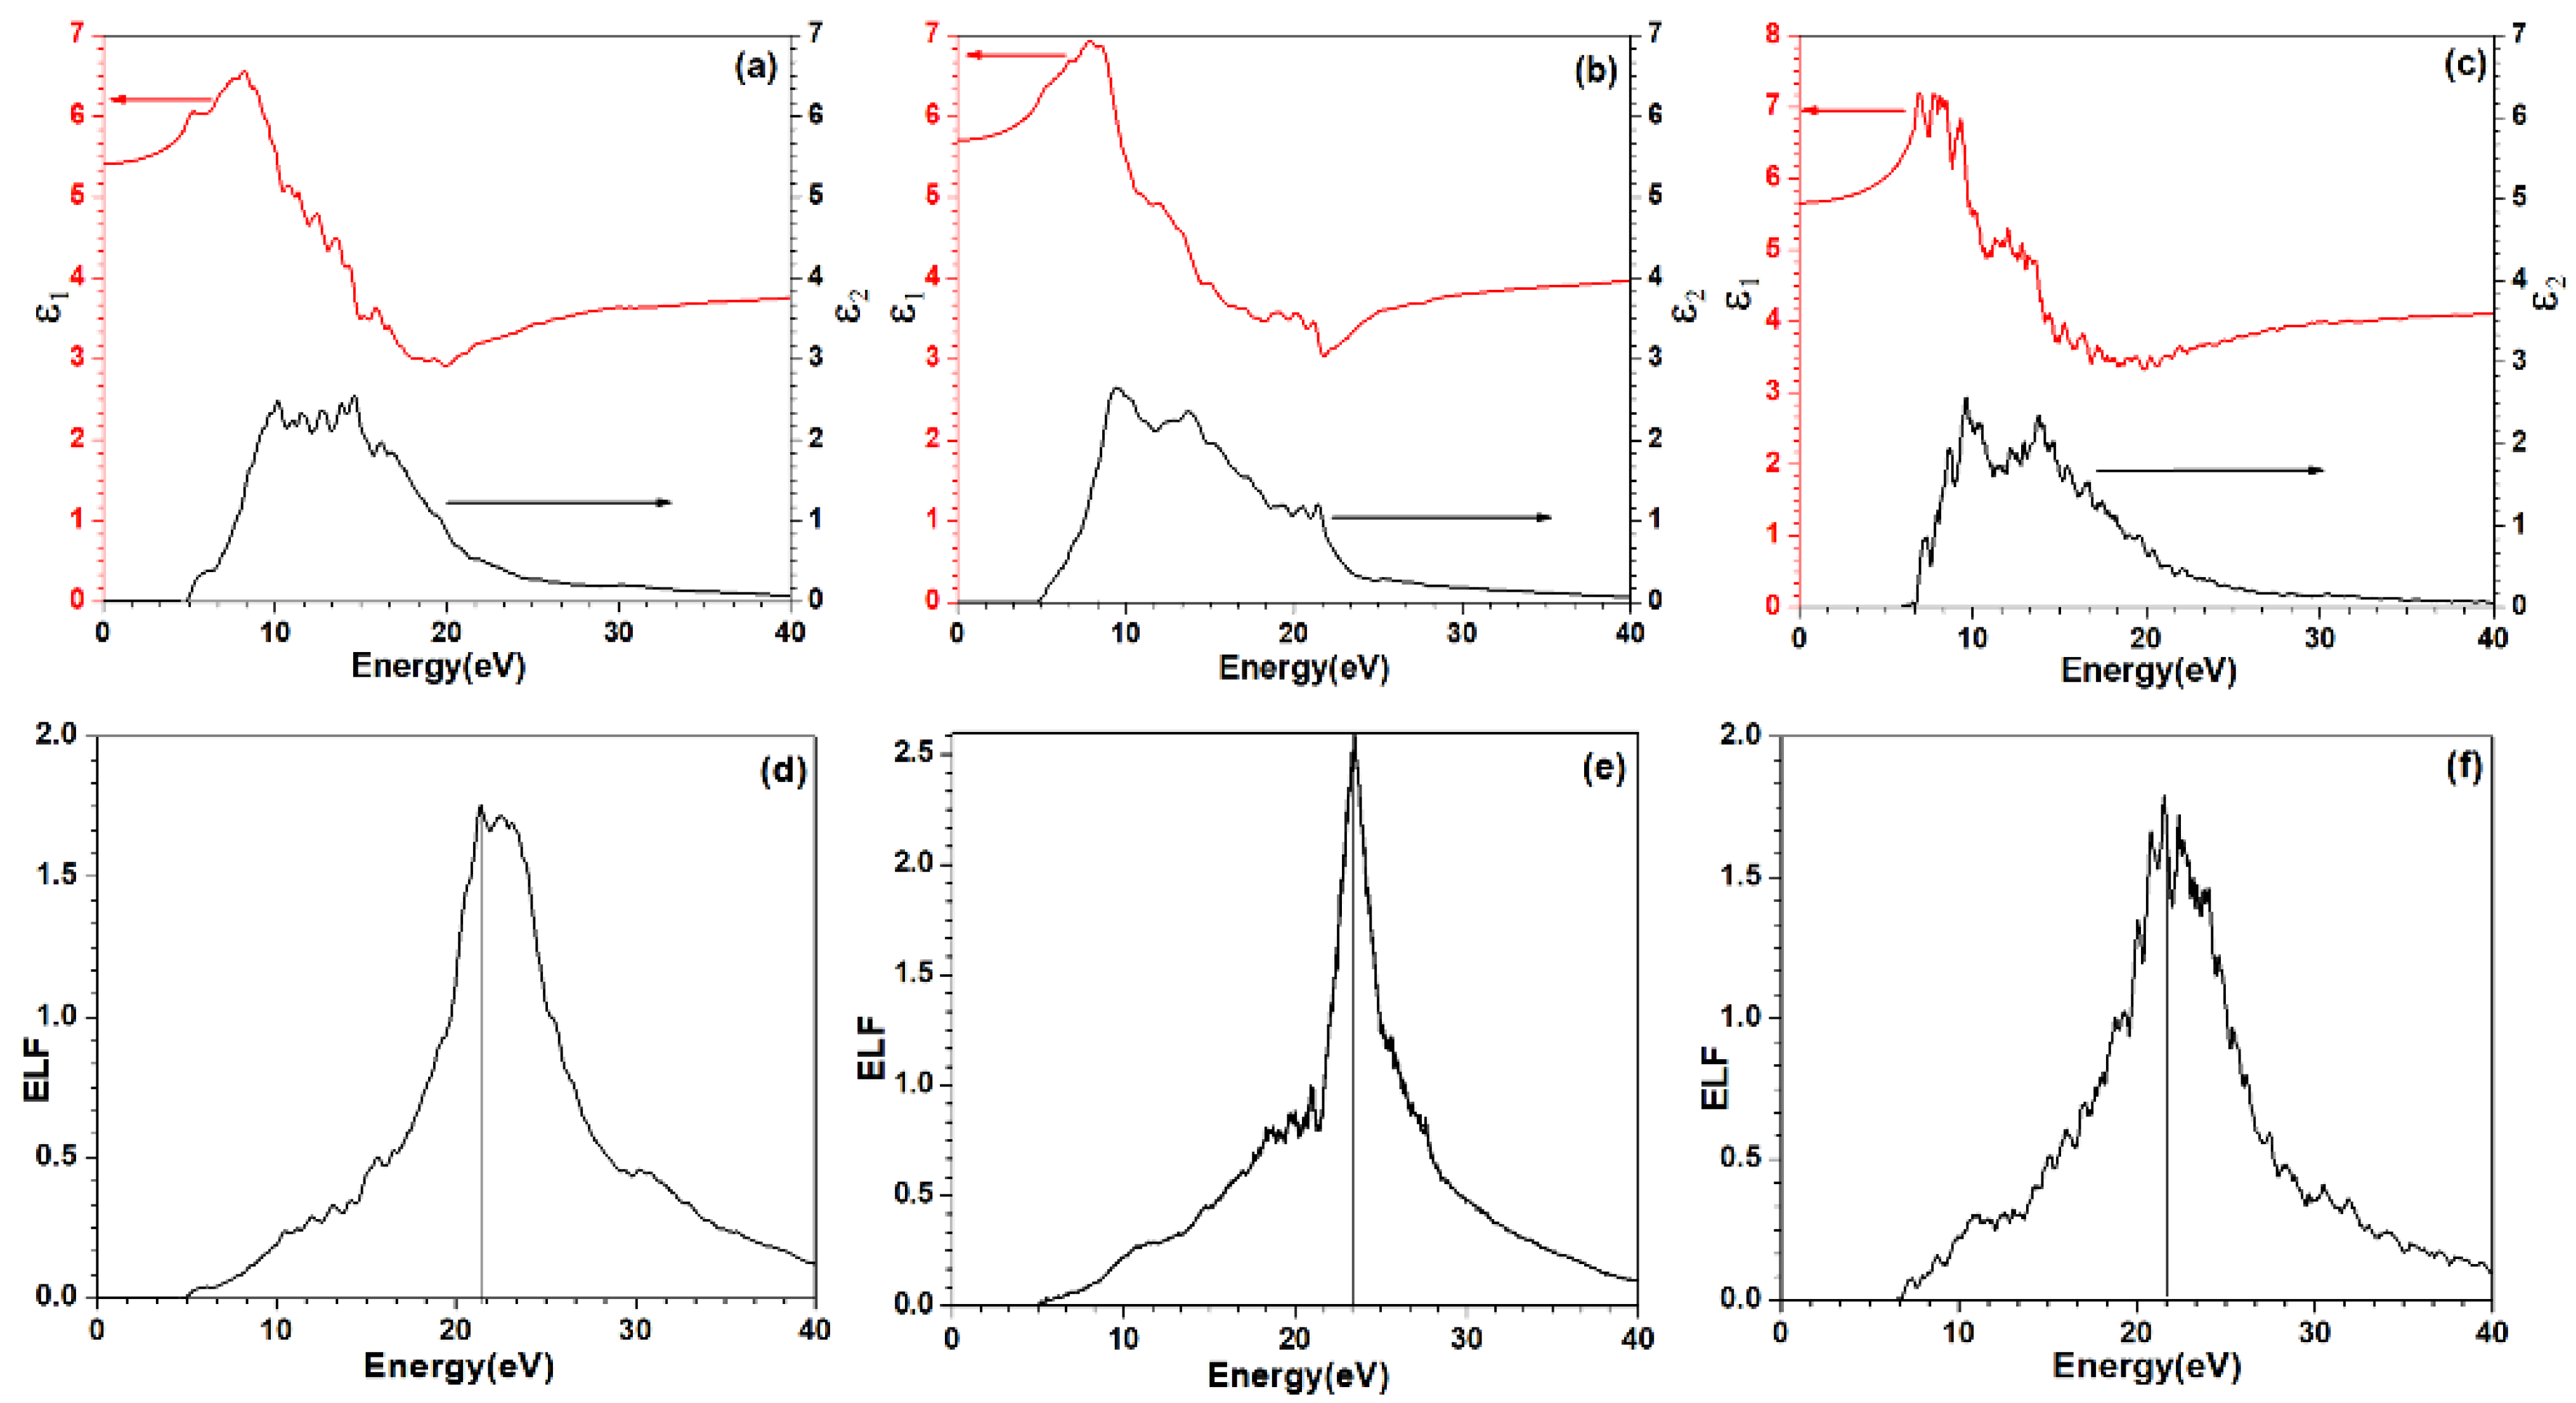
The optical behavior of the real ( ε 1 ) and imaginary ( ε 2 ) dielectric function of these three minerals is shown in Figure 6. We can obtain the static dielectric constant from the calculated dielectric functions by taking the zero-frequency limit of the real parts of the dielectric function. The refractive index (n) is calculated by taking the square root of ε 1 (0). The refractive indexes for kaolinite, muscovite, and MMT are 1.60, 1.58, and 1.52, respectively. Figure 6 presents the calculated energy-loss functions (ELF) for all three crystals. It shows the collective excitation of electrons at high frequency. The main peak of ELF is defined as the plasma frequency (ωp). Among the three crystals, muscovite had the highest ωp at 23.59 eV and kaolinite had lowest ωp at 21.38 eV.

3.2. Mechanical Properties

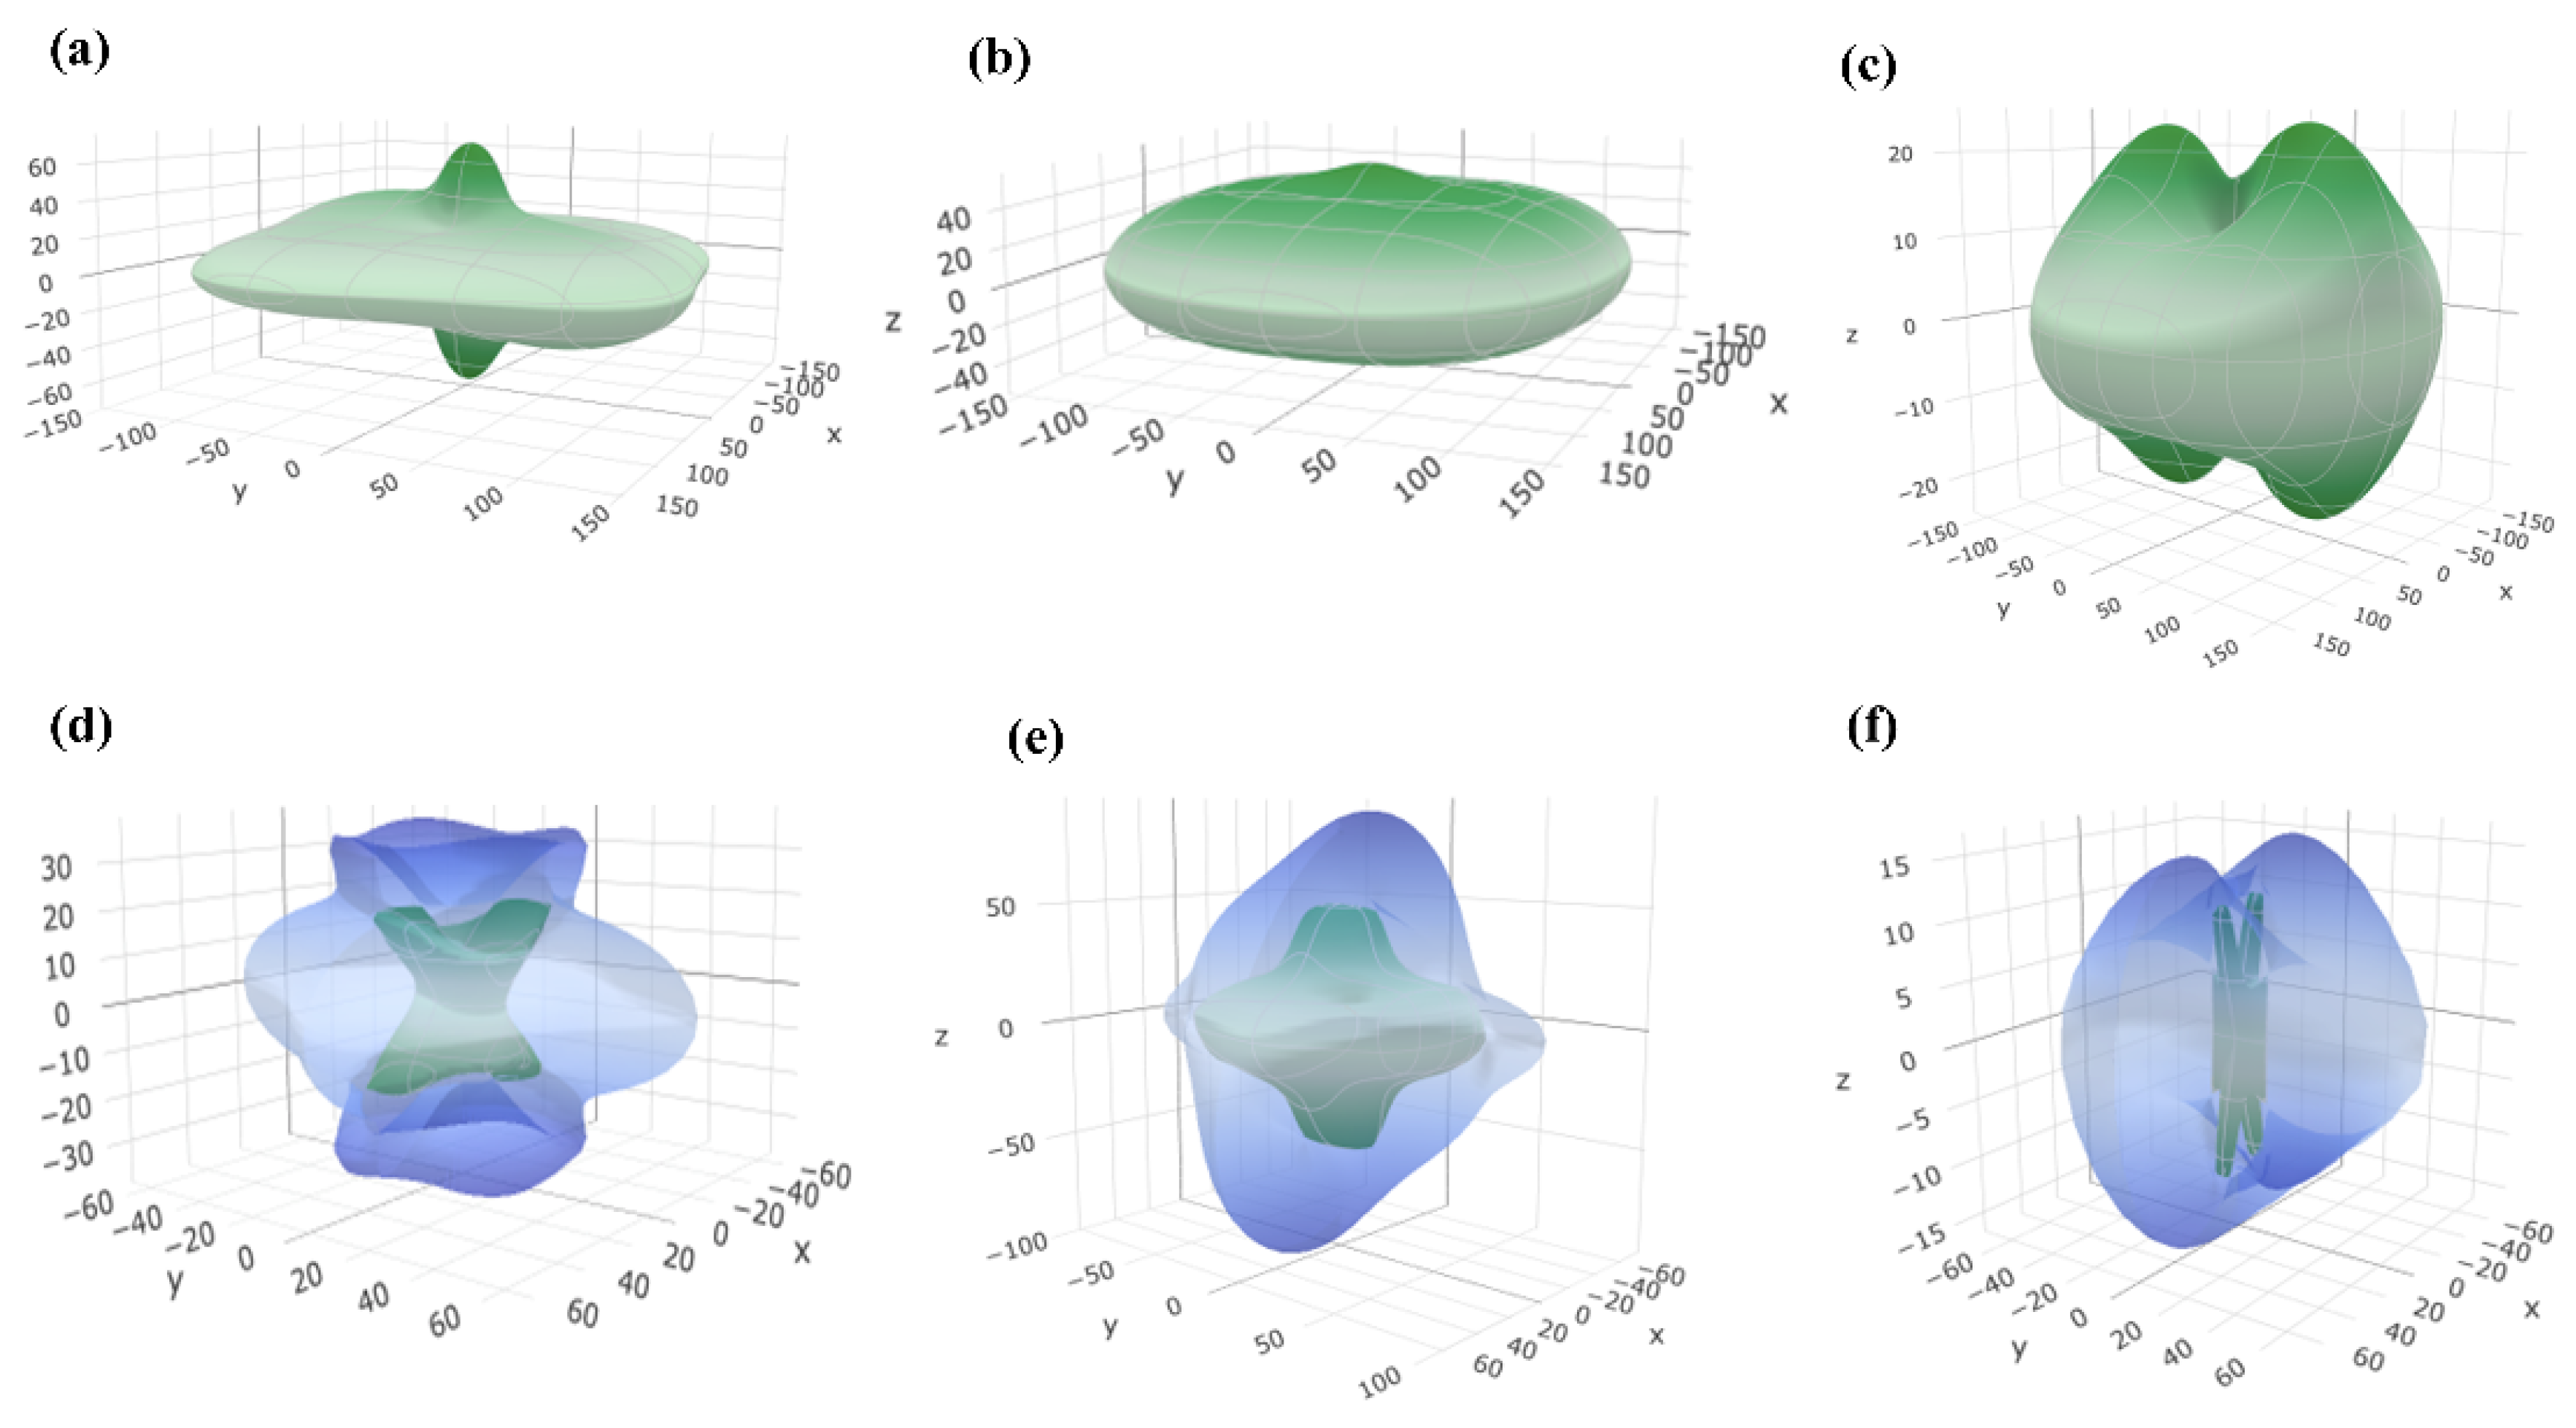
One of the important factors in clay mineral study is obtaining the elastic properties and the sound velocity, which will help to understand the seismic and sonic log [31]. We calculated the elastic coefficients from VASP relaxed structures for the three crystals. From the elastic coefficients, the mechanical parameters for these crystals were obtained. They were the bulk modulus (K), shear modulus (G), Young’s modulus (E), Poisson’s ratio (η), Pugh’s modulus ratio (k = G/K), and Vicker’s hardness (HV) and are summarized in Table 3. The calculated bulk modulus for kaolinite was 46.93 GPa, which falls in the experimentally obtained range of 21 to 55 GPa [32,33]. The higher the bulk modulus, the less compressible the crystal is. The shear modulus represents the modulus of the rigidity of the material and Young’s modulus represents the stiffness of the material. Among the three crystals, muscovite had the highest bulk modulus, Young’s modulus, and shear modulus. Pugh’s modulus ratio (G/K) estimates the brittleness or ductility of the material from comparative analysis. In Pugh’s modulus ratio approximation, an empirical boundary value of 0.571 could be defined to classify metallic materials as brittle (>0.571) or ductile (<0.571) [34]. The calculated Pugh’s modulus ratio (G/K ratio) for kaolinite, muscovite, and MMT was 0.678, 0.715, and 0.745, respectively. MMT is more brittle than kaolinite or muscovite. This could be a result of the difference in composition and structure. Vicker’s hardness for the three crystals was calculated using Tian et al.’s [35] equation HV = 0.92k1.137G0.708. Muscovite had a higher Vicker’s hardness in comparison to kaolinite and MMT (shown in Table 3). The Young’s modulus and shear modulus are further shown in a three-dimensional plot in Figure 7. The Young’s modulus for the three crystals showed an anisotropic nature and the shear modulus showed a more complex nature, with both translucent blue and green colors.
Once we obtained the elastic tensors for the three kaolinite, muscovite and MMT minerals, it was also imperative to obtain the sound velocities. We obtained the transverse sound velocity V T and longitudinal sound velocity V L by using the following equations.
V T = G   ρ ,   V L = K + 4 3 G ρ
where ρ is density. The calculated V L ,   V T , and ρ values for those minerals are listed in Table 4. Both V L and V T were greater in muscovite than the other two. These values could be useful in the geosciences area and used for seismology databases.

4. Conclusions

We presented detailed results on the first-principles calculation of the electronic structure, interatomic bonding, partial charge, optical properties, and mechanical properties. The three crystals had wide band gaps, showing their insulating nature. The O-H bonds were the strongest bond, with the largest BO of around 0.29 e in the three crystals. In addition, Si-O bonds were reasonably strong and had the highest percentage contribution in the three crystals. Based on TBOD, kaolinite was slightly more cohesive than MMT or muscovite. Muscovite had the highest plasmon frequency of 23.59 eV. Despite similar compositions specifically in kaolinite and MMT, we obtained somewhat different results for their mechanical properties. Muscovite had a higher bulk, shear, Young’s modulus, and Vicker’s hardness. As a result of the higher Pugh’s modulus ratio, MMT was more brittle than kaolinite or muscovite. The presented work is the first step in understanding the structure and properties of these three clay minerals. We plan to extend this study to include the influence of dopant Mg and Na.

Author Contributions

W.-Y.C. conceived the project. L.S. and P.A. performed the calculations, L.S. made most of the figures. L.S., P.A. and W.-Y.C. drafted the paper. All authors participated in the discussion and interpretation of the results. All authors edited and proofread the final manuscript. All authors have read and agreed to the published version of the manuscript.

Funding

This research used the resources of the National Energy Research Scientific Computing Center supported by DOE under Contract No. DE-AC03-76SF00098 and the Research Computing Support Services (RCSS) of the University of Missouri System.

Institutional Review Board Statement

Not applicable.

Informed Consent Statement

Not applicable.

Acknowledgments

This research used the resources of the National Energy Research Scientific Computing Center, supported by the DOE under contract no. DE-AC03-76SF00098, and the Research Computing Support Services (RCSS) of the University of Missouri System.

Conflicts of Interest

The authors declare no conflict of interest.

References

  1. Brindley, G.W. CLAYS, CLAY MINERALSClays, clay minerals. In Mineralogy; Springer: Boston, MA, USA, 1983; pp. 69–80. [Google Scholar]
  2. Essington, M.E. Soil and Water Chemistry: An Integrative Approach; CRC Press: Boca Raton, FL, USA, 2015. [Google Scholar]
  3. Murray, H.H. Traditional and new applications for kaolin, smectite, and palygorskite: A general overview. Appl. Clay Sci. 2000, 17, 207–221. [Google Scholar] [CrossRef]
  4. Detellier, C. Functional kaolinite. Chem. Rec. 2018, 18, 868–877. [Google Scholar] [CrossRef] [PubMed]
  5. Yavuz, Ö.; Altunkaynak, Y.; Güzel, F. Removal of copper, nickel, cobalt and manganese from aqueous solution by kaolinite. Water Res. 2003, 37, 948–952. [Google Scholar] [CrossRef]
  6. Gehr, P.; Heyder, J. Particle-Lung Interactions; CRC Press: Boca Raton, FL, USA, 2000. [Google Scholar]
  7. Gianni, E.; Avgoustakis, K.; Papoulis, D. Kaolinite group minerals: Applications in cancer diagnosis and treatment. Eur. J. Pharm. Biopharm. 2020, 154, 359–376. [Google Scholar] [CrossRef] [PubMed]
  8. Miranda-Trevino, J.C.; Coles, C.A. Kaolinite properties, structure and influence of metal retention on pH. Appl. Clay Sci. 2003, 23, 133–139. [Google Scholar] [CrossRef]
  9. Liang, J.-J.; Hawthorne, F.C. Rietveld refinement of micaceous materials; muscovite-2M 1, a comparison with single-crystal structure refinement. Can. Mineral. 1996, 34, 115–122. [Google Scholar]
  10. Wang, J.; Kalinichev, A.G.; Kirkpatrick, R.J.; Cygan, R.T. Structure, energetics, and dynamics of water adsorbed on the muscovite (001) surface: A molecular dynamics simulation. J. Phys. Chem. B 2005, 109, 15893–15905. [Google Scholar] [CrossRef]
  11. Man-Chao, H.; Zhi-Jie, F.; Ping, Z. Atomic and electronic structures of montmorillonite in soft rock. Chin. Phys. B 2009, 18, 2933. [Google Scholar] [CrossRef]
  12. Murray, H.H. Overview—clay mineral applications. Appl. Clay Sci. 1991, 5, 379–395. [Google Scholar] [CrossRef]
  13. Toth, R.; Voorn, D.-J.; Handgraaf, J.-W.; Fraaije, J.G.; Fermeglia, M.; Pricl, S.; Posocco, P. Multiscale computer simulation studies of water-based montmorillonite/poly (ethylene oxide) nanocomposites. Macromolecules 2009, 42, 8260–8270. [Google Scholar] [CrossRef]
  14. Sarkar, B.; Rusmin, R.; Ugochukwu, U.C.; Mukhopadhyay, R.; Manjaiah, K.M. Modified clay minerals for environmental applications. In Modified Clay and Zeolite Nanocomposite Materials; Elsevier: Cambridge, MA, USA, 2019; pp. 113–127. [Google Scholar]
  15. Hess, A.C.; Saunders, V.R. Periodic ab initio Hartree-Fock calculations of the low-symmetry mineral kaolinite. J. Phys. Chem. 1992, 96, 4367–4374. [Google Scholar] [CrossRef]
  16. Radoslovich, E. The structure of muscovite, KAl2(Si3Al)O10(OH)2. Acta Crystallogr. 1960, 13, 919–932. [Google Scholar] [CrossRef]
  17. Subramanian, N.; Whittaker, M.L.; Ophus, C.; Lammers, L.N. Structural Implications of Interfacial Hydrogen Bonding in Hydrated Wyoming-Montmorillonite Clay. J. Phys. Chem. C 2020, 124, 8697–8705. [Google Scholar] [CrossRef]
  18. Momma, K.; Izumi, F. VESTA 3 for three-dimensional visualization of crystal, volumetric and morphology data. J. Appl. Crystallogr. 2011, 44, 1272–1276. [Google Scholar] [CrossRef]
  19. Vienna Ab-Initio Aimulation Package (vasp). Available online: https://www.vasp.at/ (accessed on 26 May 2021).
  20. Ching, W.-Y.; Rulis, P. Electronic Structure Methods for Complex Materials: The Orthogonalized Linear Combination of Atomic Orbitals; Oxford University Press: Oxford, UK, 2012. [Google Scholar]
  21. Kresse, G.; Joubert, D. From ultrasoft pseudopotentials to the projector augmented-wave method. Phys. Rev. B 1999, 59, 1758. [Google Scholar] [CrossRef]
  22. Nielsen, O.; Martin, R.M. First-principles calculation of stress. Phys. Rev. Lett. 1983, 50, 697. [Google Scholar] [CrossRef]
  23. Yao, H.; Ouyang, L.; Ching, W.Y. Ab initio calculation of elastic constants of ceramic crystals. J. Am. Ceram. Soc. 2007, 90, 3194–3204. [Google Scholar] [CrossRef]
  24. Reuß, A. Berechnung der fließgrenze von mischkristallen auf grund der plastizitätsbedingung für einkristalle. Zamm J. Appl. Math. Mech. /Z. Für Angew. Math. Und Mech. 1929, 9, 49–58. [Google Scholar] [CrossRef]
  25. Hill, R. The elastic behaviour of a crystalline aggregate. Proc. Phys. Soc. Sect. A 1952, 65, 349. [Google Scholar] [CrossRef]
  26. Richard, D.; Rendtorff, N.M. First principles study of structural properties and electric field gradients in kaolinite. Appl. Clay Sci. 2019, 169, 67–73. [Google Scholar] [CrossRef]
  27. Yu, C.-J.; Choe, S.-H.; Jang, Y.-M.; Jang, G.-H.; Pae, Y.-H. First-principles study of organically modified muscovite mica with ammonium ( NH 4 + ) or methylammonium (CH3 NH 4 + ) ion. J. Mater. Sci. 2016, 51, 10806–10818. [Google Scholar] [CrossRef] [Green Version]
  28. Davidson, A.; Vickers, A. The optical properties of mica in the vacuum ultraviolet. J. Phys. C Solid State Phys. 1972, 5, 879. [Google Scholar] [CrossRef]
  29. Fang, Z.-J.; Gou, K.-Y.; Mo, M.; Zeng, J.-S.; He, H.; Zhou, X.; Li, H. First-principle study of electronic structure of montmorillonite at high pressure. Mod. Phys. Lett. B 2020, 34, 2050263. [Google Scholar] [CrossRef]
  30. Dharmawardhana, C.; Misra, A.; Ching, W.-Y. Quantum mechanical metric for internal cohesion in cement crystals. Sci. Rep. 2014, 4, 1–8. [Google Scholar] [CrossRef]
  31. Mondol, N.; Jahren, J.; Bjørlykke, K.; Brevik, I. Elastic properties of clay minerals. Geophysics 2008, 27, 758–770. [Google Scholar] [CrossRef]
  32. Vanorio, T.; Prasad, M.; Nur, A. Elastic properties of dry clay mineral aggregates, suspensions and sandstones. Geophys. J. Int. 2003, 155, 319–326. [Google Scholar] [CrossRef] [Green Version]
  33. Wang, Z.; Wang, H.; Cates, M.E. Effective elastic properties of solid clays. Geophysics 2001, 66, 428–440. [Google Scholar] [CrossRef]
  34. Tan, B.T.; Wu, S.; Anariba, F.; Wu, P. A DFT study on brittle-to-ductile transition of D022-TiAl3 using multi-doping and strain-engineered effects. J. Mater. Sci. Technol. 2020, 51, 180–192. [Google Scholar] [CrossRef]
  35. Tian, Y.; Xu, B.; Zhao, Z. Microscopic theory of hardness and design of novel superhard crystals. Int. J. Refract. Met. Hard Mater. 2012, 33, 93–106. [Google Scholar] [CrossRef]
  36. Gaillac, R.; Pullumbi, P.; Coudert, F.-X. ELATE: An open-source online application for analysis and visualization of elastic tensors. J. Phys. Condens. Matter 2016, 28, 275201. [Google Scholar] [CrossRef]
Figure 1. Shows ball-and-stick figures using Vesta [18] for (a) kaolinite, (b) muscovite, and (c) montmorillonite. The color used to represent the elements are shown in the top left corner.
Crystals 11 00618 g001
Figure 2. Shows band structures for (a) kaolinite, (b) muscovite, and (c) montmorillonite. Muscovite and MMT show a direct bandgap, whereas kaolinite shows an indirect bandgap.
Crystals 11 00618 g002
Figure 3. TDOS and PDOS of three clay mineral crystals for (a) kaolinite, (b) muscovite, and (c) montmorillonite.
Crystals 11 00618 g003
Figure 4. BO vs. BL of three clay mineral crystals for (a) kaolinite, (b) muscovite, and (c) montmorillonite.
Crystals 11 00618 g004
Figure 5. Distribution of partial charge ΔQ* for (a) kaolinite, (b) muscovite, and (c) montmorillonite.
Crystals 11 00618 g005
Figure 6. Optical dielectric function for the crystals from (a) kaolinite, (b) muscovite, and (c) montmorillonite. The black curve is for the real part (ε1); the red curve is for the imaginary part (ε2). (df) show the energy-loss function for kaolinite, muscovite, and montmorillonite, respectively.
Crystals 11 00618 g006
Figure 7. A 3D representation surfaces of Young’s modulus for (a) kaolinite, (b) muscovite, and (c) montmorillonite. (df) show the shear modulus for kaolinite, muscovite, and montmorillonite crystals, respectively. Green: minimum positive, translucent blue: maximum positive [36].
Crystals 11 00618 g007
Table 1. The optimized lattice parameter, number of atoms, and space group of kaolinite, muscovite, and montmorillonite.
CrystalChemical FormulaNo. Atoms
(Space Group)
a, b, c (Å)
α, β, γ
KaoliniteAl2Si2O5(OH)417 (P1)5.19, 5.18, 7.54
77.84°, 84.31°, 60.10°
a. 5.15, 5.15, 7.41
75.14°, 84.12°, 60.18°
Muscovite8[KAl2(Si3AlO10)(OH)2]168 (C12/c1)10.47, 9.10, 20.68
90°, 96.20°, 90°
b. 5.19, 9.00 20.10
90°, 95.18°, 90°
MMT2[Al2Si4O10(OH)2]40 (C121)5.21, 9.06, 10.27
90°, 99.46°, 90°
c. 5.18, 8.97, 10.07
90°, 99.50°, 90°
Unoptimized lattice parameters of a. kaolinite [15], b. muscovite [16], c. montmorillonite [17].
Table 2. TBOD and PBOD for kaolinite, muscovite, and MMT.
CrystalVol (Å3)BondPBOD
(Electron/Å3)
TBOTBOD
Kaolinite171.91O-H0.0075.4460.032
Si-O0.013
Al-O0.012
Muscovite1957.66O-H0.00357.0960.031
Si-O0.015
Al-O0.013
O-K0.001
Al-H0.000
MMT478.36O-H0.00314.2730.030
Si-O0.019
Al-O0.008
Table 3. The calculated bulk modulus (K), shear modulus (G), Young’s modulus (E), Poisson’s ratio (η), Pugh’s modulus ratio (k = G/K), and Vicker’s hardness (HV) in GPa for kaolinite, muscovite, and MMT.
CrystalK(GPa)G(GPa)E(GPa)ηG/KHV(GPa)
Kaolinite46.9331.8377.880.22350.67826.853
Muscovite53.4738.2492.640.21120.71528.293
MMT31.8523.7457.0490.20150.74536.198
Table 4. Values of density and sound velocities V L and V T .
Crystal ρ   ( g / c m 3 ) V L   ( m / s ) V T   ( m / s )
Kaolinite2.5858853512
Muscovite2.7162083756
MMT2.7647972933
Publisher’s Note: MDPI stays neutral with regard to jurisdictional claims in published maps and institutional affiliations.