Article

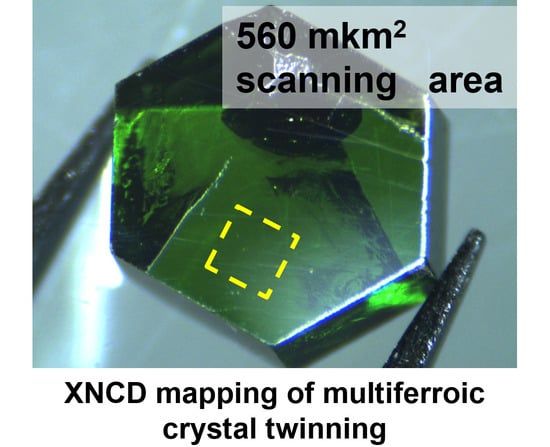
X-ray Natural Circular Dichroism Imaging of Multiferroic Crystals

by
Mikhail S. Platunov
1,*,
Irina A. Gudim
1,
Elena N. Ovchinnikova
2,
Ksenia A. Kozlovskaya
2,
Fabrice Wilhelm
3,
Andrei Rogalev
3,
Amir Hen
4,
Vsevolod Y. Ivanov
5,
Alexander A. Mukhin
5 and
Vladimir E. Dmitrienko
6
1
Kirensky Institute of Physics, Federal Research Center KSC SB RAS, 660036 Krasnoyarsk, Russia
2
Faculty of Physics, M. V. Lomonosov Moscow State University, 119991 Moscow, Russia
3
ESRF-The European Synchrotron, CS 40220, CEDEX 9, 38043 Grenoble, France
4
Department of Applied Physics, Rachel and Selim School of Engineering, The Hebrew University of Jerusalem, Jerusalem 9190401, Israel
5
Prokhorov General Physics Institute of the Russian Academy of Sciences, 119991 Moscow, Russia
6
A. V. Shubnikov Institute of Crystallography, FSRC “Crystallography and Photonics” RAS, 119333 Moscow, Russia
*
Author to whom correspondence should be addressed.
Crystals 2021, 11(5), 531; https://doi.org/10.3390/cryst11050531
Submission received: 16 April 2021 / Revised: 2 May 2021 / Accepted: 4 May 2021 / Published: 11 May 2021

Abstract

:
The polarizing spectroscopy techniques in visible range optics have been used since the beginning of the 20th century to study the anisotropy of crystals based on birefringence and optical activity phenomena. On the other hand, the phenomenon of X-ray optical activity has been demonstrated only relatively recently. It is a selective probe for the element-specific properties of individual atoms in non-centrosymmetric materials. We report the X-ray Natural Circular Dichroism (XNCD) imaging technique which enables spatially resolved mapping of X-ray optical activity in non-centrosymmetric materials. As an example, we present the results of combining micro-focusing X-ray optics with circularly polarized hard X-rays to make a map of enantiomorphous twinning in a multiferroic SmFe 3 (BO 3 ) 4 crystal. Our results demonstrate the utility and potential of polarization-contrast imaging with XNCD as a sensitive technique for multiferroic crystals where the local enantiomorphous properties are especially important. In perspective, this brings a novel high-performance method for the characterization of structural changes associated with phase transitions and identification of the size and spatial distribution of twin domains.
PACS:
11.30.Rd; 33.55.Ad; 71.15.Cr; 75.70.Kw; 78.20.Ek; 78.70.Dm

Graphical Abstract

1. Introduction

Multiferroics [1,2,3,4,5,6,7,8] are a family of materials exhibiting low writing power of ferroelectric information and a non-volatile reading of magnetic information, which makes them suitable for new memory-device applications. For this to be realized, the electric polarization and magnetization have to be linked via the magnetoelectric effect. This magnetoelectric coupling is always accompanied by the formation of domains and their interactions. Hence, to understand how to engineer future devices, one must first understand the interactions and formation of domains. Nowadays, some experimental techniques allow to investigate the structural anisotropy and visualize the domains of functional materials: natural optical activity and circular dichroism [9,10,11,12,13,14,15,16,17,18,19], X-ray birefringence [20], X-ray white beam topography [21], resonant X-ray diffraction [22], even atomic-level resolution is readily available with transmission electron microscopy [23]. However, these approaches have significant restrictions and require a substantial time investment for data collection and treatment. Meanwhile, these techniques are not always applicable to visualize directly enantiomorphous twinning [24], which is often manifested in a structure formed by alternating enantiomeric domains (a pair of opposite-handed shapes).
In turn, X-ray diffraction (XRD) measurements used in most cases can only provide a method to determine the absolute configuration of crystals [25]. As for enantiopurity, respective fractions of enantiomers are usually evaluated by examining the Flack [26] or Hooft [27] parameters. However, in this case, the size of a crystal is strongly restricted by sample size, generally between 50–250 microns in size, not more. Furthermore, it is impossible to determine the chirality-domain distribution on a large crystal surface through XRD. As a result, these studies are often difficult to apply to macroscopic measurements used to analyze functional materials.
Here we report the results of combining micro-focusing X-ray optics with circularly polarized hard X-rays to map an enantiomorphous twinning in a multiferroic SmFe 3 (BO 3 ) 4 crystal using the Fe K-edge X-ray Natural Circular Dichroism (XNCD) [28] (Figure 1). The twins in this multiferroic crystal of rare-earth borate exist in two forms, either left- and right-handed, so the electric polarization and magneto-electric coupling are either positive or negative. The sign of the XNCD signal depends on the sample’s crystallographic chirality, and the signal may vanish for a perfect racemic mixture. However, whenever the twins’ size is larger than the X-ray beam size, one could perform imaging of the twins using XNCD by scanning across the sample surface. Among the benefits of this experimental set-up, the X-ray optical activity of the material can also be mapped in a spatially resolved manner, with a resolution of the order of a few tens of microns.

2. Results and Discussions

Rare-earth ferroborates RFe 3 (BO 3 ) 4 belong to a new family of multiferroics [30,31] possessing non-centrosymmetric trigonal (R32 or, at low temperatures, P3 1 ( 2 ) 21) crystal structure and exhibiting interesting magnetic, magnetoelectric, optical, etc. properties and phase transitions [31,32,33,34,35,36,37,38,39]. A crucial point is the need to clarify the mechanisms of the magnetoelectric interactions and the strong dependence of the electric polarization on the rare-earth ions [34,40]. Surprisingly, it has been observed that even for the same R-ions (Ho [40], Sm [41]) but different crystals from the same synthesis, the magnetic field-induced polarization can be very different. In some cases, the magnetoelectric difference could be as large as an order of magnitude. Previously, this difference was tentatively attributed to the existence of twinning in the crystal, i.e., the polarization should depend on the difference of the left-handed and right-handed twins with opposing polarities.
In this research, Sm ferroborate was used. This compound is well-characterized by magnetic and spectroscopic techniques [38,42,43], and it is known for having a giant magnetoelectric effect [39,41,44]. As mentioned before, at the macroscopic scale, magnetoelectric measurements exhibited disagreement with each other regarding the maximum magnetoelectric polarization values. Some repeated measurements of the same crystals show different polarization temperature dependencies [41]. From the perspective of this study, it is really important that SmFe 3 (BO 3 ) 4 does not undergo any structural phase transitions: the space group R32 [30,45,46] remains unchanged down to 2 K [38,42,43,47].
In Figure 2, the view of left-handed and right-handed structures of SmFe 3 (BO 3 ) 4 is shown. The left enantiomer is the mirror image of the right one, and it belongs to the same space group. An interesting structural feature is the presence of helicoidal chains rotating left and right formed by edge-shared FeO 6 octahedra, which propagate along the trigonal c-axis (third-order) [22]. The distance between Fe 3 + ions along these chains is significantly shorter than the distance between neighboring chains. In the unit cell, there are chains that are interconnected by SmO 6 triangular prisms and by equilateral triangles of BO 3 forming a unified three-dimensional structure. All Sm 3 + ions occupy only the position with the point symmetry group D 3 and are surrounded by six O 2 ions, which form a trigonal prism with the three-fold symmetry axis parallel to the crystallographic c-axis.
To show how the existence of twins in the crystal strongly affects the electric polarization, we have performed the magnetoelectric polarization measurements on the same sample. Figure 3 shows the magnetic-field dependencies of the electric polarization along the crystallographic a-axis. The magnetic field was applied both along the a- and b * -axes in SmFe 3 (BO 3 ) 4 a-cut plate. The observed change of the electric polarization is due to the field-induced rotation of the Fe antiferromagnetic moment L in the easy ab * -plane perpendicular to the field P x ∼ (L x 2 – L y 2 ) [38,39]. The dramatic decrease of the field-induced polarization for the total area (∼12 mm 2 ) compare with the small point contact (∼1 mm 2 ) could only be explained by the twin structure of the crystal. The electric polarization is practically compensated for the total area, while it becomes uncompensated for the small area. However, its value remains four times less than the polarization in the practically twin-free sample shown in the inset to Figure 3.
Unfortunately, there are no systematic studies of the twin structure in rare-earth ferroborates, in particular, SmFe 3 (BO 3 ) 4 . However, some X-ray structural investigations, for GdFe 3 (BO 3 ) 4 [48] and for Ho 0.5 Nd 0.5 Fe 3 (BO 3 ) 4 [40], reveal the almost equal amount of the twins (Flack parameter is about 0.5). A similar value was found for the SmFe 3 (BO 3 ) 4 sample. The fact that the small value of the electric polarization that sometimes observed in systems where the magnetoelectric effect is allowed by symmetry does not necessarily mean that the magnetoelectric coupling is weak. So the study of the real twin structure and its imaging is very important aspect of research on multiferroics.
To demonstrate this synchrotron-based technique, we used the newly developed XNCD microprobe to image twin domains in a multiferroic SmFe 3 (BO 3 ) 4 crystal at the Fe K-edge. For the sake of completeness, the XNCD spectra need to be recorded at the L 2 , 3 edges of the the rare-earth ion too. However, due to experimental time constrains and beam availability, we focused only on the Fe K-edge. Since the signal at the iron K-edge is stronger, due to the hybridization of the 3d orbitals, the experimental signal for the 3d elements is greatly enhanced close to the K-absorption edges.
The phenomenon of X-ray optical activity using XNCD has been demonstrated only recently [49,50,51,52,53,54,55,56,57,58] and has several advantages. The XNCD effect is defined as a difference in absorption cross-sections for right σ + ( ω ) and left σ ( ω ) circularly polarized X-ray beams and can only be observed in non-centrosymmetric crystals [50,58]. XNCD is a structural effect, and the handedness of the screw axis is simply examined by comparing an XNCD sign obtained with left- and right-handed circularly polarized incident X-rays [59]. An important advantage of working in the so called hard X-rays energy range is their relatively high penetration power, allowing real bulk measurements of samples. This is especially promising for samples with a variety of twin domains [60]. In addition, a general advantage of using X-rays based technique is the ability to probe element-specific properties.
The measurements have been performed at room temperature with various sizes of the X-ray beam from 300 microns down to a few tens of micron size. From these measurements, we have optimized the size of the X-ray beam for the dichroic imaging experiment. In the experimental implementation of our XNCD mapping concept, circularly polarized X-rays from a helical undulator insertion device were monochromatized to photon energy near the Fe K-edge in the c-axis direction of the single crystal. As illustrated in Figure 1, the beryllium X-ray compound refractive lenses [29,61] used to focus the monochromaized X-rays down to a few tens of microns at the sample position. The beam spot size was restricted to 55(h) × 43(w) μ m 2 . The measurement procedure is described in the Materials and Methods (Section 4) in detail.
X-ray absorption near edge structure (XANES) and XNCD spectra obtained for different enantiomers of the SmFe 3 (BO 3 ) 4 crystal are presented in Figure 4. As we can see, the Fe K-edge XNCD spectra show clear and detectable opposite differences along the trigonal c-axis. It is expected that a racemic domain of crystal will give no XNCD signal. This was observed when a sample was scanned under a large beam of 300 microns, as shown in Figure 4. The most noticeable feature of the spectrum is the spectacular amplitude of XNCD at the 1s-3d transitions located in the Fe K pre-edge. The Fe 3 + ion is known to have a well-resolved pre-edge 1s–3d feature, which is an electric quadrupole allowed K-edge absorption, so it was expected that the pre-edge transition would show a reasonably strong circular dichroism. Moreover, the nature of XNCD at the K pre-edge is nicely illustrated by the inverted sign of XNCD spectra at 7115.25 eV obtained when the beam position is changed from one enantiopure single domain to another.
The XNCD sign should a priori be correlated with the absolute configuration of chiral structures via either the E1:E2 interference term or the E1:M1 contribution if the latter is measurable [55,56,57]. Such a contribution of XNCD has, for example, been measured at the Ni K-edge in α -NiSO 4 ×2H 2 O [55] and reaches 3 × 10 5 of the absorption edge jump. Besides, XNCD in the inorganic non-centrosymmetric LiIO 3 crystal was measured [49], and it was also attributed to the interference of electric dipole – electric quadrupole transitions [49,56]. As an addition, we can evaluate the Kuhn dissymmetry factor [57], g = ( Δ A/A), which is equal to ∼20% and satisfactorily explained by the E1:E2 mechanism. To better understand the observed XNCD signal, we performed a theoretical analysis of the XNCD features at the 1s–3d transitions. Numerical calculations of the absorption energy spectra and circular dichroism have been performed using the finite difference method realized in the program FDMNES [62,63]. Comparison of experimental and calculated spectra is shown in Figure 5. The calculations did not reveal any significant E1:M1 contribution to the dichroism spectra, which confirms the assumption that the circular dichroism in this structure is only due to the contribution E1:E2.
After setting the beam energy to the found XNCD maximum at 7115.25 eV, the circularly polarized microprobe was used to image the twinning in the SmFe 3 (BO 3 ) 4 crystal. The sample was scanned perpendicular to the beam. Test spatial XNCD scans have been performed to find areas of twinning. Then we continuously measured the surface of SmFe 3 (BO 3 ) 4 by scanning the sample in 20 μ m steps over 560 × 560 μ m 2 . When the beam position is changed, the amplitude of XNCD main peak decreases and then increases back with an opposite sign for another domain. These differences in the measured signal can be attributed to changes which are associated with a change in the twinning areas. In Figure 6, the blue-tinged area corresponds to XNCD domains having one direction of the screw axis. The domain having the opposite handedness of the screw axis is shown as the red-tinged area. We note the crystal provides high-quality twin domain images. Since each chiral domain gives a positive or negative XNCD value, an intermediate XNCD value means the existence of multiple domains within the beam spot. We can conclude that the typical domain size seems to be much larger than the beam spot size. The chirality-domain distribution shows that the typical domain size is several hundreds of microns. We can expect an alternation of twin domains along the trigonal c-axis direction, and, in principle, it is possible to analyze a twin domain depth for further understanding of chirality-domain morphology. The experimentally determined twin domains’ depth of enantiopurity at our photon energy is approximately 5 μ m in fluorescence-yield mode. In our case, since the XNCD keeps a constant value meaning while within the same domain, the sign reversal of XNCD is a direct consequence of interchange of the dominant enantiomer within the penetration depth. In perspective, a change of the photon energy could enable us to analyze the twin domains’ depth profile of enantiopurity as well. So the two-dimensional XNCD image of the chirality-domain distribution of the SmFe 3 (BO 3 ) 4 surface revealed a chirality-domain boundary, which is preferentially formed along the trigonal c-axis, and the typical domain is more than 5 microns thick with the size of several hundreds of microns in the lateral direction. The observed domain morphology could be quite essential to understand the competition between enantiomers and clarify specific features of enantiopure crystal growth and its control.
Attention is drawn to the shape and location of the chiral domains in the scanned area. The first interesting observation is the large domain prolonged along the (110) crystal plane confirmed by Laue diffraction. In Figure 6, the black line shows the angle of 120 inherent three-fold rotation in the R32 space group. It is observed that the angle between the large and small domains, which is in the upper left corner, is about 90 .
It is known that crystal twins are regular aggregates consisting of separate crystallites of the same composition, connected in some specific mutual orientation [64]. The symmetry elements responsible for the existence of crystallographic twins are inversion centers and screw axes. As each lattice is centrosymmetric, an inversion twin is necessarily a twin by merohedry, i.e., when its twin operation belongs to the point group of its vector lattice. So, merohedral twins have a twinning symmetry element that is not a symmetry element of the space group of the sample but is a symmetry element of the Laue group. For example, the merohedral twins themselves are divided into racemic and others. The racemic twinning is a special case of merohedral twinning, where the twinning operator does not belong to the point group of the crystal but belongs to the Laue class. For racemic twinning, the twin operator (that is the twin law) is inversion. Other merohedral twins are those where the twinning operator belongs to the crystal class but does not belong to the Laue group. Such twins are possible only in trigonal, tetragonal, hexagonal, and cubic systems, in which there is more than one Laue class. For trigonal crystals, there is more than one possible twin law [65]. Thus, it turns out that merohedral twinning is associated with an element of symmetry but not inherent in the symmetry of the crystal. It can occur when there is an inversion center. In our case, there is no inversion center. But the point is that the lattice is always centrosymmetric, as we mentioned above. It happens that atoms can line up in such a way that the center of inversion appears during growth. There is a case of non-merohedral twinning, where generally the twin symmetry element is not a symmetry element of the Laue group (twin law is relatively arbitrary, often a two-fold rotation). The twin law does not belong to a crystal system or metric symmetry or anything. It is just two identical crystals (not necessarily of identical size) morphed into one. In studies using XRD, non-merohedral twins have two or more crystalline domains with reciprocal lattices that either do not overlap or only partially overlapped. In contrast, merohedral twins have domains with diffraction patterns that are completely overlapped.
Two options are possible that can explain the possible position of the twins. This is a merohedral type of twinning when there is a lattice with an inversion center between the twins. And the non-merohedral option is when, during the growth process, the twin is embedded in the crystal, through a crack, for example.
Let us apply the above definitions to the case of SmFe 3 (BO 3 ) 4 . The point symmetry group of the SmFe 3 (BO 3 ) 4 is 32, with a rhombohedral space group. The stereographic projection of this group is characterized by a three-fold axis and three two-fold axes. The point symmetry group associated with the SmFe 3 (BO 3 ) 4 lattice is 3 ¯ m . The stereographic projection of the point group 3 ¯ m is characterized by the presence of mirrors perpendicular to the two-fold axes, additional to the 32 group. So the 32 is a subgroup of 3 ¯ m : the SmFe 3 (BO 3 ) 4 is, therefore, a merohedral crystal, more precisely hemihedral. This allows us to consider the presence of twins by merohedry. The interpretation of this twin is as follows: in merohedral twins, the crystal system is transformed by one or more operations of symmetry that the crystal does not have but the lattice has. In our case, the symmetry operation is necessarily an index mirror { 110 } ( { 110 } = (110), (2 1 ¯ 0), (1 2 ¯ 0)). The lattice remains perfectly unchanged throughout the extent of the crystal, but the crystal structure is arranged differently depending on the domains on either side of the mirror of the twin considered.
This observation can help to explain the location of the 90 -domain. These are essentially twins by merohedry [64,66] characterized by { 110 } indexing twin planes. Moreover, for the space group of SmFe 3 (BO 3 ) 4 , twin law can generates twinning by merohedry that is not readily detected by conventional XRD techniques. In general, we consider that during crystal growth, twinning can arise due to external factors, such as a sharp change in the temperature distribution near the crystal/melt interface, random fluctuations in the growth temperature, growth rate, etc. Understanding the influence of external factors on the twinning process is an essential step towards the controlled growth of twinned domains.

3. Conclusions

In conclusion, the new polarization-contrast imaging technique to study the twinning in non-centrosymmetric materials was proposed. The experimental set-up allows X-ray Natural Circular Dichroism measurements to be carried out in a spatially resolved imaging mode, using a circularly-polarised incident X-ray beam with compound X-ray refractive lenses, Si detector, and precision mechanics based on stepping motors. Besides, the technique offers particular opportunities in cases for which the application of X-ray diffraction techniques is not feasible (e.g., multiply twinned crystals or other materials with complex domain structures).
With this set-up, the X-ray optical activity of the multiferroic SmFe 3 (BO 3 ) 4 single crystal has been mapped with a resolution of the order of a few tens of microns. It was revealed that the twinning in the sample might show signs of either internal merohedral or non-merohedral twinning. The results also reveal the potential to exploit XNCD imaging for spatially resolved analysis of orientationally distinct domains, yielding information on domain sizes, the orientational relationships between domains, and even the nature of domain boundaries. We are confident that XNCD mapping can be a powerful tool for improving the quality of materials with non-centrosymmetric structures, which can later be used for applications. Besides, it will help understand the mechanism of magnetoelectric coupling in various rare-earth ferroborates and could be readily extended to other multiferroic crystals. Although our mapping results demonstrated for a single-crystal sample, there is no requirement for crystallinity as XNCD is sensitive specifically to internal atomic transition, so the described technique can be applied to any material, including liquids or amorphous solids.

4. Materials and Methods

4.1. Synthesis and Macroscopic Characterization

Group method was used to grow samarium ferroborate SmFe 3 (BO 3 ) 4 single crystals using bismuth molybdate, i.e., 80 wt. % (Bi 2 Mo 3 O 12 + 2B 2 O 3 + 0.6Sm 2 O 3 ) + 20 wt. % SmFe 3 (BO 3 ) 4 [41,42,47]. The temperature of this molten solution saturation was determined using probe crystals. It was 960 C. At T = 1050 C, a ring carrier with seed crystals was suspended above the molten solution. The furnace temperature was then decreased to the saturation temperature T = Tsat + 10 C = 970 C, at which the carrier with the seed crystals was immersed in the molten solution and was then rotated at 30 rpm. After 15 min, the temperature was decreased to T = Tsat − 7 C = 953 C. Further, the crystals were grown during a computer-assisted decrease in the temperature at an increasing rate of 1–3 C/day, which ensured a crystal growth rate of at most 1 mm/day. The grown single crystals were 5 × 4 × 3 mm 3 in size and had good optical quality and natural faceting.
Subsequent X-ray diffraction experiments have been performed on high-quality SmFe 3 (BO 3 ) 4 single crystals whose structural properties were in complete agreement with the works of previous authors [41,42,47]. The crystal structure of SmFe 3 (BO 3 ) 4 at room temperature was checked using the SMART APEX II diffractometer (Bruker). All structure parameters were the same as described [41,42,47].
The magnetoelectric polarization measurements of SmFe 3 (BO 3 ) 4 sample were performed using the electric contacts (silver paste) both for the total surface of the plate (∼12 mm 2 ) and the small (point) area (∼1 mm 2 ) on the surface of the same crystal.

4.2. X-Ray Spectroscopy and Mapping Technique

The XNCD microprobe was setup at the ID12 beamline at the European Synchrotron Radiation Facility (ESRF), Grenoble, France. Figure 1 shows the setup schematically. For experiments at the Fe K-edge, the source of circularly polarized X-rays was the helical undulator of APPLE-II type ( λ U = 38 mm), the fundamental harmonic of which covers the energy range 5.0–8.9 keV. The X-ray beam has been monochromazed using a fixed-exit double-crystal monochromator equipped with a pair of Si(111) crystals cooled down to 133 K. The beam was incident on the Be compound refractive lenses (CRL). CRLs have become very popular due to their reliability, compactness and ease of use accompanied by excellent focusing and imaging performance [61]. CRLs were manufactured by RXOPTICS (https://www.rxoptics.de (access date: 16 April 2021)). The CRL lenses were mounted on a three-axis motorized stage to allow for linear alignment relative to the sample. The alignment of the CRL lenses and the sample with respect to each other and the X-ray beam was done using a combination of X-ray alignment techniques. Next, the focus of the micro-focusing optics had to be positioned on the center of the sample. This was done by placing a Fe knife edge on the sample center using the signal of the Fe K-edge absorption step. This was done for two perpendicular orientations of the knife-edge to ensure the two-dimensional alignment of the micro-focusing setup. Motion along the X-ray beam allows one to correct easily for chromatic aberrations to keep the spatial resolution within the order of a few tens of microns. The beam spot size was restricted to 55(h) × 43(w) μ m 2 .
A sample for the synchrotron experiment was cut perpendicular to the trigonal c-axis in the form of a hexagonal plate with a thickness of 1 mm and an area of ∼4 mm 2 ; then it was optically polished. The angle of incidence of the beam was nearly perpendicular to the sample surface. All XANES spectra were recorded in the total fluorescence yield detection mode using a backscattering geometry. We have used the Si photodiode detector, which was mounted in such a way as to get a very large solid angle of detection. All measurements were done at room temperature.
The X-ray absorption spectra were obtained as the average of spectra with right and left circularly polarized X-rays and were then normalized to zero before the absorption edge and to unity above the edge. XNCD spectra were obtained as the direct difference of normalized X-ray absorption spectra measured with opposite photon helicities. For the sake of simplicity, the trigonal c-axis was set collinear to the direction of the exciting X-ray beam in order to get rid of undesirable X-ray birefringence and X-ray linear dichroism effects.
The XNCD mapping was done by keeping the photon energy fixed corresponding to the maximum of the dichroic signal and scanning the sample holder in the X-Y plane. The scan steps in the vertical and in the horizontal planes were about the same as the X-ray beam size. The XNCD signal was calculated by the difference between the signals for the two circular polarizations. No normalization was performed since it would have required two further measurements (at energies before the pre-edge and well above the edge) that could not be performed for lack of time.

4.3. XNCD Effect Description

XNCD is usually determined as a difference of the cross-sections for right σ + ( ω ) and left σ ( ω ) circularly polarized X-ray beams:
Δ σ X N C D ( ω ) = σ + ( ω ) σ ( ω )
If we choose the η -axis along the X-ray beam direction (kr = k η r η ), to avoid birefringence and linear dichroism, the XNCD signal at the microscopic level is equal to:
Δ σ α β X N C D ( ω ) = 4 π 2 α ω k η c ( a r α c c r β r η a a r α r η c c r β a ) δ E E a ω
For XNCD near K-edges, a is a wave function of the s-th electron, c is associated with the empty p-d mixed state above the Fermi level [56,57,58,67,68,69]. The sum in (3) transforms like a third rank tensor antisymmetric with respect to the interchange of the two first subscripts, similarly to the gyration tensor in visible optics. The optical analogy allows considering XNCD in terms of gyration third rank tensor γ α β η or gyrotropy second rank pseudotensor G α β . The classification of optical activity phenomena usually uses a tensor G α β decomposition into irreducible parts: the pseudoscalar, vector, and pseudo-deviator. In visible optics optical activity phenomena are determined by the E1:M1 pseudoscalar part, but in the X-ray range optical activity arises mainly from the E1:E2 pseudodeviator.
While in optical region gyration tensor γ α β η describes the macroscopic properties of crystals, the tensor in (3) describes a transition between the atomic levels. We can introduce a third rank tensor γ α β η s corresponding to s-th non-equivalent absorbing atom in a unit cell, so γ α β γ may be represented as a sum over all resonant atoms in a unit cell, hence
Δ σ α β X N C D ( ω ) k γ γ α β η = k γ s γ α β η s
where γ α β η and γ α β η s are the imaginary parts of the third rank tensors. γ α β η s is invariant under the symmetry operation of a point group G describing the site symmetry of the atomic position [70]. The space symmetry of SmFe 3 (BO 3 ) 4 is described by the R32 group, where the atoms occupy the following Wyckoff positions: Sm—1(a), Fe—9(d), B—3(b) and 9(e), O—two position 9(e) and 18(f). There are 9 iron atoms in a unit cell, which can be subdivided to three groups of atoms (x, 0, 0), (0, x,0), (–x, –x, 0) connected by the translations (0, 0, 0), ((2/3, 1/3, 1/3), (1/3, 2/3, 2/3). Translations shift the atoms but do not influence the atomic tensors γ α β η s . Therefore there are only three different tensors γ α β η s , corresponding to the atoms connected by the three-fold axis. In general, a third rank tensor contains 27 components. Among them, 9 components γ α α η s are zero. Remaining 18 components are the pairwise opposite. Therefore only 9 components are independent and can be written as a matrix. Each Fe atom lies on the two-fold axis, so its site symmetry 2 restricts several different from zero tensor components. Hence there are only 5 independent components in the tensor γ α β η 1 . If we choose a two-fold axis along the b-crystal axis, the gyration tensor for one Fe atom can be represented as follows:
γ α β λ 1 = γ y z x 0 γ y z z 0 γ z x y 0 γ x y x 0 γ x y z
The tensor components of two other atoms in the group are related to the components described by (5) by the three-fold rotation around the c-axis of the crystal. In the orthogonal basis, their coordinates are transformed as r = Tr, r = T 2 r where T is the rotation matrix
T = 1 / 2 3 / 2 0 3 / 2 1 / 2 0 0 0 1
The gyration tensors for these two atoms have the following forms
γ α β η 2 = 1 4 3 γ z x y + γ y z x 3 4 ( γ z x y γ y z x ) 1 2 γ y z z 3 4 ( γ z x y γ y z x ) 1 4 γ z x y + 3 γ y z x 3 2 γ y z z 1 2 γ x y x 3 2 γ x y x γ x y z 3 f
γ α β η 3 = 1 4 3 γ z x y + γ y z x 3 4 ( γ z x y γ y z x ) 1 2 γ y z z 3 4 ( γ z x y γ y z x ) 1 4 γ z x y + 3 γ y z x 3 2 γ y z z 1 2 γ x y x 3 2 γ x y x γ x y z 3 f
The total gyration tensor corresponding to the position 9(e) is the sum of the gyration tensors of each iron atom
γ α β η 9 e = 3 ( γ α β η 1 + γ α β η 2 + γ a l p h a β η 3 ) = = 9 1 2 γ z x y + γ y z x 0 0 0 1 2 γ z x y + γ y z x 0 0 0 γ x y z
Two enantiomers are related by the improper symmetry operations: mirror plane or inversion center. These operations convert the right-handed coordinate system to the left-handed. So, a pseudodeviator part of the gyrotropy tensor or associated with it third-rank gyration tensor γ x y z have opposite signs for two enantiomorphic crystals. If one chooses the z-axis (optical axis of the crystal) collinear with X-ray wavevector (kr = kz), the XNCD cross-section (3) due to E1:E2 transitions is determined only by the γ x y z tensor component:
Δ σ X N C D | | ( r i g h t ) = Δ σ X N C D | | ( l e f t ) k z c a x c c y z a a z x c c y a = k z γ x y z
Neglecting the pseudo-scalar E1:M1 contributions, we have additional symmetry restriction of the components of the gyration tensor, i.e., γ y z x + γ y z x + γ x y z = 0 or γ x y z = 2 γ y z x .
For uniaxial crystals, there is the following angular dependence of the XNCD spectra: 3cos 2 θ –1 [56], where θ is an angle between the X-ray propagation direction and the optical axis of the crystal.

Author Contributions

Idea of the studies: A.R., I.A.G., A.A.M.; experiment: M.S.P., I.A.G., K.A.K., A.H., F.W., A.R., V.E.D., E.N.O., V.Y.I.; writing—original draft preparation, M.S.P.; writing—review and editing, I.A.G., K.A.K., V.E.D., E.N.O., A.A.M., V.Y.I., F.W., A.H., A.R.; visualization, M.S.P., K.A.K. All authors have read and agreed to the published version of the manuscript.

Funding

This research was funded by the Russian Science Foundation (grant 19-72-00002). K.A.K. acknowledges support from the Russian Foundation for Basic Research (project no. 19-52-12029 and project no. 19-02-00483). V.E.D. was partly supported by the Ministry of Science and Higher Education of the Russian Federation within the State assignment FSRC “Crystallography and Photonics” RAS. V.Y.I. and A.A.M. were supported by the Russian Science Foundation [grant 16-12-10531].

Institutional Review Board Statement

Not applicable.

Informed Consent Statement

Not applicable.

Data Availability Statement

Experimental data is available upon reasonable request to the authors.

Acknowledgments

This research used the ID12 beamline of the European Synchrotron Radiation Facility. The authors are very grateful to P. Voisin (ESRF) for his assistance during the experiment. M.S.P. acknowledges support from the Russian Science Foundation [grant 19-72-00002]. K.A.K. acknowledges support from the Russian Foundation for Basic Research (project no. 19-52-12029 and project no. 19-02-00483). V.E.D. was partly supported by the Ministry of Science and Higher Education of the Russian Federation within the State assignment FSRC “Crystallography and Photonics” RAS. V.Y.I. and A.A.M. were supported by the Russian Science Foundation [grant 16-12-10531]. The authors acknowledge M. Molokeev (Kirensky Institute of Physics) for fruitful discussions.

Conflicts of Interest

The authors declare no conflict of interest.

References

  1. Spaldin, N.A.; Fiebig, M. The renaissance of magnetoelectric multiferroics. Science 2005, 309, 391–392. [Google Scholar] [CrossRef]
  2. Eerenstein, W.; Mathur, N.; Scott, J.F. Multiferroic and magnetoelectric materials. Nature 2006, 442, 759–765. [Google Scholar] [CrossRef] [PubMed]
  3. Zhai, K.; Shang, D.S.; Chai, Y.S.; Li, G.; Cai, J.W.; Shen, B.G.; Sun, Y. Room-Temperature Nonvolatile Memory Based on a Single-Phase Multiferroic Hexaferrite. Adv. Funct. Mater. 2018, 28, 1705771. [Google Scholar] [CrossRef]
  4. Zhuang, J.; Lu, J.; Zhang, N.; Zhang, J.; Bokov, A.A.; Yang, S.; Ren, W.; Ye, Z.G. Chemically engineered multiferroic morphotropic phase boundary in BiFeO3-based single phase multiferroics. J. Appl. Phys. 2019, 125, 044102. [Google Scholar] [CrossRef] [Green Version]
  5. Wang, K.; Liu, J.M.; Ren, Z. Multiferroicity: The coupling between magnetic and polarization orders. Adv. Phys. 2009, 58, 321–448. [Google Scholar] [CrossRef]
  6. Hur, N.; Park, S.; Sharma, P.; Ahn, J.; Guha, S.; Cheong, S.W. Electric polarization reversal and memory in a multiferroic material induced by magnetic fields. Nature 2004, 429, 392–395. [Google Scholar] [CrossRef] [PubMed]
  7. Kimura, T.; Goto, T.; Shintani, H.; Ishizaka, K.; Arima, T.h.; Tokura, Y. Magnetic control of ferroelectric polarization. Nature 2003, 426, 55–58. [Google Scholar] [CrossRef]
  8. Jia, T.; Cheng, Z.; Zhao, H.; Kimura, H. Domain switching in single-phase multiferroics. Appl. Phys. Rev. 2018, 5, 021102. [Google Scholar] [CrossRef] [Green Version]
  9. Sholl, D.S.; Gellman, A.J. Developing chiral surfaces for enantioselective chemical processing. AIChE J. 2009, 55, 2484–2490. [Google Scholar] [CrossRef]
  10. Zinna, F.; Resta, C.; Gorecki, M.; Pescitelli, G.; Di Bari, L.; Javorfi, T.; Hussain, R.; Siligardi, G. Circular dichroism imaging: Mapping the local supramolecular order in thin films of chiral functional polymers. Macromolecules 2017, 50, 2054–2060. [Google Scholar] [CrossRef]
  11. Claborn, K.; Puklin-Faucher, E.; Kurimoto, M.; Kaminsky, W.; Kahr, B. Circular dichroism imaging microscopy: Application to enantiomorphous twinning in biaxial crystals of 1, 8-dihydroxyanthraquinone. J. Am. Chem. Soc. 2003, 125, 14825–14831. [Google Scholar] [CrossRef]
  12. Weissbuch, I.; Kuzmenko, I.; Vaida, M.; Zait, S.; Leiserowitz, L.; Lahav, M. Twinned Crystals of Enantiomorphous Morphology of Racemic Alanine Induced by Optically Resolved. alpha.-Amino Acids; A Stereochemical Probe for the Early Stages of Crystal Nucleation. Chem. Mater. 1994, 6, 1258–1268. [Google Scholar] [CrossRef]
  13. Ohsumi, H.; Tokuda, A.; Takeshita, S.; Takata, M.; Suzuki, M.; Kawamura, N.; Kousaka, Y.; Akimitsu, J.; Arima, T.H. Three-Dimensional Near-Surface Imaging of Chirality Domains with Circularly Polarized X-rays. Angew. Chem. Int. Ed. 2013, 52, 8718–8721. [Google Scholar] [CrossRef]
  14. Banerjee-Ghosh, K.; Dor, O.B.; Tassinari, F.; Capua, E.; Yochelis, S.; Capua, A.; Yang, S.H.; Parkin, S.S.; Sarkar, S.; Kronik, L.; et al. Separation of enantiomers by their enantiospecific interaction with achiral magnetic substrates. Science 2018, 360, 1331–1334. [Google Scholar] [CrossRef] [PubMed] [Green Version]
  15. Buchen, J.; Wesemann, V.; Dehmelt, S.; Gross, A.; Rytz, D. Twins in YAl3(BO3)4 and K2Al2B2O7 Crystals as Revealed by Changes in Optical Activity. Crystals 2019, 9, 8. [Google Scholar] [CrossRef] [Green Version]
  16. Kaminsky, W.; Claborn, K.; Kahr, B. Polarimetric imaging of crystals. Chem. Soc. Rev. 2004, 33, 514–525. [Google Scholar] [CrossRef] [PubMed]
  17. Kuroda, R.; Harada, T.; Shindo, Y. A solid-state dedicated circular dichroism spectrophotometer: Development and application. Rev. Sci. Instrum. 2001, 72, 3802–3810. [Google Scholar] [CrossRef]
  18. Hartshorne, N.H.; Stuart, A. Practical Optical Crystallography; Edward Arnold: London, UK, 1964. [Google Scholar]
  19. Yariv, A.; Yeh, P. Optical Waves in Crystals; Wiley: New York, NY, USA, 1984; Volume 5. [Google Scholar]
  20. Palmer, B.A.; Edwards-Gau, G.R.; Kariuki, B.M.; Harris, K.D.; Dolbnya, I.P.; Collins, S.P. X-ray birefringence imaging. Science 2014, 344, 1013–1016. [Google Scholar] [CrossRef]
  21. Hu, X.; Jiang, S.; Huang, X.; Liu, W.; Ge, C.; Wang, J.; Pan, H.; Ferrari, C.; Gennari, S. X-ray topographic study of twins in NdxY1−xAl3(BO3)4 crystal. Nuovo C. D 1997, 19, 175–180. [Google Scholar] [CrossRef]
  22. Usui, T.; Tanaka, Y.; Nakajima, H.; Taguchi, M.; Chainani, A.; Oura, M.; Shin, S.; Katayama, N.; Sawa, H.; Wakabayashi, Y.; et al. Observation of quadrupole helix chirality and its domain structure in DyFe3(BO3)4. Nat. Mater. 2014, 13, 611–618. [Google Scholar] [CrossRef] [PubMed]
  23. Di Gregorio, M.C.; Shimon, L.J.; Brumfeld, V.; Houben, L.; Lahav, M.; van der Boom, M.E. Emergence of chirality and structural complexity in single crystals at the molecular and morphological levels. Nat. Commun. 2020, 11, 1–9. [Google Scholar]
  24. Thomas, S.P.; Grosjean, A.; Flematti, G.R.; Karton, A.; Sobolev, A.N.; Edwards, A.J.; Piltz, R.O.; Iversen, B.B.; Koutsantonis, G.A.; Spackman, M.A. Investigation of an unusual crystal habit of hydrochlorothiazide reveals large polar enantiopure domains and a possible crystal nucleation mechanism. Angew. Chem. 2019, 131, 10361–10365. [Google Scholar] [CrossRef]
  25. Bijvoet, J.; Peerdeman, A.; Van Bommel, A. Determination of the absolute configuration of optically active compounds by means of X-rays. Nature 1951, 168, 271–272. [Google Scholar] [CrossRef]
  26. Flack, H. On enantiomorph-polarity estimation. Acta Crystallogr. Sect. Found. Crystallogr. 1983, 39, 876–881. [Google Scholar] [CrossRef]
  27. Hooft, R.W.; Straver, L.H.; Spek, A.L. Determination of absolute structure using Bayesian statistics on Bijvoet differences. J. Appl. Crystallogr. 2008, 41, 96–103. [Google Scholar] [CrossRef] [Green Version]
  28. Rogalev, A.; Goulon, J.; Wilhelm, F. X-ray detected optical activity. Comptes Rendus Phys. 2008, 9, 642–656. [Google Scholar] [CrossRef]
  29. Snigirev, A.; Kohn, V.; Snigireva, I.; Lengeler, B. A compound refractive lens for focusing high-energy X-rays. Nature 1996, 384, 49–51. [Google Scholar] [CrossRef]
  30. Hinatsu, Y.; Doi, Y.; Ito, K.; Wakeshima, M.; Alemi, A. Magnetic and calorimetric studies on rare-earth iron borates LnFe3(BO3)4 (Ln= Y, La–Nd, Sm–Ho). J. Solid State Chem. 2003, 172, 438–445. [Google Scholar] [CrossRef]
  31. Zvezdin, A.K.; Krotov, S.S.; Kadomtseva, A.M.; Vorob’ev, G.P.; Popov, Y.F.; Pyatakov, A.P.; Bezmaternykh, L.N.; Popova, E. Magnetoelectric effects in gadolinium iron borate GdFe3(BO3)4. J. Exp. Theor. Phys. Lett. 2005, 81, 272–276. [Google Scholar] [CrossRef]
  32. Zvezdin, A.K.; Vorob’ev, G.P.; Kadomtseva, A.M.; Popov, Y.F.; Pyatakov, A.P.; Bezmaternykh, L.N.; Kuvardin, A.; Popova, E. Magnetoelectric and magnetoelastic interactions in NdFe3(BO3)4 multiferroics. JETP Lett. 2006, 83, 509–514. [Google Scholar] [CrossRef]
  33. Vasil’ev, A.; Popova, E. Rare-earth ferroborates RFe3(BO3)4. Fiz. Nizk. Temp. 2006, 32, 968–984. [Google Scholar] [CrossRef]
  34. Chaudhury, R.P.; Yen, F.; Lorenz, B.; Sun, Y.; Bezmaternykh, L.N.; Temerov, V.L.; Chu, C.W. Magnetoelectric effect and spontaneous polarization in HoFe3(BO3)4 and Ho0.5Nd0.5Fe3(BO3)4. Phys. Rev. B 2009, 80, 104424. [Google Scholar] [CrossRef] [Green Version]
  35. Kadomtseva, A.; Popov, Y.F.; Vorob’ev, G.; Pyatakov, A.; Krotov, S.; Kamilov, K.; Ivanov, V.Y.; Mukhin, A.; Zvezdin, A.; Kuz’menko, A.; et al. Magnetoelectric and magnetoelastic properties of rare-earth ferroborates. Low Temp. Phys. 2010, 36, 511–521. [Google Scholar] [CrossRef]
  36. Popova, M.N. Spectroscopy of compounds from the family of rare-earth orthoborates. J. Rare Earths 2009, 27, 607–611. [Google Scholar] [CrossRef]
  37. Popova, M.; Chukalina, E.; Stanislavchuk, T.; Malkin, B.; Zakirov, A.; Antic-Fidancev, E.; Popova, E.; Bezmaternykh, L.; Temerov, V. Optical spectra, crystal-field parameters, and magnetic susceptibility of multiferroic NdFe3(BO3)4. Phys. Rev. B 2007, 75, 224435. [Google Scholar] [CrossRef] [Green Version]
  38. Popov, Y.F.; Pyatakov, A.; Kadomtseva, A.; Vorob’ev, G.; Zvezdin, A.; Mukhin, A.; Ivanov, V.Y.; Gudim, I. Peculiarities in the magnetic, magnetoelectric, and magnetoelastic properties of SmFe3(BO3)4 multiferroic. J. Exp. Theor. Phys. 2010, 111, 199–203. [Google Scholar] [CrossRef]
  39. Mukhin, A.A.; Vorob’ev, G.P.; Ivanov, V.Y.; Kadomtseva, A.M.; Narizhnaya, A.; Kuz’menko, A.; Popov, Y.F.; Bezmaternykh, L.N.; Gudim, I. Colossal magnetodielectric effect in SmFe3(BO3)4 multiferroic. JETP Lett. 2011, 93, 275–281. [Google Scholar] [CrossRef]
  40. Platunov, M.; Kazak, N.; Dudnikov, V.; Temerov, V.; Gudim, I.; Knyazev, Y.; Gavrilkin, S.; Dyadkin, V.; Dovgaliuk, I.; Chernyshov, D.; et al. Element selective magnetism in Ho0.5Nd0.5Fe3(BO3)4 single crystal probed with hard X-ray magnetic circular dichroism. J. Magn. Magn. Mater. 2019, 479, 312–316. [Google Scholar] [CrossRef]
  41. Freydman, A.; Erofeev, D.; Temerov, V.; Gudim, I. The magnetoelectric MEE-effect in the SmFe3(BO3)4 multiferroic in dc and ac electric fields. J. Appl. Phys. 2018, 124, 134101. [Google Scholar] [CrossRef]
  42. Chukalina, E.; Popova, M.; Bezmaternykh, L.; Gudim, I. Spectroscopic study of the magnetic ordering in SmFe3(BO3)4. Phys. Lett. A 2010, 374, 1790–1792. [Google Scholar] [CrossRef]
  43. Ritter, C.; Pankrats, A.; Gudim, I.; Vorotynov, A. Determination of the magnetic structure of SmFe3(BO3)4 by neutron diffraction: Comparison with other RFe3(BO3)4 iron borates. J. Phys. Condens. Matter 2012, 24, 386002. [Google Scholar] [CrossRef] [PubMed]
  44. Popov, A.; Plokhov, D.; Zvezdin, A. Quantum theory of magnetoelectricity in rare-earth multiferroics: Nd, Sm, and Eu ferroborates. Phys. Rev. B 2013, 87, 024413. [Google Scholar] [CrossRef]
  45. Campa, J.; Cascales, C.; Gutierrez-Puebla, E.; Monge, M.; Rasines, I.; Ruiz-Valero, C. Crystal structure, magnetic order, and vibrational behavior in iron rare-earth borates. Chem. Mater. 1997, 9, 237–240. [Google Scholar] [CrossRef]
  46. Kuzmenko, A.; Szaller, D.; Kain, T.; Dziom, V.; Weymann, L.; Shuvaev, A.; Pimenov, A.; Mukhin, A.; Ivanov, V.Y.; Gudim, I.; et al. Switching of magnons by electric and magnetic fields in multiferroic borates. Phys. Rev. Lett. 2018, 120, 027203. [Google Scholar] [CrossRef] [PubMed] [Green Version]
  47. Moshkina, E.; Krylov, A.; Sofronova, S.; Gudim, I.; Temerov, V. Crystal Growth and Raman Spectroscopy Study of Sm1−xLaxFe3(BO3)4 Ferroborates. Cryst. Growth Des. 2016, 16, 6915–6921. [Google Scholar] [CrossRef]
  48. Klimin, S.; Fausti, D.; Meetsma, A.; Bezmaternykh, L.; Van Loosdrecht, P.; Palstra, T. Evidence for differentiation in the iron-helicoidal chain in GdFe3(BO3)4. Acta Crystallogr. Sect. Struct. Sci. 2005, 61, 481–485. [Google Scholar] [CrossRef] [Green Version]
  49. Goulon, J.; Rogalev, A.; Gauthier, C.; Goulon-Ginet, C.; Signorato, R.; Neumann, C.; Varga, L.; Malgrange, C. Instrumentation developments for X-ray linear and circular dichroism at the ESRF beamline ID12A. J. Synchrotron Radiat. 1998, 5, 232–238. [Google Scholar] [CrossRef] [Green Version]
  50. Goulon, J.; Goulon-Ginet, C.; Rogalev, A.; Benayoun, G.; Brouder, C.; Natoli, C.R. X-ray natural circular dichroism and chiral-EXAFS in gyrotropic crystals. J. Synchrotron Radiat. 2000, 7, 182–188. [Google Scholar] [CrossRef] [Green Version]
  51. Goulon, J.; Goulon-Ginet, C.; Rogalev, A.; Gotte, V.; Malgrange, C.; Brouder, C.; Natoli, C.R. X-ray natural circular dichroism in a uniaxial gyrotropic single crystal of LiIO3. J. Chem. Phys. 1998, 108, 6394–6403. [Google Scholar] [CrossRef]
  52. Alagna, L.; Prosperi, T.; Turchini, S.; Goulon, J.; Rogalev, A.; Goulon-Ginet, C.; Natoli, C.R.; Peacock, R.D.; Stewart, B. X-ray natural circular dichroism. Phys. Rev. Lett. 1998, 80, 4799. [Google Scholar] [CrossRef]
  53. Goulon, J.; Goulon-Ginet, C.; Rogalev, A.; Gotte, V.; Malgrange, C.; Brouder, C. X-ray natural circular dichroism of gyrotropic crystals. J. Synchrotron Radiat. 1999, 6, 673–675. [Google Scholar] [CrossRef] [Green Version]
  54. Stewart, B.; Peacock, R.D.; Alagna, L.; Prosperi, T.; Turchini, S.; Goulon, J.; Rogalev, A.; Goulon-Ginet, C. Circular Dichroism at the Edge: Large X-ray Natural CD in the 1s–3d Pre-Edge Feature of 2[Co(en)3Cl3] NaCl 6H2O. J. Am. Chem. Soc. 1999, 121, 10233–10234. [Google Scholar] [CrossRef]
  55. Rogalev, A.; Goulon, J.; Wilhelm, F.; Bosak, A. X-Ray Detected Optical Activity. In Magnetism and Synchrotron Radiation; Springer: Berlin/Heisenberg, Germany, 2010; pp. 169–190. [Google Scholar]
  56. Natoli, C.; Brouder, C.; Sainctavit, P.; Goulon, J.; Goulon-Ginet, C.; Rogalev, A. Calculation of X-ray natural circular dichroism. Eur. Phys. J. Condens. Matter Complex Syst. 1998, 4, 1–11. [Google Scholar] [CrossRef]
  57. Peacock, R.D.; Stewart, B. Natural circular dichroism in X-ray spectroscopy. J. Phys. Chem. B 2001, 105, 351–360. [Google Scholar] [CrossRef]
  58. Goulon, J.; Rogalev, A.; Wilhelm, F.; Goulon-Ginet, C.; Carra, P.; Marri, I.; Brouder, C. X-ray optical activity: Applications of sum rules. J. Exp. Theor. Phys. 2003, 97, 402–431. [Google Scholar] [CrossRef]
  59. Cortijo, M.; Valentín-Pérez, Á.; Rogalev, A.; Wilhelm, F.; Sainctavit, P.; Rosa, P.; Hillard, E.A. Rapid Discrimination of Crystal Handedness by X-ray Natural Circular Dichroism (XNCD) Mapping. Chem. Eur. J. 2020, 26, 13363–13366. [Google Scholar] [CrossRef]
  60. Buerger, M. The genesis of twin crystals. Am. Mineral. J. Earth Planet. Mater. 1945, 30, 469–482. [Google Scholar]
  61. Kohn, V.; Folomeshkin, M. Feasibility of X-ray beam nanofocusing with compound refractive lenses. J. Synchrotron Radiat. 2021, 28, 419–428. [Google Scholar] [CrossRef] [PubMed]
  62. Joly, Y. X-ray absorption near-edge structure calculations beyond the muffin-tin approximation. Phys. Rev. B 2001, 63, 125120. [Google Scholar] [CrossRef]
  63. Bunău, O.; Joly, Y. Self-consistent aspects of X-ray absorption calculations. J. Phys. Condens. Matter 2009, 21, 345501. [Google Scholar] [CrossRef] [PubMed]
  64. Giacovazzo, C.; Monaco, H.; Viterbo, F.; Scordari, G.; Gilli, G.; Zanotti, G.; Catti, M. Fundamentals of crystallography. IUCr texts on crystallography no. 2. Acta Crystallogr. Found. Crystallogr 1993, 49, 373–374. [Google Scholar]
  65. Hahn, T.; Klapper, H. Twinning of crystals. Int. Tables Crystallogr. 2006, 500, 413–483. [Google Scholar]
  66. Ilas, S. Elaboration et Caractérisation de Matériaux non Linéaires pour la Conception de Dispositifs Laser Émettant dans L’ultraviolet. Ph.D. Thesis, Université Pierre et Marie Curie-Paris VI, Paris, France, 2014. [Google Scholar]
  67. Okutani, M.; Jo, T.; Carra, P. Tight-binding approach to natural circular dichroism in the X-ray region. J. Phys. Soc. Jpn. 1999, 68, 3191–3194. [Google Scholar] [CrossRef]
  68. Goulon, J.; Rogalev, A.; Wilhelm, F.; Jaouen, N.; Goulon-Ginet, C.; Brouder, C. Optical activity probed with X-rays. J. Phys. Condens. Matter 2003, 15, S633. [Google Scholar] [CrossRef]
  69. Jerphagnon, J.; Chemla, D. Optical activity of crystals. J. Chem. Phys. 1976, 65, 1522–1529. [Google Scholar] [CrossRef]
  70. Sirotin, Y.I.; Shaskol’skaia, M.P. Fundamentals of Crystal Physics; MIR Publishers: Moscow, Russia, 1982. [Google Scholar]
Figure 1. Schematic representation of the XNCD imaging experimental set-up on beamline ID12 (ESRF). A Si(111) monochromator is used to select the desired wavelength from the incoming circularly polarized X-ray beam, and the selected beam is further focused using Be compound refractive lenses [29]. The sample is set such that the trigonal c-axis is parallel to the k-vector of incident beam to avoid the birefringence and linear dichroism effects. The sample crystal is raster-scanned through the focused beam. The experimental signals are recorded by a silicon photodiode.
Crystals 11 00531 g001
Figure 2. View of left-handed and right-handed structures for SmFe 3 (BO 3 ) 4 .
Crystals 11 00531 g002
Figure 3. Behavior of the a-component of the electric polarization on the magnetic field applied along the a- and b * -axes in SmFe 3 (BO 3 ) 4 a-cut plate measured for the total area of the plate (∼12 mm 2 ) and small point contact (∼1 mm 2 ), which illustrates the role of twins on magnetoelectric properties. The inset shows the polarization behavior for the practically twin-free sample studied in [38,39].
Crystals 11 00531 g003
Figure 4. Experimental dichroism signals obtained from XANES experiments at the Fe K-edge for two enantiomorphous positions of the racemic SmFe 3 (BO 3 ) 4 single-crystal recorded with the X-ray wavevector parallel the trigonal c-axis: pre-edge XANES structures from 7112 eV to 7119 eV can be assigned to a set of 1s–3d transitions; near-edge structures to 1s–4p shape resonances. All spectra exhibit XNCD; the intensities of pre-edge peaks are anticorrelated, when a beam with circular polarization is moving on the surface of the crystal from one enantiomorphous domain to another, the peaks have maximum and minimum, respectively. XNCD signal for the racemic domain under a large beam of 300 microns is shown. On the inset: the black curve is the corresponding averaged XANES spectrum, and the red curve is the corresponding XNCD spectrum for one enantiomer extending to the whole measured energy range.
Crystals 11 00531 g004
Figure 5. XANES and XNCD spectra at the Fe K-edge of the levo-enantiomer SmFe 3 (BO 3 ) 4 : calculations versus experimental data.
Crystals 11 00531 g005
Figure 6. XNCD images recorded at room temperature for the racemic SmFe 3 (BO 3 ) 4 single crystal along the trigonal c-axis at the Fe K-edge energy fixed at the maximum of the XNCD signal (7115.25 keV) as a function of coordinates. It shows clear evidence that the crystal comprises orientationally distinct domains. The black line shows the angle of 120 inherent three-fold rotation in the R32 space group. The direction of the third-order axis and the (110) crystal plane are shown (checked by Laue diffraction, Photonic Science). Image size: 560 × 560 μ m 2 .
Crystals 11 00531 g006
Publisher’s Note: MDPI stays neutral with regard to jurisdictional claims in published maps and institutional affiliations.

