Article

Signatures of the Carrier Envelope Phase in Nonlinear Thomson Scattering

by
Marcel Ruijter
1,2,*,†,
Vittoria Petrillo
2,3,†,
Thomas C. Teter
4,
Maksim Valialshchikov
5 and
Sergey Rykovanov
5,†
1
INFN, Sezione di Roma and Dipartimento di Fisica, University of Rome “La Sapienza”, Piazzale Aldo Moro 5, 00185 Rome, Italy
2
INFN-Sezione di Milano, Via Celoria 16, 20133 Milano, Italy
3
Department of Physics, Università degli Studi di Milano, Via Celoria 16, 20133 Milano, Italy
4
Helmholtz Institute Jena, Fröbelstieg 3, 07743 Jena, Germany
5
High Performance Computing and Big Data Laboratory, Skolkovo Institute of Science and Technology, 121205 Moscow, Russia
*
Author to whom correspondence should be addressed.
These authors contributed equally to this work.
Crystals 2021, 11(5), 528; https://doi.org/10.3390/cryst11050528
Submission received: 14 April 2021 / Revised: 2 May 2021 / Accepted: 6 May 2021 / Published: 10 May 2021
(This article belongs to the Special Issue Spectroscopy and Imaging of Compton Scattering X-rays)

Abstract

:
High-energy radiation can be generated by colliding a relativistic electron bunch with a high-intensity laser pulse—a process known as Thomson scattering. In the nonlinear regime the emitted radiation contains harmonics. For a laser pulse whose length is comparable to its wavelength, the carrier envelope phase changes the behavior of the motion of the electron and therefore the radiation spectrum. Here we show theoretically and numerically the dependency of the spectrum on the intensity of the laser and the carrier envelope phase. Additionally, we also discuss what experimental parameters are required to measure the effects for a beamed pulse.

1. Introduction

Ultra-short laser pulses, for which the temporal length is of the order of the wavelength, are effective tools to measure ultra-fast events or can be used for nonlinear light–matter interactions [1,2,3]. For the latter, the exact shape of the field is important, i.e., the phase of the oscillations with respect to the envelope (carrier envelope phase; ϕ c e p ) and is therefore important to control in experiments. For intensities up to 10 14 10 15 W/cm 2 , methods exist to measure ϕ c e p by utilizing ionization processes [4,5,6,7]. In relativistic laser pulses, the carrier envelope phase cannot be distinguished through ionization; however, other light–matter interactions are susceptible to ϕ c e p and could be utilized for measuring it. One such interaction is Thomson or Compton scattering, the conversion of low- to high-energy photons through the collision with charged particles. The former can be described using classical electrodynamics when the collision is elastic, i.e., the recoil of the charge is negligible ( χ = γ ω l m e c 2 1 where γ is the electron’s Lorentz factor, is the reduced Planck constant, ω l is the frequency of the laser pulse, m e is the mass of the electron and c is the speed of light). In this regime the process has been studied with regard to the laser strength parameter a 0 , the shape of the laser pulse both longitudinally and transversely [8,9,10,11,12], the bandwidth of the emitted radiation [13,14] and methods to reduce it [15]. In [16], it was shown that the phase of the field of the emitted radiation is linked to that of the laser pulse. Moreover, [17] found numerically that Thomson or Compton scattering can be used as a method to measure the laser pulse parameters in the plane wave limit by comparing the difference in emission angles. Here we show on an analytical basis how ϕ c e p is visible in the spectrum and what the experimental requirements are for its measurement.

2. Thomson Scattering

In the classical regime an accelerating charge emits radiation, or alternatively the radiation is fully described by the motion of the charge. This description is called the Lienard–Wiechert potential, for which the intensity per unit frequency and steradian is given by [18].
d 2 I d ω d Ω = e 2 4 π 2 c ω i = 0 N e d t n ^ × n ^ × β i exp i ω c c t n ^ · r i 2 ,
where e is the electric charge, n ^ is the unit vector from the source to the detector and in spherical coordinates it is given by n ^ = ( cos ( φ ) sin ( ϑ ) , sin ( φ ) sin ( ϑ ) , cos ( ϑ ) ) , N e is the total number of electrons, and β i and r i are the velocity and trajectory of the i th charge. The motion of the electron is then calculated according to the Lorentz force
d U μ d s = e m e c 2 F μ ν U ν = ( μ a ν ν a μ ) U ν ,
where U μ d X μ d s = γ 1 β , F μ ν is the electromagnetic field tensor and a μ = e A μ m e c 2 is the normalized vector potential depending on the four position of the particle. We define a linearly polarized laser pulse as
a = a 0 E ζ Ψ r cos ζ + ϕ c e p x ^ ,
where E and Ψ are the temporal and spatial envelope functions, respectively, and ζ = k l ( c t z ) . For the envelope functions we use the following normalization: E ( 0 ) = 1 and Ψ ( 0 ) = 1 . A well-suited temporal profile for a pulse with temporal length of the order of N c is E ζ = sec h ζ σ l [19] where σ l = π N c log ( 2 + 3 ) is the length of the pulse. With this definition the FWHM of the laser pulse is an integer number times its wavelength.
Given that with our definition the laser pulse travels in + z ^ , the angle for backscattered radiation is ϑ = π . For numerical simulations we use a particle tracker based on the Vay method [20] to obtain the trajectory of the electron, which is subsequently used to calculate the spectrum according to Equation (1).

2.1. Single Electron—Plane Wave Dynamics

In the plane wave approximation (Equation (3) with Ψ = 1 ) the motion of the electron has an exact analytical solution
U μ = γ + ( a ) 2 2 γ ( 1 β ) a 1 a 2 γ β + ( a ) 2 2 γ ( 1 β ) .
Figure 1 shows the effect of ϕ c e p on the motion of the electron. The electric field of the emitted radiation will have the imprint of ϕ c e p [16]; however, this does not lead directly to a visible effect on the spectrum. We must then examine Equation (1) where the electron motion is affected by ϕ c e p . Substitution of Equation (4) into Equation (1) and setting ϑ = π leads to [10,11,21].
d 2 I d ω d Ω = e 2 4 π 2 c ν m = e i ( 2 m + 1 ) ϕ c e p 2 d ζ a 0 E ( ζ ) J m ( B ) + J m + 1 ( B ) exp i ζ d ζ ( 2 m + 1 ) + ν 1 + a 0 2 E 2 ( ζ ) 2 2 ,
where J m is the Bessel function of the first kind and B = ν a 0 E ( ζ ) 2 2 and ν = ω ( 1 + β ) 2 γ 2 ω l is the normalized emitted frequency. Using the stationary phase approximation, the frequencies where the peak intensities of the harmonics are located are given by [10,11,21]
ν H ( ζ ) = H 1 + a 0 2 E 2 ( ζ ) 2 ,
where H = 2 m + 1 is the harmonic order. The frequency is red-shifted due to the drift velocity ( U 3 ) of the nonlinear interaction as shown in Figure 1, right panel.
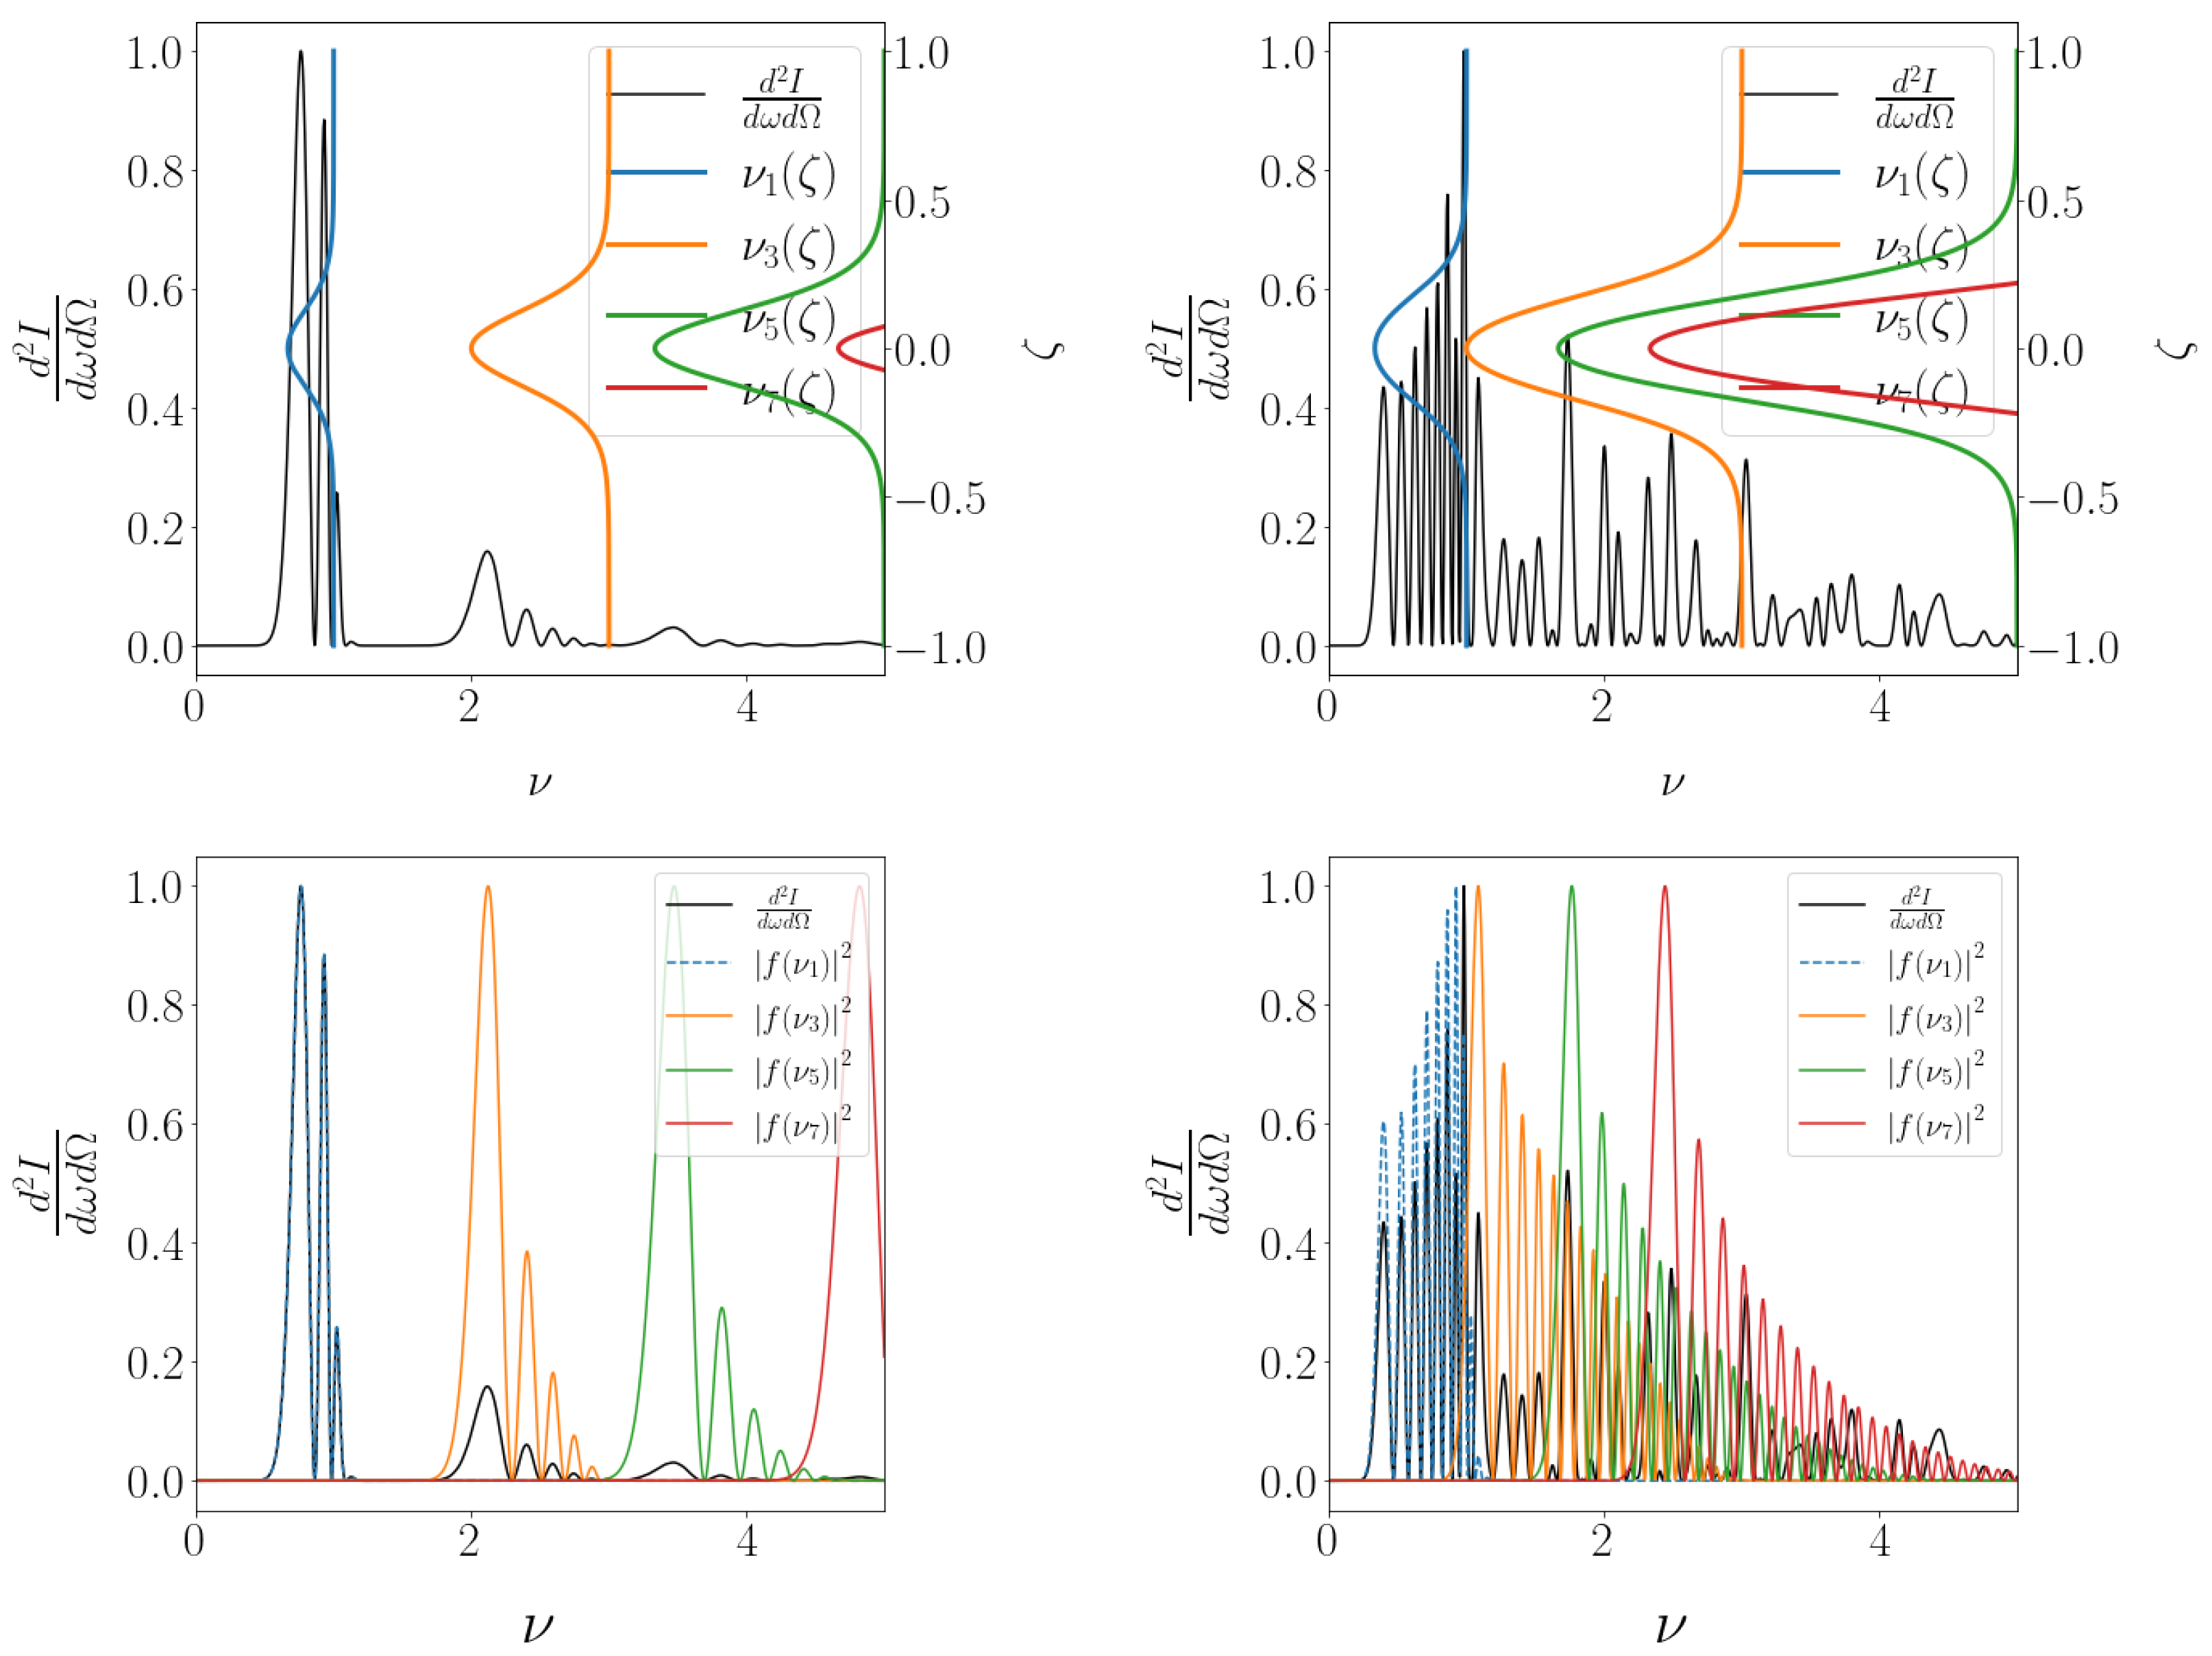
Quantitatively, Equation (5) reads as | m f m | 2 = | H f ν H | 2 where f ν H represents the contribution to the spectrum of a single harmonic order. For low values of a 0 the harmonics are separated, as is shown in the left panels of Figure 2, and therefore the solution of Equation (5) can be read as | f ν 1 | 2 + | f ν 3 | 2 + . In this case, ϕ c e p appears as a global phase and thus does not influence the spectrum. If we increase a 0 , the lower bound of the emitted frequency decreases ( ν H ( 0 ) ), yet the upper bound remains the same ( ν H ( ± ) ). Therefore, for a given value of a 0 , frequencies from different harmonic orders, emitted at different times of the interaction, will start to overlap and can be calculated using
0 = ν H i ( ζ = ± ) ν H j ( ζ = 0 ) , a 0 Δ H = 2 H j H i H i ,
where H i is a lower harmonic than H j . For example, the third harmonic starts to overlap with the first when a 0 = 2 , as can be seen in Figure 2. In this case, the solution of the spectrum can be read as | f ν 1 | 2 + 2 R e f ν 1 f ν 3 * + | f ν 3 | 2 + , where f * is the complex conjugate. The cross term is the interference of the two different harmonic orders and depends on ϕ c e p . Due to the interference, the peak intensity of a harmonic shifts and scales with
ν H , c e p H 1 + a 0 2 2 1 ± sin 2 ( ϕ c e p ) π N c ,
as is shown in Figure 3. We can see that the spectrum is symmetric around ϕ c e p = π 2 , thus there is not a unique solution to the frequency shift due to ϕ c e p (e.g., Δ ν H , c e p ( ϕ c e p = π 4 ) = Δ ν H , c e p ( ϕ c e p = 3 π 4 ) ). Therefore, the interval for which ϕ c e p can be determined from a given spectrum is [ 0 , π 2 ] + k π 2 , where k is an integer.
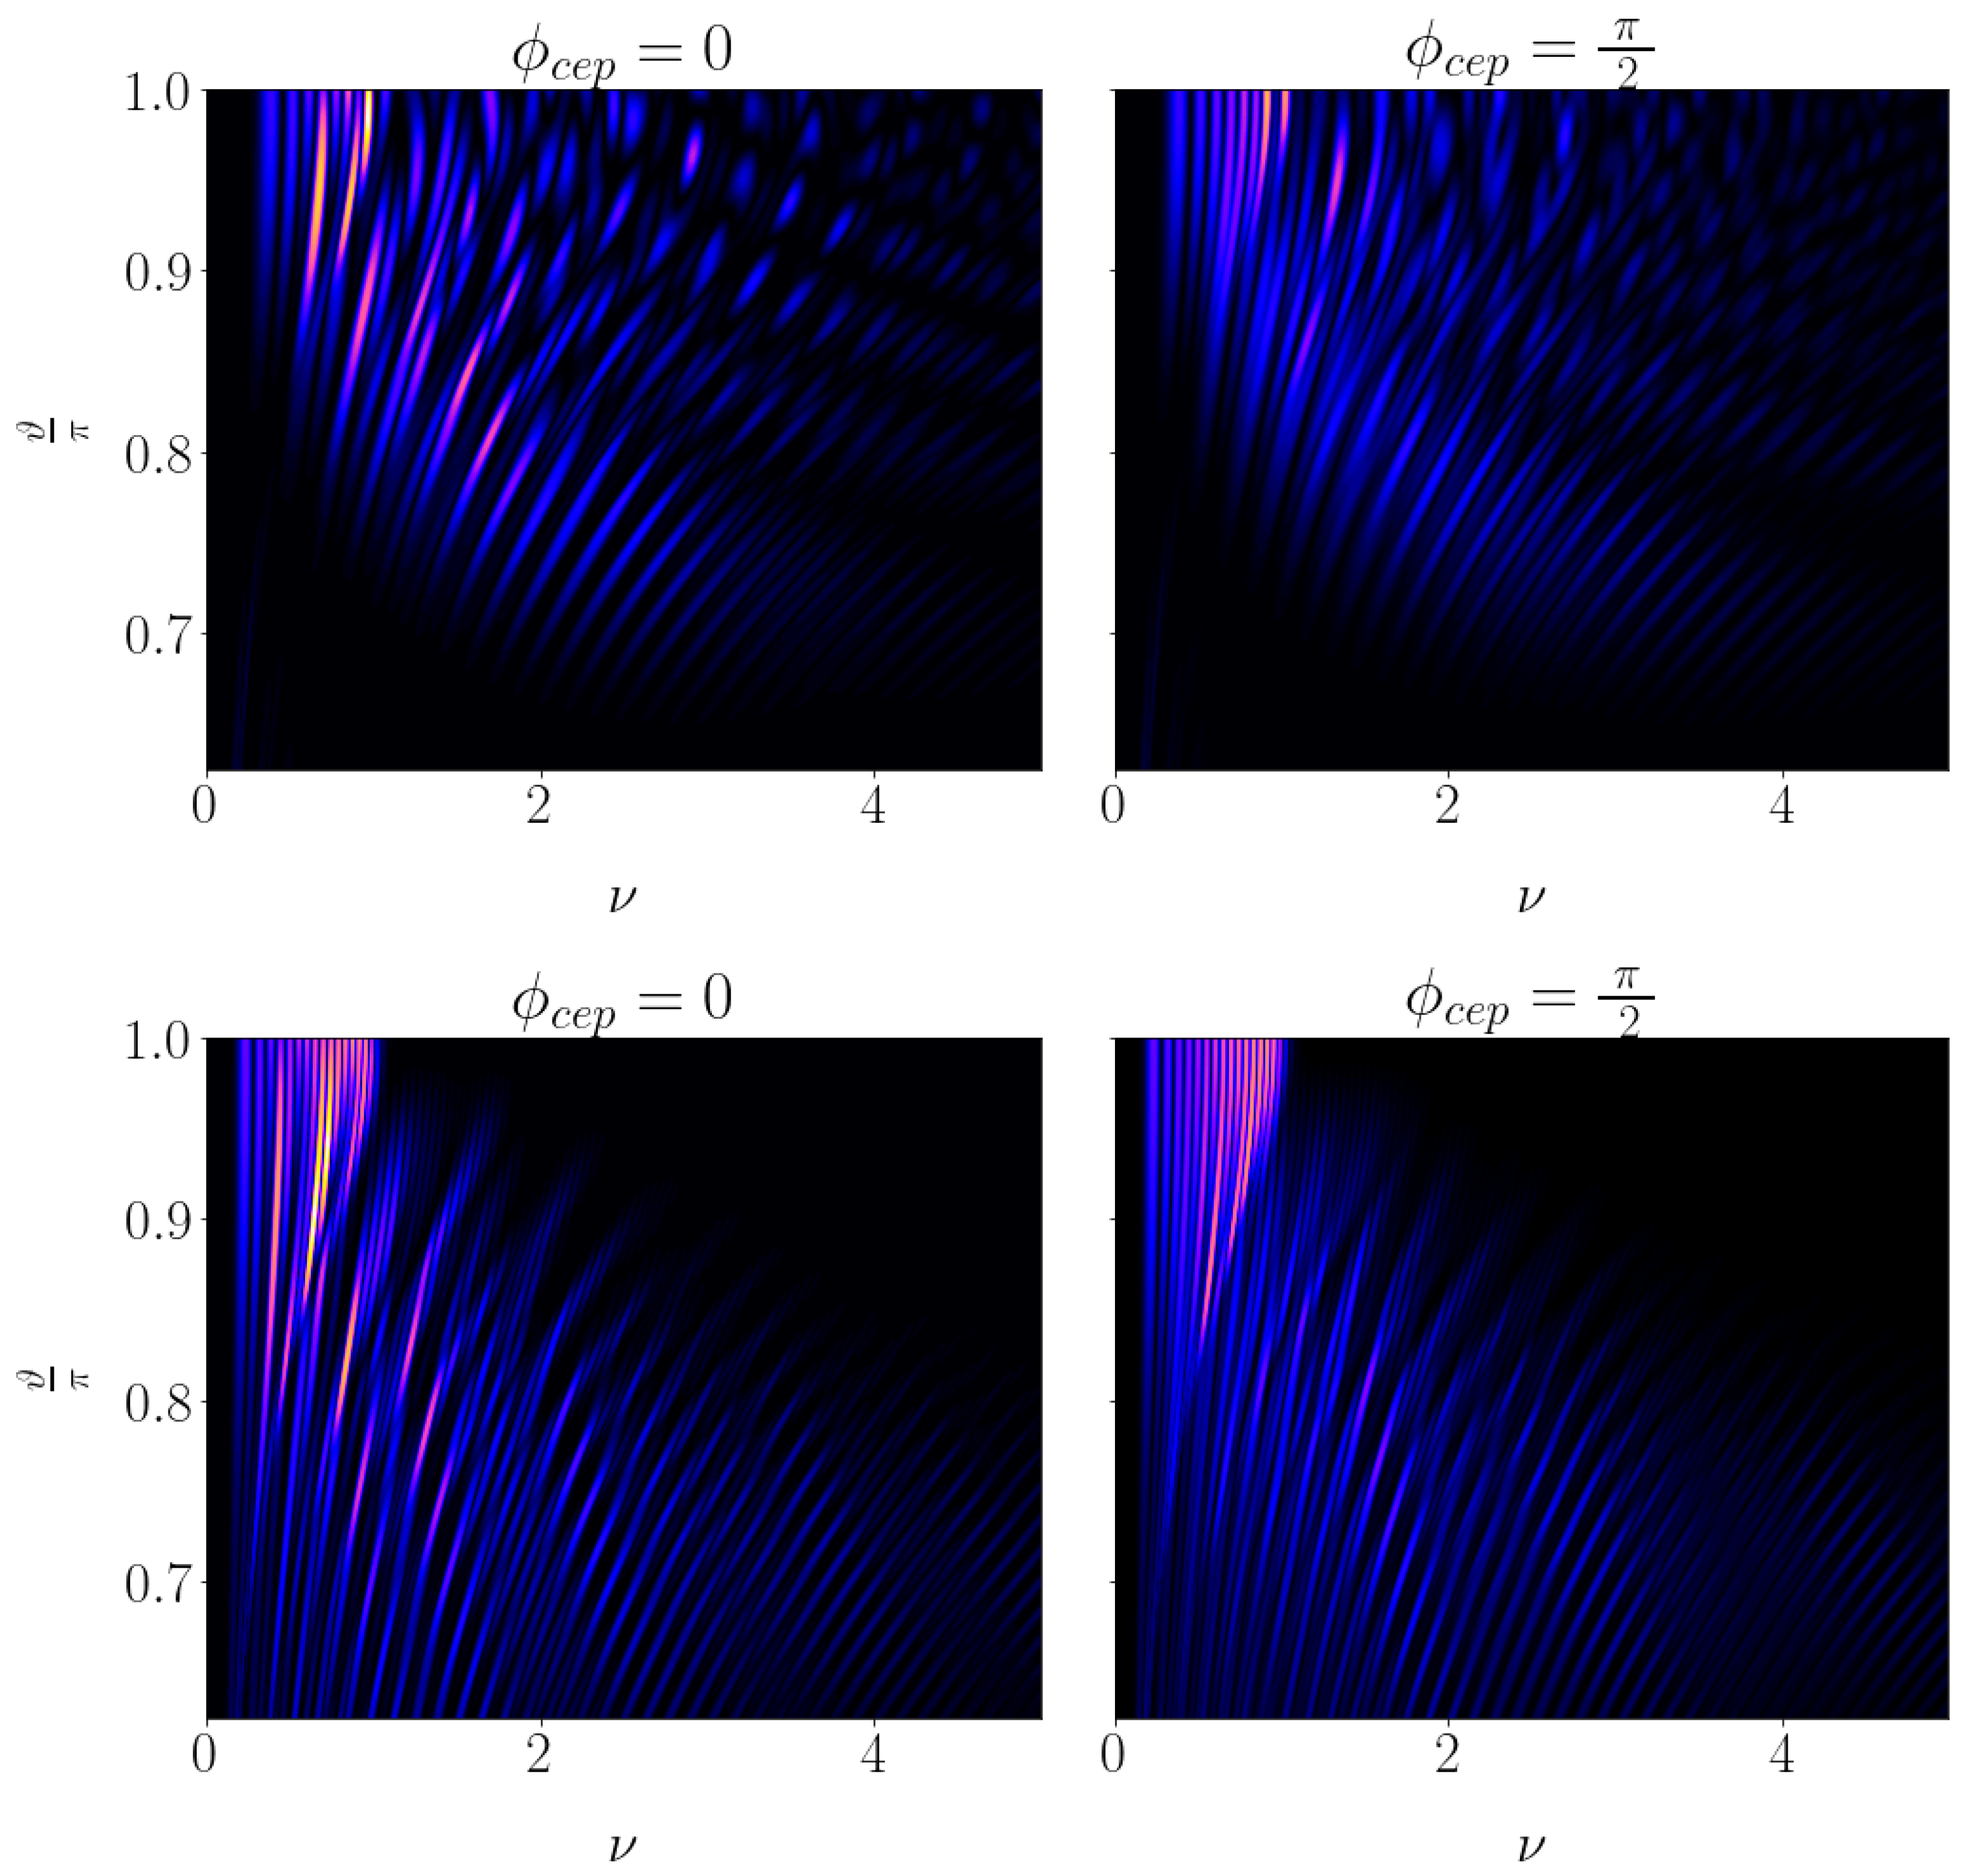
The cone of emission depends on the energy of the electron and for the fundamental Thomson line scales with ϑ π 1 γ . To include the higher harmonics, the range of the acceptance angle needs to be larger, namely π 1 3 4 γ ϑ π . The resolution of ϕ c e p can be greatly improved by choosing low electron energy. Consequently, the emitted frequency is also low energy, an order of magnitude larger than the laser frequency, improving diagnostics. The effect of the on-axis radiation can be generalized for emissions in all directions, i.e., ϕ c e p has a distinct effect on the spectrum when harmonics overlap, as is shown in Figure 4.

2.2. Electron Bunch—Plane Wave Laser Pulse

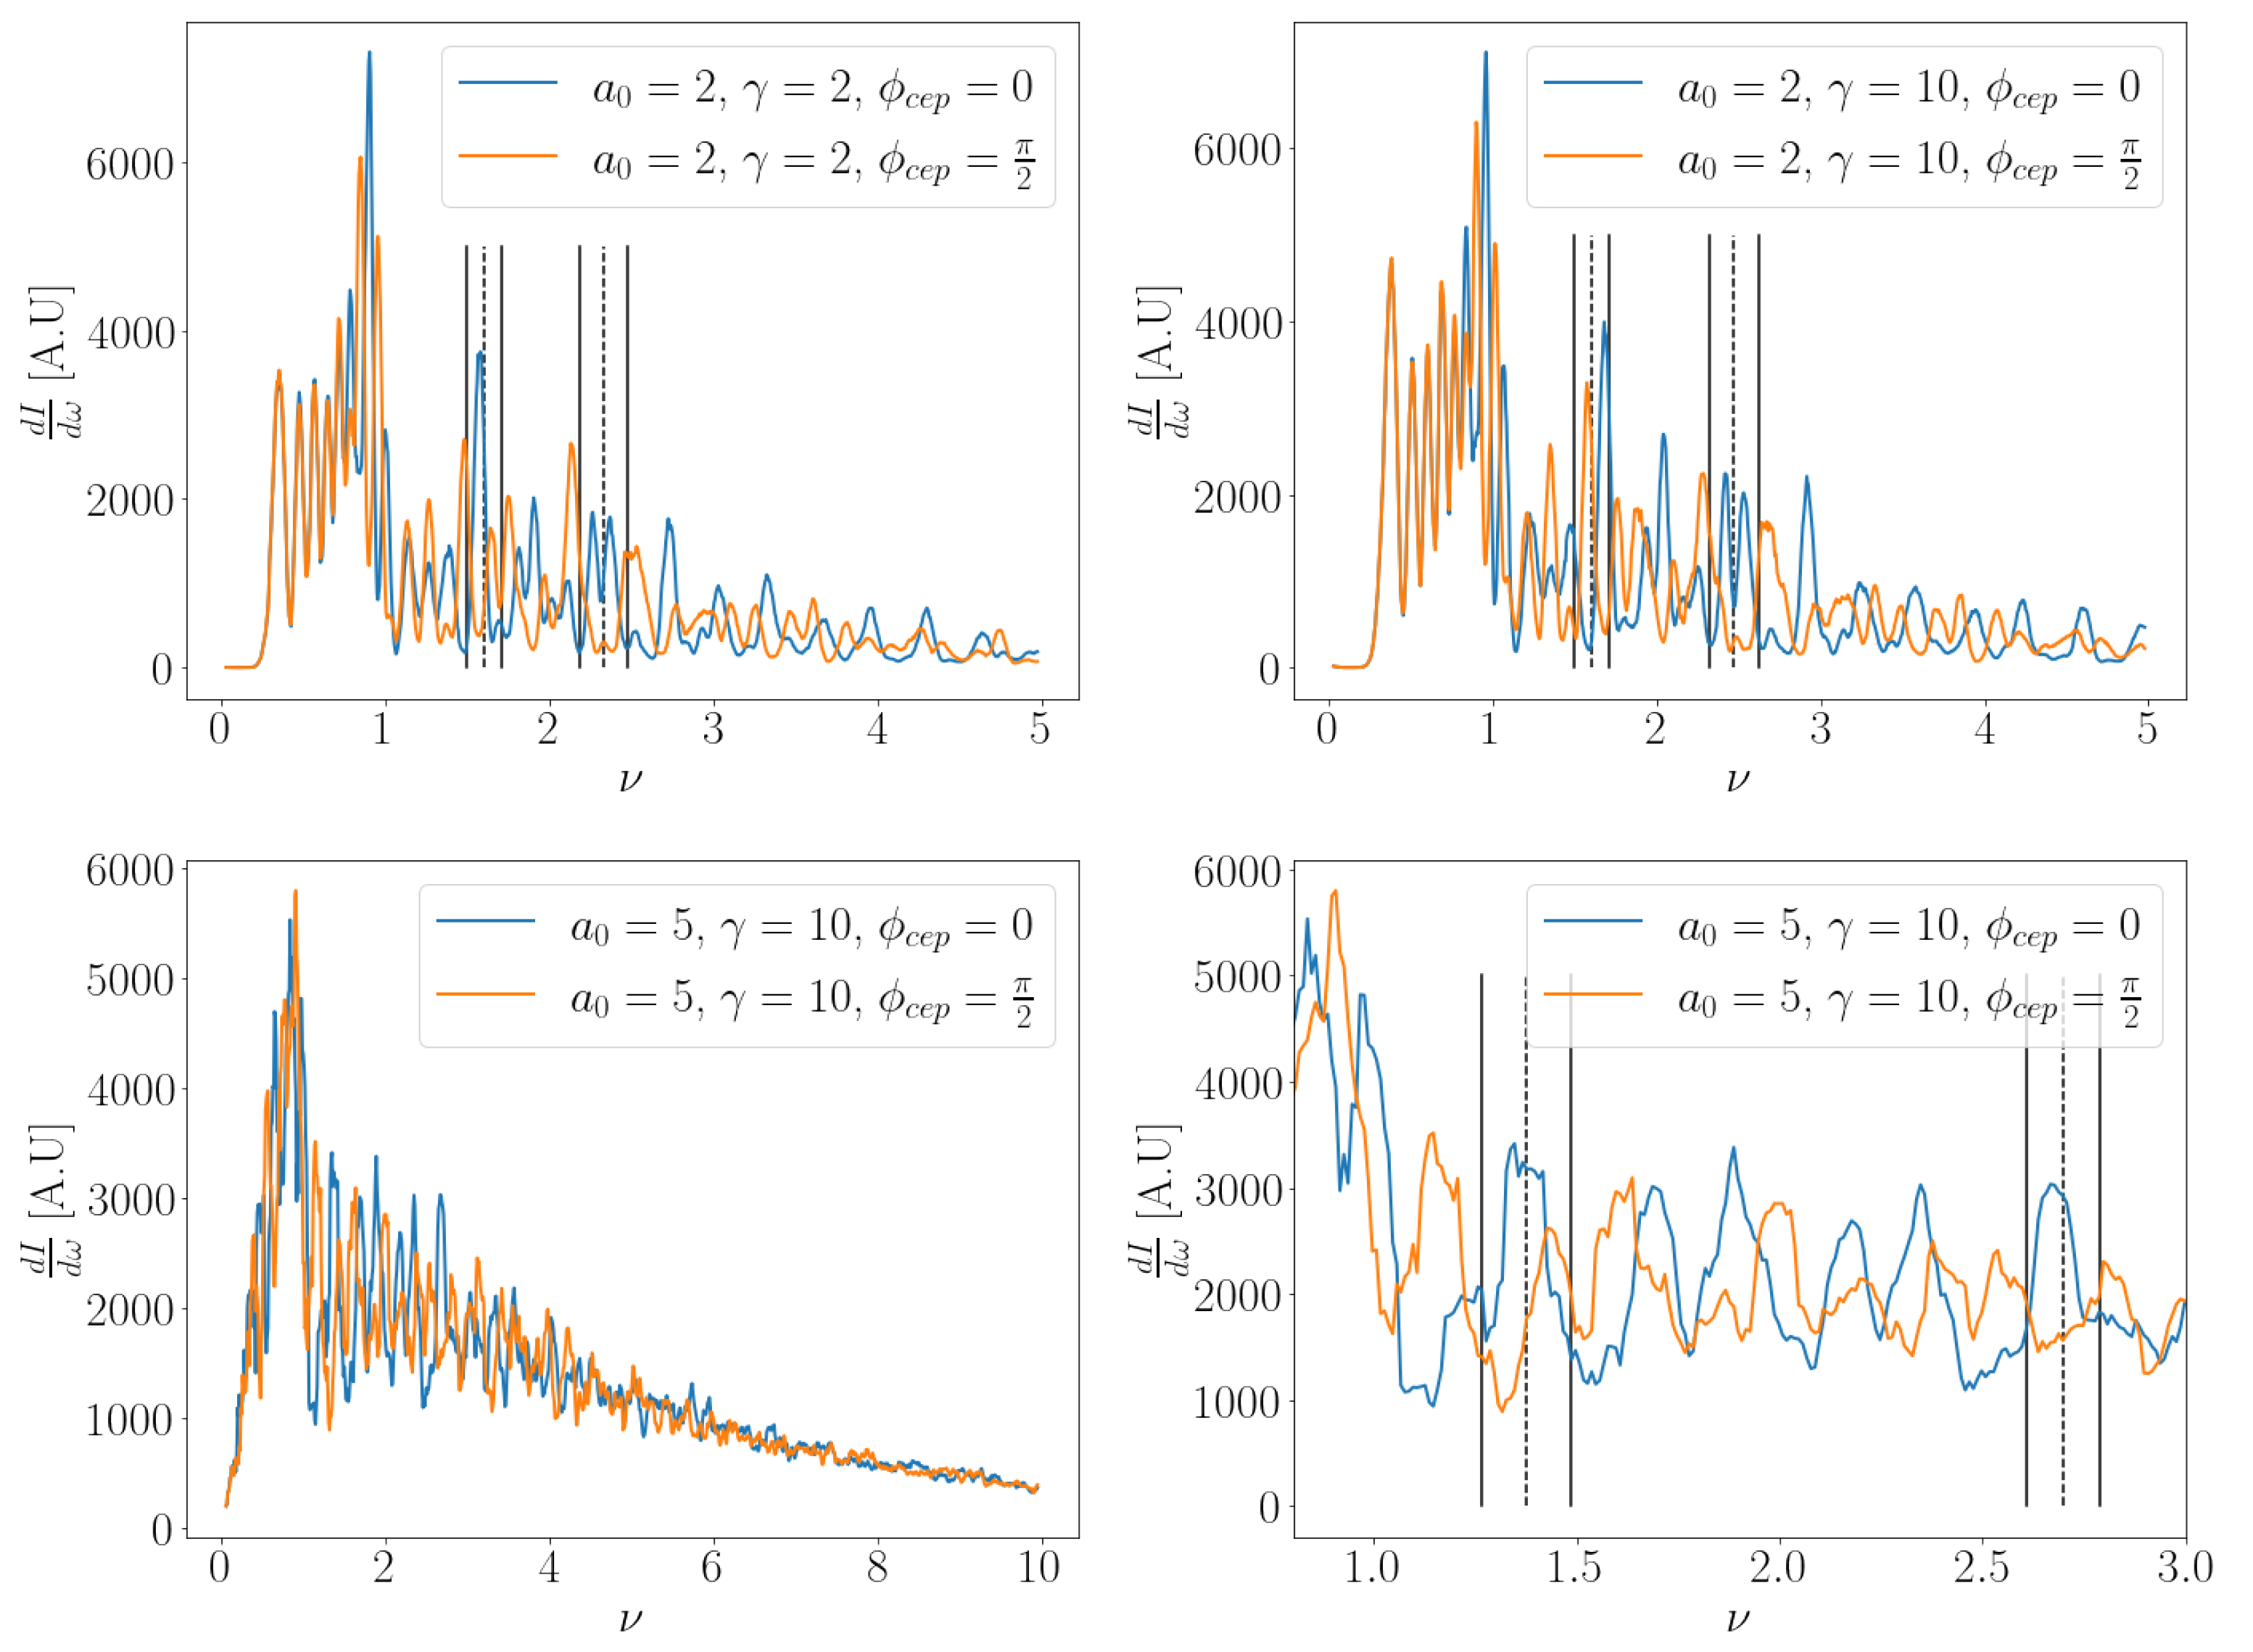
The choices of electron parameters are N e = 10 3 , (normalized emittance) ϵ = 10 6 mm mrad and σ γ γ = 10 3 (rms). The radiation emitted is collected in a fraction of the emission cone in order ( ϑ m a x = 1 10 γ ). This is required due to the angular dependency of the emitted radiation, as Figure 4 indicates. In Figure 5 the ϕ c e p dependency is clearly visible. For higher values of a 0 the peaks of the harmonics are more downshifted and are spaced closer together (Equation (6)). However, the effect remains visible for a 0 = 5 when H 20 .

2.3. Electron Bunch—Beamed Laser Pulse

Electrons traversing the beamed laser pulse will experience different intensity values depending on their transverse position ( a 0 Ψ ( r ) ). The result is that the nonlinear broadening will be different for each electron and could obscure the dependency of ϕ c e p . The broadening of the spectrum due to the spatial profile, when (transverse) ponderomotive scattering is omitted, scales as
Δ ν E = 1 , Ψ = a 0 2 2 1 + a 0 2 2 1 Ψ 2 1 + a 0 2 Ψ 2 2
In order to see the effect of ϕ c e p this contribution to the spectral broadening has to be much smaller than Equation (8). The choice of the spatial profile is a Gaussian beam. We use laser beam width W 0 = 45 μ m, by which the zeroth order Gaussian beam can be used and is given by
Ψ ( r ) = q ( 0 ) q ( z ) exp i ω l c x 2 + y 2 2 q ( z ) ,
where q ( z ) = z + i W 0 2 ω l 2 c . Figure 6 shows the the broadening due to a spatial profile. For the ϕ c e p dependency to be visible, the width of an electron bunch needs to be a fraction of the width of the laser pulse.

3. Discussion

Here we showed that for a short laser pulse the effect of ϕ c e p can be measured in the Thomson spectrum, where the recoil of the electron is negligible and classical electron dynamics can be used. The recoil of the electron is determined through χ = γ ω l m e c 2 . This parameter, however, does not include the stochastic effects for the emission of higher harmonics. In [22] it was shown that the classical description does not describe higher harmonics sufficiently for an electron energy of γ = 80 and instead the scattering process should be treated quantum mechanically (Compton scattering). The electrons of γ = 2 and 10 present in this work yield a value of the quantum parameter χ 8–40 times less than that which is described in [22], reducing the deviation of the classical from the quantum description. Moreover, for an electron energy of γ = 10 and a laser photon energy of the order of 1 eV, the emitted radiation remains sub-keV, photon energies that can be measured with high enough precision to observe the CEP dependency, i.e., the change in position of the peak intensity of a harmonic (Equation (8)). Another advantage of using low-energy electrons is the (relatively) small size of the beamline and components necessary to obtain them.
In this work we used a pulse with length N c = 5 ( τ F W H M = 2 fs). For shorter pulses the effect will be stronger, as the frequency shift due to ϕ c e p scales with the length of the laser pulse. However, our description of the pulse (Equation (3)) no longer satisfies Maxwell’s equations to a good approximation. For longer pulses the effect is reduced, but since the shift scales with the harmonic one could look at higher harmonics for a better resolution. This can already be seen in Figure 6, bottom right panel.
For a realistic laser pulse, i.e., with a spatial profile, there is a stringent requirement to measure ϕ c e p : the gradient must be sufficiently small in the range of the width of the electron bunch. Here we showed this for a relatively large laser spot size ( W 0 = 45 μ m) for which an electron bunch with W e = 15 μ m or smaller is required. Electron bunches with such characteristics have experimentally been obtained using laser wakefield acceleration (e.g., [23]). Thus, for laser pulses used in experiments, e.g., [24] W 0 = 20 μ m, [25] W 0 = 30 μ m, our proposed method is viable.

4. Conclusions

We have shown analytically and numerically how the spectrum of (inverse) Thomson scattering is influenced by the carrier envelope phase, making it a potential candidate as a diagnostic tool to measure ϕ c e p at the interaction point. The interval for which ϕ c e p can be determined through harmonic interference in the spectrum is [ 0 , π 2 ] + k π 2 due to the symmetry in the spectrum. The application of such a diagnostic would require a 0 > 1 ( I 10 18 W/cm 2 ) in order for the harmonics of the emitted radiation to overlap. The physical reason can be understood from the classical model where the time of emission of the same frequency occurs at different times during the interaction. Due to the interference, the peak of a harmonic shifts proportionally to the harmonic number and ϕ c e p and inversely with the length of the laser pulse. For larger harmonic numbers (consequently higher values of a 0 ) the effect is more visible. Further, we showed that for a realistic laser pulse, the transverse size of the electron beam needs to be at least three times smaller than that of the laser pulse for ϕ c e p to be measurable.

Author Contributions

Methodology, T.C.T., S.R., V.P., M.R.; formal analysis, M.R.; supervision, V.P., S.R.; writing—review and editing, M.R., V.P., T.C.T., M.V., S.R. All authors have read and agreed to the published version of the manuscript.

Funding

This research received no external funding.

Institutional Review Board Statement

Not applicable.

Informed Consent Statement

Not applicable.

Data Availability Statement

The datasets generated during and/or analyzed during the current study are available from the corresponding author on reasonable request.

Conflicts of Interest

The authors declare no conflict of interest.

References

  1. Brabec, T.; Krausz, F. Intense few-cycle laser fields: Frontiers of nonlinear optics. Rev. Mod. Phys. 2000, 72, 545–591. [Google Scholar] [CrossRef]
  2. Kryukov, P.G. Ultrashort-pulse lasers. Quantum Electron. 2001, 31, 95–119. [Google Scholar] [CrossRef]
  3. Krausz, F.; Ivanov, M. Attosecond physics. Rev. Mod. Phys. 2009, 81, 163–234. [Google Scholar] [CrossRef] [Green Version]
  4. Paulus, G.G.; Lindner, F.; Walther, H.; Baltuška, A.; Goulielmakis, E.; Lezius, M.; Krausz, F. Measurement of the Phase of Few-Cycle Laser Pulses. Phys. Rev. Lett. 2003, 91, 253004. [Google Scholar] [CrossRef] [PubMed]
  5. Fukahori, S.; Ando, T.; Miura, S.; Kanya, R.; Yamanouchi, K.; Rathje, T.; Paulus, G.G. Determination of the absolute carrier-envelope phase by angle-resolved photoelectron spectra of Ar by intense circularly polarized few-cycle pulses. Phys. Rev. A 2017, 95, 053410. [Google Scholar] [CrossRef]
  6. Orfanos, I.; Makos, I.; Liontos, I.; Skantzakis, E.; Förg, B.; Charalambidis, D.; Tzallas, P. Attosecond pulse metrology. APL Photonics 2019, 4, 080901. [Google Scholar] [CrossRef] [Green Version]
  7. Liu, Q.; Seiffert, L.; Süßmann, F.; Zherebtsov, S.; Passig, J.; Kessel, A.; Trushin, S.A.; Kling, N.G.; Ben-Itzhak, I.; Mondes, V.; et al. Ionization-Induced Subcycle Metallization of Nanoparticles in Few-Cycle Pulses. ACS Photonics 2020, 7, 3207–3215. [Google Scholar] [CrossRef]
  8. Heinzl, T.; Seipt, D.; Kämpfer, B. Beam-shape effects in nonlinear Compton and Thomson scattering. Phys. Rev. A 2010, 81, 022125. [Google Scholar] [CrossRef] [Green Version]
  9. Ghebregziabher, I.; Shadwick, B.A.; Umstadter, D. Spectral bandwidth reduction of Thomson scattered light by pulse chirping. Phys. Rev. ST Accel. Beams 2013, 16, 030705. [Google Scholar] [CrossRef] [Green Version]
  10. Rykovanov, S.G.; Geddes, C.G.R.; Schroeder, C.B.; Esarey, E.; Leemans, W.P. Reply to “Comment on ‘Controlling the spectral shape of nonlinear Thomson scattering with proper laser chirping’”. Phys. Rev. Accel. Beams 2016, 19, 098002. [Google Scholar] [CrossRef] [Green Version]
  11. Kharin, V.Y.; Seipt, D.; Rykovanov, S.G. Temporal laser-pulse-shape effects in nonlinear Thomson scattering. Phys. Rev. A 2016, 93, 063801. [Google Scholar] [CrossRef] [Green Version]
  12. Terzić, B.; Brown, A.; Drebot, I.; Hagerman, T.; Johnson, E.; Krafft, G.; Maroli, C.; Petrillo, V.; Ruijter, M. Improving performance of inverse Compton sources through laser chirping. EPL Europhys. Lett. 2019, 126, 12003. [Google Scholar] [CrossRef] [Green Version]
  13. Curatolo, C.; Drebot, I.; Petrillo, V.; Serafini, L. Analytical description of photon beam phase spaces in inverse Compton scattering sources. Phys. Rev. Accel. Beams 2017, 20, 080701. [Google Scholar] [CrossRef] [Green Version]
  14. Ranjan, N.; Terzić, B.; Krafft, G.A.; Petrillo, V.; Drebot, I.; Serafini, L. Simulation of inverse Compton scattering and its implications on the scattered linewidth. Phys. Rev. Accel. Beams 2018, 21, 030701. [Google Scholar] [CrossRef] [Green Version]
  15. Ruijter, M.; Petrillo, V.; Zepf, M. Decreasing the bandwidth of linear and nonlinear Thomson scattering radiation for electron bunches with a finite energy spread. Phys. Rev. Accel. Beams 2021, 24, 020702. [Google Scholar] [CrossRef]
  16. Hack, S.; Varró, S.; Czirják, A. Carrier-envelope phase controlled isolated attosecond pulses in the nm wavelength range, based on coherent nonlinear Thomson-backscattering. New J. Phys. 2018, 20, 073043. [Google Scholar] [CrossRef]
  17. Mackenroth, F.; Di Piazza, A.; Keitel, C.H. Determining the Carrier-Envelope Phase of Intense Few-Cycle Laser Pulses. Phys. Rev. Lett. 2010, 105, 063903. [Google Scholar] [CrossRef] [Green Version]
  18. Jackson, J.D. Classical Electrodynamics, 3rd ed.; John Wiley & Sons Inc.: New York, NY, USA, 1999. [Google Scholar]
  19. McDonald, K.T. A Relativistic Electron Can’t Extract Net Energy from a Long Laser Pulse. 1997. Available online: http://puhep1.princeton.edu/~mcdonald/examples/gaussian2.pdf (accessed on 15 March 2021).
  20. Ripperda, B.; Bacchini, F.; Teunissen, J.; Xia, C.; Porth, O.; Sironi, L.; Lapenta, G.; Keppens, R. A Comprehensive Comparison of Relativistic Particle Integrators. Astrophys. J. Suppl. Ser. 2018, 235, 21. [Google Scholar] [CrossRef] [Green Version]
  21. Ruijter, M.; Kharin, V.Y.; Rykovanov, S.G. Analytical solutions for nonlinear Thomson scattering including radiation reaction. J. Phys. B At. Mol. Opt. Phys. 2018, 51, 225701. [Google Scholar] [CrossRef]
  22. Seipt, D.; Kämpfer, B. Nonlinear Compton scattering of ultrashort intense laser pulses. Phys. Rev. A 2011, 83, 022101. [Google Scholar] [CrossRef] [Green Version]
  23. Geddes, C.G.R.; Nakamura, K.; Plateau, G.R.; Toth, C.; Cormier-Michel, E.; Esarey, E.; Schroeder, C.B.; Cary, J.R.; Leemans, W.P. Plasma-Density-Gradient Injection of Low Absolute-Momentum-Spread Electron Bunches. Phys. Rev. Lett. 2008, 100, 215004. [Google Scholar] [CrossRef] [PubMed] [Green Version]
  24. Chen, S.; Powers, N.D.; Ghebregziabher, I.; Maharjan, C.M.; Liu, C.; Golovin, G.; Banerjee, S.; Zhang, J.; Cunningham, N.; Moorti, A.; et al. MeV-Energy X Rays from Inverse Compton Scattering with Laser-Wakefield Accelerated Electrons. Phys. Rev. Lett. 2013, 110, 155003. [Google Scholar] [CrossRef] [PubMed] [Green Version]
  25. Akagi, T.; Kosuge, A.; Araki, S.; Hajima, R.; Honda, Y.; Miyajima, T.; Mori, M.; Nagai, R.; Nakamura, N.; Shimada, M.; et al. Narrow-band photon beam via laser Compton scattering in an energy recovery linac. Phys. Rev. Accel. Beams 2016, 19, 114701. [Google Scholar] [CrossRef] [Green Version]
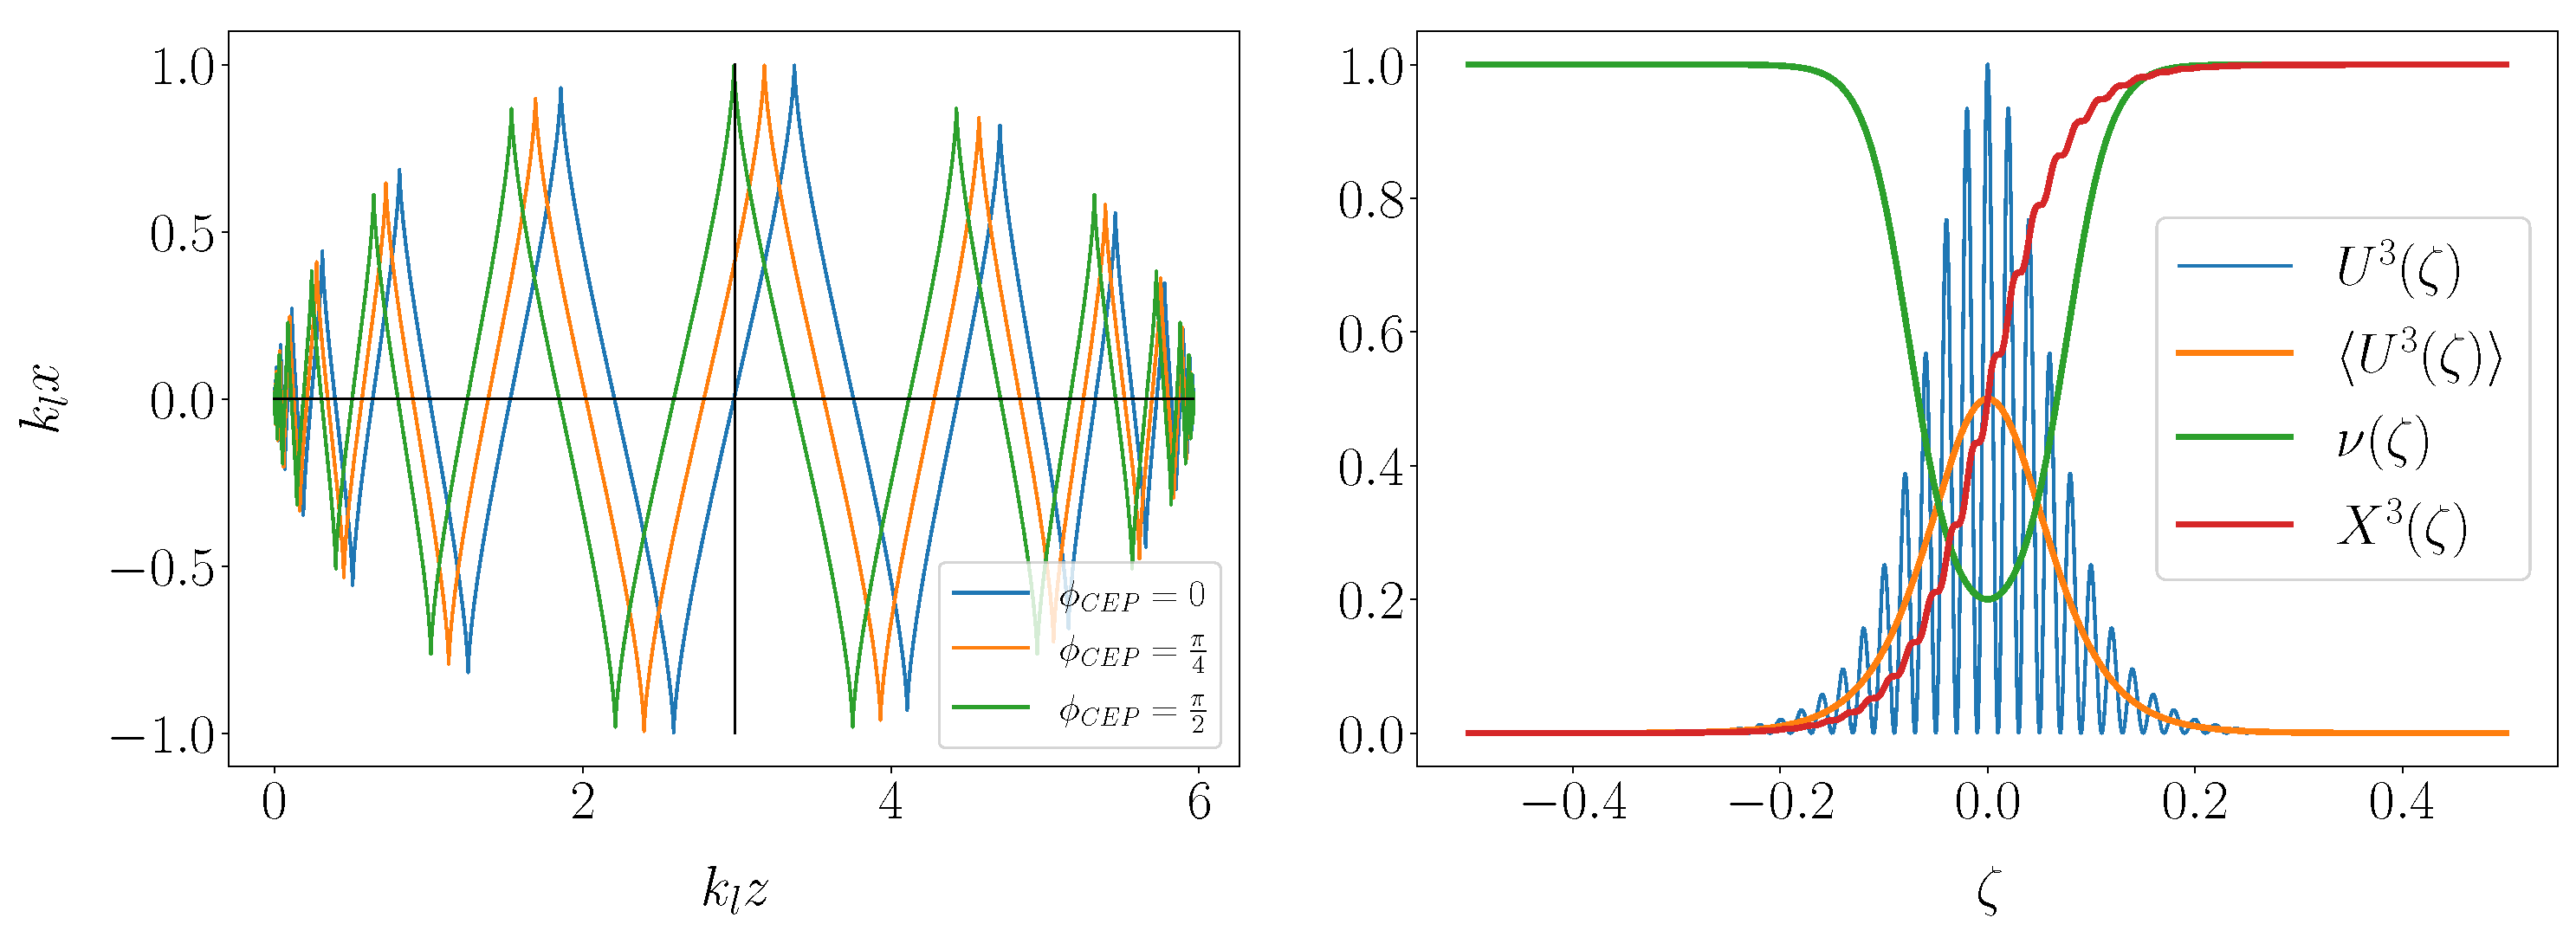
Figure 1. (Left): The electron trajectory for a head-on collision with a linearly polarized plane wave laser pulse (Equation (3) with Ψ = 1 ) for different values of ϕ c e p . The laser pulse parameters are N c = 5 and a 0 = 2 . For short pulses there are few oscillations near the maximum of the field. (Right): The longitudinal velocity (Equation (4)) and position of the electron during the interaction and the frequency it emits (Equation (6)) in normalized units. For the velocity, the drift velocity ( U 3 ) is also shown. As described in [10,22], a frequency that is emitted twice during the interaction can interfere constructively depending on the space–time distance of emission and lead to subsidiary peaks (see Figure 2).
Crystals 11 00528 g001
Figure 2. (Top left): On-axis back-scattered radiation in black for a 0 = 1 and N c = 5 . Colored lines give the frequency emitted as a function of ζ for the harmonics. The harmonics are separated, therefore the spectrum can be read as | f ν 1 | 2 + | f ν 3 | 2 + and there is no dependence of ϕ c e p . (Bottom left): same as top left, but with the harmonics calculated separately according to Equation (5) and individually normalized to 1 for better visualization. (Top right): On-axis back-scattered radiation for a 0 = 2 and N c = 5 along with the frequency emitted as function of ζ for the harmonics. The first and third harmonics start to overlap as given by Equation (7). The higher harmonics overlap substantially. The growth of the intensity of ν 1 is clearly a consequence of the number of times a frequency is emitted, originating from different harmonic orders. (Bottom right): same as top right, but with the harmonics given analytically by Equation (5) and individually normalized to 1 for better visualization.
Crystals 11 00528 g002
Figure 3. On-axis spectrum as a function of ϕ c e p for a linearly polarized pulse with a 0 = 2 and N c = 5 . The middle and right panels are cutouts of the left graph for the third and fifth harmonics along with lines according to Equation (8). The spectrum has a ϕ c e p dependency because the same frequency is emitted at different times during the interaction. We can see that the spectrum is symmetric around ϕ c e p = π 2 , thus there is not a unique solution to the frequency shift due to ϕ c e p (e.g., Δ ν H , c e p ( ϕ c e p = π 4 ) = Δ ν H , c e p ( ϕ c e p = 3 π 4 ) ). Therefore, the interval for which ϕ c e p can be determined from a given spectrum is [ 0 , π 2 ] + k π 2 , where k is an integer.
Crystals 11 00528 g003
Figure 4. Angular distribution of the spectrum for linear (top two graphs) and circular (bottom two graphs) polarization for a 0 = 2 , N c = 5 and γ = 2 . The emission cone is relatively large since the energy of the electron is low. The effect of ϕ c e p is clearly visible in the off-axis radiation. Increasing the energy of the electron leads to similar plots as the range of the observation angle ( π 1 3 4 γ ϑ π ) and the emitted frequency ( ν = ω ( 1 + β ) 2 γ 2 ω l ) are both normalized to the electron energy.
Crystals 11 00528 g004
Figure 5. Simulation results for radiation collected within ϑ m a x = 1 10 γ cone for a linearly polarized plane wave (Equation (3) Ψ = 1 ). (Top left): a 0 = 2 , γ = 2 . The black dotted lines indicate the peak for ϕ c e p = 0 (Equation (6)) and the solid black lines for ϕ c e p = π 2 (Equation (8)) for the fifth and seventh harmonics. (Top right): same as the left but γ = 10 . The shift in the harmonic peaks is due to the reduced ratio in the initial transverse and longitudinal momentum of the electrons. (Bottom left): a 0 = 5 , γ = 10 . Due to the stronger intensity of the laser pulse more energy is emitted in the higher harmonics. (Bottom right): zoomed in on a smaller frequency range to show ϕ c e p better. The black dotted lines indicate the peak for ϕ c e p = 0 (Equation (6)) and the solid black lines for ϕ c e p = π 2 (Equation (8)) for the 19th and 23rd harmonics.
Crystals 11 00528 g005
Figure 6. (Top left): Broadening of the spectrum due to different values of a 0 that electrons experience depending on their transverse position as compared to an electron traveling on-axis. The value of Δ ν E = 1 , Ψ needs to be small in order to see the effect of ϕ c e p in the spectrum. (Top right): spectrum within ϑ = 1 10 γ when W 0 W e = 2 . Laser parameters are a 0 = 2 , N c = 5 , W 0 = 45 μ m and electron parameters ϵ = 10 6 mm mrad, γ = 2 , σ γ γ = 10 3 . The differences in the intensity electrons experience dominates over the ϕ c e p dependency. (Bottom left): same simulation parameters but W 0 W e = 3 . The frequency shift due to ϕ c e p is visible. The black dotted lines indicate the peak for ϕ c e p = 0 (Equation (6)) and the solid black lines for ϕ c e p = π 2 (Equation (8)) for the fifth and seventh harmonics. (Bottom right): same as left zoomed in on a smaller frequency range to show the dependency better.
Crystals 11 00528 g006
Publisher’s Note: MDPI stays neutral with regard to jurisdictional claims in published maps and institutional affiliations.