Review

A Review of the Melting Curves of Transition Metals at High Pressures Using Static Compression Techniques

by
Paraskevas Parisiades
CNRS UMR 7590, Muséum National d’Histoire Naturelle, Institut de Minéralogie de Physique des Matériaux et de Cosmochimie, Sorbonne Université, 4 Place Jussieu, F-75005 Paris, France
Crystals 2021, 11(4), 416; https://doi.org/10.3390/cryst11040416
Submission received: 10 March 2021 / Revised: 6 April 2021 / Accepted: 7 April 2021 / Published: 13 April 2021

Abstract

:
The accurate determination of melting curves for transition metals is an intense topic within high pressure research, both because of the technical challenges included as well as the controversial data obtained from various experiments. This review presents the main static techniques that are used for melting studies, with a strong focus on the diamond anvil cell; it also explores the state of the art of melting detection methods and analyzes the major reasons for discrepancies in the determination of the melting curves of transition metals. The physics of the melting transition is also discussed.

1. Introduction

Transition metals are defined as those elements that have a partially filled d-electron sub-shell. The strong metallic bonding due to the delocalization of d-orbitals is responsible for a series of very interesting properties, such as high yield strength, corrosion and wear resistance, good ductility, easy alloy and metallic glass formation, paramagnetism, and high melting points and molar enthalpies of fusion, leading to a plethora of industrial applications [1,2,3,4,5,6].
In the field of high-pressure science, the melting of transition metals is of crucial importance from a geophysical point of view in order to define the structure and composition of planetary cores, with iron being by far the most abundant component of Earth’s inner core, nickel being the second [7,8,9,10,11]. There is also a significant fundamental interest, and numerous efforts have been made to understand the phase diagrams, as well as the thermodynamic and microscopic processes of melting under pressure [12,13,14,15,16,17,18]. While the hcp-bcc-hcp-fcc phase sequence in transition metals can be understood by the progressive filling of the d-electron bands [19], the study of the melting behavior of transition metals has given rise to many controversies among the different experimental and theoretical studies.
The majority of experimental works on the melting of transition metals are conducted with static, mainly using a laser-heated diamond anvil cell (LH-DAC), or dynamic techniques, using shock wave (SW) compression. Despite the numerous technological advancements that have been made in both fields during the last two decades, reliable measurements remain very challenging, especially at the high end of P-T conditions. The diverse results for different experimental approaches concerning Ta [13,20,21,22,23], Fe [14,24,25,26], Mo [13,15,27,28,29,30,31,32,33], V [34,35], Ti [13,36], Zr [37,38], or Ni [39,40,41] clearly exhibit the need for a universally established methodology.
Static techniques are limited to a pressure of a few Mbar and temperatures up to 6000 K using infrared lasers (Section 3); however, new advancements in diamond anvil cell technology such as toroidal anvils or double-stage anvils [42,43,44] may offer the possibility to achieve even higher pressures in the close future. There are several methods to observe melting inside an LH-DAC, and the results tend to be very dependent on the di-agnostic. However, it is true that some convergence has been achieved between certain methodologies, especially in recent years, as it will be discussed in Section 4.
Dynamic compression offers the possibility to measure melting data at much higher pressures by generating strong shock waves with gas guns or lasers [45,46,47]. This range of pressures is crucial for the modeling of deep planetary interiors [48]. What is particularly challenging is the diagnostics of phase transitions in the short timescales of a dynamical process [49,50]. X-ray Free Electron Laser (XFEL) facilities such as the LCLS [51,52], or the HED instrument at European XFEL [53] are specifically designed to trigger materials at multi-Mbar pressures using ns pulses and a very high brilliance beam and are expected to greatly increase the quality of obtained data.
Theoretical data only show partial agreement with the experiment. The most widely used techniques are mainly based on molecular dynamics, mainly the superheating–supercooling (one-phase) hysteresis method [54] or the solid–liquid coexistence (two-phase) approach [55,56,57]. Other methods commonly used are the free energy approach [58] or the Z method [59,60]. Each method has a different way to calculate the melting temperature and has its own advantages and disadvantages.
This review aims to collect and try to unveil most of the discrepancies between different sets of experimental melting data for transition metals that occur in static experimental techniques. The behavior of melting curves, the physics of the melting phase transition, as well as the comparison between the melting curves of transition metals, alkali metals, alkaline earths, and rare earths will be discussed in Section 2. Section 3 will discuss the static experimental techniques, starting historically with large volume pressure (LVP) apparatuses (Section 3.1) and the resistively heated DAC (RH-DAC) (Section 3.2). The main focus of this review, however, is the LH-DAC, since it is the only static technique that can provide a range of pressures and temperatures wide enough to establish reliable melting curves for transition metals. The state of the art of LH-DAC technology will be briefly presented from a point of view concerning the melting curves (Section 3.3), and the reader can address a recent review [61] for more detailed information on the LH-DAC. As mentioned, the methodology, and principally the diagnostics of melting, comprises one of the main reasons for disagreement among the different studies; thus, the different experimental approaches and melting criteria will be thoroughly presented and compared (Section 4), while the various observed phenomena and the reasons for discrepancies between measurements will be discussed in Section 5. The concluding remarks of the manuscript contain a summary and some thoughts about future perspectives (Section 6).

2. Physics of the Melting Transition

2.1. Empirical Thermodynamic Models

Concerning transition metals, the metallic bonds tend to be weakest for elements that have nearly empty or nearly full valence shells and strongest for elements with half-filled valence shells. As a result, the melting point, boiling point, hardness, or enthalpy of fusion reach a maximum around group 6.
The melting line separates the solid and liquid phases in a pressure–temperature diagram, and these two variables are related by the Clausius–Clayperon equation:
d T m d P = T Δ V L = Δ V Δ S
where Tm is the melting temperature, P the pressure, L the latent heat, and ΔV and ΔS the specific volume and entropy changes of the phase transition. This equation mainly states that the Gibbs free energies of the solid and the liquid are equal at the melting point at any pressure.
The melting curve of a metal can be expressed mathematically by the empirical Simon–Glatzel equation [62] to fit the data:
T m = T 0 ( P a + 1 ) b
where T0 is the melting point at ambient pressure, while a and b are fitting parameters. Sometimes a triple point is used in the place of T0. As a monotonically increasing function, the Simon–Glatzel equation can mainly describe melting curves that rise with pressure. The tangent melting slope is defined by Equation (1) or by the derivative of Equation (2). For most metals, the density of the liquid is lower than that of the solid, while the entropy is higher, leading to mostly positive melting slopes (i.e., the melting temperature increases with pressure) [16,22,24,29,35,36,37,39,40,63]. The situation is much more intricate for alkali metals, however, whose phase diagrams reveal complex liquid melting-curve maxima and negative melting slopes [64,65,66,67,68,69], since these elements exhibit several density discontinuities and phase transitions already in the solid phase. In this case, the Kechin equation is more appropriate to describe the melting curve [70].
One of the most important models that has been proposed to explain melting, which can also be used to calculate the melting slope, is the Lindemann criterion [71,72]:
ln T m / ln V m = 2 3 2 γ
where Tm, Vm, and γ are the melting temperature, the molar volume of the solid before melting, and the Grüneisen parameter, respectively. Equation (3) reveals that Tm increases with decreasing volume or increasing pressure. In the Lindemann melting criterion, thermal atomic vibrations increase with an increasing temperature, and melting is initiated when the vibrations become so large that the atoms invade the space of their nearest neighbors. For the sake of completion, the reader can also refer to the Born criterion [73], according to which melting occurs when the shear modulus vanishes and the crystal cannot further resist melting.
The Lindemann law is an empirical law based on investigations of simple gases at low pressures, and it is sometimes debated whether it can be used to describe the high-pressure melting curves of complex metals. In noble gases such as Ar, Kr, or Xe, the closed shell configuration (s2p6) is responsible for a steep melting curve, and something similar happens with noble metals such as Cu, Ag, or Au. However, in many cases the Lindemann law overestimates the melting curve of d-transition metals with partially filled cells, especially at higher pressures, no matter the experimental approach [30,37,74,75]. Moreover, the fact that the Lindemann law takes into account only the thermodynamic parameters of the solid phase, neglecting the liquid, can also lead to inaccurate predictions.
Often in calculations using Lindemann estimates, the Grüneisen parameter is considered volume independent. For better agreement with experimental data, γ needs to be expressed as an analytical expression of volume, with the formula γ / γ 0 = ( V / V 0 ) q being often used. However, q is not constant, but it decreases with pressure, leading to discrepancies with the experimental data [76]. It has been argued that by reformulating the Lindemann law and modeling the Grüneisen parameter as a power series of the interatomic distance [30,71], the differences between theory and experiment can be reduced significantly, although there is still lack of total agreement. However, the experimental melting of Au was well reproduced by the Lindemann model using a volume-dependent Grüneisen parameter [77].
For a more in-depth analysis of empirical thermodynamic models regarding melting and taking into account also dynamic techniques, the reader can address references [78,79,80,81,82].

2.2. Electronic Structure and Phase Behavior of Transition Metals on Melting

Figure 1a plots together the melting lines of several transition metals, obtained in an LH-DAC [15,22,24,35,36,37,63,77,83,84]. The melting curves are normalized to the ambient melting temperature T0 of each element. Since the different diagnostic methods for melting can yield different results (Section 4), the melting points in all the studies of Figure 1a have been determined using the same diagnostic (the appearance of a liquid diffuse scattering signal in synchrotron XRD, Section 4.2), except the study on Mo, which used also synchrotron XRD but defined melting by the appearance of microstructures in the quenched sample (Section 4.5). Figure 1a contains 3d, 4d, and 5d transition metals from groups 4 to 11. For the 3d (Ti, V, Fe, Ni) and 5d (Ta, Pt, Au) elements, increased electronegativity seems to lead to steeper melting lines, with Au and Pt exhibiting the steepest curves. However, this is not the case in 4d (Zr, Nb, Mo) elements, where the less electronegative Zr has the higher slope. Most melting curves are less steep at higher pressures, indicating that the volume change becomes less important with pressure.
The majority of transition metals have partially filled d-bands, which can be occupied by s- electrons via s->d electron scattering. The s-conduction electrons are less mobile since they have a higher effective mass, and this s-d electron transfer can be responsible for changes in the density of states (DOS) and the lowering of the melting curves in transition metals. It has been proposed that a small broadening of the liquid d-band (~1%) could lead to an increase in the stability of the liquid relative to the solid and thus suppress the melting slope significantly at higher pressures [85]. However, this was not found to be the case in Mo, where strong discrepancies between theory and experimental data still exist [15]. Another explanation for the low melting curves of metals with nearly half-filled d-bands such as Mo is the existence of Jann–Teller distortions which could create local structures in the liquid [86]. Elements with filled bands, and therefore a DOS that is less subject to change with melting, such as Cu or Al, have much steeper melting curves [40,85,87,88]. However, Al is characterized by sp3 bonding electrons and can be drastically different from transition metals, where d-electron physics plays a dominant role.
A factor that could also affect the behavior of the melting curve of a material is the phase from which melting occurs. In fact, it has been proposed that bcc metals (a packing ratio of ~0.68) should have lower melting slopes than fcc or hcp metals (a packing ratio of ~0.74) [13]. It has been shown that the stability of a bcc structure is favored by a Fermi energy which falls in the minimum between two peaks of the DOS. According to Figure 1a, this seems to be a general rule, with bcc Mo exhibiting the lower slope, and fcc Au, Pt, or Ni the highest. For example, eightfold coordinated bcc Mo should undergo a smaller volume change than 12-fold coordinated Ni. Electron-band calculations have shown that hcp–fcc total energy differences are smaller than the corresponding bcc–fcc differences [89]; thus, the entropy change for Mo should be greater than for Ni or Fe. By taking all these into account together with the Clayperon criterion (Equation (1)), a smaller overall melting temperature can be expected.
Transitions within a metal phase diagram also affect the melting slope. For example, a flattening of a melting curve around the triple point fcc–hcp–liquid can be expected for Fe, because of the melting entropy differences between the two solid polymorphs [90].
Moreover, d-electron bonding can be responsible for the appearance of an icosahedral short-range order, which can be energetically favored in supercooled liquids and melts [91,92]. These short-range structures depend on the number of d-electrons and are more distorted in the liquids of early transition metals than those of late transition metals [17]. Icosahedral structures in liquids have been already observed in Ta [93], Zr [94], Ni [91,92], Ti [92], and Fe [91] and can act as impurities that lower the free energy and thus the melting slope [17].
Figure 1b shows the normalized melting curves obtained in an LH-DAC with the Speckle technique [13,14,40]. All melting curves appear a lot shallower compared to the data obtained with the XRD diagnostic (Figure 1a), and in all cases the normalized Tm has a lower value at the same pressure. With this method, the melting lines of Mo and W appear almost constant after ~50 GPa. It has been shown in many works [15,24,37,84] that the Speckle method often triggers the recrystallization of the sample instead of melting, therefore underestimating the melting temperature, as will be discussed in more detail in Section 5.6. However, it is interesting to see that melting from bcc, as in the case of W, Mo or Ta, yields the smoothest melting curves, as in the case of the XRD diagnostic. The datasheets for the plots of Figure 1a,b can be found in the Supplemental Material.

2.3. Comparison with Alkali Metals, Alkaline Earths, and Rare Earths

The melting curves of alkali metals behave rather differently than those of transition metals. These elements tend to have complex phase diagrams, with successive phase transitions in the solid phase and the presence of complex liquids in the liquid phase [64,65,66,67,68,69,95]. In many cases, alkali metals exhibit melting curve maxima, followed by negative slopes, where the molar volume of the liquid is expected to be less than that of the solid. Previous studies have shown abrupt changes in the coordination numbers and density, for example in liquid Cs [96]. The complexities in both crystal structure and melting have been attributed to the effects of s->d electronic transitions for the heavier alkali metals [97], but lighter elements such as Li and Na exhibit s-p orbital mixing [98]. It has been proposed that a possible explanation for the complex structures observed in alkali metals is the formation of an energy gap at the Brillouin zone boundary that can lower the kinetic energy of free electrons and thus stabilize such structures [99].
Alkaline earths also present several unusual structures and complex phase diagrams [100,101,102]. These phenomena could be explained by the sp->d electron transfer under compression [103]. It has been found that the changes in the melting slopes of Mg, Ca, and Sr are associated with the phase transitions observed at room temperature and with the increasing d-electron character of these elements [95]. Similar to transition metals, melting from a bcc phase leads to a less steep melting curve, as in the cases of Ca or Mg [95].
In rare earths, the application of pressure generally induces an s->d transition that increases the d-electron character of the conduction band. This electronic transition is responsible for the hcp->Sm-type->distorted hcp->fcc->distorted fcc series of structural transitions in the solid phase [104]. The highly localized f-electrons do not participate in bonding, since Y exhibits the same behavior even though its f-states are empty [105]. However, low symmetry structures have been observed under pressure for Pr, Nd, Sm, and Gd, which have been attributed to the delocalization of f-electrons [106,107,108,109]. The melting curves of rare earths seem to be affected by this delocalization, showing kinks or minima in the pressure values where it occurs [104].

3. Static Experimental Techniques

3.1. Large Volume Presses (LVP)

Large volume presses (LVP) such as the piston-cylinder or the multi-anvil press [110,111] are widely used for the synthesis of materials, especially when the production of large single crystals is essential [112,113]. Record temperatures of 4050 K [114] and pressures of 90 GPa [115] have been reported for multi-anvil presses, although for most conventional devices in laboratories and synchrotrons the maximum pressure is limited to 25 GPa and the maximum temperature to 2500 K. Therefore, the routinely obtainable P-T range in the LH-DAC (or RH-DAC) is much greater than that of a multi-anvil press, but the precision to which the melting temperature can be determined in a DAC is, in general, much lower.
Inside a multi-anvil press, the heating of the sample is carried out by an internal heating method, where a small heater and electrodes are placed inside a pressure transmitting medium (PTM). Electric power is supplied to the heater from an external power supply and through the conductive anvils. Several heaters can be used, the most prominent ones being Pt, Ta, Re, LaCrO3, or graphite [116]. The sample temperature is measured by a thermocouple which is located close to the sample, and the pressure effect on the thermocouple’s electromotive force has to be estimated [117,118,119]. For the most widely used W/WRe thermocouples, a variation of 35 °C has been reported at 15 GPa and 1800 °C [119]. Thus, the temperature determination with a thermocouple is very accurate and much superior to that obtained by spectral radiometry in an LH-DAC, which usually extends to hundreds of K (Section 3.3.3). The highest temperature that can be measured with a W/WRe thermocouple is 2300 °C. Higher temperatures are measured by extrapolating the relationship between temperature and applied power.
Pressure in a multi-anvil press is measured by the P-V-T equation of state (EoS) of a pressure standard which is placed inside the assembly. This material should ideally exhibit no phase transitions, have a low relatively bulk modulus, low yielding strength (so that the deviatoric stresses are easily released upon heating), chemical inertness, high melting temperature, low grain growth rate, and low X-ray cross-section (in the case of in situ XRD measurements). The most widely used pressure standards in a multi-anvil press are NaCl, Au, Pt, and MgO. From the known pressure scales, that of MgO seems to be the least controversial since it seems to be free from the free electron contribution to the thermal pressure [120,121,122]. In general, underestimations due to thermal pressure up to 3 GPa have been calculated, which is not dramatic compared to the LH-DAC (Section 3.3.3). The reader can refer to two very detailed reviews about the technical developments in the multi-anvil press [116,123].
The signature of melting in a large volume press can be evidenced either by differential thermal measurements [124] or electrical measurements [125,126,127] (Section 4.7). In the case of an LVP coupled with synchrotron radiation, in situ XRD [128,129] can be used as a reliable melting diagnostic (Section 4.2). Melting curves at low pressures determined in an LVP for gold [127], copper [130], and nickel [125] have been reported in the literature. Multi-anvil experiments provide an adequate method for investigating melting curves for pressures up to 25 GPa.

3.2. The Resistive Heating Diamond Anvil Cell (RH-DAC)

The resistively heated diamond anvil cell (RH-DAC) [131,132,133,134,135,136,137,138] is a complementary technique to laser heating, albeit less widely used because of the generally lower temperatures obtained and the complexity that lies in preparing the DAC. In resistive heating, samples are heated by conduction with the heat source outside the sample chamber, either by an external furnace (maximum temperature around 700 K) or by a small heater close to the diamond anvils (where much higher temperatures can be achieved). Various RH-DAC techniques have been proposed that can provide temperatures above 1200 K and can be used for the melting of metals, for example gold [139]. These techniques are based on (a) graphite heaters [135,136,138], (b) Mo wires [140], (c) W filaments [134], (d) Re gasket heating [137], or (e) metal strips placed directly in the sample chamber (internal resistive heating, [139,141,142,143]). The latter technique has been proven very effective, especially when the metal strip is the sample itself, and temperatures of almost 4000 K have been reached in a study of the Fe–Ni–Si system [143]. However, RH-DAC preparation, and especially the placing of metallic contacts on a micrometer sized sample, can be very challenging. At such high extreme conditions, spectral radiometry is needed for the temperature measurement.
Resistive heating methods have been extensively used to study the melting behavior and phase diagrams of alkali metals [64,65,66,68,69] and molecular systems [144,145,146,147], which generally have much lower melting temperatures than transition metals. The pressure range in an RH-DAC is limited compared to the LH-DAC, often because of the softening of the stress-bearing components, such as the gaskets and the diamond seats. The advantage of resistive heating is the significantly improved homogeneity of the temperature with respect to laser heating. Moreover, temperature control is independent and is not affected by any changes in the physical properties of the sample or the presence of phase transitions. Another advantage is that the temperature is measured with a thermocouple (up to ~2600 K), providing much smaller error bars with respect to spectral radiometry.

3.3. The Laser Heated Diamond Anvil Cell (LH-DAC)

The laser-heated diamond anvil cell was first presented in the pioneering work of Ming and Basset [148]. This technique takes advantage of the extreme hardness and the optical properties of diamond, which is transparent in a very wide wavelength range, from gamma and X-rays to mid-infrared, allowing not only laser irradiation but also coupling with various experimental techniques, both in synchrotron facilities and in laboratories. To demonstrate the versatility of the LH-DAC, one can refer to experimental works on X-ray diffraction (XRD) [149,150,151,152,153,154,155,156,157], X-ray absorption (XAS) [158,159,160,161], X-ray fluorescence (XRF) [162], Mössbauer spectroscopy (SMS) [163,164], inelastic X-ray scattering (IXS) [144,145,146], nuclear inelastic scattering (NIS) [165], nuclear magnetic resonance (NMR) [166], and Raman [167,168,169,170,171] and Brillouin [172,173,174,175] spectroscopies or the synthesis of novel materials [176,177,178,179,180,181,182,183]. Different types of diamond anvil cells exist for different applications, but especially for the LH-DAC, the angular opening of the cell is of crucial importance, especially when coupled with experimental techniques such as XRD or Raman/Brillouin spectroscopies, but also when an off-axis laser heating geometry is in place [61].
The principle of the LH-DAC has been thoroughly described in [61] and can be shown in Figure 2. The basic concept is based on a piston-cylinder mechanism, as the two opposing diamonds are approaching each other by the application of an external force which can be generated by screws or an external membrane. The sample is confined within a metallic gasket [184], usually made by stainless steel, rhenium, or tungsten, although composite gaskets such as amorphous boron-epoxy [185] or c-BN [186] also exist and can maximize the thickness of the sample chamber during the experiment. Alternatively, beryllium gaskets are used in the case both axial and radial access in the DAC is needed [187,188]. A pressure transmitting medium (PTM) is used to fill the sample chamber and offer the best hydrostatic conditions possible. The sample irradiation is performed with an IR laser source that accesses the sample by taking advantage of the transparency of the diamonds. The emitted thermal radiation passes through the diamonds and is guided to the entrance of a spectrometer, where it is analyzed in order to provide the temperature measurement (Section 3.3.3).

3.3.1. Pressure Transmitting Medium (PTM)

Using a pressure transmitting medium in a melting experiment is of crucial importance for many reasons:
i. It introduces hydrostatic or quasi-hydrostatic pressure conditions, thus greatly reducing the deviatoric stresses and giving a better estimation of pressure [189], although shear stresses will always appear when the (pressure transmitting medium) PTM solidifies.
ii. It provides thermal insulation to the sample, since the diamond anvils are very good thermal conductors and can be a significant source of heat sink. It is practically impossible to laser-heat a sample without thermal insulation.
iii. It confines the liquid sample inside the sample chamber.
iv. It often prevents chemical reactions such as carbide formation, as it will be dis-cussed further (Section 5.7) in more detail.
Several PTM have been used in diamond anvil cells, including liquids (methanol–ethanol mixture, methanol–ethanol–water mixture, silicon oil, Daphne 7373 or 7474, fluorinert), soft solids (CsCl, NaCl, KCl, KBr, LiF), hard solids (Al2O3, MgO, SiO2), or condensed gases (He, Ne, Ar, N2), He being by far the most hydrostatic of them all [190,191]. However, He is not used in high temperature studies, since it can escape the DAC in its gaseous form at high temperatures. Moreover, the choice of a PTM in melting curve ex-periments is mainly based on three factors: (a) the PTM has to stay insulating at high pressures and temperatures; (b) it has to be inert with the sample or the diamond anvils; and (c) it has a melting curve that is steeper than the material that is being studied (Section 5.3). By taking all this information into account, solid media such as NaCl, KCl, Al2O3, SiO2, or MgO and noble gases such as Ar or Ne are the PTM that are mostly used in a laser heating melting experiment. Figure 3 gathers together all the experimentally established melting curves of the most commonly used PTM inside an LH-DAC [192,193,194,195,196,197,198].

3.3.2. Lasers

All transition metals melt above 1200 K at ambient pressure, and this range of temperatures is easily accessible with laser heating. For the studies of metals (or semiconductors), solid state lasers of near-IR wavelengths such as Nd:YAG or Nd:YLF (λ = 1.053–1.070 μm) are preferred, since they are greatly absorbed by these materials [13,22,24,25,29,34,35,37,39,40,63,77,83,84,199,200,201]. The main mechanism lies in the photon-electron interaction between the electromagnetic field of the laser and the free electrons of the metal, inducing higher energy states in the conduction bands. The thermal energy transfer process takes place during the electron–phonon collisions; immediately after the collision, the electrons may change their directions, but the electron flux remains constant in any direction. However, some fraction of the excess electron energy is transferred to the phonons during the collision process, therefore increasing the temperature.
The small penetration depth of near-IR lasers makes it essential to use double-sided laser heating in order to reduce the thermal gradients from one side of the sample to the other, which can extend to many hundreds of K [95,202,203]. In general, defocusing the beam helps in obtaining a more homogenous laser spot, thus reducing the thermal gradients. In order to reduce the thermal gradients even further, a recent method [77,204] proposed encapsulating the sample inside a boron-doped diamond micro-oven.
CO2 lasers have a much larger wavelength (λ = 10.6 μm) and thus a larger penetration depth, alleviating the need for two-sided laser heating in an LH-DAC; however, they are not well absorbed by metallic elements and are mainly used for the study of glasses, minerals, oxides, or optically transparent organic matter [205,206,207].
Most experimental works on the melting curve of transition metals have been carried out using continuous wave (CW) lasers; however, the use of pulsed lasers (“flash heating”) [15,153,199] can potentially reduce the chemical reactions (oxidation, carbide formation, reactions between PTM and sample, Section 5.7), as well as any sample instabilities inside the DAC. This technique can become more powerful if the laser pulse is synchronized with a synchrotron radiation pulse and a fast detector.

3.3.3. P-T Metrology

The pressure in an LH-DAC can be measured by using the ruby or Sm2+:SrB4O7 fluorescence methods [208,209,210,211], by the first-order Raman signal from the center of the diamond culet [212], or be derived from the thermal equation of state (EoS) of the PTM or the sample in an XRD experiment [37,84,90]. However, special care should be taken to take into account the thermal pressure Pth. It has been argued that the thermal pressure is strongly affected by the PTM used during the experiment [84]. The pressure is calculated empirically from XRD data using the following formula [84,90]:
P = P before + P after + Δ P P before T max 300 × ( T 300 )
where Pbefore and Pafter are the pressure before and after laser heating and Tmax the maximum temperature reached during the experiment. ΔP is the pressure difference between the pressure at high temperature and the pressure measured after the heating cycle [90].
The temperature measurement in an LH-DAC is performed using spectral radiometry, where the raw intensity of the collected light is given by Planck’s law, corrected for including the emissivity ε(λ) in the grey body approximation:
Planck = I ( λ , T , ε ( λ ) ) = ε 2 π h c 2 λ 5 1 exp ( h c / λ k T ) 1
In this equation, λ is the wavelength of the measured signal, ε(λ) the emissivity, h the Planck constant, k the Boltzmann constant, and T the grey body temperature. In order to be able to fit the temperature, ε(λ) is considered wavelength independent. Many complementary approaches exist for the temperature estimation using pyrometry, the Wien function and the two-color pyrometry being the most widely used [213,214].
The collected signal is analyzed by a spectrometer and sent to a CCD camera. Band pass filters are used to prevent reflections of the laser entering the spectrometer and thus saturating the CCD and perturbing the signal. The collection of the Planck radiation of the heated sample requires some sophisticated imagery and temperature measurement op-tics. Ideally, the temperature measurement and laser focusing optics should be independent. There are two main categories of optics to collect the Planck radiation: reflective (mirrors) or refractive (lenses). Reflective optics have the advantage or being almost free of chromatic aberrations, while refractive optics need the application of a numerical aperture to approach achromatic behavior, reducing the spatial resolution. However, the image quality is superior for refractive optics. Recent studies comparing the different optics have showed that the differences in the estimation of temperature are rather small [215,216].
Finally, special caution should be taken in the calibration of the optical system. By dividing the collected radiation with the system response, one can fit the spectra to the Planck radiation function. It has been argued that the absorbance of the diamonds should also be taken into account for the calibration in order to improve the accuracy of temperature measurements [217].

4. Melting Detection and Criteria

4.1. The Laser Speckle Method

One of the first diagnostics proposed to detect melting in an LH-DAC was the pioneering method of the laser speckle technique [13,14]. In this method, a visible laser (usually the 514.5 nm green line of an Argon laser) is applied to create interference patterns on the sample surface while the IR laser simultaneously heats the sample. Sometimes, visual observation of the sample surface has also been used [26,218]. Melting can be determined as the onset of convective motion with increasing temperature. Although it has been used extensively in numerous studies [13,14,16,21,40,41,201], the optical detection of melting based on speckle patterns has been questioned, especially after the development of the more recent techniques such as the in situ observation of a liquid signal in the synchrotron XRD images (Section 4.2). It has been argued that the changes in the optical properties of the sample surface that are detected with this method could also be caused by structural changes in the PTM or the sample (such as a phase transition), or chemical reactions between the sample, the PTM, and/or the diamond anvils [22,219,220]. In many cases the speckle method was found to coincide with the onset of dynamic recrystallization of the sample rather than melting [22,24,36,37] since both the high temperature recrystallization and melting processes are endothermic and thus not easily distinguishable optically (Section 5.6). However, reliable results have been obtained for low reactivity transition metals such as Cu [16].

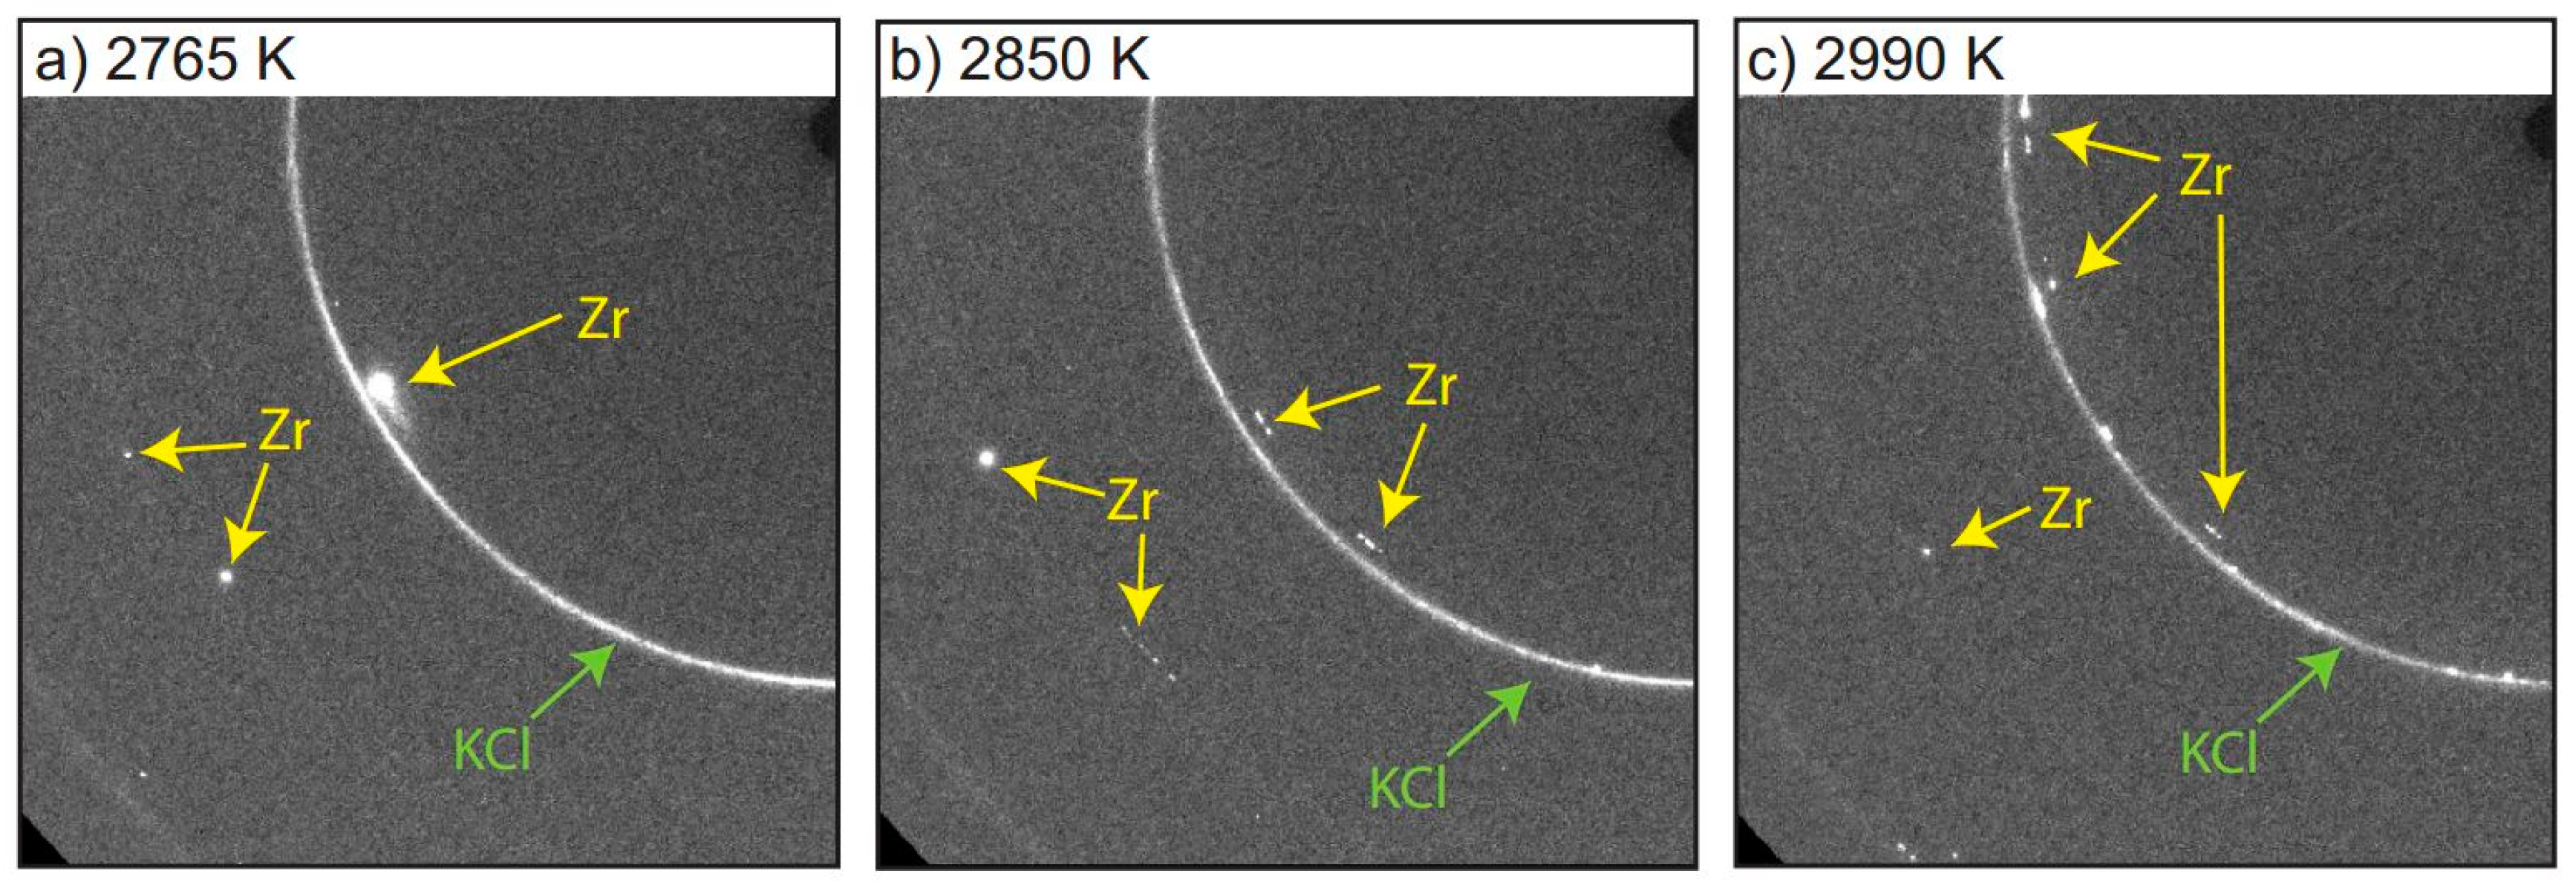
4.2. Appearance of the Liquid Diffuse Scattering Signal in the XRD Patterns

The technological advances in synchrotron facilities together with the technical developments in LH-DAC during the last 15 years have allowed the determination of the melting curves using both in situ XRD and XAS (Section 4.3) techniques. The focused X-ray beam in a high brilliance synchrotron radiation source can be reduced to a size much smaller than the size of the sample that is heated by the lasers, facilitating both the signal acquisition and the temperature determination. Concerning XRD, the melting criterion is based on the gradual appearance of a diffuse liquid X-ray scattering signal as the temperature is progressively increased [22,24,34,35,36,37,63,77,83,84,200,221], which can occur together with the disappearance of the Bragg peaks that dominate the signal of the solid phase. However, more often than not, the liquid diffuse signal appears before the complete disappearance of the Bragg peaks, indicating a partial melting of the sample. The Bragg reflections disappear progressively upon further increasing the temperature, until the XRD signal becomes fully liquid. The melting temperature is defined as the first temperature where the diffuse scattering is observed. The diffuse signal disappears on quenched diffraction pattern of the sample, i.e., when shutting off the heating (IR) lasers.
The diffuse scattering method has some remarkable advantages with respect to other methods, notably, the possibility to simultaneously detect chemical reactions and phase transitions in the sample since its structure is constantly triggered with in situ diffraction. However, it requires short exposure times and continuous monitoring of the temperature to be effective, as well as a very careful alignment of the X-ray beam, in order to ensure that the diffraction pattern is taken from the portion of the sample where the IR lasers are focused. The technique of using short exposure times (in the order of 1–2 s) has been first established for Pb and can potentially provide a more accurate determination of the various crystallographic changes in the sample [200], but the temperature fluctuations near the melting point happen in a much faster timescale (a few ms) (Section 5.1). This fact, combined with the small quantity of liquid signal that is usually observed with this method, requires very precise measurements and meticulous data analysis in order to properly detect the onset of melting. The large temperature error bars in many of the XRD melting studies [22,35,63], often calculated as the sum of the maximum error from spectral radiometry and the uncertainty on the detection of melting, clearly show that there are still several technical challenges to overcome.
Figure 4 presents an example of the solid–liquid transition upon laser heating in Zr [37] using XRD. The diffuse liquid scattering appears at a given temperature and progressively dominates the diffraction signal upon further heating, while at the same time, the solid contribution decreases, indicating that the quantity of liquid in the sample increases with temperature. In this experiment, the XRD patterns did not exhibit any parasitic phases, such as ZrC or ZrO2.
Concerning the determination of the melting curves of transition metals, this technique has shown significant discrepancies with the speckle method, providing melting temperatures that can be 1000 K higher or even more at high pressures, Ta [21,22] and Fe [14,24] being characteristic examples. As mentioned, it has been argued that the speckle method often coincides with the onset of sub-solidus recrystallization, which can be observed in the diffraction patterns as rapidly moving single crystal spots that appear at high temperatures but before the onset of melting (Section 5.6).

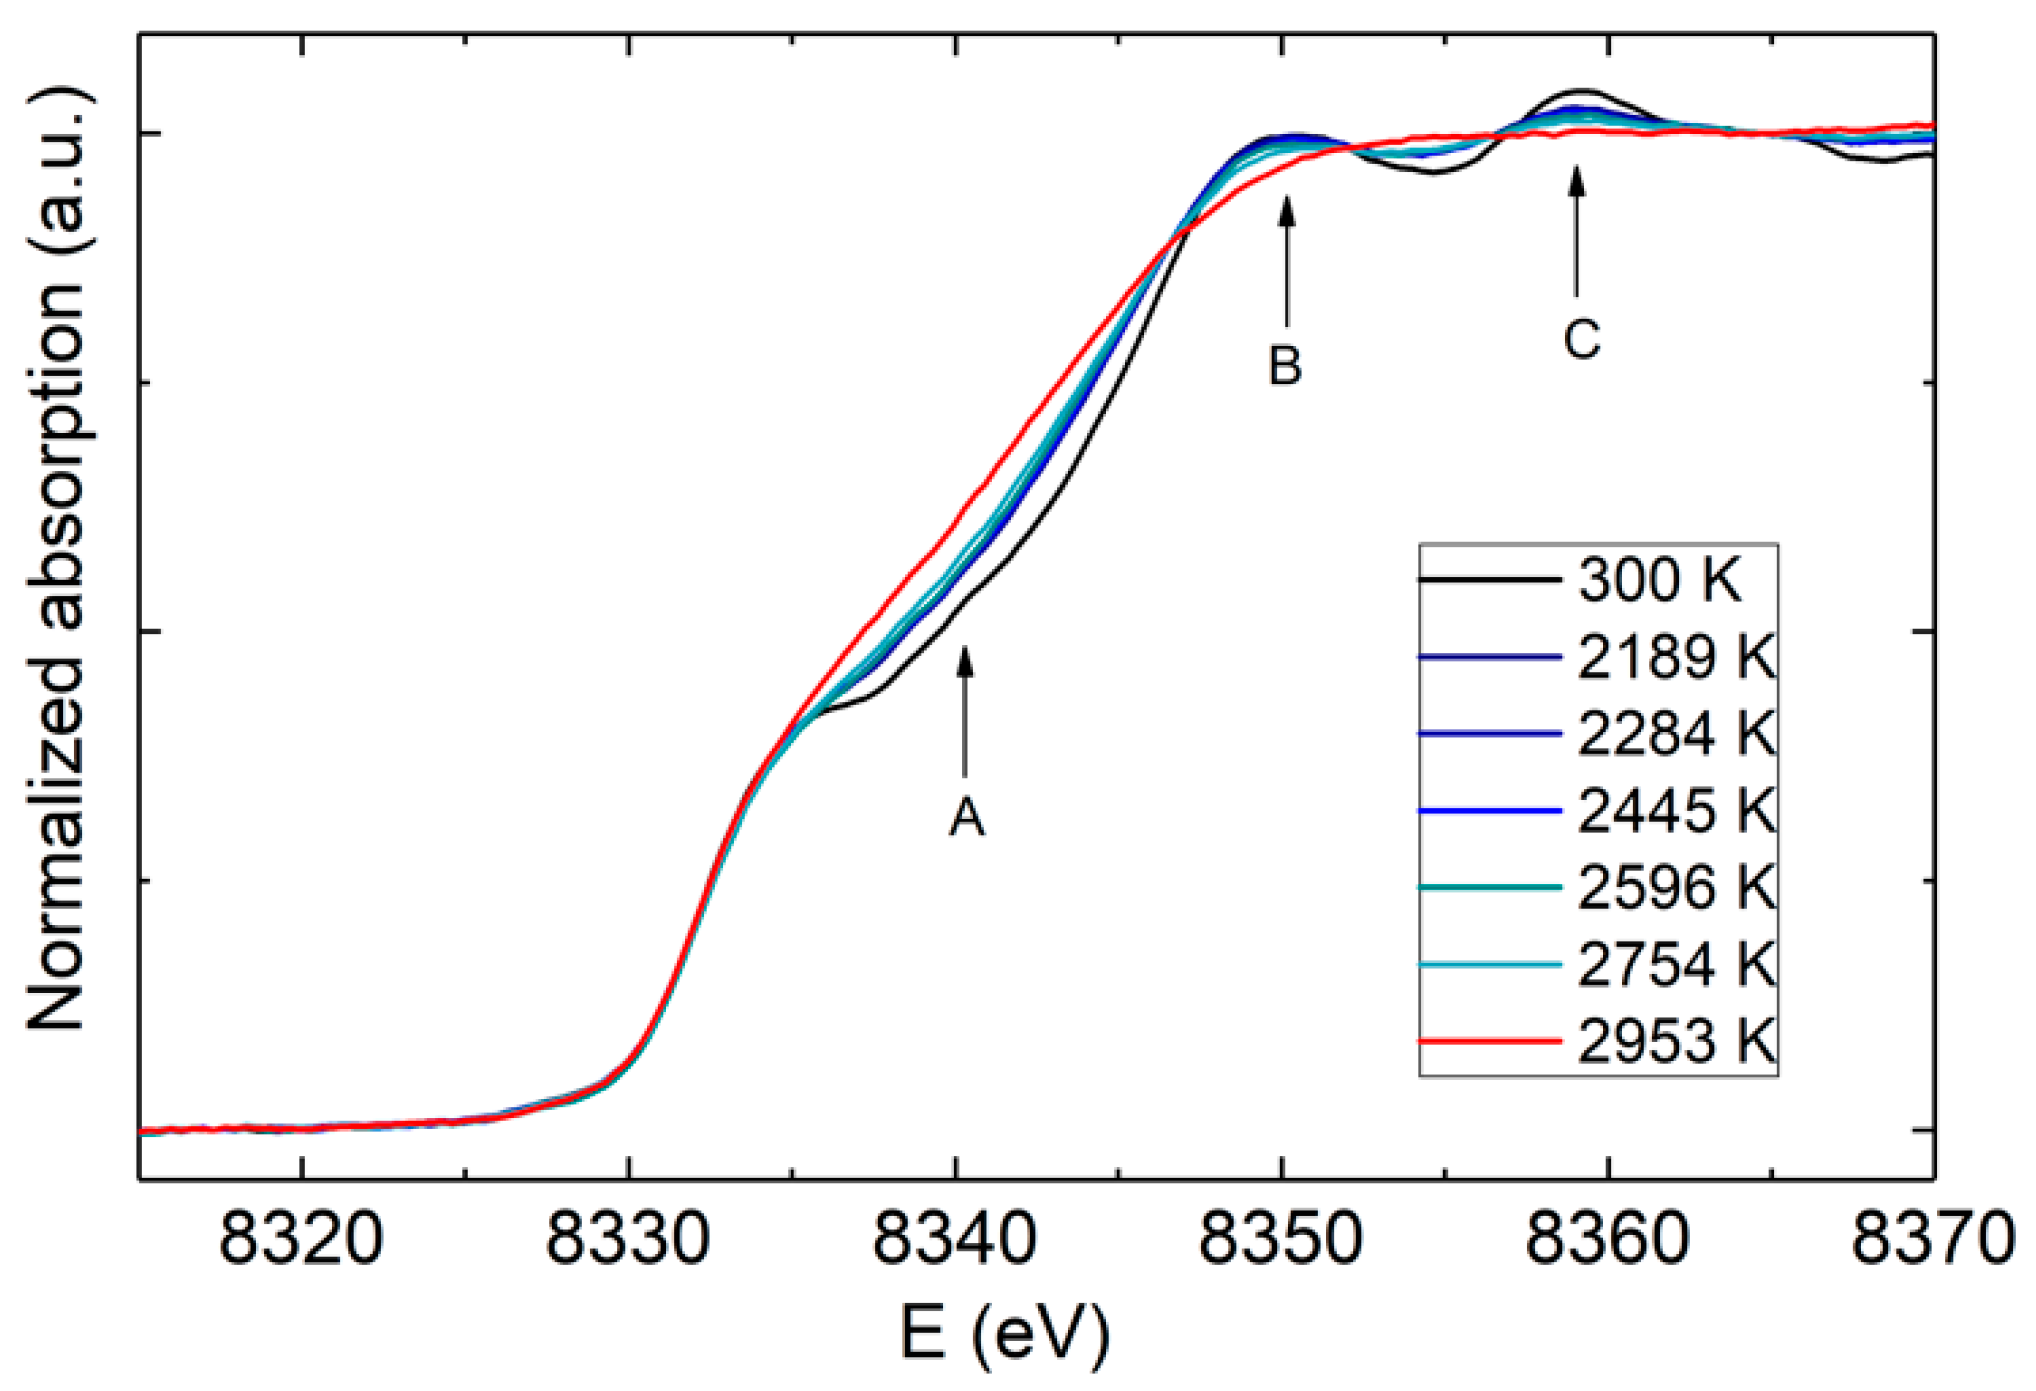
4.3. Evolution of the XAS Spectrum

While XRD can probe the long-range structural changes in a solid–liquid transition, XAS is more sensitive to the local atomic environment since it is an element-selective technique. In particular, in an XAS experiment, the EXAFS (extended X-ray absorption fine structure) part of the signal provides information about the local atomic structure, while the XANES (X-ray absorption near edge structure) part of the signal provides information about the electronic structure.
In a melting experiment, the solid–liquid transition is defined by the disappearance of the shoulder on the XANES region of the XAS signal, as well as the flattening of the first few oscillations. Such changes have been observed in the 3d transition metals Fe [25] and Ni [39], as well as in Fe binary alloys [174,175]. Melting can be also identified by the “T-Scan method” [222], where the temperature dependence of the absorption coefficient at the shoulder region of the XANES signal follows a discontinuity attributed to the loss of long-range order.
XAS is therefore a multifaceted technique that can provide interesting information about melting, but also about the local, electronic, and magnetic configuration of a transition metal at extreme conditions. As in the melting studies with XRD, fast acquisition times are also essential in XAS, and therefore a polychromatic pink beam is often used to provide the maximum flux possible [223].
Figure 5 shows the X-ray absorption spectroscopy melting criterion in a recent work on Ni [39]. The melting criterion consists of the disappearance of the shoulder feature in point A and the flattening of the two oscillations in points B and C. For Ni, the XRD and XAS criteria have been found to give similar results [39,84], proposing that melting can be detected by probing either the long-range structural changes (XRD) or the local environment (XAS) of the sample. However, the studies on Fe comparing the two methods still remain controversial [24,25]. An argument was made that these discrepancies could rely on the fact that in some of the XAS studies, carbon-contaminated Fe samples were actually measured [90], leading to lower melting temperatures. Carbon contamination is discussed in Section 5.7.

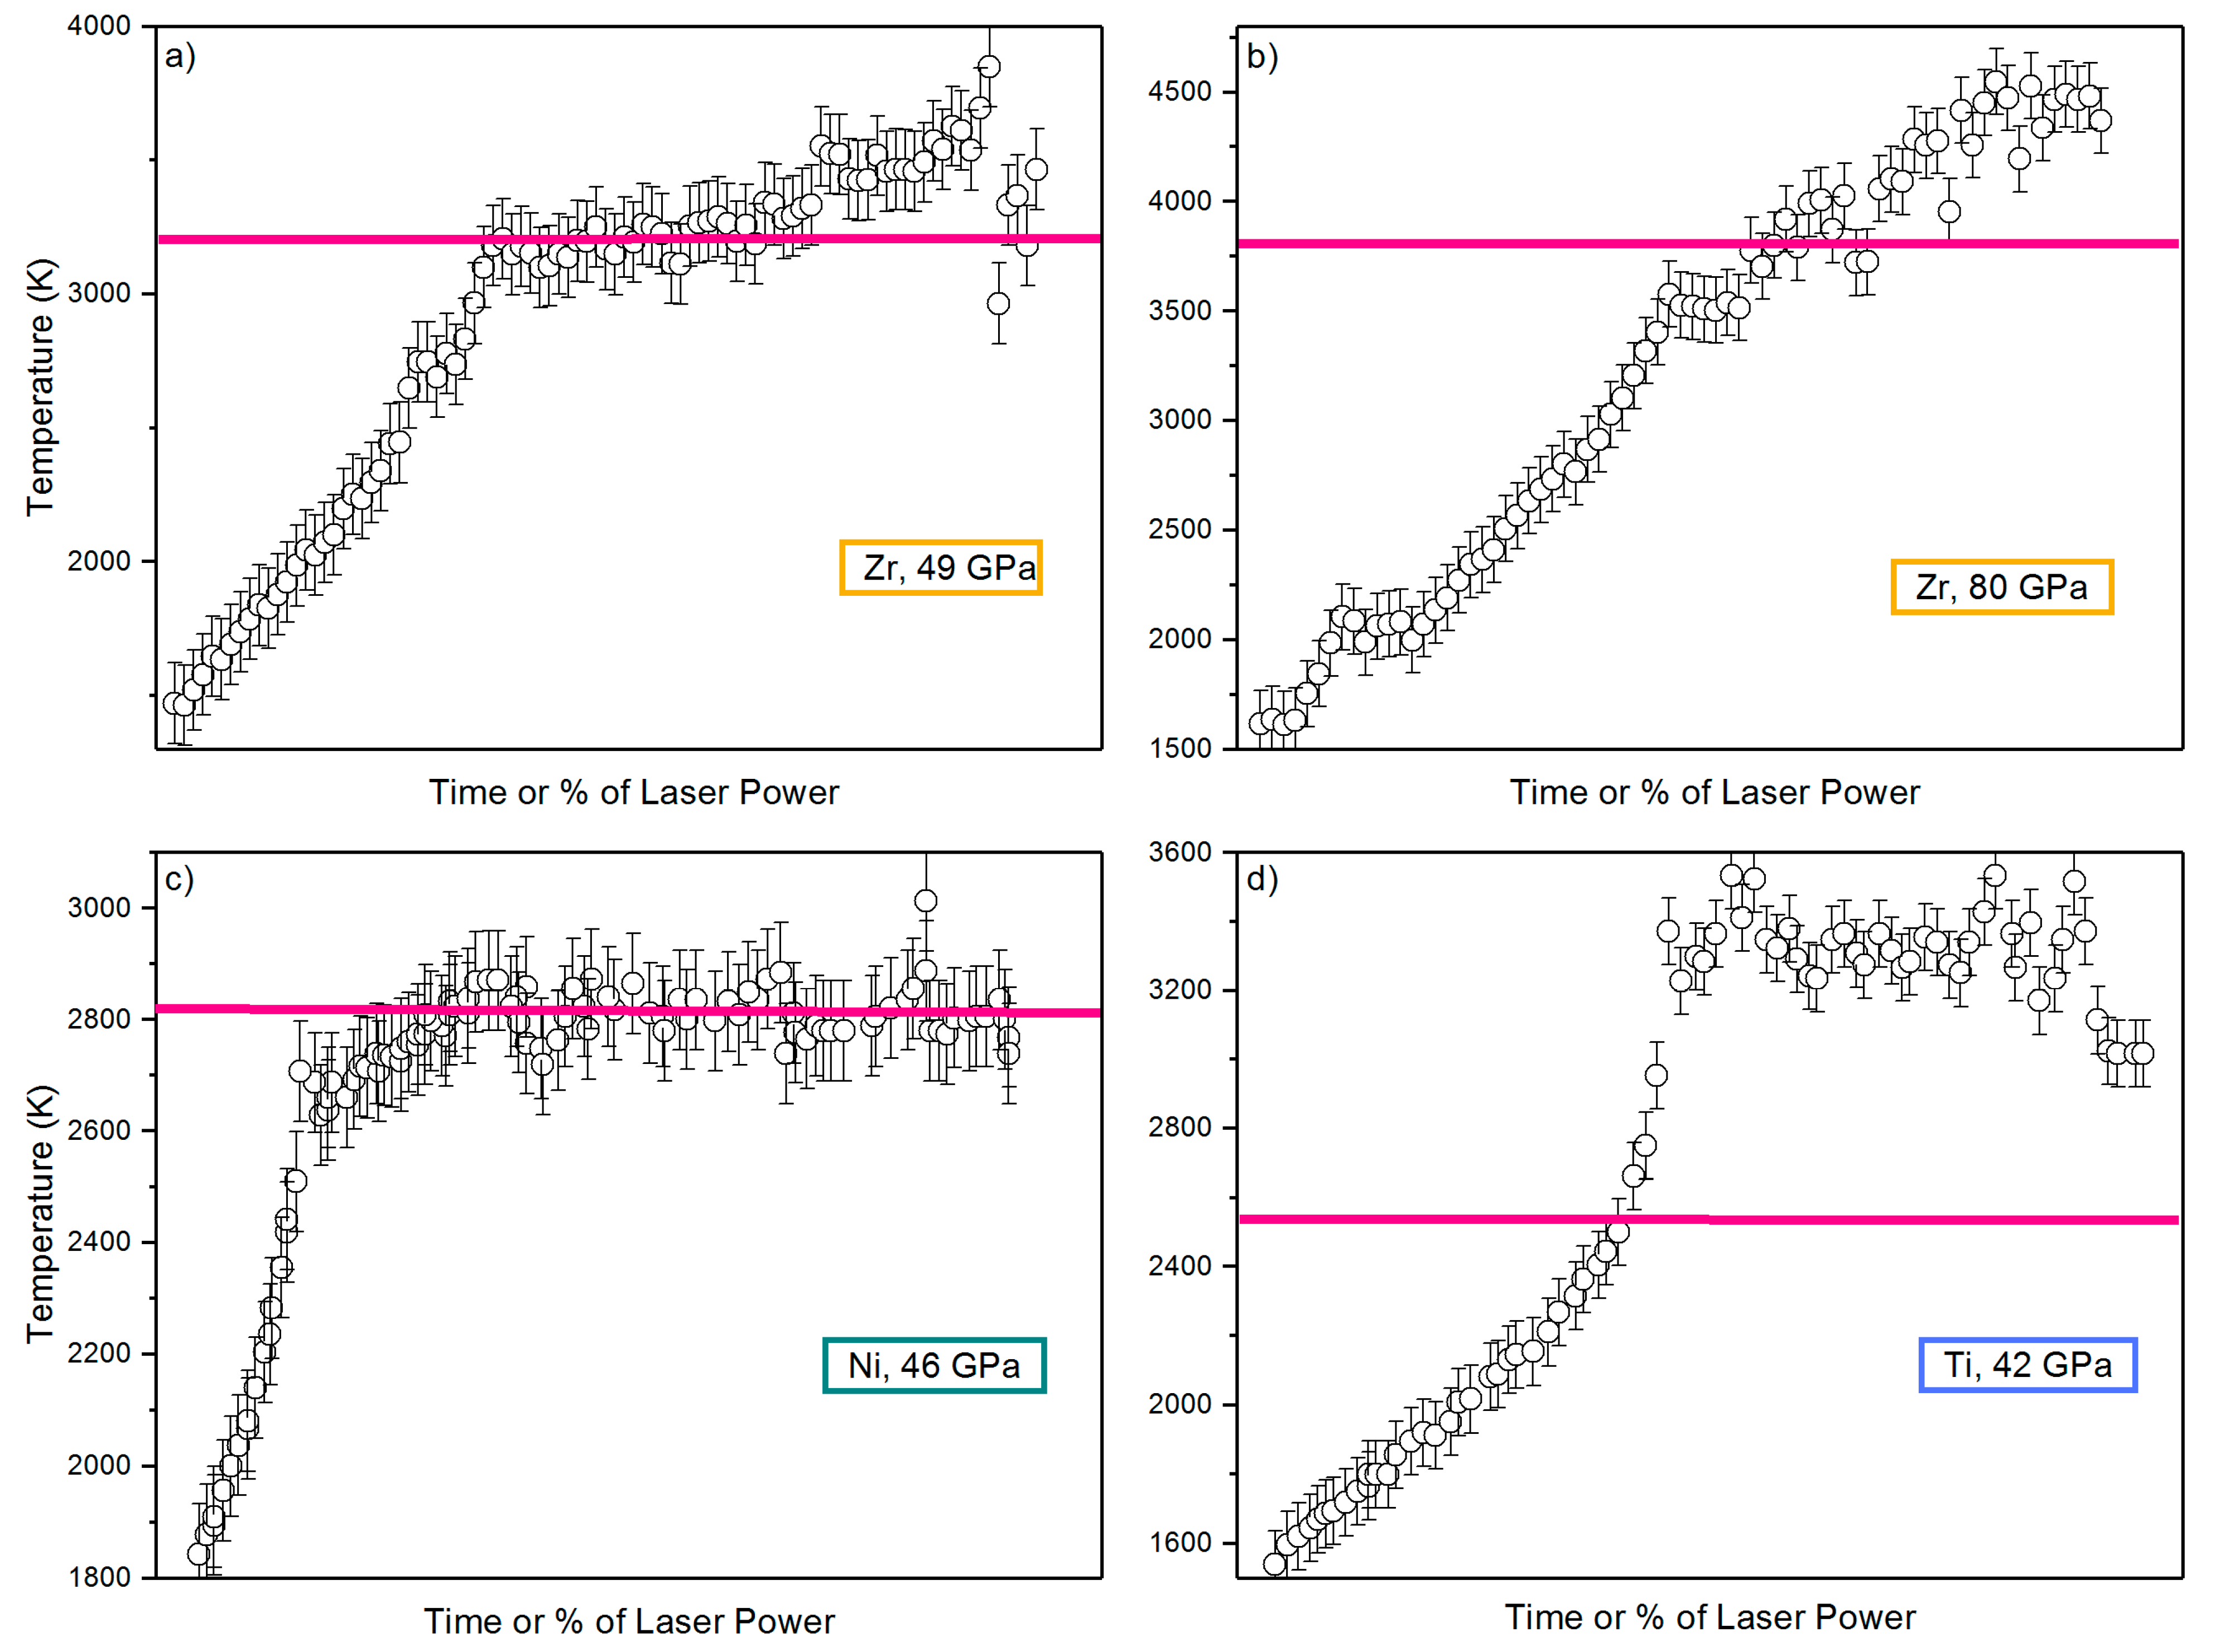
4.4. Temperature Plateaus

One of the most widely used methods for determining the melting temperature in an LH-DAC is the appearance of temperature plateaus, i.e., the temperature stays relatively stable near the melting point as the laser power continues to increase (in most cases in linear increments). This technique requires regular monitoring of the temperature (every few seconds) and is used often in laboratories when there is no possibility to obtain information about melting from an in situ technique, as is the case in a synchrotron experiment.
It has been proposed that after a certain point, the increasing laser power should only increase the volume of the melt, than raise the temperature of the molten material, given that the laser provides the latent heat of melting so that plateaus should normally be expected at any invariant melting point [128]. It is true that this method has provided relatively accurate results that have been verified in many cases with other melting diagnostics such as the detection of liquid diffuse scattering in an XRD or the disappearance of some XANES characteristic features in an XAS experiment [39,83,84,224]. An agreement of less than 100 K in the melting temperature was found between this method and the XRD method for Ni [84] and Nb [83], and a similar order of magnitude has been found for Ni measured with XANES [39]. However, in several works the temperature plateau was not observed at all or corresponded to a different temperature than the melting temperature Tm [22,36,37]. Figure 6 compares the Tm vs. laser power functions for different transition metals in order to clarify these differences.
It is clear from Figure 6 that this melting criterion is not applicable to all studies. Temperature plateaus can appear at T=Tm (Figure 6a,c) T<Tm (Figure 6b), or T>Tm (Figure 6d). The trend can be different even for the same material, depending on the pressure or the heating run (Figure 6a,b). The range of temperature differences may also vary; for example, in Zr (Figure 6b, [37]), a melting using the temperature plateau criterion seems to appear at about 300 K before the XRD criterion, while for Ti (Figure 5d, [36]), melting was detected at a temperature almost 900 K higher.
It has been proposed that the latent heat of melting is insignificant with respect to the heat provided by the lasers [203]. In fact, there can be several reasons why the temperature–laser power relationship can change inside an LH-DAC:
i. Discontinuities in the reflectivity of the sample. The reflectivity cannot be a reliable indicator of melting since it is not an intrinsic property of materials.
ii. Increase in the conductivity of the PTM with the increasing heat provided by the lasers could also explain why the temperature is not always increased with laser power.
iii. The thickness of the PTM can change during an experimental run, which can affect the thermal insulation and the heating efficiency inside the LH-DAC. As a result, more laser power may be needed to heat the sample at a given temperature.
iv. A temperature plateau can appear because of the melting of the PTM (Section 5.3).
v. The melt may become mechanically unstable and flow, leading to sudden variations in temperature.
All of the above characteristics and parameters are very difficult to be calculated in situ in order to quantify their effect on the temperature of the sample. Therefore, the observation of temperature plateaus, although efficient in many cases, cannot be considered by itself a consistently reliable method, and often the use of a complementary diagnostic is advised.

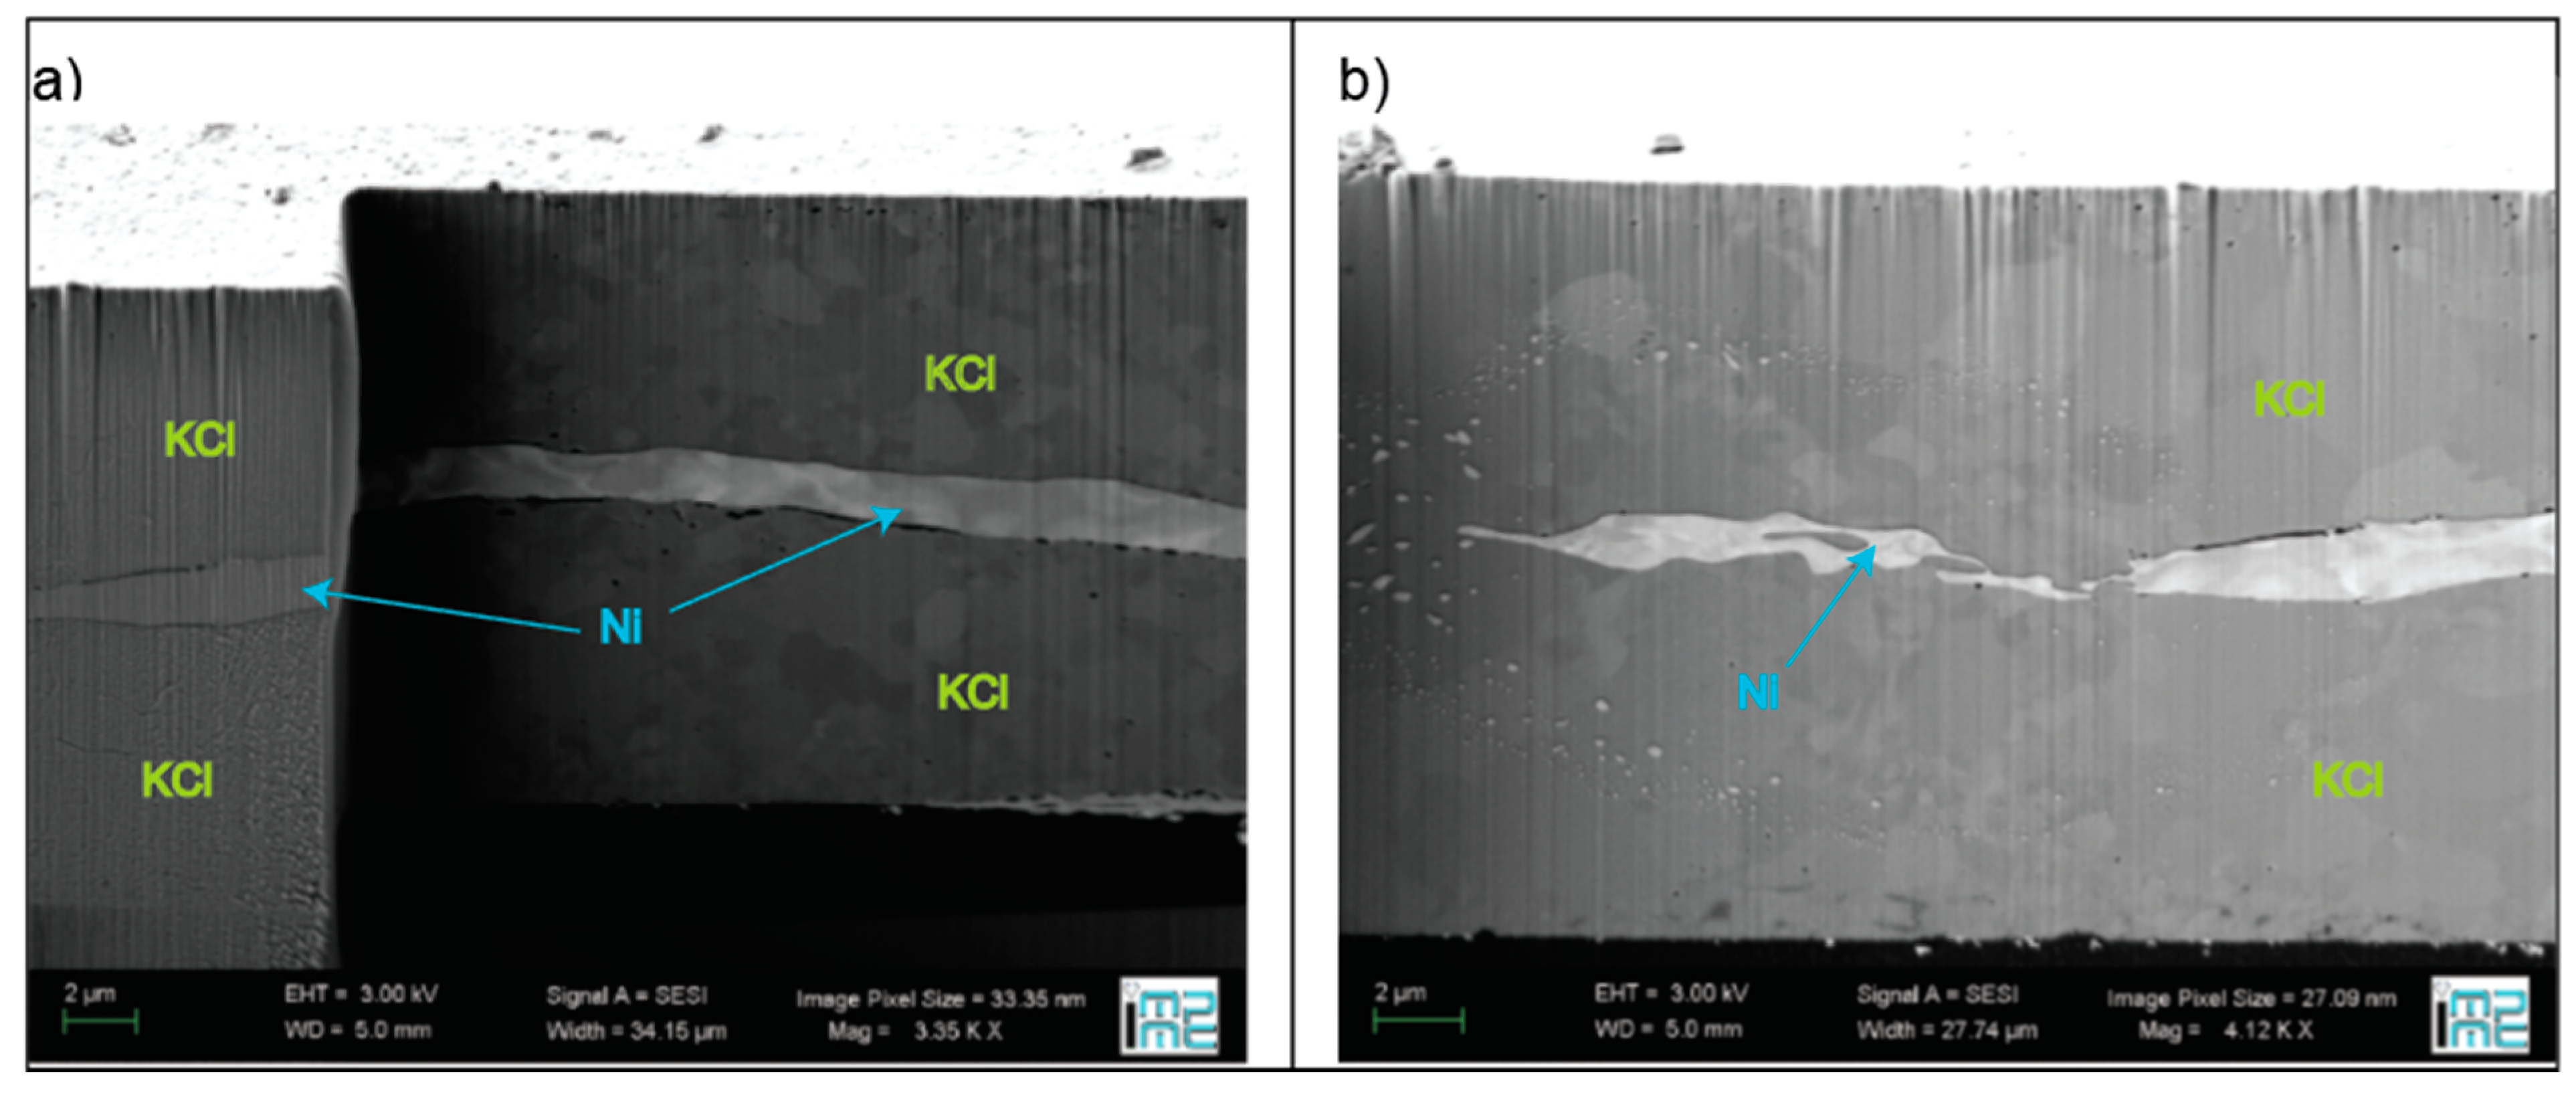
4.5. Microstructure Formation on the Quench

A recent work [15] has demonstrated a new melting criterion by studying the microstructure formation of a Mo sample in a DAC using flash laser heating synchronized with X-ray diffraction and a fast detector. This approach is based on the observation that heating above the melting point followed by a quench could reduce the grain size of polycrystalline samples, sometimes to an nm scale, while quenching from annealing (i.e., heating below melting) generally increases the grain size [225]. The importance of using a short laser pulse duration (5–20 ms) lies in the fact that the changes in the microstructure of the sample happen in small steps, providing the opportunity to observe the changes in the diffraction patterns in a detailed way.
In this study [15] the sample was heated at different temperatures, measured by spectral radiometry, and then quenched. It has been observed that when quenched from a temperature below Tm, the diffraction single crystal spots were preferentially oriented in relation to the diffraction spots of MgO that has been used as the PTM. However, when quenched from a temperature above Tm, the diffraction images feature a fine-grained, randomly oriented microstructure (continuous Debye diffraction rings). With this technique, the authors were also able to track a microstructural transition in Mo that could be responsible for the lower melting temperatures reported in previous works [13,29,30].

4.6. Post-Heating Scanning Electron Microscopy (SEM)

The argument of obtained melting can be greatly reinforced by validating the experiment with post-heating characterization after the quenching of the sample, outside the LH-DAC. One of the existing possibilities is to study the surface of the heated spots with scanning electron microscopy (SEM) [199,226]. Drastic changes and bead-like features appear on the sample surface topography near the melting temperature. By careful examination of the SEM images in a recent work on Re and Mo, micrometer or sub-micrometer size recrystallization of the sample can be shown for T<Tm, while for T>Tm the metal seems completely restructured with a boundary between the quenched liquid and the unmolten sample to a depth of several micrometers [199]. These observations are in contrast to the data acquired by the previous approach (Section 4.5) as the melting point found for Mo in [199] seemed to coincide with the recrystallization region in [15]. The discrepancies have been attributed to a microstructure transition that has been discovered for Mo [15].
A depth profile analysis of molten or unmolten regions can be also performed in a cross-section of the heated portion of the sample. The cross-section has to be prepared with a focused ion beam (FIB) [199,226]. In a recent work on Ni [39], the cross-section of the heated spot where the sample remained solid (Figure 7a) was found to be drastically different from the cross-section of the heated spot where the sample melted (Figure 7b). In fact, sharp boundaries extending to a few micrometers in depth were reported for the molten sample (Figure 7b). Energy dispersive X-ray spectroscopy (EDX) performed routinely on the samples did not show any chemical changes. In this work, KCl was used as a PTM, and as it is clear from Figure 7a,b, there are no significant differences in its morphology above or below the melting temperature of the sample.

4.7. Changes in Resistivity

Phase transitions in a material can be often detected by changes in its physical properties. In a metal, the resistivity R generally increases with temperature T, but kinks will be observed near a phase transition region, for example, an increase in the slope of R versus T. The abrupt increase in a metal’s resistivity with melting can be attributed to the loss of long-range order and thus the increased scattering of conduction electrons. Of course, such an increase in resistivity could also happen because of chemical contamination, but this possibility can be excluded by performing complementary diagnostics such as XRD, SEM, or EDS (Electron Dispersive Spectroscopy). Temperature or resistivity fluctuations can also be attributed to changes in the morphology of the sample upon melting [227].
The melting of several metals inside a DAC using this method has been obtained with good reproducibility by applying either resistive heating with graphite heaters and a four-point configuration [87,133] or laser heating [228]. For the LH-DAC, a split gasket method [229] has been employed, where two pre-indented steel gaskets were joined with a diamond filled epoxy cement that served as an insulator. The electrical leads soldered to the two gasket halves permitted the resistivity measurement. The LH-DAC resistivity method has given access to high pressures and temperatures. However, this kind of experiment remains very challenging, and the values of resistivity or thermal conductivity of metals in a DAC have been a subject of open debate [228,230,231].

4.8. Synchrotron Mössbauer Spectroscopy (SMS)

Recent technological developments in fast spectroradiometry and synchrotron technology have opened up the possibility of couple laser heating with synchrotron Mössbauer spectroscopy (SMS) to identify the melting of metals [164,232,233]. This method has mainly been demonstrated for 57Fe [234,235] but can also be effective with other nuclear resonant isotopes. The diagnostic of melting relies on the dynamics of Fe atoms in a time window comparable to their nuclear lifetime. This is reflected in the reduction of the effective thickness of the sample and the collapse of the Mössbauer signal in the liquid phase. The ordering of atoms is irrelevant for SMS, in antithesis with other synchrotron techniques, for example XRD. In XRD, the scattering process is very fast and non-resonant, so that atomic motions become irrelevant. The Mössbauer signal, on the other hand, is very sensitive to the movement of the iron nuclei.

5. Sources of Controversies in the Melting Curves of Transition Metals from Static Experiments

5.1. Temperature Determination in the LH-DAC

The LH-DAC, although being the technique that can provide access to the highest temperatures and pressures possible in the static compression regime, could potentially yield error bars of a few hundreds of K in the estimation of temperature for several reasons:
i. The lasers can be unstable, especially near but below the melting temperature, and these fluctuations can alter the temperature within small time domains. It has been found that even a ~0.3% laser power fluctuation can lead to temperature fluctuations of up to 200 K [218,236].
ii. Spectral radiometry measurements can be complicated to perform and are strongly dependent on the wavelength region chosen to perform the Planck fit. The methodology for the temperature measurement inside a DAC using spectral radiometry, including the use of different optics, has been discussed in detail [213,214,215,216,217].
iii. Especially at lower temperatures (below 1400 K), there are not enough photons, and the Planck signal is difficult to detect. Larger acquisition times are needed which can lead to larger temperature error bars due to instabilities.
iv. It is crucial that the temperature measurement is taken from the same area of the sample that is heated by the lasers. In synchrotron radiation, this has been solved by perforating a polished mirror at the entrance of the spectrometer and aligning the X-rays to the hole using X-ray fluorescence [150,152,153,158]. Defocusing the IR lasers for a larger and more uniform heating spot can be also helpful.

5.2. Thermal Pressure Determination

In a melting experiment, the thermal pressure Pth has to be carefully estimated for every data point by the thermal equation of the sample or the PTM, but this can be a challenge in experiments where there is no possibility to perform in situ XRD. Pressure scales such as the fluorescence of the ruby or Sm2+:SrB4O7 or the Raman of the diamond are not anymore valid at the high temperatures required for the melting of metals either because the signal is dampened or because the thermal radiation dominates the signal. In the absence of an XRD signal in order to determine the thermal EoS and therefore the pressure, the uncertainties can be minimized by measuring the pressure before and after the heating of the sample, but the error bar in the pressure determination can still be quite large.

5.3. Melting of the PTM

The selection of the PTM, apart for the reasons mentioned above (Section 3.3.1), is crucial for both temperature and melting determination, since the melting of the PTM prior to the melting of the sample could either hinder the fusion of the sample or give false signature of melting [22,84,198,224]. For example, spectral radiometry measurements can exhibit a temperature plateau (Section 4.4) with increasing laser power at the PTM melting temperature, confounding the experimental results. The pyrometry measurements are affected by the presence of molten PTM in the sample chamber, mainly because of changes to its optical properties (emissivity, absorption). Movements of the sample in the molten PTM and changes in spatial temperature distribution could underestimate the temperature by few hundreds of K. Moreover, the molten PTM could potentially give a diffuse signal in an XRD experiment, leading to a confusing interpretation of the data, since it could not be clear whether the liquid signal derives from the sample or the PTM. Therefore, the PTM has to be selected in a way that its melting curve is steeper and does not overlap with the melting curve of the sample.

5.4. Misalignments of the X-ray beam

During a melting experiment, it is crucial that the temperature is measured at exactly the same area of the sample that is triggered with the melt detection probe. This is especially important in Synchrotron experiments (for example XRD, XAS, or SMS), where the probe (i.e., the X-ray beam) is rather small, usually on the order of 2–3 microns. During laser heating, the optics may drift due to thermal expansion, and the X-rays are no longer triggering the same location of the sample where the temperature measurement is acquired.
The heating laser should also be very well aligned with the X-rays, and this is normally achieved by reducing the focusing of the laser in order to have a hotspot much larger than the X-ray beam (i.e., a laser spot of 10–20 microns for a 2–5 micron x-ray beam). However, in some cases, at the high temperatures required for melting the sample may move, meaning that the X-ray beam and the hotspot are no longer in the same place. Therefore, meticulous and continuous realignment of both the optics and the X-ray beam is required in order to obtain reliable measurements.

5.5. Additional Sources of Diffuse Scattering

The diffuse liquid scattering detected from XRD (Section 4.2) needs to be properly analyzed to avoid misinterpretations since the molten signal is often weak and can be masked by other factors. The Compton scattering arising from the diamonds in LH-DAC or RH-DAC can in some cases dominate the liquid diffraction signal, and it is therefore advised to be removed by subtracting the background signal of an empty DAC, before or after the experiment. Removing the Compton background may be less crucial for melting curves than it is for the determination of the liquid structure using a pair distribution function (PDF), but it can be important in cases where the molten region is too thin to create a measurable XRD signal. Thus, the quality of the obtained data can be improved using this technique [77]. As mentioned in Section 5.3, the melting of the PTM could also be a source of additional diffuse scattering, and the selection of the proper PTM is very important. Finally, extra care should be taken not to interpret glass formation as a liquid signal, given that many transition metals are known to form metallic glasses at high temperatures [1]. Usually, the possibility of glass formation can be eliminated by the absence of diffuse scattering in the quenched XRD pattern.

5.6. Fast Recrystallization for T < Tm

In static experiments, most controversial results come from the comparison of speckle (Section 4.1) and XRD (Section 4.2) methods in the LH-DAC, which are the two most widely used techniques to determine melting. It has been argued today that the main difference between the two methods relies on the phenomenon of “fast recrystallization” of the sample that occurs prior to melting [15,24,35,36,37,63,83,200]. The recrystallization process from a recent experiment on Zr [37] can be shown in Figure 8, where XRD patterns were collected every few seconds as the temperature of the sample was progressively in-creased. The diffraction patterns clearly show polycrystalline Zr spots that move and change in intensity with increasing temperature. This permanent reorientation of the crystal is due to movements in the surface of the sample, and it happens at temperatures of almost 1000 K before melting in some cases. The signature of melting comes much later with the appearance of liquid diffuse scattering. The quenched diffraction pattern (i.e., the one obtained after switching off the lasers) after melting shows a fine grain structure in good agreement with other methods using XRD [15].
Fast recrystallization and melting are both endothermic processes and cannot be distinguished easily by detecting the movements of the sample surface. Therefore, it is possible that earlier speckle works underestimated the melting curves of transition metals since they did not take into account the phenomenon of fast recrystallization. By using the complementary synchrotron technique of XAS, agreement of the melting temperature with XRD has been found in the case of Ni [39,84], proposing that melting detection can be performed either by probing the local atomic environment (XAS) or the long-range structural changes (XRD) in the sample. However, the works on Fe were controversial [24,25], and more experimental data need to become available to verify any possible convergence between these two methods.

5.7. Chemical Reactions and Carbide Formation

At the very high temperatures that are generated inside an LH-DAC, especially when using CW lasers, carbon contamination of the sample from the diamond anvils is highly possible. Several transition metals have the ability to form carbides, notably, Fe (Fe3C) [237] and Ta (TaC) [22], and carbide formation has been found to be the source of large discrepancies between different results, leading to an underestimation of the melting curve by many thousands degrees K [21,22]. Melting studies using in situ XRD can identify this problem and detect carbides or any other unwanted phases that are formed due to chemical reactions in the sample chamber, even in very small amounts. Raman spectroscopy is also a method that can be very sensitive to element detection, but the low Raman cross-section of metals, combined with the high fluorescence of the diamonds and the intense incandescent thermal radiation that dominates the signal, requires surface-enhanced and time-resolved techniques, making such experiments extremely complicated [168,238].
Carbon contamination may be caused by the diffusion of carbon from the gasket or anvil through the pressure medium and into the crystalline sample prior to melting. Choosing an inert PTM is therefore critical. Water in the PTM can also be a cause of chemical reactions; thus, a technique to reduce the humidity relies on heating the DAC before the experiment (for example, putting it in an oven for 1 h at 100 °C) [37,39,239].
Another way to minimize the chemical reactions is time constraining the heating duration to a few milliseconds with the use of a pulsed laser [15,199], but a recent work has detected carbon diffusion in both continued and pulsed laser heating [239]. Encapsulating the sample in a single crystal PTM such as MgO can also significantly reduce the lateral diffusion of unwanted elements in the sample chamber [15].

6. Concluding Remarks

The scope of this manuscript is to provide adequate information to the reader about the high-pressure melting curves of transition metals that are obtained with static compression techniques. In particular, the results from many static melting experiments have been collected and compared in detail, and the discussion about the thermodynamic models and the physics of the melting transition has tried to point out the main trends about the melting behavior of d-transition elements. This review focuses naturally on datasets obtained by the LH-DAC since it is the most widely used technique for melting experiments, offering access to a wide P-T region, but comparisons with other static methods (notably LVP and RH-DAC) were also made.
The advantages and drawbacks of the various experimental methods and melting criteria have been thoroughly discussed, as well as the main sources of controversies between the different datasets. The melting of transition metals is a very wide subject, and even though many significant technical developments have been carried out in the recent years concerning sample preparation [77,204], laser heating [164,204,239], pressure generation [42,43,44], temperature estimation [215,216], and synchrotron radiation [15,233], there is still lack of consensus between the different experimental techniques. All of this concentrated effort, however, could result in reducing some of the main problems that are present in the study of melting curves today, especially inside an LH-DAC. Obtaining data at pressures above 1 Mbar is crucially important since most of the melting curves use extrapolation to predict the behavior at higher pressures, which is not always reliable. More sophisticated sample assemblies and control of both the sample and PTM thickness could also result in better heating efficiency and insulation inside the DAC and help (together with fast temperature measurement techniques) to reduce temperature gradients. Fast diffraction measurements and flash heating could cut down (but probably not completely eliminate) chemical reactions. Finally, it may be very interesting to see if a sub-micrometer X-ray beam, as it is the case with new generation synchrotrons in the very near future, could yield more precise results. The same can be said for dynamic compression studies using time-resolved X-ray radiation in the new FEL facilities, which may potentially bridge the gap between differences in static and dynamic techniques.

Supplementary Materials

The following are available online at https://www.mdpi.com/article/10.3390/cryst11040416/s1, Table S1: Spreadsheets for all the data of Figure 1a. Only in situ XRD data are shown (i.e., not off-line obtained melting). Table S2: Spreadsheets for all the data of Figure 1b. Only in situ measurements are shown.

Funding

This research received no external funding.

Institutional Review Board Statement

Not Applicable.

Informed Consent Statement

Not Applicable.

Data Availability Statement

Data is contained within the article or Supplementary Material.

Acknowledgments

I wish to thank the three reviewers for their insightful comments and suggestions that have contributed to the improvement of the manuscript. I would also like to thank Silvia Boccato for help with Figure 5 and Figure 7. I acknowledge the European Synchrotron Radiation Facility (ESRF) for provision of synchrotron radiation within Projects HC-2799 and HC-2554. Analysis of the recovered samples was performed with the help of Imène Estève at the Focused Ion Beam (FIB) and Scanning Electron Microscope (SEM) facility of the Institut de Minéralogie et de Physique des Milieux Condensés, supported by Région Ile de France grant SESAME 2006 I-07-593/R, INSU-CNRS, INP-CNRS, University Pierre et Marie Curie - Paris 6, and by the French National Research Agency (ANR) grant ANR-07-BLAN-0124-01.

Conflicts of Interest

The author declares no conflict of interest.

Abbreviations

The following abbreviations are used in this manuscript:
CWContinuous Wave
DOSDensity of States
EDSElectron Dispersive Spectroscopy
EoSEquation of State
EXAFSExtended X-ray Absorption Fine Structure
FIBFocused Ion Beam
IRInfrared
LH-DACLaser Heated Diamond Anvil Cell
LVPLarge Volume Press
PDFPair Distribution Function
PthThermal Pressure
PTMPressure Transmitting Medium
RH-DACResistively Heated Diamond Anvil Cell
SEMScanning Electron Microscopy
SMSSynchrotron Mössbauer Spectroscopy
SWShock Wave
TmMelting Temperature
XANESX-ray Absorption Near Edge Structure
XASX-ray Absorption Spectroscopy
XFELX-ray Free Electron Laser
XRDX-ray Diffraction

References

  1. Wang, W.H.; Dong, C.; Shek, C.H. Bulk metallic glasses. Mater. Sci. Eng. R Rep 2004, 44, 45–89. [Google Scholar] [CrossRef]
  2. Motta, A.T.; Yilmazbayhan, A.; da Silva, M.J.G.; Comstock, R.J.; Was, G.S.; Busby, J.T.; Gartner, E.; Peng, Q.; Jeong, Y.H.; Park, J.Y. Zirconium alloys for supercritical water reactor applications: Challenges and possibilities. J. Nucl. Mater. 2007, 371, 61–75. [Google Scholar] [CrossRef]
  3. Liu, X.; Chu, P.K.; Ding, C. Surface modification of titanium, titanium alloys, and related materials for biomedical applications. Mater. Sci. Eng. R Rep. 2004, 47, 49–121. [Google Scholar] [CrossRef] [Green Version]
  4. Suryanarayana, C. Mechanical alloying and milling. Prog. Mater. Sci. 2001, 46, 1–184. [Google Scholar] [CrossRef]
  5. Yap, C.Y.; Chua, C.K.; Dong, Z.L.; Liu, Z.H.; Zhang, D.Q.; Loh, L.E.; Sing, S.L. Review of selective laser melting: Materials and applications. Appl. Phys. Rev. 2015, 2, 041101. [Google Scholar] [CrossRef]
  6. Boyer, R. An overview on the use of titanium in the aerospace industry. Mater. Sci. Eng. A 1996, 213, 103–114. [Google Scholar] [CrossRef]
  7. Alfe, D.; Gillan, M.J.; Price, G.D. Temperature and composition of the Earth’s core. Contemp. Phys. 2007, 48, 63–80. [Google Scholar] [CrossRef]
  8. Allègre, C.J.; Poirier, J.-P.; Humler, E.; Hofmann, A.W. The chemical composition of the Earth. Earth Planet. Sci. Lett. 1995, 134, 515–526. [Google Scholar] [CrossRef]
  9. Antonangeli, D.; Siebert, J.; Badro, J.; Farber, D.L.; Fiquet, G.; Morard, G.; Ryerson, F.J. Composition of the Earth’s inner core from high-pressure sound velocity measurements in Fe–Ni–Si alloys. Earth Planet. Sci. Lett. 2010, 295, 292–296. [Google Scholar] [CrossRef] [Green Version]
  10. Badro, J.; Côté, A.S.; Brodholt, J.P. A seismologically consistent compositional model of Earth’s core. Proc. Natl. Acad. Sci. USA 2014, 111, 7542–7545. [Google Scholar] [CrossRef] [Green Version]
  11. Hirose, K.; Labrosse, S.; Hernlund, J. Composition and State of the Core. Annu. Rev. Earth Planet. Sci. 2013, 41, 657–691. [Google Scholar] [CrossRef]
  12. Landa, A.; Söderlind, P.; Ruban, A.V.; Peil, O.E.; Vitos, L. Stability in bcc Transition Metals: Madelung and Band-Energy Effects due to Alloying. Phys. Rev. Lett. 2009, 103, 235501. [Google Scholar] [CrossRef] [PubMed]
  13. Errandonea, D.; Schwager, B.; Ditz, R.; Gessmann, C.; Boehler, R.; Ross, M. Systematics of transition-metal melting. Phys. Rev. B 2001, 63, 132104. [Google Scholar] [CrossRef]
  14. Boehler, R. Temperatures in the Earth’s core from melting-point measurements of iron at high static pressures. Nat. Cell Biol. 1993, 363, 534–536. [Google Scholar] [CrossRef]
  15. Hrubiak, R.; Meng, Y.; Shen, G. Microstructures define melting of molybdenum at high pressures. Nat. Commun. 2017, 8, 14562. [Google Scholar] [CrossRef] [Green Version]
  16. Japel, S.; Schwager, B.; Boehler, R.; Ross, M. Melting of Copper and Nickel at High Pressure: The Role of d Electrons. Phys. Rev. Lett. 2005, 95, 167801. [Google Scholar] [CrossRef]
  17. Ross, M.; Boehler, R.; Errandonea, D. Melting of transition metals at high pressure and the influence of liquid frustration: The late metals Cu, Ni, and Fe. Phys. Rev. B 2007, 76, 184117. [Google Scholar] [CrossRef]
  18. Alfe, D.; Adlo, L.V.; Price, G.D.; Gillan, M.J. Melting curve of materials: Theory versus experiments. J. Phys. Condens. Matter 2004, 16, S973–S982. [Google Scholar] [CrossRef]
  19. Skriver, H.L. Crystal structure from one-electron theory. Phys. Rev. B 1985, 31, 1909–1923. [Google Scholar] [CrossRef]
  20. Dai, C.; Hu, J.; Tan, H. Hugoniot temperatures and melting of tantalum under shock compression determined by optical pyrometry. J. Appl. Phys. 2009, 106, 043519. [Google Scholar] [CrossRef]
  21. Errandonea, D.; Somayazulu, M.; Häusermann, D.; Mao, H.K. Melting of tantalum at high pressure determined by angle dispersive X-ray diffraction in a double-sided laser-heated diamond-anvil cell. J. Phys. Condens. Matter 2003, 15, 7635–7649. [Google Scholar] [CrossRef]
  22. Dewaele, A.; Mezouar, M.; Guignot, N.; Loubeyre, P. High Melting Points of Tantalum in a Laser-Heated Diamond Anvil Cell. Phys. Rev. Lett. 2010, 104, 255701. [Google Scholar] [CrossRef] [PubMed] [Green Version]
  23. Akin, M.C.; Nguyen, J.H.; Beckwith, M.A.; Chau, R.; Ambrose, W.P.; Fat′Yanov, O.V.; Asimow, P.D.; Holmes, N.C. Tantalum sound velocity under shock compression. J. Appl. Phys. 2019, 125, 145903. [Google Scholar] [CrossRef]
  24. Anzellini, S.; Dewaele, A.; Mezouar, M.; Loubeyre, P.; Morard, G. Melting of Iron at Earth’s Inner Core Boundary Based on Fast X-ray Diffraction. Science. 2013, 340, 464–466. [Google Scholar] [CrossRef] [PubMed]
  25. Aquilanti, G.; Trapananti, A.; Karandikar, A.; Kantor, I.Y.; Marini, C.; Mathon, O.; Pascarelli, S.; Boehler, R. Melting of iron determined by X-ray absorption spectroscopy to 100 GPa. Proc. Natl. Acad. Sci. USA 2015, 112, 12042–12045. [Google Scholar] [CrossRef] [Green Version]
  26. Williams, Q.; Jeanloz, R.; Bass, J.; Svendsen, B.; Ahrens, T.J. The Melting Curve of Iron to 250 Gigapascals: A Constraint on the Temperature at Earth’s Center. Science 1987, 236, 181–182. [Google Scholar] [CrossRef] [PubMed]
  27. Hixson, R.S.; Boness, D.A.; Shaner, J.W.; Moriarty, J.A. Acoustic Velocities and Phase Transitions in Molybdenum under Strong Shock Compression. Phys. Rev. Lett. 1989, 62, 637–640. [Google Scholar] [CrossRef] [PubMed]
  28. Nguyen, J.H.; Akin, M.C.; Chau, R.; Fratanduono, D.E.; Ambrose, W.P.; Fat′Yanov, O.V.; Asimow, P.D.; Holmes, N.C. Molybdenum sound velocity and shear modulus softening under shock compression. Phys. Rev. B 2014, 89, 174109. [Google Scholar] [CrossRef] [Green Version]
  29. Santamaría-Pérez, D.; Ross, M.; Errandonea, D.J.H.; Mukherjee, G.D.; Mezouar, M.; Boehler, R. X-ray diffraction measurements of Mo melting to 119 GPa and the high pressure phase diagram. J. Chem. Phys. 2009, 130, 124509. [Google Scholar] [CrossRef] [PubMed] [Green Version]
  30. Errandonea, D. Improving the understanding of the melting behaviour of Mo, Ta, and W at extreme pressures. Phys. B Condens. Matter 2005, 357, 356–364. [Google Scholar] [CrossRef] [Green Version]
  31. Errandonea, D.; Boehler, R.; Ross, M. Comment on “Molybdenum sound velocity and shear modulus softening under shock compression”. Phys. Rev. B 2015, 92, 026101. [Google Scholar] [CrossRef]
  32. Nguyen, J.H.; Akin, M.C.; Chau, R.; Fratanduono, D.E.; Ambrose, W.P.; Fat′yanov, O.V.; Asimow, P.D.; Holmes, N.C. Reply to “Comment on ‘Molybdenum sound velocity and shear modulus softening under shock compres-sion’”. Phys. Rev. B 2015, 92, 026102. [Google Scholar] [CrossRef] [Green Version]
  33. Wang, J.; Coppari, F.; Smith, R.F.; Eggert, J.H.; Lazicki, A.E.; Fratanduono, D.E.; Rygg, J.R.; Boehly, T.R.; Collins, G.W.; Duffy, T.S. X-ray diffraction of molybdenum under shock compression to 450 GPa. Phys. Rev. B 2015, 92, 174114. [Google Scholar] [CrossRef] [Green Version]
  34. Errandonea, D.; MacLeod, S.G.; Burakovsky, L.; Santamaria-Perez, D.; Proctor, J.E.; Cynn, H.; Mezouar, M. Melting curve and phase diagram of vanadium under high-pressure and high-temperature conditions. Phys. Rev. B 2019, 100, 094111. [Google Scholar] [CrossRef] [Green Version]
  35. Zhang, Y.; Tan, Y.; Geng, H.Y.; Salke, N.P.; Gao, Z.; Li, J.; Sekine, T.; Wang, Q.; Greenberg, E.; Prakapenka, V.B.; et al. Melting curve of vanadium up to 256 GPa: Consistency between experiments and theory. Phys. Rev. B 2020, 102, 214104. [Google Scholar] [CrossRef]
  36. Stutzmann, V.; Dewaele, A.; Bouchet, J.; Bottin, F.; Mezouar, M. High-pressure melting curve of titanium. Phys. Rev. B 2015, 92, 224110. [Google Scholar] [CrossRef]
  37. Parisiades, P.; Cova, F.; Garbarino, G. Melting curve of elemental zirconium. Phys. Rev. B 2019, 100, 054102. [Google Scholar] [CrossRef] [Green Version]
  38. Pigott, J.S.; Velisavljevic, N.; Moss, E.K.; Draganic, N.; Jacobsen, M.K.; Meng, Y.; Hrubiak, R.; Sturtevant, B.T. Experimental melting curve of zirconium metal to 37 GPa. J. Phys. Condens. Matter 2020, 32, 355402. [Google Scholar] [CrossRef]
  39. Boccato, S.; Torchio, R.; Kantor, I.; Morard, G.; Anzellini, S.; Giampaoli, R.; Briggs, R.; Smareglia, A.; Irifune, T.; Pascarelli, S. The Melting Curve of Nickel Up to 100 GPa Explored by XAS: Melting curve of nickel up to 1 mbar. J. Geophys. Res. Solid Earth 2017, 122, 9921–9930. [Google Scholar] [CrossRef] [Green Version]
  40. Errandonea, D. High-pressure melting curves of the transition metals Cu, Ni, Pd, and Pt. Phys. Rev. B 2013, 87, 054108. [Google Scholar] [CrossRef]
  41. Lazor, P.; Shen, G.; Saxena, S.K. Laser-heated diamond anvil cell experiments at high pressure: Melting curve of nickel up to 700 kbar. Phys. Chem. Miner. 1993, 20, 86–90. [Google Scholar] [CrossRef]
  42. Dewaele, A.; Loubeyre, P.; Occelli, F.; Marie, O.; Mezouar, M. Toroidal diamond anvil cell for detailed measurements under extreme static pressures. Nat. Commun. 2018, 9, 1–9. [Google Scholar] [CrossRef]
  43. Dubrovinskaia, N.; Dubrovinsky, L.; Solopova, N.A.; Abakumov, A.; Turner, S.; Hanfland, M.; Bykova, E.; Bykov, M.; Prescher, C.; Prakapenka, V.B.; et al. Terapascal static pressure generation with ultrahigh yield strength nanodiamond. Sci. Adv. 2016, 2, e1600341. [Google Scholar] [CrossRef] [PubMed] [Green Version]
  44. Dubrovinsky, L.; Dubrovinskaia, N.; Prakapenka, V.B.; Abakumov, A.M. Implementation of micro-ball nanodiamond anvils for high-pressure studies above 6 Mbar. Nat. Commun. 2012, 3, 1163. [Google Scholar] [CrossRef] [PubMed]
  45. Swift, D.C.; Johnson, R.P. Quasi-isentropic compression by ablative laser loading: Response of materials to dynamic loading on nanosecond time scales. Phys. Rev. E 2005, 71, 066401. [Google Scholar] [CrossRef] [PubMed]
  46. Kalita, P.; Brown, J.; Specht, P.; Root, S.; White, M.; Smith, J.S. Dynamic X-ray diffraction and nanosecond quantification of kinetics of formation of β -zirconium under shock compression. Phys. Rev. B 2020, 102, 060101. [Google Scholar] [CrossRef]
  47. Eggert, J.H.; Hicks, D.G.; Celliers, P.M.; Bradley, D.K.; McWilliams, R.S.; Jeanloz, R.; Miller, J.E.; Boehly, T.R.; Collins, G.W. Melting temperature of diamond at ultrahigh pressure. Nat. Phys. 2009, 6, 40–43. [Google Scholar] [CrossRef] [Green Version]
  48. Duffy, T.S.; Smith, R.F. Ultra-High Pressure Dynamic Compression of Geological Materials. Front. Earth Sci. 2019, 7, 23. [Google Scholar] [CrossRef]
  49. Nguyen, J.H.; Holmes, N.C. Melting of iron at the physical conditions of the Earth’s core. Nat. Cell Biol. 2004, 427, 339–342. [Google Scholar] [CrossRef] [PubMed]
  50. Huser, G.; Koenig, M.; Benuzzi-Mounaix, A.; Henry, E.; Vinci, T.; Faral, B.; Tomasini, M.; Telaro, B.; Batani, D. Temperature and melting of laser-shocked iron releasing into an LiF window. Phys. Plasmas 2005, 12, 060701. [Google Scholar] [CrossRef]
  51. Nagler, B.; Arnold, B.; Bouchard, G.; Boyce, R.F.; Callen, A.; Campell, M.; Curiel, R.; Galtier, E.; Garofoli, J.; Granados, E.; et al. The Matter in Extreme Conditions instrument at the Linac Coherent Light Source. J. Synchrotron Radiat. 2015, 22, 520–525. [Google Scholar] [CrossRef] [PubMed]
  52. Glenzer, S.H.; Fletcher, L.B.; Galtier, E.; Nagler, B.; Alonso-Mori, R.; Barbrel, B.; Brown, S.B.; Chapman, D.A.; Chen, Z.; Curry, C.B.; et al. Matter under extreme conditions experiments at the Linac Coherent Light Source. J. Phys. B At. Mol. Opt. Phys. 2016, 49, 092001. [Google Scholar] [CrossRef]
  53. Mason, P.; Banerjee, S.; Smith, J.; Butcher, T.; Phillips, J.; Höppner, H.; Möller, D.; Ertel, K.; De Vido, M.; Hollingham, I.; et al. Development of a 100 J, 10 Hz laser for compression experiments at the High Energy Density instrument at the European XFEL. High Power Laser Sci. Eng. 2018, 6, 65. [Google Scholar] [CrossRef] [Green Version]
  54. Luo, S.-N.; Ahrens, T.J.; Çağın, T.; Strachan, A.; Goddard, W.A.; Swift, D.C. Maximum superheating and undercooling: Systematics, molecular dynamics simulations, and dynamic experiments. Phys. Rev. B 2003, 68, 134206. [Google Scholar] [CrossRef] [Green Version]
  55. Morris, J.R.; Wang, C.Z.; Ho, K.M.; Chan, C.T. Melting line of aluminum from simulations of coexisting phases. Phys. Rev. B 1994, 49, 3109–3115. [Google Scholar] [CrossRef] [Green Version]
  56. Belonoshko, A.B. Molecular dynamics of MgSiO3 perovskite at high pressures: Equation of state, structure, and melting transition. Geochim. Cosmochim. Acta 1994, 58, 4039–4047. [Google Scholar] [CrossRef]
  57. Gillan, M.J.; Alfe, D.; Brodholt, J.; Vočadlo, L.; Price, G.D. First-principles modelling of Earth and planetary materials at high pressures and temperatures. Rep. Prog. Phys. 2006, 69, 2365–2441. [Google Scholar] [CrossRef]
  58. Cazorla, C.; Alfè, D.; Gillan, M.J. Constraints on the phase diagram of molybdenum from first-principles free-energy calculations. Phys. Rev. B 2012, 85, 064113. [Google Scholar] [CrossRef] [Green Version]
  59. Belonoshko, A.B.; Rosengren, A. High-pressure melting curve of platinum from ab initio Z method. Phys. Rev. B 2012, 85, 174104. [Google Scholar] [CrossRef]
  60. Belonoshko, A.B.; Davis, S.; Skorodumova, N.V.; Lundow, P.H.; Rosengren, A.; Johansson, B. Properties of the fcc Lennard-Jones crystal model at the limit of superheating. Phys. Rev. B 2007, 76, 064121. [Google Scholar] [CrossRef]
  61. Anzellini, S.; Boccato, S. A Practical Review of the Laser-Heated Diamond Anvil Cell for University Laboratories and Syn-chrotron Applications. Crystals 2020, 10, 459. [Google Scholar] [CrossRef]
  62. Simon, F.; Glatzel, G. Bemerkungen zur Schmelzdruckkurve. Z. Anorg. Allg. Chem. 1929, 178, 309–316. [Google Scholar] [CrossRef]
  63. Anzellini, S.; Monteseguro, V.; Bandiello, E.; Dewaele, A.; Burakovsky, L.; Errandonea, D. In situ characterization of the high pressure–high temperature melting curve of platinum. Sci. Rep. 2019, 9, 1–10. [Google Scholar] [CrossRef] [Green Version]
  64. Gregoryanz, E.; Degtyareva, O.; Somayazulu, M.; Hemley, R.J.; Mao, H.-K. Melting of Dense Sodium. Phys. Rev. Lett. 2005, 94, 185502. [Google Scholar] [CrossRef]
  65. Gorelli, F.A.; De Panfilis, S.; Bryk, T.; Ulivi, L.; Garbarino, G.; Parisiades, P.; Santoro, M. Simple-to-Complex Transformation in Liquid Rubidium. J. Phys. Chem. Lett. 2018, 9, 2909–2913. [Google Scholar] [CrossRef] [PubMed]
  66. Narygina, O.; McBride, E.E.; Stinton, G.W.; McMahon, M.I. Melting curve of potassium to 22 GPa. Phys. Rev. B 2011, 84, 054111. [Google Scholar] [CrossRef]
  67. Guillaume, C.L.; Gregoryanz, E.; Degtyareva, O.; McMahon, M.I.; Hanfland, M.; Evans, S.; Guthrie, M.; Sinogeikin, S.V.; Mao, H.-K. Cold melting and solid structures of dense lithium. Nat. Phys. 2011, 7, 211–214. [Google Scholar] [CrossRef] [Green Version]
  68. Decremps, F.; Ayrinhac, S.; Gauthier, M.; Antonangeli, D.; Morand, M.; Garino, Y.; Parisiades, P. Sound velocity and equation of state in liquid cesium at high pressure and high temperature. Phys. Rev. B 2018, 98, 184103. [Google Scholar] [CrossRef] [Green Version]
  69. Ayrinhac, S.; Robinson, V.N.; Decremps, F.; Gauthier, M.; Antonangeli, D.; Scandolo, S.; Morand, M. High-pressure transformations in liquid rubidium. Phys. Rev. Mater. 2020, 4, 113611. [Google Scholar] [CrossRef]
  70. Kechin, V.V. Melting curve equations at high pressure. Phys. Rev. B 2001, 65, 052102. [Google Scholar] [CrossRef]
  71. Lindemann, F.A. The calculation of molecular vibration frequency. Z. Phys. 1910, 11, 609. [Google Scholar]
  72. Wolf, G.H.; Jeanloz, R. Lindemann Melting Law: Anharmonic correction and test of its validity for minerals. J. Geophys. Res. Space Phys. 1984, 89, 7821–7835. [Google Scholar] [CrossRef]
  73. Born, M. Thermodynamics of Crystals and Melting. J. Chem. Phys. 1939, 7, 591–603. [Google Scholar] [CrossRef]
  74. Hieu, H.K. Melting of solids under high pressure. Vacuum 2014, 109, 184–186. [Google Scholar] [CrossRef]
  75. Kushwah, S.; Tomar, Y.; Upadhyay, A. On the volume-dependence of the Grüneisen parameter and the Lindemann law of melting. J. Phys. Chem. Solids 2013, 74, 1143–1145. [Google Scholar] [CrossRef]
  76. Wang, Z.; Lazor, P.; Saxena, S. A simple model for assessing the high pressure melting of metals: Nickel, aluminum and platinum. Phys. B Condens. Matter 2001, 293, 408–416. [Google Scholar] [CrossRef]
  77. Weck, G.; Recoules, V.; Queyroux, J.-A.; Datchi, F.; Bouchet, J.; Ninet, S.; Garbarino, G.; Mezouar, M.; Loubeyre, P. Determination of the melting curve of gold up to 110 GPa. Phys. Rev. B 2020, 101, 014106. [Google Scholar] [CrossRef] [Green Version]
  78. Lomonosov, I. Multi-phase equation of state for aluminum. Laser Part. Beams 2007, 25, 567–584. [Google Scholar] [CrossRef]
  79. Khishchenko, K. Equation of state and phase diagram of tin at high pressures. J. Phys. Conf. Ser. 2008, 121, 022025. [Google Scholar] [CrossRef]
  80. Kulyamina, E.Y.; Zitserman, V.Y.; Fokin, L.R. Titanium Melting Curve: Data Consistency Assessment, Problems and Achievements. Tech. Phys. 2018, 63, 369–373. [Google Scholar] [CrossRef]
  81. Kulyamina, E.Y.; Zitserman, V.Y.; Fokin, L.R. Calculating the melting curves by the thermodynamic data matching method: Platinum-group refractory metals (Ru, Os, and Ir). Tech. Phys. 2017, 62, 68–74. [Google Scholar] [CrossRef]
  82. Kulyamina, E.Y.; Zitserman, V.Y.; Fokin, L.R. Osmium: Melting curve and matching of high-temperature data. High Temp. 2015, 53, 151–154. [Google Scholar] [CrossRef]
  83. Errandonea, D.; Burakovsky, L.; Preston, D.L.; MacLeod, S.G.; Santamaría-Perez, D.; Chen, S.; Cynn, H.; Simak, S.I.; McMahon, M.I.; Proctor, J.E.; et al. Experimental and theoretical confirmation of an orthorhombic phase transition in niobium at high pressure and temperature. Commun. Mater. 2020, 1, 1–11. [Google Scholar] [CrossRef]
  84. Lord, O.T.; Wood, I.G.; Dobson, D.P.; Vočadlo, L.; Wang, W.; Thomson, A.R.; Wann, E.T.; Morard, G.; Mezouar, M.; Walter, M.J. The melting curve of Ni to 1 Mbar. Earth Planet. Sci. Lett. 2014, 408, 226–236. [Google Scholar] [CrossRef] [Green Version]
  85. Ross, M.; Yang, L.H.; Boehler, R. Melting of aluminum, molybdenum, and the light actinides. Phys. Rev. B 2004, 70, 184112. [Google Scholar] [CrossRef] [Green Version]
  86. Akella, J.; Kennedy, G.C. Melting of gold, silver, and copper-proposal for a new high-pressure calibration scale. J. Geophys. Res. Space Phys. 1971, 76, 4969–4977. [Google Scholar] [CrossRef]
  87. Errandonea, D. The melting curve of ten metals up to 12 GPa and 1600 K. J. Appl. Phys. 2010, 108, 033517. [Google Scholar] [CrossRef]
  88. Boehler, R.; Ross, M. Melting curve of aluminum in a diamond cell to 0.8 Mbar: Implications for iron. Earth Planet. Sci. Lett. 1997, 153, 223–227. [Google Scholar] [CrossRef]
  89. Belonoshko, A.; Burakovsky, L.; Chen, S.P.; Johansson, B.; Mikhaylushkin, A.S.; Preston, D.L.; Simak, S.I.; Swift, D.C. Molybdenum at High Pressure and Temperature: Melting from Another Solid Phase. Phys. Rev. Lett. 2008, 100, 135701. [Google Scholar] [CrossRef]
  90. Morard, G.; Boccato, S.; Rosa, A.D.; Anzellini, S.; Miozzi, F.; Henry, L.; Garbarino, G.; Mezouar, M.; Harmand, M.; Guyot, F.; et al. Solving Controversies on the Iron Phase Diagram Under High Pressure. Geophys. Res. Lett. 2018, 45. [Google Scholar] [CrossRef] [Green Version]
  91. Schenk, T.; Holland-Moritz, D.; Simonet, V.; Bellissent, R.; Herlach, D.M. Icosahedral Short-Range Order in Deeply Undercooled Metallic Melts. Phys. Rev. Lett. 2002, 89, 075507. [Google Scholar] [CrossRef] [PubMed]
  92. Lee, G.W.; Gangopadhyay, A.K.; Kelton, K.F.; Hyers, R.W.; Rathz, T.J.; Rogers, J.R.; Robinson, D.S. Difference in Icosahedral Short-Range Order in Early and Late Transition Metal Liquids. Phys. Rev. Lett. 2004, 93, 037802. [Google Scholar] [CrossRef] [PubMed]
  93. Ross, M.; Boehler, R.; Japel, S. Melting of bcc transition metals and icosahedral clustering. J. Phys. Chem. Solids 2006, 67, 2178–2182. [Google Scholar] [CrossRef] [Green Version]
  94. Jakse, N.; Pasturel, A. Local Order of Liquid and Supercooled Zirconium by Ab Initio Molecular Dynamics. Phys. Rev. Lett. 2003, 91, 195501. [Google Scholar] [CrossRef] [PubMed]
  95. Errandonea, D. Phase behavior of metals at very high P–T conditions: A review of recent experimental studies. J. Phys. Chem. Solids 2006, 67, 2017–2026. [Google Scholar] [CrossRef]
  96. Falconi, S.; Lundegaard, L.F.; Hejny, C.; McMahon, M.I. X-ray Diffraction Study of Liquid Cs up to 9.8 GPa. Phys. Rev. Lett. 2005, 94, 125507. [Google Scholar] [CrossRef]
  97. Ross, M.; McMahan, A.K. Systematics of the sd and pd electronic transition at high pressure for the elements I through La. Phys. Rev. B 1982, 26, 4088–4093. [Google Scholar] [CrossRef]
  98. Christensen, N.; Novikov, D. High-pressure phases of the light alkali metals. Solid State Commun. 2001, 119, 477–490. [Google Scholar] [CrossRef]
  99. Degtyareva, V.F. Brillouin zone concept and crystal structures of sp metals under high pressure. High Press. Res. 2003, 23, 253–257. [Google Scholar] [CrossRef]
  100. Olijnyk, H.; Holzapfel, W. Phase transitions in alkaline earth metals under pressure. Phys. Lett. A 1984, 100, 191–194. [Google Scholar] [CrossRef]
  101. Winzenick, M.; Holzapfel, W.B. Structural study on the high-pressure phase strontium III. Phys. Rev. B 1996, 53, 2151–2154. [Google Scholar] [CrossRef] [Green Version]
  102. Kenichi, T. High-pressure structural study of barium to 90 GPa. Phys. Rev. B 1994, 50, 16238–16246. [Google Scholar] [CrossRef]
  103. Duthie, J.C.; Pettifor, D.G. Correlation between d-Band Occupancy and Crystal Structure in the Rare Earths. Phys. Rev. Lett. 1977, 38, 564–567. [Google Scholar] [CrossRef]
  104. Errandonea, D.; Boehler, R.; Ross, M. Melting of the Rare Earth Metals and f-Electron Delocalization. Phys. Rev. Lett. 2000, 85, 3444–3447. [Google Scholar] [CrossRef] [PubMed]
  105. Vohra, Y.K.; Olijnik, H.; Grosshans, W.; Holzapfel, W.B. Structural Phase Transitions in Yttrium under Pressure. Phys. Rev. Lett. 1981, 47, 1065–1067. [Google Scholar] [CrossRef]
  106. Vohra, Y.; Akella, J.; Weir, S.; Smith, G.S. A new ultra-high pressure phase in samarium. Phys. Lett. A 1991, 158, 89–92. [Google Scholar] [CrossRef] [Green Version]
  107. Akella, J.; Smith, G.S.; Jephcoat, A.P. High-pressure phase transformation studies in gadolinium to 106 GPa. J. Phys. Chem. Solids 1988, 49, 573–576. [Google Scholar] [CrossRef]
  108. Akella, J.; Weir, S.T.; Vohra, Y.K.; Prokop, H.; Catledge, S.A.; Chesnut, G.N. High pressure phase transformations in neodymium studied in a diamond anvil cell using diamond-coated rhenium gaskets. J. Phys. Condens. Matter 1999, 11, 6515–6520. [Google Scholar] [CrossRef]
  109. Grosshans, W.A.; Holzapfel, W.B. Atomic volumes of rare-earth metals under pressures to 40 GPa and above. Phys. Rev. B 1992, 45, 5171–5178. [Google Scholar] [CrossRef]
  110. Frost, D.J.; Poe, B.T.; Trønnes, R.G.; Liebske, C.; Duba, A.; Rubie, D.C. A new large-volume multianvil system. Phys. Earth Planet. Ineriors 2004, 143, 507–514. [Google Scholar] [CrossRef]
  111. Shcheka, S.S.; Wiedenbeck, M.; Frost, D.J.; Keppler, H. Carbon solubility in mantle minerals. Earth Planet. Sci. Lett. 2006, 245, 430–742. [Google Scholar] [CrossRef] [Green Version]
  112. Nieto-Sanz, D.; Loubeyre, P.; Crichton, W.; Mezouar, M. X-ray study of the synthesis of boron oxides at high pressure: Phase diagram and equation of state. Phys. Rev. B 2004, 70, 214108. [Google Scholar] [CrossRef]
  113. Horvath-Bordon, E.; Riedel, R.; Zerr, A.; McMillan, P.F.; Auffermann, G.; Prots, Y.; Bronger, W.; Kniep, R.; Kroll, P. High-pressure chemistry of nitride-based materials. Chem. Soc. Rev. 2006, 35, 987–1014. [Google Scholar] [CrossRef] [PubMed]
  114. Zhou, X.; Ma, D.; Wang, L.; Zhao, Y.; Wang, S. Large-volume cubic press produces high temperatures above 4000 Kelvin for study of the refractory materials at pressures. Rev. Sci. Instrum. 2020, 91, 015118. [Google Scholar] [CrossRef] [PubMed]
  115. Ito, E.; Yamazaki, D.; Yoshino, T.; Fukui, H.; Zhai, S.; Shatzkiy, A.; Katsura, T.; Tange, Y.; Funakoshi, K.-I. Pressure generation and investigation of the post-perovskite transformation in MgGeO3 by squeezing the Kawai-cell equipped with sintered diamond anvils. Earth Planet. Sci. Lett. 2010, 293, 84–89. [Google Scholar] [CrossRef]
  116. Ito, E. Theory and Practice—Multianvil cells and high-pressure experimental methods. In Mineral Physics; Price, G.D., Ed.; Elsevier: Amsterdam, The Netherlands, 2007; Volume 2, pp. 197–230. [Google Scholar]
  117. Getting, I.; Kennedy, G. Effect of pressure on the emf of chromel-alumel and platinum-platinum 10%rhodium thermocouples. J. Appl. Phys. 1970, 41, 4552–4562. [Google Scholar] [CrossRef]
  118. Hanneman, R.E.; Strong, H.M. Pressure Dependence of the emf of Thermocouples to 1300 °C and 50 kbar. J. Appl. Phys. 1965, 36, 523. [Google Scholar] [CrossRef]
  119. Li, J.; Hadidiacos, C.; Mao, H.-K.; Fei, Y.; Hemley, R.J. Behavior of thermocouples under high pressure in a multi-anvil apparatus. High Press. Res. 2003, 23, 389–401. [Google Scholar] [CrossRef]
  120. Matsui, M.; Nishiyama, N. Comparison between the Au and MgO pressure calibration standards at high temperature: Au and mgo pressure calibration standards. Geophys. Res. Lett. 2002, 29, 6-1-6-4. [Google Scholar] [CrossRef]
  121. Speziale, S.; Zha, C.-S.; Duffy, T.S.; Hemley, R.J.; Mao, H.-K. Quasi-hydrostatic compression of magnesium oxide to 52 GPa: Implications for the pressure-volume-temperature equation of state. J. Geophys. Res. Space Phys. 2001, 106, 515–528. [Google Scholar] [CrossRef]
  122. Zha, C.-S.; Mao, H.-K.; Hemley, R.J. Elasticity of MgO and a primary pressure scale to 55 GPa. Proc. Natl. Acad. Sci. USA 2000, 97, 13494–13499. [Google Scholar] [CrossRef] [Green Version]
  123. Liebermann, R.C. Multi-anvil, high pressure apparatus: A half-century of development and progress. High Press. Res. 2011, 31, 493–532. [Google Scholar] [CrossRef]
  124. Lazicki, A.; Fei, Y.; Hemley, R.J. High-pressure differential thermal analysis measurements of the melting curve of lithium. Solid State Commun. 2010, 150, 625–627. [Google Scholar] [CrossRef]
  125. Silber, R.E.; Secco, R.A.; Yong, W. Constant electrical resistivity of Ni along the melting boundary up to 9 GPa: Constant Ni Melting Resistivity to 9 GPa. J. Geophys. Res. Solid Earth 2017, 122, 5064–5081. [Google Scholar] [CrossRef]
  126. Ezenwa, I.C.; Secco, R.A. Invariant electrical resistivity of Co along the melting boundary. Earth Planet. Sci. Lett. 2017, 474, 120–127. [Google Scholar] [CrossRef]
  127. Berrada, M.; Secco, R.A.; Yong, W. Decreasing electrical resistivity of gold along the melting boundary up to 5 GPa. High Press. Res. 2018, 38, 367–376. [Google Scholar] [CrossRef]
  128. Lord, O.T.; Walter, M.J.; Dasgupta, R.; Walker, D.; Clark, S.M. Melting in the Fe-C system to 70 GPa. Earth Planet. Sci. Lett. 2009, 284, 157–167. [Google Scholar] [CrossRef] [Green Version]
  129. Sanloup, C.; Guyot, F.; Gillet, P.; Fiquet, G.; Hemley, R.J.; Mezouar, M.; Martinez, I. Structural changes in liquid Fe at high pressures and high temperatures from Synchrotron X-ray Diffraction. Europhys. Lett. 2000, 52, 151–157. [Google Scholar] [CrossRef] [Green Version]
  130. Brand, H.; Dobson, D.P.; Vočadlo, L.; Wood, I.G. Melting curve of copper measured to 16 GPa using a multi-anvil press. High Press. Res. 2006, 26, 185–191. [Google Scholar] [CrossRef]
  131. Fan, D.W.; Zhou, W.G.; Wei, S.Y.; Liu, Y.G.; Ma, M.N.; Xie, H.S. A simple external resistance heating diamond anvil cell and its application for synchrotron radiation X-ray diffraction. Rev. Sci. Instrum. 2010, 81, 5. [Google Scholar] [CrossRef]
  132. Jenei, Z.; Cynn, H.; Visbeck, K.; Evans, W. High-temperature experiments using a resistively heated high-pressure membrane diamond anvil cell. Rev. Sci. Instrum. 2013, 84, 0951144. [Google Scholar] [CrossRef] [PubMed]
  133. Weir, S.T.; Jackson, D.D.; Falabella, S.; Samudrala, G.; Vohra, Y.K. An electrical microheater technique for high-pressure and high-temperature diamond anvil cell experiments. Rev. Sci. Instrum. 2009, 80, 013905. [Google Scholar] [CrossRef]
  134. Pasternak, S.; Aquilanti, G.; Pascarelli, S.; Poloni, R.; Canny, B.; Coulet, M.-V.; Zhang, L. A diamond anvil cell with resistive heating for high pressure and high temperature X-ray diffraction and absorption studies. Rev. Sci. Instrum. 2008, 79, 085103. [Google Scholar] [CrossRef]
  135. Du, Z.; Miyagi, L.; Amulele, G.; Lee, K.K.M. Efficient graphite ring heater suitable for diamond-anvil cells to 1300 K. Rev. Sci. Instrum. 2013, 84, 024502. [Google Scholar] [CrossRef]
  136. Dubrovinsky, L.S.; Saxena, S.K.; Lazor, P. High-pressure and high-temperature in situ X-ray diffraction study of iron and corundum to 68 GPa using an internally heated diamond anvil cell. Phys. Chem. Miner. 1998, 25, 434–441. [Google Scholar] [CrossRef]
  137. Balzaretti, N.M.; Gonzalez, E.J.; Piermarini, G.J.; Russell, T.P. Resistance heating of the gasket in a gem-anvil high pressure cell. Rev. Sci. Instrum. 1999, 70, 4316–4323. [Google Scholar] [CrossRef]
  138. Liermann, H.-P.; Merkel, S.; Miyagi, L.; Wenk, H.-R.; Shen, G.; Cynn, H.; Evans, W.J. Experimental method for in situ determination of material textures at simultaneous high pressure and high temperature by means of radial diffraction in the diamond anvil cell. Rev. Sci. Instrum. 2009, 80, 104501. [Google Scholar] [CrossRef] [PubMed]
  139. Zha, C.-S.; Bassett, W.A. Internal resistive heating in diamond anvil cell for in situ X-ray diffraction and Raman scattering. Rev. Sci. Instrum. 2003, 74, 1255. [Google Scholar] [CrossRef]
  140. Bassett, W.A.; Shen, A.H.; Bucknum, M.; Chou, I.-M. A new diamond anvil cell for hydrothermal studies to 2.5 GPa and from −190 to 1200 °C. Rev. Sci. Instrum. 1993, 64, 2340–2345. [Google Scholar] [CrossRef] [Green Version]
  141. Weir, S.T.; Lipp, M.J.; Falabella, S.; Samudrala, G.; Vohra, Y.K. High pressure melting curve of tin measured using an internal resistive heating technique to 45 GPa. J. Appl. Phys. 2012, 111, 123529. [Google Scholar] [CrossRef]
  142. Komabayashi, T.; Fei, Y.; Meng, Y.; Prakapenka, V. In-situ X-ray diffraction measurements of the γ-ε transition boundary of iron in an internally-heated diamond anvil cell. Earth Planet. Sci. Lett. 2009, 282, 252–257. [Google Scholar] [CrossRef]
  143. Komabayashi, T.; Pesce, G.; Sinmyo, R.; Kawazoe, T.; Breton, H.; Shimoyama, Y.; Glzyrin, K.; Konôpková, Z.; Mezouar, M. Phase relations in the system Fe–Ni–Si to 200 GPa and 3900 K and implications for Earth’s core. Earth Planet. Sci. Lett. 2019, 512, 83–88. [Google Scholar] [CrossRef]
  144. Goncharov, A.F.; Hemley, R.J. Probing hydrogen-rich molecular systems at high pressures and temperatures. Chem. Soc. Rev. 2006, 35, 899–907. [Google Scholar] [CrossRef]
  145. Smith, D.; Hakeem, M.A.; Parisiades, P.; Maynard-Casely, H.E.; Foster, D.; Eden, D.; Bull, D.J.; Marshall, A.R.L.; Adawi, A.M.; Howie, R.; et al. Crossover between liquidlike and gaslike behavior in C H4 at 400 K. Phys. Rev. E 2017, 96, 052113. [Google Scholar] [CrossRef] [Green Version]
  146. Ninet, S.; Datchi, F. High pressure–high temperature phase diagram of ammonia. J. Chem. Phys. 2008, 128, 154508. [Google Scholar] [CrossRef]
  147. Datchi, F.; Loubeyre, P.; LeToullec, R. Extended and accurate determination of the melting curves of argon, helium, ice (H2O), and hydrogen(H2). Phys. Rev. B 2000, 61, 6535–6546. [Google Scholar] [CrossRef]
  148. Ming, L.; Bassett, W.A. Laser heating in the diamond anvil press up to 2000 °C sustained and 3000 °C pulsed at pressures up to 260 kilobars. Rev. Sci. Instrum. 1974, 45, 1115–1118. [Google Scholar] [CrossRef]
  149. Murakami, M. Post-Perovskite Phase Transition in MgSiO3. Science 2004, 304, 855–858. [Google Scholar] [CrossRef] [PubMed] [Green Version]
  150. Petitgirard, S.; Salamat, A.; Beck, P.; Weck, G.; Bouvier, P. Strategies for in situ laser heating in the diamond anvil cell at an X-ray diffraction beamline. J. Synchrotron Radiat. 2014, 21, 89–96. [Google Scholar] [CrossRef] [PubMed] [Green Version]
  151. Prakapenka, V.B.; Kubo, A.; Kuznetsov, A.; Laskin, A.; Shkurikhin, O.; Dera, P.; Rivers, M.L.; Sutton, S.R. Advanced flat top laser heating system for high pressure research at GSECARS: Application to the melting behavior of germanium. High Press. Res. 2008, 28, 225–235. [Google Scholar] [CrossRef]
  152. Anzellini, S.; Kleppe, A.K.; Daisenberger, D.; Wharmby, M.T.; Giampaoli, R.; Boccato, S.; Baron, M.A.; Miozzi, F.; Keeble, D.S.; Ross, A.; et al. Laser-heating system for high-pressure X-ray diffraction at the Extreme Conditions beamline I15 at Diamond Light Source. J. Synchrotron Radiat. 2018, 25, 1860–1868. [Google Scholar] [CrossRef]
  153. Meng, Y.; Hrubiak, R.; Rod, E.; Boehler, R.; Shen, G. New developments in laser-heated diamond anvil cell with in situ synchrotron X-ray diffraction at High Pressure Collaborative Access Team. Rev. Sci. Instrum. 2015, 86, 072201. [Google Scholar] [CrossRef] [PubMed] [Green Version]
  154. Liermann, H.-P.; Konôpková, Z.; Morgenroth, W.; Glazyrin, K.; Bednarčik, J.; McBride, E.E.; Petitgirard, S.; Delitz, J.T.; Wendt, M.; Bican, Y.; et al. The Extreme Conditions Beamline P02.2 and the Extreme Conditions Science Infrastructure at PETRA III. J. Synchrotron Radiat. 2015, 22, 908–924. [Google Scholar] [CrossRef] [PubMed] [Green Version]
  155. Watanuki, T.; Shimomura, O.; Yagi, T.; Kondo, T.; Isshiki, M. Construction of laser-heated diamond anvil cell system for in situ X-ray diffraction study at SPring-8. Rev. Sci. Instrum. 2001, 72, 1289. [Google Scholar] [CrossRef]
  156. Stan, C.V.; Beavers, C.M.; Kunz, M.; Tamura, N. X-ray Diffraction under Extreme Conditions at the Advanced Light Source. Quantum Beam Sci. 2018, 2, 4. [Google Scholar] [CrossRef] [Green Version]
  157. Andrault, D.; Bolfan-Casanova, N.; Bouhifd, M.; Boujibar, A.; Garbarino, G.; Manthilake, G.; Mezouar, M.; Monteux, J.; Parisiades, P.; Pesce, G. Toward a coherent model for the melting behavior of the deep Earth’s mantle. Phys. Earth Planet. Inter. 2017, 265, 67–81. [Google Scholar] [CrossRef]
  158. Boehler, R.; Musshoff, H.G.; Ditz, R.; Aquilanti, G.; Trapananti, A. Portable laser-heating stand for synchrotron applications. Rev. Sci. Instrum. 2009, 80, 045103. [Google Scholar] [CrossRef] [Green Version]
  159. Andrault, D.; Muñoz, M.; Bolfan-Casanova, N.; Guignot, N.; Perrillat, J.-P.; Aquilanti, G.; Pascarelli, S. Experimental evidence for perovskite and post-perovskite coexistence throughout the whole D″ region. Earth Planet. Sci. Lett. 2010, 293, 90–96. [Google Scholar] [CrossRef]
  160. Kantor, I.; Marini, C.; Mathon, O.; Pascarelli, S. A laser heating facility for energy-dispersive X-ray absorption spectroscopy. Rev. Sci. Instrum. 2018, 89, 13111. [Google Scholar] [CrossRef]
  161. Torchio, R.; Boccato, S.; Cerantola, V.; Morard, G.; Irifune, T.; Kantor, I. Probing the local, electronic and magnetic structure of matter under extreme conditions of temperature and pressure. High Press. Res. 2016, 36, 293–302. [Google Scholar] [CrossRef]
  162. Andrault, D.; Petitgirard, S.; Nigro, G.L.; Devidal, J.; Veronesi, G.; Garbarino, G.; Mezouar, M. Solid-liquidiron partitioning in Earth’s deep mantle. Nature 2012, 487, 354. [Google Scholar] [CrossRef] [PubMed]
  163. Potapkin, V.; McCammon, C.; Glazyrin, K.; Kantor, A.; Kupenko, I.; Prescher, C.; Sinmyo, R.; Smirnov, G.V.; Chumakov, A.I.; Rüffer, R.; et al. Effect of iron oxidation state on the electrical conductivity of the Earth’s lower mantle. Nat. Commun. 2013, 4, 1427. [Google Scholar] [CrossRef] [PubMed] [Green Version]
  164. Kupenko, I.; Dubrovinsky, L.; Dubrovinskaia, N.; McCammon, C.; Glazyrin, K.; Bykova, E.; Ballaran, T.B.; Sinmyo, R.; Chumakov, A.I.; Potapkin, V.; et al. Portable double-sided laser-heating system for Mössbauer spectroscopy and X-ray diffraction experiments at synchrotron facilities with diamond anvil cells. Rev. Sci. Instrum. 2012, 83, 124501. [Google Scholar] [CrossRef]
  165. McCammon, C.; Caracas, R.; Glazyrin, K.; Potapkin, V.; Kantor, A.; Sinmyo, R.; Prescher, C.; Kupenko, I.; Chumakov, A.; Dubrovinsky, L. Sound velocities of bridgmanite from density of states determined by nuclear inelastic scattering and first-principles calculations. Prog. Earth Planet. Sci. 2016, 3, 10. [Google Scholar] [CrossRef] [Green Version]
  166. Meier, T.; Dwivedi, A.P.; Khandarkhaeva, S.; Fedotenko, T.; Dubrovinskaia, N.; Dubrovinsky, L. Table-top nuclear magnetic resonance system for high-pressure studies with in situ laser heating. Rev. Sci. Instrum. 2019, 90, 123901. [Google Scholar] [CrossRef] [PubMed]
  167. Zinin, P.V.; Prakapenka, V.B.; Burgess, K.; Odake, S.; Chigarev, N.; Sharma, S.K. Combined laser ultrasonics, laser heating, and Raman scattering in diamond anvil cell system. Rev. Sci. Instrum. 2016, 87, 123908. [Google Scholar] [CrossRef]
  168. Goncharov, A.F.; Crowhurst, J.C. Pulsed laser Raman spectroscopy in the laser-heated diamond anvil cell. Rev. Sci. Instrum. 2005, 76, 63905. [Google Scholar] [CrossRef] [Green Version]
  169. Santoro, M.; Lin, J.-F.; Mao, H.-K.; Hemley, R.J. In situ high P-T Raman spectroscopy and laser heating of carbon dioxide. J. Chem. Phys. 2004, 121, 2780. [Google Scholar] [CrossRef]
  170. Zhou, Q.; Ma, Y.; Cui, Q.; Cui, T.; Zhang, J.; Xie, Y.; Yang, K.; Zou, G. Raman scattering system for a laser heated diamond anvil cell. Rev. Sci. Instrum. 2004, 75, 2432–2434. [Google Scholar] [CrossRef]
  171. Lin, J.-F.; Santoro, M.; Struzhkin, V.V.; Mao, H.-K.; Hemley, R.J. In situ high pressure-temperature Raman spectroscopy technique with laser-heated diamond anvil cells. Rev. Sci. Instrum. 2004, 75, 3302–3306. [Google Scholar] [CrossRef]
  172. Murakami, M.; Asahara, Y.; Ohishi, Y.; Hirao, N.; Hirose, K. Development of in situ Brillouin spectroscopy at high pressure and high temperature with synchrotron radiation and infrared laser heating system: Application to the Earth’s deep interior. Phys. Earth Planet. Inter. 2009, 174, 282–291. [Google Scholar] [CrossRef]
  173. Sinogeikin, S.V.; Lakshtanov, D.L.; Nicholas, J.D.; Jackson, J.M.; Bass, J.D. High temperature elasticity measurements on oxides by Brillouin spectroscopy with resistive and IR laser heating. J. Eur. Ceram. Soc. 2005, 25, 1313–1324. [Google Scholar] [CrossRef]
  174. Li, F.; Cui, Q.; He, Z.; Cui, T.; Gao, C.; Zhou, Q.; Zou, G. Brillouin scattering spectroscopy for a laser heated diamond anvil cell. Appl. Phys. Lett. 2006, 88, 203507. [Google Scholar] [CrossRef]
  175. Zhang, J.S.; Bass, J.D.; Zhu, G. Single-crystal Brillouin spectroscopy with CO2 laser heating and variable q. Rev. Sci. Instrum. 2015, 86, 063905. [Google Scholar] [CrossRef] [PubMed]
  176. Young, A.F.; Sanloup, C.; Gregoryanz, E.; Scandolo, S.; Hemley, R.J.; Mao, H.K. Synthesis of novel transition metal nitrides IrN2 and OsN2. Phys. Rev. Lett. 2006, 96, 155501. [Google Scholar] [CrossRef] [PubMed] [Green Version]
  177. Solozhenko, V.L.; Kurakevych, O.O.; Andrault, D.; Le Godec, Y.; Mezouar, M. Ultimate Metastable Solubility of Boron in Diamond: Synthesis of Superhard Diamond like BC5. Phys. Rev. Lett. 2009, 102, 015506. [Google Scholar] [CrossRef] [Green Version]
  178. Nielsen, M.B.; Ceresoli, D.; Parisiades, P.; Prakapenka, V.B.; Yu, T.; Wang, Y.; Bremholm, M. Phase stability of the SrMnO3 hexagonal perovskite system at high pressure and temperature. Phys. Rev. B 2014, 90, 214101. [Google Scholar] [CrossRef] [Green Version]
  179. Crowhurst, J.C.; Goncharov, A.F.; Sadigh, B.; Zaug, J.; Aberg, D.; Meng, Y.; Prakapenka, V.B. Synthesis and characterization of nitrides of iridium and palladium. J. Mater. Res. 2008, 23, 1–5. [Google Scholar] [CrossRef]
  180. Salamat, A.; Fischer, R.A.; Briggs, R.; McMahon, M.I.; Petitgirard, S. In situ synchrotron X-ray diffraction in the laser-heated diamond anvil cell: Melting phenomena and synthesis of new materials. Coord. Chem. Rev. 2014, 277–278, 15–30. [Google Scholar] [CrossRef]
  181. Pépin, C.M.; Geneste, G.; Dewaele, A.; Mezouar, M.; Loubeyre, P. Synthesis of FeH5: A layered structure with atomic hydrogen slabs. Science 2017, 357, 382–385. [Google Scholar] [CrossRef] [Green Version]
  182. Drozdov, A.P.; Kong, P.P.; Minkov, V.S.; Besedin, S.P.; Kuzovnikov, M.A.; Mozaffari, S.; Balicas, L.; Balakirev, F.F.; Graf, D.E.; Prakapenka, V.B.; et al. Superconductivity at 250 K in lanthanum hydride under high pressures. Nat. Cell Biol. 2019, 569, 528–531. [Google Scholar] [CrossRef] [PubMed] [Green Version]
  183. Guigue, B.; Marizy, A.; Loubeyre, P. Direct synthesis of pure H3 S from S and H elements: No evidence of the cubic super-conducting phase up to 160 GPa. Phys. Rev. B 2017, 95, 020104. [Google Scholar] [CrossRef]
  184. Block, S.; Weir, C.W.; Piermarini, G.J. High-Pressure Single-Crystal Studies of Ice VI. Science 1965, 148, 947–948. [Google Scholar] [CrossRef]
  185. Lin, J.-F.; Shu, J.; Mao, H.-K.; Hemley, R.J.; Shen, G. Amorphous boron gasket in diamond anvil cell research. Rev. Sci. Instrum. 2003, 74, 4732–4736. [Google Scholar] [CrossRef]
  186. Funamori, N.; Sato, T. A cubic boron nitride gasket for diamond-anvil experiments. Rev. Sci. Instrum. 2008, 79, 053903. [Google Scholar] [CrossRef]
  187. Hemley, R.J.; Beckmann, R.; Bubeck, R.; Grassucci, R.; Penczek, P.; Verschoor, A.; Blobel, G.; Frank, J. X-ray Imaging of Stress and Strain of Diamond, Iron, and Tungsten at Megabar Pressures. Science 1997, 276, 1242–1245. [Google Scholar] [CrossRef] [Green Version]
  188. Mao, H.-K.; Shu, J.; Shen, G.; Hemley, R.J.; Li, B.; Singh, A.K. Elasticity and rheology of iron above 220 GPa and the nature of the Earth’s inner core. Nat. Cell Biol. 1998, 396, 741–743. [Google Scholar] [CrossRef]
  189. Wu, T.-C.; Bassett, W.A. Deviatoric stress in a diamond anvil cell using synchrotron radiation with two diffraction geometries. PAGEOPH 1993, 141, 509–519. [Google Scholar] [CrossRef]
  190. Klotz, S.; Chervin, J.-C.; Munsch, P.; Le Marchand, G. Hydrostatic limits of 11 pressure transmitting media. J. Phys. D Appl. Phys. 2009, 42, 075413. [Google Scholar] [CrossRef]
  191. Dewaele, A.; Loubeyre, P. Pressurizing conditions in helium-pressure-transmitting medium. High Press. Res. 2007, 27, 419–429. [Google Scholar] [CrossRef]
  192. Boehler, R.; Ross, M.; Söderlind, P.; Boercker, D.B. High-Pressure Melting Curves of Argon, Krypton, and Xenon: Deviation from Corresponding States Theory. Phys. Rev. Lett. 2001, 86, 5731–5734. [Google Scholar] [CrossRef] [Green Version]
  193. Boehler, R.; Ross, M.; Boercker, D.B. Melting of LiF and NaCl to 1 Mbar: Systematics of Ionic Solids at Extreme Conditions. Phys. Rev. Lett. 1997, 78, 4589–4592. [Google Scholar] [CrossRef]
  194. Kimura, T.; Ohfuji, H.; Nishi, M.; Irifune, T. Melting temperatures of MgO under high pressure by micro-texture analysis. Nat. Commun. 2017, 8, 15735. [Google Scholar] [CrossRef] [Green Version]
  195. Andrault, D.; Morard, G.; Garbarino, G.; Mezouar, M.; Bouhifd, M.A.; Kawamoto, T. Melting behavior of SiO2 up to 120 GPa. Phys. Chem. Miner. 2020, 47, 10. [Google Scholar] [CrossRef]
  196. Shen, G.; Lazor, P. Measurement of melting temperatures of some minerals under lower mantle pressures. J. Geophys. Res. Space Phys. 1995, 100, 17699–17713. [Google Scholar] [CrossRef]
  197. Santamaría-Pérez, D.; Mukherjee, G.D.; Schwager, B.; Boehler, R. High-pressure melting curve of helium and neon: Deviations from corresponding states theory. Phys. Rev. B 2010, 81, 214101. [Google Scholar] [CrossRef]
  198. Boehler, R.; Ross, M.; Boercker, D.B. High-pressure melting curves of alkali halides. Phys. Rev. B 1996, 53, 556–563. [Google Scholar] [CrossRef] [PubMed]
  199. Yang, L.; Karandikar, A.; Boehler, R. Flash heating in the diamond cell: Melting curve of rhenium. Rev. Sci. Instrum. 2012, 83, 63905. [Google Scholar] [CrossRef] [PubMed]
  200. Dewaele, A.; Mezouar, M.; Guignot, N.; Loubeyre, P. Melting of lead under high pressure studied using second-scale time-resolved X-ray diffraction. Phys. Rev. B 2007, 76, 144106. [Google Scholar] [CrossRef]
  201. Patel, N.N.; Sunder, M. High pressure melting curve of osmium up to 35 GPa. J. Appl. Phys. 2019, 125, 055902. [Google Scholar] [CrossRef]
  202. Du, Z.; Amulele, G.; Benedetti, L.R.; Lee, K.K.M. Mapping temperatures and temperature gradients during flash heating in a diamond-anvil cell. Rev. Sci. Instrum. 2013, 84, 75111. [Google Scholar] [CrossRef] [PubMed]
  203. Geballe, Z.M.; Jeanloz, R. Origin of temperature plateaus in laser-heated diamond anvil cell experiments. J. Appl. Phys. 2012, 111, 123518. [Google Scholar] [CrossRef]
  204. Weck, G.; Datchi, F.; Garbarino, G.; Ninet, S.; Queyroux, J.-A.; Plisson, T.; Mezouar, M.; Loubeyre, P. Melting Curve and Liquid Structure of Nitrogen Probed by X-ray Diffraction to 120 GPa. Phys. Rev. Lett. 2017, 119, 235701. [Google Scholar] [CrossRef]
  205. Zerr, A.; Diegeler, A.; Boehler, R. Solidus of Earth’s Deep Mantle. Science 1998, 281, 243–246. [Google Scholar] [CrossRef]
  206. Hearne, G.; Bibik, A.; Zhao, J. CO2laser-heated diamond-anvil cell methodology revisited. J. Phys. Condens. Matter 2002, 14, 11531–11535. [Google Scholar] [CrossRef]
  207. Fiquet, G.; Andrault, D.; Itié, J.; Gillet, P.; Richet, P. X-ray diffraction of periclase in a laser-heated diamond-anvil cell. Phys. Earth Planet. Inter. 1996, 95, 1–17. [Google Scholar] [CrossRef]
  208. Mao, H.K.; Bell, P.M.; Shaner, J.W.; Steinberg, D.J. Specific volume measurements of Cu, Mo, Pd, and Ag and calibration of the ruby R1 fluorescence pressure gauge from 0.06 to 1 Mbar. J. Appl. Phys. 1978, 49, 3276–3283. [Google Scholar] [CrossRef]
  209. Dewaele, A.; Torrent, M.; Loubeyre, P.; Mezouar, M. Compression curves of transition metals in the Mbar range: Experiments and projector augmented-wave calculations. Phys. Rev. B 2008, 78, 104102. [Google Scholar] [CrossRef]
  210. Shen, G.; Wang, Y.; Dewaele, A.; Wu, C.; Fratanduono, D.E.; Eggert, J.; Klotz, S.; Dziubek, K.F.; Loubeyre, P.; Fat’Yanov, O.V.; et al. Toward an international practical pressure scale: A proposal for an IPPS ruby gauge (IPPS-Ruby2020). High Press. Res. 2020, 40, 299–314. [Google Scholar] [CrossRef]
  211. Datchi, F.; Dewaele, A.; Loubeyre, P.; Letoullec, R.; Le Godec, Y.; Canny, B. Optical pressure sensors for high-pressure–high-temperature studies in a diamond anvil cell. High Press. Res. 2007, 27, 447–463. [Google Scholar] [CrossRef]
  212. Akahama, Y.; Kawamura, H. Pressure calibration of diamond anvil Raman gauge to 410 GPa. J. Phys. Conf. Ser. 2010, 215, 012195. [Google Scholar] [CrossRef]
  213. Benedetti, L.R.; Loubeyre, P. Temperature gradients, wavelength-dependent emissivity, and accuracy of high and very-high temperatures measured in the laser-heated diamond cell. High Press. Res. 2004, 24, 423–445. [Google Scholar] [CrossRef]
  214. Benedetti, L.R.; Antonangeli, D.; Farber, D.L.; Mezouar, M. An integrated method to determine melting temperatures in high-pressure laser-heating experiments. Appl. Phys. Lett. 2008, 92, 141903. [Google Scholar] [CrossRef]
  215. Mezouar, M.; Giampaoli, R.; Garbarino, G.; Kantor, I.; Dewaele, A.; Weck, G.; Boccato, S.; Svitlyk, V.; Rosa, A.D.; Torchio, R.; et al. Methodology for in situ synchrotron X-ray studies in the laser-heated diamond anvil cell. High Press. Res. 2017, 37, 170–180. [Google Scholar] [CrossRef]
  216. Giampaoli, R.; Kantor, I.; Mezouar, M.; Boccato, S.; Rosa, A.D.; Torchio, R.; Garbarino, G.; Mathon, O.; Pascarelli, S. Measurement of temperature in the laser heated diamond anvil cell: Comparison between reflective and refractive optics. High Press. Res. 2018, 38, 250–269. [Google Scholar] [CrossRef]
  217. Benedetti, L.R.; Guignot, N.; Farber, D.L. Achieving accuracy in spectroradiometric measurements of temperature in the laser-heated diamond anvil cell: Diamond is an optical component. J. Appl. Phys. 2007, 101, 013109. [Google Scholar] [CrossRef]
  218. Jeanloz, R.; Kavner, A. Melting criteria and imaging spectroradiometry in laser-heated diamond-cell experiments. Philos. Trans. R. Soc. A Math. Phys. Eng. Sci. 1996, 354, 1279–1305. [Google Scholar] [CrossRef]
  219. Belonoshko, A.; Ahuja, R.; Johansson, B. Molecular Dynamics Study of Melting and fcc-bcc Transitions in Xe. Phys. Rev. Lett. 2001, 87, 165505. [Google Scholar] [CrossRef] [PubMed] [Green Version]
  220. Belonoshko, A.B.; Ahuja, R.; Johansson, B. Stability of the body-centred-cubic phase of iron in the Earth’s inner core. Nat. Cell Biol. 2003, 424, 1032–1034. [Google Scholar] [CrossRef]
  221. Andrault, D.; Morard, G.; Bolfan-Casanova, N.; Ohtaka, O.; Fukui, H.; Arima, H.; Guignot, N.; Funakoshi, K.; Lazor, P.; Mezouar, M. Study of partial melting at high-pressure using in situ X-ray diffraction. High Press. Res. 2006, 26, 267–276. [Google Scholar] [CrossRef]
  222. Di Cicco, A.; Trapananti, A. Study of local icosahedral ordering in liquid and undercooled liquid copper. J. Non-Cryst. Solids 2007, 353, 3671–3678. [Google Scholar] [CrossRef]
  223. Pascarelli, S.; Mathon, O.; Mairs, T.; Kantor, I.; Agostini, G.; Strohm, C.; Pasternak, S.; Perrin, F.; Berruyer, G.; Chappelet, P.; et al. The Time-resolved and Extreme-conditions XAS (TEXAS) facility at the European Synchrotron Radiation Facility: The energy-dispersive X-ray absorption spectroscopy beamline ID24. J. Synchrotron Radiat. 2016, 23, 353–368. [Google Scholar] [CrossRef]
  224. Lord, O.T.; Wann, E.T.; Hunt, S.A.; Walker, A.M.; Santangeli, J.; Walter, M.J.; Dobson, D.P.; Wood, I.G.; Vočadlo, L.; Morard, G.; et al. The NiSi melting curve to 70 GPa. Phys. Earth Planet. Inter. 2014, 233, 13–23. [Google Scholar] [CrossRef] [Green Version]
  225. Prakapenka, V.B.; Shen, G.; Rivers, M.L.; Sutton, S.R.; Dubrovinsky, L. Grain-size control in situ at high pressures and high temperatures in a diamond-anvil cell. J. Synchrotron Radait. 2005, 12, 560–565. [Google Scholar] [CrossRef] [PubMed]
  226. Karandikar, A.; Boehler, R. Flash melting of tantalum in a diamond cell to 85 GPa. Phys. Rev. B 2016, 93, 054107. [Google Scholar] [CrossRef] [Green Version]
  227. Sinmyo, R.; Hirose, K.; Ohishi, Y. Melting curve of iron to 290 GPa determined in a resistance-heated diamond-anvil cell. Earth Planet. Sci. Lett. 2019, 510, 45–52. [Google Scholar] [CrossRef]
  228. Basu, A.; Field, M.R.; McCulloch, D.G.; Boehler, R. New measurement of melting and thermal conductivity of iron close to outer core conditions. Geosci. Front. 2020, 11, 565–568. [Google Scholar] [CrossRef]
  229. Boehler, R. The phase diagram of iron to 430 kbar. Geophys. Res. Lett. 1986, 13, 1153–1156. [Google Scholar] [CrossRef]
  230. Ohta, K.; Kuwayama, Y.; Hirose, K.; Shimizu, K.; Ohishi, Y. Experimental determination of the electrical resistivity of iron at Earth’s core conditions. Nat. Cell Biol. 2016, 534, 95–98. [Google Scholar] [CrossRef]
  231. Konôpková, Z.; McWilliams, R.S.; Gómez-Pérez, R.S.M.N.; Goncharov, A.F. Direct measurement of thermal conductivity in solid iron at planetary core conditions. Nat. Cell Biol. 2016, 534, 99–101. [Google Scholar] [CrossRef]
  232. Aprilis, G.; Strohm, C.; Kupenko, I.; Linhardt, S.; Laskin, A.; Vasiukov, D.; Cerantola, V.; Koemets, E.; McCammon, C.; Kurnosov, A.; et al. Portable double-sided pulsed laser heating system for time-resolved geoscience and materials science applications. Rev. Sci. Instrum. 2017, 88, 084501. [Google Scholar] [CrossRef] [PubMed] [Green Version]
  233. Zhang, D.; Jackson, J.M.; Zhao, J.; Sturhahn, W.; Alp, E.E.; Toellner, T.S.; Hu, M.Y. Fast temperature spectrometer for samples under extreme conditions. Rev. Sci. Instrum. 2015, 86, 013105. [Google Scholar] [CrossRef] [PubMed] [Green Version]
  234. Zhang, D.; Jackson, J.M.; Zhao, J.; Sturhahn, W.; Alp, E.E.; Hu, M.Y.; Toellner, T.S.; Murphy, C.A.; Prakapenka, V.B. Temperature of Earth’s core constrained from melting of Fe and Fe0.9Ni0.1 at high pressures. Earth Planet. Sci. Lett. 2016, 447, 72–83. [Google Scholar] [CrossRef] [Green Version]
  235. Jackson, J.M.; Sturhahn, W.; Lerche, M.; Zhao, J.; Toellner, T.S.; Alp, E.E.; Sinogeikin, S.V.; Bass, J.D.; Murphy, C.A.; Wicks, J.K. Melting of compressed iron by monitoring atomic dynamics. Earth Planet. Sci. Lett. 2013, 362, 143–150. [Google Scholar] [CrossRef]
  236. Jeanloz, R.; Heinz, D. Experiments at high temperature and pressure: Laser heating through the diamond cell. J. Phys. Colloq. 1984, 45, C8-83. [Google Scholar] [CrossRef]
  237. Rouquette, J.; Dolejs, D.; Kantor, I.Y.; McCammon, C.A.; Frost, D.J.; Prakapenka, V.B.; Dubrovinsky, L.S. Iron-carbon interactions at high temperatures and pressures. Appl. Phys. Lett. 2008, 92, 121912. [Google Scholar] [CrossRef]
  238. Ren, B.; Liu, G.-K.; Lian, X.-B.; Yang, Z.-L.; Tian, Z.-Q. Raman spectroscopy on transition metals. Anal. Bioanal. Chem. 2007, 388, 29–45. [Google Scholar] [CrossRef] [PubMed] [Green Version]
  239. Aprilis, G.; Kantor, I.; Kupenko, I.; Cerantola, V.; Pakhomova, A.; Collings, I.E.; Torchio, R.; Fedotenko, T.; Chariton, S.; Bykov, M.; et al. Comparative study of the influence of pulsed and continuous wave laser heating on the mobilization of carbon and its chemical reaction with iron in a diamond anvil cell. J. Appl. Phys. 2019, 125, 095901. [Google Scholar] [CrossRef] [Green Version]
Figure 1. Normalized melting temperatures Tm/T0 for several d-transition metals. All the melting curves in each graph were obtained with the same method: (a) XRD diagnostic (Section 4.2), (b) Speckle diagnostic (Section 4.1). The error bars in Figure 1a refer to the reported uncertainties in temperature measurement by using the XRD diagnostic. Datasheets can be found in the Supplemental Material.
Crystals 11 00416 g001
Figure 2. The principle of the laser-heated diamond anvil cell (LH-DAC).
Crystals 11 00416 g002
Figure 3. Experimentally defined melting curves of the most commonly used pressure transmitting media (PTMs) inside a laser-heated diamond anvil cell [192,193,194,195,196,197,198]. Solid lines: solid PTMs, dash-dotted lines: gas PTMs.
Crystals 11 00416 g003
Figure 4. XRD patterns of a Zr sample in an LH-DAC [37]. The liquid diffuse scattering appears at melting as a background signal that increases in intensity with temperature as the quantity of the liquid increases. The light green liquid diffuse scattering background corresponds to 3295 K, the pink one to 3467 K. The patterns at 3022 K and 3174 K correspond to solid Zr.
Crystals 11 00416 g004
Figure 5. X-ray absorption near edge structure (XANES) spectra for Ni at different temperatures (reproduced from [39]). The melting can be determined by the disappearance of the shoulder in point A and the flattening of the first few oscillations (points B and C).
Crystals 11 00416 g005
Figure 6. Comparison of temperature versus laser power curves in different samples and different heating runs: (a) Zr at 49 GPa [37], (b) Zr at 80 GPa [37], (c) Ni at 46 GPa [84], (d) Ti at 42 GPa [36]. In all of these works, the melting was determined by XRD liquid diffuse scattering (Section 4.2), and the melting temperature found at the given pressure is shown by the straight pink line.
Crystals 11 00416 g006
Figure 7. SEM image of the cross-section of a Ni sample heated (a) below melting and (b) above melting temperature (reproduced from [39]). In Figure 7a, cuts at different depths are shown so the three-dimensional structure of the sample assembly can be better visualized.
Crystals 11 00416 g007
Figure 8. XRD 2D images of a Zr sample at different temperatures (P = 49 GPa) [37]. The movement of polycrystalline spots with temperature is related to movements in the sample surface. The actual melting temperature at this pressure point is 3235 K.
Crystals 11 00416 g008
Publisher’s Note: MDPI stays neutral with regard to jurisdictional claims in published maps and institutional affiliations.

