Abstract
The structure of ferroelectric 0.06LiNbO3-0.94K0.5Na0.5NbO3 (KNNL6) was investigated by the neutron total scattering method in the temperature range of 290–773 K. The Rietveld analysis using the powder neutron diffraction data in the range of 290–773 K indicates transition from a two-phase (monoclinic and tetragonal) mixture at room temperature to tetragonal and cubic phases at higher temperatures. However, characterization of the local structure by the pair distribution function (PDF) method indicates that the local structure (r ≲ 10 Å) stays monoclinic over the same temperature range. Besides, the local oxygen octahedral distortion exhibits smaller changes with temperature than what is observed for the long-range average structure.
1. Introduction
Ferroelectric materials are widely used for various applications, including capacitive energy storage, piezoelectric sensors and actuators, energy harvesting, and solid-state cooling [1,2,3,4,5]. In the past several decades, lead (Pb)-based compounds have dominated the field of ferroelectrics because of their excellent properties, among which the most well-known example is lead zirconate titanate (PZT) ceramics. For Pb-based ferroelectric solid-solutions, large functional properties are often recorded for regions in phase diagrams where there is a sudden change of crystal structure with a small change in composition, which is known as a morphotropic phase boundary (MPB) [6]. Such property enhancements are associated with the coexistence of multiple phases and/or monoclinic distortions [7,8,9]. However, Pb-based ferroelectrics are facing restrictions due to their environmental impact, which has led to wide research efforts in the development of Pb-free counterparts [3,10,11].
Among Pb-free ferroelectrics, significant attention has been paid to alkali niobate (K, Na) NbO3 (KNN) systems because of their good comprehensive performance and potential for high-temperature applications [12,13,14]. For KNN systems, large dielectric and piezoelectric properties are found for compositions with coexistence of multiple phases, which indicates that such a strategy can be effective for further enhancement in their properties. Conventionally, KNN was believed to have an orthorhombic phase (o) at room temperature, which transforms to the tetragonal (t) phase at approximately 200 °C [15]. The o-to-t phase transition temperature in KNN can be shifted to near room temperature range by the addition of ions or secondary compounds [16], which can lead to an enhancement in electrical properties. For example, the maximum functional properties in (1 − x)(K, Na)NbO3−xLiNbO3 (KNNL) are obtained near room temperature for 6–7% LiNbO3 [17,18,19], which was believed to be the results of an MPB [20,21]. However, some researchers believe that the phase boundaries in KNN-based materials are more appropriately described as “polymorphic phase transition (PPT)” since it is sensitive to not only compositions but also temperatures [3,22,23].
In any case, irrespective of the exact description of phase transition characteristics, the structure of KNN-based systems near the orthorhombic-tetragonal phase boundary is still not fully understood. For example, several recent studies proposed that the structure of unmodified KNN at room temperature can be adequately described as exhibiting monoclinic symmetry [24]. It was also shown that the addition of a small amount of Li (x ≥ 0.05) to KNN stabilizes the monoclinic structure [8,25,26,27]. However, since the difference between the orthorhombic and monoclinic structures is relatively small, resolving these structural differences can be difficult using laboratory X-ray diffraction techniques. Furthermore, a recent study on KNN indicated that the local structure of KNN within 20 Å is different from the average crystal structure, which emphasizes the need for more comprehensive advanced structural characterization [28]. Although there is a huge amount of literature on Li-modified KNN (KNNL) ceramics, a systematic study of their structural evolution with temperature, over both short (<10–20 Å)—and long—length scales is still lacking. In this respect, total scattering techniques, which provide information of both Bragg diffraction as well as diffuse scattering, can be adapted to study the evolution of long-range average structure and short-range structural disorder in KNNL as a function of temperature. In the past, the total scattering method provided unique local structural details in many ferroelectric materials, such as reviewed by Egami in [29] and more recently by Zhu et al. in [30]. Total scattering analysis importantly revealed that for Pb-based ferroelectrics, such as Pb(Zr, Ti)O3, and Pb(Mg, Nb)O3, Pb2+ retains a similar oxygen environment up to 1000 K, even though there are multiple phase transitions in the average structure [29]. Here, we employed neutron total scattering measurements to characterize the local and average structural transitions in KNNL6 for temperatures from 290 to 773 K. Our analysis indicated that although the long-range average structure undergoes two different phase transitions upon heating from 290 to 773 K (from coexisting monoclinic and tetragonal phases to a purely tetragonal phase and finally to a purely cubic phase), its short-range structure within ~10 Å length scale remains monoclinic over the same temperature range.
2. Experiment
First, 0.94 K0.5Na0.5NbO3-0.06LiNbO3 powders were prepared by a traditional solid-state synthesis method. K2CO3 (purity ~99.7%), Na2CO3 (purity ~100%), Nb2O5 (purity ~99.9%), and Li2O (purity ~99.99%), all from Sigma-Alrich, an affiliate of Merck KGaA, Darmstadt, Germany, were ball-milled in ethanol for 24 h. The mixed powder slurry was dried and then calcined at 800 °C for 4 h. Then, the calcined powder was ball-milled for another 24 h and dried, followed by a second calcination under the same condition. After the second ball-milling, the dried powders were ground, mixed with polyvinyl alcohol (PVA), and sieved through 100-μm mesh. Then, the granulated powders were pressed into pellets of a diameter of 10 mm and thickness of 1 mm with a pressure ~ 34.5 MPa. The pellets were placed in an alumina crucible and sintered in air at 1100 °C for 4 h. During sintering, the green pellets were covered with powders of the same composition KNNL6 to compensate for the volatilization of certain elements. The sintered pellets were then ground, and the obtained powder was sieved through 100-μm mesh for further structural characterization.
Time of flight neutron scattering experiments were performed at the NOMAD BL1B instrument of the Spallation Neutron Source (SNS) of the Oak Ridge National Laboratory, USA. The powder sample was filled into the standard NIST vanadium can with a diameter of 6 mm and loaded in an ILL furnace for measurements at different temperatures. Two ~24-min datasets were collected and then summed together to improve the measurement statistics. The background intensity was measured from an empty vanadium can, which was subtracted from the measured neutron scattering intensity from the sample. The background-corrected intensity was subsequently normalized against proton charge and scattering from a 6-mm vanadium rod to correct for neutron flux and detector efficiency, respectively.
3. Results and Discussion
Figure 1 shows the TOF neutron diffraction pattern of KNNL6 from 290 to 773 K. All the diffraction peaks could be indexed using a perovskite phase and no secondary phase was detected, which demonstrates the successful synthesis of KNNL6 ceramic. The tetragonal perovskite structure of KNNL6 is shown as an inset in Figure 1, where K/Na/Li atom occupies the unit cell corners, Nb is near the center of the unit cell, and oxygens are near the face centers. The diffraction peaks at 773 K can be indexed following an ideal cubic structure with the space group Pm3m. At 673 K, the (220), (311), (400), (420), and (422) peaks (marked with arrows) are split, which indicates a phase transition at this temperature. Additional changes in the diffraction peak profiles become evident at 373 K, which indicates another phase transition at this temperature. According to a previous study, the KNN-based phase structure can be quantified by assessing the relative intensity of the (004)/(400) and (040) peaks [31]. For the orthorhombic (or monoclinic) phase, the ratio of I (400)/(004)/I (040) is ~2:1, while this ratio decreases to 1:2 for the tetragonal phase. For the current measurements, at T = 290 K, the (004)/(400) and (040) peaks are of similar magnitude, which could imply the coexistence of orthorhombic (or monoclinic) and tetragonal phases [24]. At T = 473 K, I (400)/(004)/I (040) changes to ~1:2, which indicates a transition to a single tetragonal phase. At 773 K, these two peaks merge into one single peak, indicating a transition to a cubic phase. Therefore, based on a preliminary assessment of the (004)/(400) diffraction peaks, we hypothesized that KNNL6 undergoes transition from a two-phase mixture to a single tetragonal phase at an intermediate temperature, followed by the transition to a cubic phase at higher temperatures.
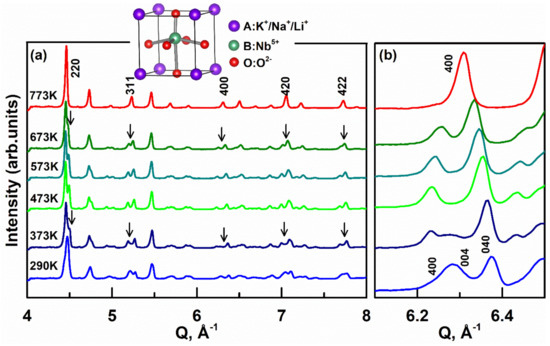
Figure 1.
(a) Evolution of the neutron diffraction patterns of 0.06LiNbO3-0.94K0.5Na0.5NbO3 (KNNL6) as a function of temperature from 290 to 773 K. hkl reflections are indexed based on a cubic perovskite structure. Inset is a perovskite structure of KNNL6. The arrows mark changes in hkl peak profiles, which indicate phase transitions. (b) Neutron diffraction patterns of {400} reflections as a function of temperature. The x-axis refers to the wavevector Q.
To further investigate the temperature-dependent evolution of the average crystal structure of KNNL6, we did Rietveld refinement of the neutron Bragg diffraction peaks measured between 290 and 773 K using the software General Structure Analysis System GSAS II [32]. The structural parameters, viz. unit cell constants, atomic coordinates, and atomic displacement parameters (ADPs) were simultaneously adjusted until best fits to the experimental data were achieved. The quality of the fits was assessed based on visual evaluation and weighted residuals Rw [33]. The experimental and calculated diffraction profiles of KNNL6 at different temperatures from 290 to 773 K are shown in Figure 2. At T ~773 K, a cubic Pm3m space group was refined against the experimental data, which provided a reasonable Rw of ~4.99%. For temperatures 673–473 K, best fits to the diffraction data were obtained with a tetragonal P4mm structure model, with Rw ~ 4.5–7%. In a recent related study, we showed that the structure of unmodified-KNN at room temperature is better described using a monoclinic structure with a Pm space group as compared to an orthorhombic structure with an Amm2 space group [34]. Accordingly, we adopted a two-phase coexistence “Pm + P4mm” model [27] for the fitting of Bragg diffraction data of KNNL6 measured at temperatures between 373 and 290 K. The two-phase model provided better reproduction of the Bragg peaks (Figure 2e,f) as compared to a single-phase Pm or P4mm model (Figures S1 and S2), and yielded an Rw of 4.08% and 4.04%, respectively. Importantly, the phase fractions of P4mm for KNNL6 at 290 and 373 K are 0.235 and 0.528, respectively, indicating progressive transformation of the Pm phase to the P4mm phase with increasing temperature. Note that the neutron diffraction patterns were recorded using all six banks of NOMAD. The diffraction data of the middle four banks (2θ = 31°, 67°, 122°, and 154°) were all fitted simultaneously in GSAS. The structural parameters obtained from Rietveld refinement of data from the middle four banks, such as unit cell constants, atomic coordinates, and atomic displacement parameters at various temperatures, are shown in Table 1. Figure 2 shows representative fits of the neutron diffraction patterns from BANK 5 (2θ = 154°), which has the highest resolution. The diffraction data and corresponding fits from all the other three banks are shown in the Supplementary Information (Figures S3–S5). The temperature-dependent changes of the structural parameters, viz. lattice parameters a, b, and c, are plotted in Figure 3a. It shows a large difference between the lattice parameters at and ct of the tetragonal (t) phase and the lattice parameters am and cm of the monoclinic (m) phase at T = 373 K near the orthorhombic–monoclinic phase boundary. In contrast, lattice parameters bm and bt approach each other near the tetragonal–monoclinic phase boundary. This indicates that the polar axis changes from [001]pc in the tetragonal phase to [101]pc in the monoclinic phase within the (010) plane, where the subscript pc indicates pseudocubic axes. The unit cell volume evolution as a function of temperature in Figure 3c indicates that the volume in tetragonal phase Vt is different from the volume in the monoclinic phase Vm at T < 473 K but shows a linear increase with increasing temperature in both the m and t phases.
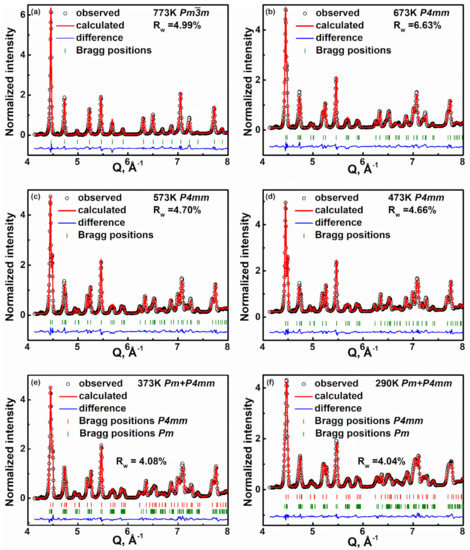
Figure 2.
Diffraction patterns of KNNL6 powder at different temperatures showing measured (black symbol), refined (red line), difference (blue line) profiles, and Bragg positions (green ticks). The data shown is from BANK 5 of the NOMAD instrument. (a) Pmm at 773 K; (b) P4mm at 673 K; (c) P4mm at 573 K; (d) P4mm at 473 K; (e) P4mm and Pm at 373 K; (f) P4mm and Pm at 290 K.

Table 1.
Structural parameters, fractional atomic coordinates, and equivalent isotropic displacement parameters (Uiso in Å2) from the Rietveld refinement and PDF fit (1.7–10 Å) results of neutron data of KNNL6 at various temperatures.
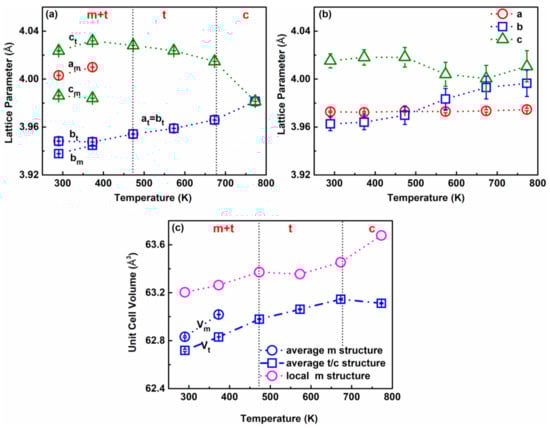
Figure 3.
Unit cell parameters for KNNL6 as a function of temperature from 290 to 773 K: (a) lattice parameters for the average structure from Rietveld refinement of neutron diffraction patterns. Vertical dotted lines represent phase transition temperatures in the average structure. The letters m, t, and c represent phases of monoclinic, tetragonal, and cubic, respectively. (b) Lattice parameters for the local structure from fits to G(r) of r~1.7–10 Å. (c) Unit cell volume for the average and local structure of KNNL6. Note that blue symbols represent parameters obtained from average Rietveld refinement, while the pink symbols represent parameters obtained from PDF refinement in the r range of 1.7–10 Å.
While Rietveld refinement of the Bragg diffraction peaks provides information of the long-range average structure, the local-scale correlations of atoms are not explicitly revealed in this method. In KNN-based materials, there is strong evidence that the local and the average structures are different and therefore we used the neutron pair distribution function (PDF) to investigate the local structural evolution in KNNL as a function of temperature [28]. The neutron pair distribution function (PDF) is calculated from the sine Fourier transform of the total neutron scattering intensity, which is sensitive to local-scale atomic correlations. The subtle changes in the local structure with temperature are indicated from the PDF peaks below r ~4 Å, which are shown in Figure 4. Here, the first arrow represents the Nb-O (B-O) interatomic distances, and the next two arrows represent the K/Na/Li-O (A-O) interatomic distances for the perovskite structure of KNNL6. For T ≥ 473 K, the Nb-O peak at ~2 Å is broad partly due to the higher thermal vibration of atoms. Moreover, this peak looks asymmetric, indicating that even at high temperature the Nb is off-centered within the oxygen octahedra. However, for T ≤ 373 K, the Nb-O peak appears to split and a shoulder at r ~ 2.1 Å becomes more prominent, which indicates that the off-centered Nb displacements also become more correlated at lower temperatures.
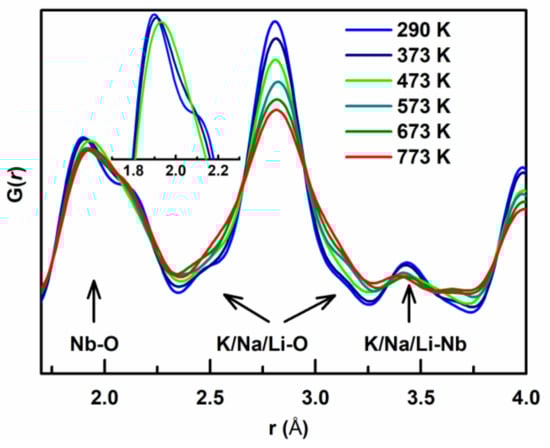
Figure 4.
Temperature-dependent evolution of G(r), showing nearest neighbor pairwise atomic correlations. Peaks representing Nb-O, K/Na/Li-O, and K/Na/Li-Nb bond lengths are marked with arrows.
To quantify the local Nb octahedral distortions at different temperatures, we used PDFGui to fit G(r) at short distances below r = 10 Å using different structure models [35]. At 290 K, in line with the Rietveld results, both Pm and P4mm structural models were examined for the fitting of the G(r) as shown in Figure 5a and Figure S6. The Pm model (Rw ~6.98%) provided a significantly better fit to the experimental G(r) data as compared to the P4mm model (Rw ~12.06%). Particularly, the peaks at r ~2 and r ~ 2.8 Å were better reproduced using the Pm model. Similarly, at 373 K, the Pm model yields a significantly better fit compared to the P4mm structural model, in Figure 5b and Figure S7. Models of P4mm and (or) Pm3m, which is the average structure for KNNL6 at higher-temperature T > 373 K, and Pm, which is the average structure at low-temperature T ≤ 373 K, were used to calculate G(r) and compared with the experimental G(r) of KNNL6 at T > 373 K. The resulting fits using Pm symmetry are shown in Figure 5c–f and fits using the high-symmetry models can be found in the Supporting Information (Figures S8–S11). It should be noted that the Rw of the fits all increases at increased temperatures, and this increase minimizes the difference in Rw between the high-symmetry models and the Pm models. Nevertheless, upon visual inspection, it is clear that the Pm model is better at describing the G(r). It is therefore apparent that the local structure for r < 10 Å in KNNL6 remains monoclinic with Pm distortion at all temperatures from 290 to 773 K, although the long-range average structure exhibits two different phase transitions in this temperature range. The difference between local structural distortion and its corresponding average structure is not unusual and has been observed earlier in BaTiO3 [36].
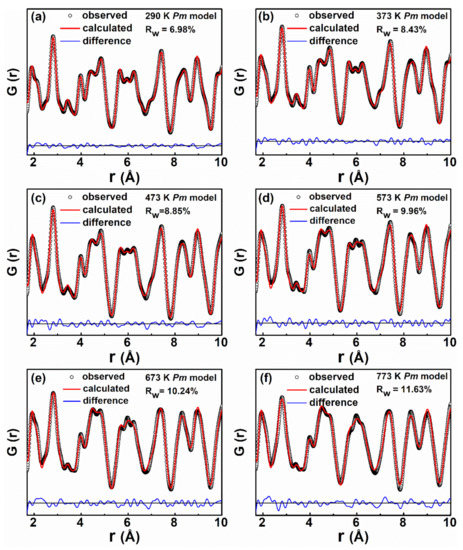
Figure 5.
Experimental and fitted G(r) profiles of KNNL6 for interatomic distance r < 10 Å, as a function of temperature: (a) 290, (b) 373, (c) 473, (d) 573, (e) 673, and (f) 773 K. The calculated profiles correspond to the fit obtained using a Pm space group, with starting parameters obtained from Rietveld analysis of the Bragg diffraction patterns at the corresponding temperature.
The refined structural parameters (unit cell constants, atomic coordinates, and ADPs) from the PDF in the range from r = 1.7 to 10 Å at 290–773 K are shown in Table 1. The temperature-dependent evolution of the local structural parameters is provided in Figure 3b. It can be observed from Figure 3b that the changes in the lattice parameters a, b, and c for the local structure are more subtle as compared to those for the average long-range structure. Furthermore, for the local structure, the lattice parameter a remains nearly constant, while b and c approach each other at higher temperatures. As shown in Figure 3c, the unit cell volume in the local structure (1.7–10 Å) also shows a slighter increase with temperature compared to that in the average structure, especially at T < 773 K.
Based on Rietveld refinement of the Bragg peaks as well as the analysis of G(r) above, the fractional displacements of Nb at different temperatures from its high-symmetry position are shown in Figure 6a,b (see Supplementary Information for detailed calculations). The components of Nb fractional displacements along both the () and () directions are indicated in Figure 6a. In Figure 6a, the Nb fractional displacements in the average structure are represented by blue open symbols, and local Nb displacements are represented by pink closed symbols. Note that the Pm model is more appropriate for the local structure, which allows Nb displacement within the a-c plane. However, is higher than , which is consistent with the Nb displacement direction reported by Petkov et al. [28]. The variation in net fractional displacements as a function of temperature is shown in Figure 6b. The net fractional displacement of Nb in the local structure is higher compared with its average structure, which confirms that the local structure is more distorted than the average structure. Additionally, Nb fractional displacement in the local structure decreases linearly with increasing temperature at T ≤ 473 K and then remains relatively stable at higher temperatures. Interestingly, larger temperature-dependent changes are observed for Nb displacements in the average tetragonal and monoclinic phases below 473 K, as compared to changes in Nb displacements in the local structure.
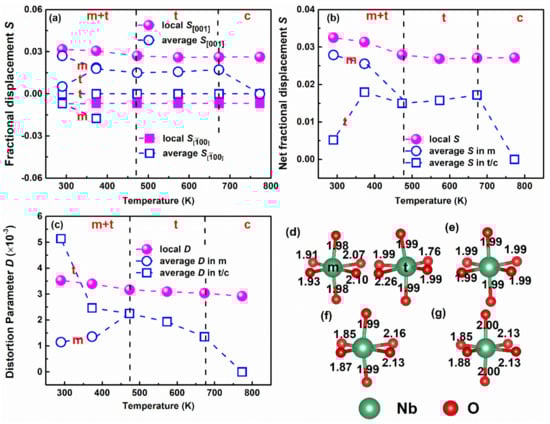
Figure 6.
Atomic displacement and octahedral distortion as a function of temperature: (a) Nb fractional displacement along and [001] (S001) directions, and (b) net Nb fractional displacement as a function of temperature from 290 to 773 K. (c) Octahedral distortion parameter as a function of temperature from 290 and 773 K for the local and average structures. Note that open blue symbols represent parameters obtained from average Rietveld refinement, while the closed pink symbols represent parameters obtained from PDF refinement in the r range of 1.7–10 Å. (d,e) Illustration of the NbO6 octahedron in the average structure at 290 (left top) and 773 K (right top), respectively. (f,g) Illustration of the NbO6 octahedron in the local structure at 290 (left bottom) and 773 K (right bottom), respectively. The indicated Nb-O bond lengths in (d–g) are in the Angstroms (Å).
Based on Nb off-centering within the O octahedra, the distortion parameter (D) can be calculated using the following equation:
where n is the coordination number (in this case n = 6), and di and d are the individual and average values of the Nb-O bond lengths, respectively [37]. Figure 6c shows the temperature-dependent changes for D in KNNL6, where the open blue symbols represent D in the average structure and the pink closed symbols represent D in the local structure. It is revealed that for the long-range average structure, D is much higher in the tetragonal phase than that in the monoclinic phase for T ≤ 473 K, which is consistent with the conclusions of a previous study [38]. In contrast, D for the local structure decreases slightly with increasing temperature, from D~0.0035 at T < 473 K to D~0.0032 at T = 473 K. This also indicates a small change (~9%) in octahedra distortion at T = 473 K. An obvious splitting of the peak near r ~ 2 Å for T < 473 K clearly indicates two set of nearest neighbor Nb-O bond distances, as shown in Figure 6f. However, the octahedra distortion changes slightly in the local structure, as compared to that for the average structure, which indicates that the local structure within r ~10 Å in KNNL6 is thermally more stable as compared to the average structure. Figure 6d–g graphically shows the evolution of the Nb-O bond lengths in the octahedra with temperature for both the average structure (Figure 6d,e) and the local structure (Figure 6f,g). Based on average structure analysis, both the monoclinic (m) and tetragonal (t) phase coexist at 290 K. The distribution of Nb-O bond lengths in the average t phase is broader (1.76–2.26 Å) as compared to that in the m phase (1.91–2.10) Å, as shown in Figure 6d, which results in a larger value of D~0.0051 in the t phase and a lower value of D~0.0012 in the m phase. As indicated in Figure 6e, the average structure of KNNL6 at high temperatures ~773 K becomes cubic with six equal Nb-O bond lengths. In contrast, the Nb-O bond lengths in the local structure evolves slightly with temperature as shown in Figure 6f,g. For the local structure of KNNL6 at 290 K in Figure 6f, there are two groups of Nb-O bonds with bond distances of ~1.9 and 2.1 Å, which leads to a splitting of the Nb-O peak at low temperatures as can be observed from Figure 4 with D~0.0035. With increasing temperature, the Nb-O bond length changes with a relatively lower D~0.0032 at 473 K, and D~0.0030 at 773 K, which indicates a relatively stable D evolution with temperature in local structure compared with its average structure as shown in Figure 6c. In this respect, KNNL6 shares commonalities with Pb-based perovskite ferroelectrics, such as [39,40,41].
4. Conclusions
In summary, we systematically studied the evolution of local and average structures in 0.06LiNbO3-0.94K0.5Na0.5NbO3 (KNNL6) as a function of temperature in the range from 290 to 773 K using neutron total scattering. Analysis of the Bragg peaks indicated a coexistence of monoclinic and tetragonal phases at room temperature, which transitions to a single tetragonal phase for temperatures above 473 K and a cubic phase above 673 K. In contrast, the short-range structure within 10 Å is best described as monoclinic within the same temperature range. Furthermore, the local octahedral distortion remains comparatively stable as a function of temperature, in contrast to larger temperature-dependent changes in the octahedral distortion of the average structure. These results indicate that KNNL ceramics exhibit length-scale-dependent structural complexities, the implications of which towards structure–property relationships should be further studied.
Supplementary Materials
The following are available online at https://www.mdpi.com/article/10.3390/cryst11040395/s1, Figures S1–S5: Details of Rietveld refinement of neutron diffraction data, Figures S6–S11: Details of PDFGui fits of the neutron PDF data at different temperatures, Figure S12: Structural models of local and average structures of KNN and details of polarization calculation, Figure S13: fitting of PDF peak for Nb-O nearest neighbor distances.
Author Contributions
Conceptualization, A.P.; Data curation, J.L., F.M. and M.R.V.J.; Formal analysis, J.K. and F.M.; Investigation, J.K. and A.P.; Methodology, J.K. and M.R.V.J.; Project administration, A.P.; Resources, J.L.; Supervision, A.P.; Writing—original draft, J.K. and A.P.; Writing—review & editing, J.L., F.M., M.R.V.J. and A.P. All authors have read and agreed to the published version of the manuscript.
Funding
Funding support from CityU (Projects No. 7005121 and 6000688) and Research Grants Council of HK (Project No. 9043039) are gratefully acknowledged. FM and MRVJ thank the Danish Agency for Science, Technology, and Innovation for funding the instrument center DanScatt.
Institutional Review Board Statement
Not Applicable.
Informed Consent Statement
Not Applicable.
Data Availability Statement
All relevant data are available from the corresponding author upon reasonable request.
Acknowledgments
Affiliation with the Center for Integrated Materials Research (iMAT) at Aarhus University is gratefully acknowledged. J.K. and F.M. gratefully acknowledge Michelle Everett for assisting with measurements at the NOMAD instrument. Research conducted at the NOMAD beamlines at ORNL’s Spallation Neutron Source was sponsored by the Scientific User Facilities Division, Office of Basic Sciences, U.S. Department of Energy.
Conflicts of Interest
The authors declare no conflict of interest.
References
- Uchino, K. Ferroelectric Devices; Mercel Dekker: New York, NY, USA, 2000. [Google Scholar]
- Maurya, D.; Pramanick, A.; Viehland, D. (Eds.) Ferroelectric Materials for Energy Harvesting and Storage; Woodhead Publishing: Cambridge, MA, USA, 2020. [Google Scholar]
- Yang, L.; Kong, X.; Li, F.; Hao, H.; Chang, Z.; Liu, H.; Li, J.-F.; Zhang, S. Perovskite lead-free dielectrics for energy storage application. Prog. Mater. Sci. 2019, 102, 72–108. [Google Scholar] [CrossRef]
- Alpay, S.P.; Mantese, J.; Trolier-McKinstry, S.; Zhang, Q.; Whatmore, R.W. Next-generation electrocaloric and pyroelectric materials for solid-state electrothermal energy interconversion. MRS Bull. 2014, 39, 1099–1109. [Google Scholar] [CrossRef]
- Brennecka, G.; Sherbondy, R.; Schwartz, R.; Ihlefeld, J. Ferroelectricity—A revolutionary century of discovery. Am. Ceram. Soc. Bull. 2020, 99, 24–30. [Google Scholar]
- Jaffe, B.; Roth, R.S.; Marzullo, S. Piezoelectric properties of lead zirconate-lead titanate solid-solution ceramics. J. Appl. Phys. 1954, 25, 809–810. [Google Scholar] [CrossRef]
- Cao, W.; Cross, L.E. Theoretical model for the morphotropic phase boundary in lead zirconate-lead titanate solid solution. Phys. Rev. B 1993, 47, 4825–4830. [Google Scholar] [CrossRef] [PubMed]
- Noheda, B.; Cox, D.E.; Shirane, G.; Guo, R.; Jones, B.; Cross, L.E. Stability of the monoclinic phase in the ferroelectric perovskite PbZr1-xTixO3. Phys. Rev. B 2000, 63, 014103. [Google Scholar] [CrossRef]
- Bellaiche, L.; Garcia, A.; Vanderbilt, D. Finite-temperature properties of Pb(Zr1-xTix)O3 alloys from first principles. Phys. Rev. Lett. 2000, 84, 5427–5430. [Google Scholar] [CrossRef]
- Rödel, J.; Webber, K.G.; Dittmer, R.; Jo, W.; Kimura, M.; Damjanovic, D. Transferring lead-free piezoelectric ceramics into application. J. Eur. Ceram. Soc. 2015, 35, 1659–1681. [Google Scholar] [CrossRef]
- Pramanick, A.; Nayak, S. Perspective on emerging views on microscopic origin of relaxor behavior. J. Mater. Res. 2021. [Google Scholar] [CrossRef]
- Zhang, N.; Zheng, T.; Wu, J. Lead-free (K,Na)NbO3-based materials: Preparation techniques and piezoelectricity. Acs Omega 2020, 5, 3099–3107. [Google Scholar] [CrossRef]
- Lv, X.; Zhu, J.; Xiao, D.; Zhang, X.-X.; Wu, J. Emerging new phase boundary in potassium sodium-niobate based ceramics. Chem. Soc. Rev. 2020, 49, 671–707. [Google Scholar] [CrossRef]
- Yang, Z.; Du, H.; Qu, S.; Hou, Y.; Ma, H.; Wang, J.; Wang, J.; Wei, X.; Xu, Z. significantly enhanced recoverable energy storage density in potassium-sodium niobate-based lead free ceramics. J. Mater. Chem. A 2016, 4, 13778. [Google Scholar] [CrossRef]
- Baker, D.W.; Thomas, P.A.; Zhang, N.; Glazer, A.M. A comprehensive study of the phase diagram of KxNa1−xNbO3. Appl. Phys. Lett. 2009, 95, 91903. [Google Scholar] [CrossRef]
- Zhang, Y.; Li, J.-F. Review of chemical modification on potassium sodium niobate lead-free piezoelectrics. J. Mater. Chem. C 2019, 7, 4284–4303. [Google Scholar] [CrossRef]
- Chu, S.-Y.; Water, W.; Juang, Y.-D.; Liaw, J.-T. Properties of (Na, K)NbO3 and (Li, Na, K)NbO3 ceramic mixed systems. Ferroelectrics 2003, 287, 23–33. [Google Scholar] [CrossRef]
- Guo, Y.; Kakimoto, K.; Ohsato, H. Phase transitional behavior and piezoelectric properties of (Na0.5K0.5)NbO3–LiNbO3 ceramics. Appl. Phys. Lett. 2004, 85, 4121–4123. [Google Scholar] [CrossRef]
- Hollenstein, E.; Davis, M.; Damjanovic, D.; Setter, N. Piezoelectric properties of Li- and Ta-modified (K0.5Na0.5)NbO3 ceramics. Appl. Phys. Lett. 2005, 87, 182905. [Google Scholar] [CrossRef]
- Li, Y.-M.; Shen, Z.-Y.; Wu, F.; Pan, T.-Z.; Wang, Z.-M.; Xiao, Z.-G. Enhancement of piezoelectric properties and temperature stability by forming an MPB in KNN-based lead-free ceramics. J. Mater. Sci. Mater. Electron. 2014, 25, 1028–1032. [Google Scholar] [CrossRef]
- Saito, Y.; Takao, H.; Tani, T.; Nonoyama, T.; Takatori, K.; Homma, T.; Nagaya, T.; Nakamura, M. Lead-free piezoceramics. Nature 2004, 432, 84–87. [Google Scholar] [CrossRef]
- Zhang, S.; Xia, R.; Hao, H.; Liu, H.; Shrout, T.R. Mitigation of thermal and fatigue behavior in K(0.5)Na(0.5)NbO(3)-based lead free piezoceramics. Appl. Phys. Lett. 2008, 92, 152904–1529043. [Google Scholar] [CrossRef]
- Liu, S.J.; Wan, B.; Wang, P.; Song, S.-H. Influence of A-site non-stoichiometry on structure and electrical properties of K0.5Na0.5NbO3-based lead-free piezoelectric ceramics. Scr. Mater. 2010, 63, 124–127. [Google Scholar] [CrossRef]
- Wang, K.; Li, J.-F. Analysis of crystallographic evolution in (Na,K)NbO3-based lead-free piezoceramics by X-ray diffraction. Appl. Phys. Lett. 2007, 91, 262902. [Google Scholar] [CrossRef]
- Wu, L.; Zhang, J.; Zheng, P.; Wang, C. Influences of morphotropic phase boundaries on physical properties in (K,Na,Li)Nb0.80Ta0.20O3 ceramics. J. Phys. D Appl. Phys. 2007, 40, 3527–3530. [Google Scholar] [CrossRef]
- Mgbemere, H.E.; Hinterstein, M.; Schneider, G.A. Electrical and structural characterization of (KxNa1−x)NbO3 ceramics modified with Li and Ta. J. Appl. Cryst. 2011, 44, 1080–1089. [Google Scholar] [CrossRef]
- Ge, W.; Ren, Y.; Zhang, J.; Devreugd, C.P.; Li, J.; Viehland, D. A monoclinic-tetragonal ferroelectric phase transition in lead-free (K0.5Na0.5)NbO3−x%LiNbO3 solid solution. J. Appl. Phys. 2012, 111, 103503. [Google Scholar] [CrossRef]
- Petkov, V.; Kim, J.-W.; Shastri, S.; Gupta, S.; Priya, S. Geometrical frustration and piezoelectric response in oxide ferroics. Phys. Rev. Mater. 2020, 4. [Google Scholar] [CrossRef]
- Egami, T. Local structure of ferroelectric materials. Annu. Rev. Mater. Res. 2007, 37, 297–315. [Google Scholar] [CrossRef]
- Zhu, H.; Huan, Y.; Ren, J.; Zhang, B.; Ke, Y.; Jen, A.K.-Y.; Zhang, Q.; Wang, X.-L.; Liu, Q. Bridging structural inhomogeneity to funcationality: Pair distribution function methods for functional materials development. Adv. Sci. 2021, 8, 2003534. [Google Scholar] [CrossRef] [PubMed]
- Wang, K.; Li, J.-F.; Liu, N. Piezoelectric properties of low-temperature sintered Li-modified (Na, K)NbO3 lead-free ceramics. Appl. Phys. Lett. 2008, 93, 92904. [Google Scholar] [CrossRef]
- Toby, B.H.; Dreele, R.B. von. GSAS-II: The genesis of a modern open-source all purpose crystallography software package. J. Appl. Cryst. 2013, 46, 544–549. [Google Scholar] [CrossRef]
- McCusker, L.B.; Dreele, R.B.; von Cox, D.E.; Louër, D.; Scardi, P. Rietveld refinement guidelines. J. Appl. Cryst. 1999, 32, 36–50. [Google Scholar] [CrossRef]
- Kong, J.; Liu, J.; Marlton, F.; Jorgensen, M.R.V.; Pramanick, A. Local structural mechanism for phase transition and ferroelectric polarization in mixed-oxide K0.5Na0.5NbO3. Unpublished work.
- Farrow, C.L.; Juhas, P.; Liu, J.W.; Bryndin, D.; Bozin, E.S.; Bloch, J.; Proffen, T.; Billinge, S.J.L. PDFfit2 and PDFgui: Computer programs for studying nanostructure in crystals. J. Phys. Condens. Matter 2007, 19, 335219. [Google Scholar] [CrossRef]
- Petkov, V.; Gateshki, M.; Niederberger, M.; Ren, Y. Atomic-Scale Structure of Nanocrystalline BaxSr1-xTiO3 (x = 1, 0.5, 0) by X-ray Diffraction and the Atomic Pair Distribution Function Technique. Chem. Mater. 2006, 18, 814–821. [Google Scholar] [CrossRef]
- Veselinović, L.; Mitrić, M.; Avdeev, M.; Marković, S.; Uskoković, D. New insights into BaTi1–xSnxO3(0 ≤ x ≤ 0.20) phase diagram from neutron diffraction data. J. Appl. Cryst. 2016, 49, 1726–1733. [Google Scholar] [CrossRef]
- Sun, X.; Deng, J.; Chen, J.; Sun, C.; Xing, X. Effects of Li Substitution on the Structure and Ferroelectricity of (Na,K)NbO3. J. Am. Ceram. Soc. 2009, 92, 3033–3036. [Google Scholar] [CrossRef]
- Teslic, S.; Egami, T.; Viehland, D. Local atomic structure of PZT and PLZT studied by pulsed neutron scattering. J. Phys. Chem. Solids 1996, 57, 1537. [Google Scholar] [CrossRef]
- Dmowski, W.; Akbas, M.K.; Davies, P.K.; Egami, T. Local structure of Pb(Sc1/2,Ta1/2)O3 and related compounds. J. Phys. Chem. Solids 2000, 61, 229. [Google Scholar] [CrossRef]
- Egami, T. Temperature dependence of the local structure in Pb containing relaxor ferroelectrics. AIP Conf. Proc. 2003, 677, 48–54. [Google Scholar]
Publisher’s Note: MDPI stays neutral with regard to jurisdictional claims in published maps and institutional affiliations. |
© 2021 by the authors. Licensee MDPI, Basel, Switzerland. This article is an open access article distributed under the terms and conditions of the Creative Commons Attribution (CC BY) license (https://creativecommons.org/licenses/by/4.0/).