Article

Numerical Simulation of Microstructure Evolution in Solidification Process of Ferritic Stainless Steel with Cellular Automaton

1
School of Metallurgical Engineering, Xi’an University of Architecture and Technology, Xi’an 710055, China
2
School of Computer Science and Technology, Xidian University, Xi’an 710071, China
*
Author to whom correspondence should be addressed.
Crystals 2021, 11(3), 309; https://doi.org/10.3390/cryst11030309
Submission received: 22 February 2021 / Revised: 13 March 2021 / Accepted: 18 March 2021 / Published: 21 March 2021

Abstract

:
In order to study the basic principles of vibration-excited liquid metal nucleation technology, a coupled model to connect the temperature field calculated by ANSYS Fluent and the dendritic growth simulated by cellular automaton (CA) algorithm was proposed. A two-dimensional CA model for dendrite growth controlled by solute diffusion and local curvature effects with random zigzag capture rule was developed. The proposed model was applied to simulate the temporal evolution of solidification microstructures under different degrees of surface undercooling and vibration frequency of the crystal nucleus generator conditions. The simulation results showed that the predicted columnar dendrites regions were more developed, the ratio of interior equiaxed dendrite reduced and the size of dendrites increased with the increase of the surface undercooling degrees on the crystal nucleus generator. It was caused by a large temperature gradient formed in the melt. The columnar-to-equiaxed transition (CET) was promoted, and the refined grains and homogenized microstructure were also achieved at the high vibration frequency of the crystal nucleus generator. The influences of the different process parameters on the temperature gradient and cooling rates in the mushy zone were investigated in detail. A lower cooling intensity and a uniform temperature gradient distribution could promote nucleation and refine grains. The present research has guiding significance for the process parameter selection in the actual experimental.

1. Introduction

Ferritic stainless steel is easy to form developed columnar dendrites during solidification [1]; in the rolling process, it is easy to form a strong texture and this is the main reason for wrinkles, cracks, and other defects [2], which restrict its yield and wide application. Increasing the ratio of the equiaxed dendrite is an effective method to improve its forming defects. A new vibration-excited liquid metal nuclear technique has been proposed to improve the solidification structure of ferritic stainless steel, and it has been proved that this technology is beneficial to increase the equiaxed grains [3,4,5]. At present, it is necessary to reveal the quantitative relationship between the process variables and the solidification microstructure, but it is difficult to visually observe the dendrite growth process in the molten metal by conventional experiment. Numerical simulations were developed to understand the dendritic growth and microstructure formation in solidification in the last twenty years [6,7,8,9]. The cellular automaton (CA) method has been rapidly developed as an attractive and efficient technique to predict the evolution of solidification structures [10,11,12] and study the mechanical properties of composite in the field of materials science [13,14].
Zhu and Hong [15,16] first developed the modified cellular automaton model (MCA) and studied dendritic growth at the microscopic scale. The model was able to reproduce qualitatively most of the dendritic features observed experimentally, in which the growth velocity of the dendrite tip is determined by analytical solution (Kurz–Giovanola–Trivedi model) [17,18]. Subsequently, the MCA model was coupled with momentum and mass transport equations to predict the dendritic growth in a forced flow [19,20]. Zhu [21] proposed a solution of the kinetics of dendritic growth based on the local solute equilibrium approach (ZS model). The ZS model was extended to a three-dimensional scale, to simulate the 3D dendrites with various orientations [22], and was coupled with a finite difference method to simulate the micro-porosity formation during solidification of aluminum alloys [23].
Many studies have focused on the coupling of the CA algorithm and macroscopic transmission equation by finite element (FE), finite volume (FV), or lattice Boltzmann method (LBM) analyses to simulate the structure formation under different solidification conditions. Yin et al. [24] studied the columnar dendrite growth in the molten pool during the laser-engineered net shaping (LENS) process by CA–FE model, it revealed the influences of laser scanning speed, the layer thickness, and the substrate size on the dendrites orientation and dendrite arm spacing (DAS). Han et al. [25,26] developed the CA–FE model to reveal the process of dendrite epitaxial nucleation from the substrate and investigated the micro-mechanisms for the axial structure and the curved columnar grain formed in a molten pool of welding. The microstructure morphology and formation mechanism of the molten pool during the additive manufacturing process were studied by combining the solution of the macro-field equation with micro-CA dendrite growth algorithms in various studies [27,28,29].
Moreover, many studies focusing on the elimination of computations anisotropy, which is introduced by the CA algorithm, have been discussed [30,31,32,33,34,35]. Wei [36] found that the traditional neighborhood rules showed strong artificial anisotropy at the axial of the grid, thus the random zigzag and limited neighbor solid fraction (LNSF) method have been proposed [37,38]. In a more recent study, Wei [39] used a height function method to calculate numerical curvature. The study [40] proved that the height function method appears to be the most accurate method in calculating the local curvature from cell solid fraction. The dendrite growth at arbitrary orientations could be well reproduced. The effect of interfacial energy anisotropy on dendrite growth morphology was also investigated in Wei’s study. The model extended to simulate the anomalous eutectic growth [41].
In our previous study [42], a three-dimensional model of cylindrical mold and a nucleus generator with vibration and the chilling effect was established, and the characteristics of temperature and flow fields under different sets of process parameters were investigated by commercial software ANSYS Fluent(Ansys INC., Canonsburg, PA, USA). The numerical simulation of exploring the grain nucleation and growth process under vibration-excited liquid metal nuclear technique has not been reported.
In the present study, a two-dimensional microscopic dendrite growth CA model was constructed to study the process of dendrites nucleation from the surface of the vibration chilling generator and growth into the melt under the effect of a temperature gradient. The influence of process parameters (the different degrees of surface undercooling and vibration frequency of the crystal nucleus generator) on the evolution of solidification microstructures and CET behavior were investigated by coupling the CA model with temperature field calculation results. It aims to explore the influence mechanism of process parameters on the solidification microstructure and provide guidance for the actual experimental.

2. Model Description

This section mainly describes the process of establishing the CA algorithm in the article. The simulation results of macroscopic physics can be traced back to the previous research [42], and hence it will not be repeated here.

2.1. Nucleation Model

The continuous nucleation model proposed by Thevoz [43] was used to describe the heterogeneous nucleation process in the melt. The relationship between the increase in nucleus density d n and the undercooling d ( T ) in the Thevoz model follows the Gaussian distribution,
d n d ( T ) = n m a x 2 π T σ e x p [ 1 2 ( T T n T σ ) 2 ]
T = T l i q + m l ( C l C 0 ) T * ,
where T is the nucleation undercooling, T n and T σ are the average value and standard deviation of the nucleation undercooling,   n m a x is the maximum density of nuclei, T l i q is liquidus temperature,   m l is liquidus slope, T * is the local temperature, and C l is the local actual liquid concentration. The nucleation undercooling of the bulk liquid that is considered the phenomenon of solute enrichment will alter the actual liquidus temperature; thus, the change in the solute concentration affects the degree of undercooling and feeds back to the nucleation and growth processes.
During one time step, δ t , the undercooling of a given CA cell increases by an amount δ ( T ) . Accordingly, the density of new grains, δ n , which are nucleated within the volume of the melt is given by
δ n = n ( T + δ ( T ) ) n ( T ) = T T + δ ( T ) d n d ( T ) d ( T )
P n = δ n · V C A   ,
where V C A is the volume of the CA cell,   x and x 2 (μm and μm2) corresponding to the mold wall and in the bulk liquid, respectively, and P n is nucleation probability in the cell. During the time step, nucleation will be activated in a liquid cell that needs to meet two conditions—first, the total undercooling in the cell is greater than the critical nucleation undercooling, and second, the nucleation probability is greater than a random number that ranges from 0 to 1. After nucleation, the cell becomes active and grows with a preferential direction corresponding to the randomly crystallographic orientation.

2.2. Solute Field Calculation

During the solidification of alloys, the dendritic growth is mainly controlled by solute transport. Without considering the natural and forced convection in the liquid, the governing equation for diffusion in the domain can be described as follows:
C l t = x [ D l C l x ] + y [ D l C l y ] + C l ( 1 k e ) f s t
C s = k e C l ,
where C l and C s are the solute concentration in liquid and solid phases, respectively,   D l is the solute diffusion coefficient in liquid phases, and k e is partition coefficient. The third term on the right-hand side is included only at the interface cell and denotes the amount of solute rejected at the interface. Additionally, the solute partition between liquid and solid at solid–liquid interface (SL interface) is calculated by Equation (6).
A central finite difference method was used to calculate the liquid concentration of cells as described by Equation (5). The method [21] of setting the equivalent composition C e was used to calculate the local liquid composition in the SL interface at each time interval.

2.3. Interface Growth Kinetics

The interface growth kinetics used in the present study was proposed by Zhu and Stefanescu [21]. The fundamental concept of the dendritic growth kinetics was considered to be driven by the difference between the local equilibrium composition and the local actual liquid composition. According to the thermodynamic concept of local equilibrium between the liquid and solid phases, the interface equilibrium composition C l * and the increase in the solid fraction F s of an interface cell can be calculated by
C l * = C 0 + 1 m l [ T l i q T * Γ K f ( φ , θ ) ]
F s = C l * C l C l * ( 1 k e )
f ( φ , θ ) = 1 15 ε   c o s [ 4 ( φ θ ) ] ,
where T l i q is the equilibrium liquidus temperature at the initial composition, T * is the local temperature in the dendrite tip, C l * is the interface equilibrium composition, C 0 is the initial equilibrium concentration and m l is liquidus slope, Γ is the Gibbs–Thomson coefficient, K is the curvature of the SL interface, and   f ( φ , θ ) is a function describing the anisotropy of the interface energy, where θ is crystallographic orientation, φ is the angle of the normal to the interface with the coordinate axis, ε is the interface anisotropy intensity parameter, which is 0.04 in present work. The term Γ K f ( φ , θ ) in Equation (7) indicates the effect of interfacial energy on the process of dendrite growth; only by accurately calculating the curvature of the interface, the effect of the interface energy can be characterized.
For each interface cell with a non-zero solid fraction, the compositions of liquid and solid are calculated and stored simultaneously. The solid and liquid composition is calculated as follows:
C s n e w = C s o l d F s + k e C l o l d F s F s + F s
C l n e w = C l o l d × [ 1 + ( 1 k e ) × F s ] ,
where C l n e w and C s n e w are the liquid and solid composition in the interface cell at the current moment. Similarly, C l o l d and C s o l d represent the liquid and solid composition at the previous moment, respectively. F s is the solid fraction inside the cell. When the interface cell is completely solidified (i.e.,   F s =   1 ), the excess solute components are distributed to eight neighbor liquid cells according to the concentration differences, which aim at maintaining the solute conservation conditions of the system.

2.4. Calculation of the SL Interface Curvature and the Capture Rules

According to Wei’s research [39,44], the accurate result of the interface curvature played a critical role in the CA algorithm to correct the anisotropy of the grid. The lack of accuracy in curvature calculation significantly influenced the accuracy of the CA model. The conventional curvature calculation method includes the counting cell method and the variation of the unit vector normal (VUVN) to the solid–liquid interface. The calculation method of curvature and interface growth angle is as follows:
K = 2 f s x f s y 2 f s x y ( f s x ) 2 2 f s y 2 ( f s y ) 2 2 f s x 2 [ ( f s x ) 2 + ( f s y ) 2 ] 3 / 2
φ = arccos [ f s / x ( ( f s / x ) 2 + ( f s / y ) 2 ) 1 / 2 ] .
However, the Equations (12) and (13) needs to calculate the derivatives of solid fractions, which is difficult to be accurately calculated in a single interface cell. Thus, the capture rules in this article adopt the random zigzag capture rule and calculated the SL interface curvature by the bilinear interpolation VUVN method, which aims to avoid the mesh anisotropy introduced by Von Neumann and Moore’s capture rule; the calculation details can be found in the reference [37].

2.5. The Simulation Principle of Technique

Figure 1 presents the basic principles of the vibration-excited liquid metal nucleation technique. The main process [4,42] can be summarized as follows: a cylindrical bar with a cooling structure and high-frequency vibration was inserted into the superheated liquid metal, and the distribution of temperature and flow field in the melt correspondingly changed significantly. The function of the crystal nucleus generator could be divided into two important parts. It could maintain a large degree of undercooling between the nucleus generator surface and liquid metal, which could change the temperature gradient distribution and cooling intensity in the melt, as is shown in Figure 1a. Moreover, the violent vibration effect triggered a convection stirring process in the melt, which enhanced the convection capacity in the liquid melt, as is shown in Figure 1b. As a result, the effect of fluid flow could create uniform temperature gradient distribution and break off the primary dendrites arm, and the fragments of dendrites were drawn into the melt, which increased the potential heterogeneous nucleation site.
The present dendrite growth algorithm does not consider the remelting effect, the breaking process of dendrite fragments, and the influence of the melt convection on the quantity and position of crystal nuclei because these required duplicated model construction and huge computational efficiency. Future research can learn from the methods in computational fluid dynamics [45,46] to optimize and expand the model. The contribution of dendrite fragmentation due to the vibration-induced convection was incorporated into the nucleation model by increasing the probability of nucleation event in liquid. Based on the previous experimental research, the nucleation probability P n in 25% increments as a simulation parameter, when the vibration frequency increases. The thermal properties of the ferritic stainless steel Cr17 used in the present simulation are listed in Table 1 [47,48].

3. Results and Discussion

3.1. Equiaxed Dendritic Growth in Undercooled Melt

Figure 2 shows the process of a single equiaxed dendrite growing at the undercooled melt with different undercooling. A square calculation domain was divided into 1000 × 1000 cells with a cell size of 0.5 μ m . The whole calculation area was maintained at a constant undercooling degree and the cell state was initialized to liquid phase with the solute concentration of C 0 . A round nucleus with the composition k · C 0 and the radius of 10 grid size was placed at the center of the domain. Zero-flux solute boundary conditions were applied; the effect of convection on solute transport was ignored in the model.
Comparing the two sets of pictures, it can be derived that the dendrite exhibits the branchless needle morphology at lower undercooling; on the contrary, the dendrites growth is fast with developed branches at larger undercooling. Figure 3 shows the characteristics of the solute distribution and the growth rate of the dendrite tip obtained by simulation at the conditions of T   =   5   K and mesh size x = 0.5 μm. Figure 3a reveals that the excess solute is released by the dendrite arm and accumulates at the surrounding liquid phase at the initial solidification stage. There is an exponential drop in solute concentration at the SL interface, which represents the solute enrichment region and corresponds to the red envelope, shown in Figure 2. As the growth continues, the liquid composition at the front of the interface gradually stabilizes, as shown by the curves at 0.063 s and 0.072 s in Figure 3b. This indicates that the liquid composition at the front of the interface has reached the equilibrium liquid composition, and dendrites enter steady-state growth stage.
Figure 3c recorded the measured average growth velocity of the dendrite tip at different times. The dendrite tip has a high velocity at the early stage of solidification, and later, the tip growth velocity decreases rapidly, reaching the steady-state value of 248 μm/s after 0.45 s. The result indicates that the steady-state growth velocity of the dendrite tip is in good agreement with the calculation result of the LGK (Lipton-Kurz-Glicksman) model, which verifies the quantitative analysis capability of the model.

3.2. The Evolution of Microstructure

A computational domain with 1.6 × 4.0 mm2 was meshed into CA cells with a size of x   =   2   μm and was initially full of the solute concentration of C 0 at the liquidus temperature. The transient thermal conditions of the microscopic CA grid are interpolated from the result calculated by ANSYS Fluent 17.0, and the dendritic evolution under the vibration-excited liquid metal nucleation technology is predicted with the 2D parallel CA–FD model, as shown in Figure 4.
Nucleation occurs first on the chilling surface of the nucleus generator. Columnar dendrites grow along the direction of the highest temperature gradient until the equiaxed grains are formed in the undercooled melt when the degree of local liquid undercooling is greater than the critical nucleation undercooling T N . The nucleation and growth processe of equiaxed grains are determined by the local thermal and solute fields according to Equation (2). Finally, the growth of columnar dendrites is hindered by equiaxed crystals, forming a tendency for columnar dendrites and equiaxed dendrites to compete with each other.
Figure 5 depicts the grain structures obtained by simulation result and experiment, respectively. It can be seen that the grain morphology simulated by the CA model is in good agreement with the experimental result. The average grain size of equiaxed grain obtained by simulation and experiment are 103 μm and 123 μm, respectively. Compared with the simulation results, the average grain size distribution obtained in the experiment is not uniform.
In the following part, the location of columnar-to-equiaxed transition (CET), the numbers of newly formed dendrites, and the average grain size are analyzed quantitatively. The effects of the undercooling degree and the vibration frequency on the thermal distribution conditions and microstructure evolution are discussed in detail.

3.3. Influence of the Surface Undercooling Degree

In this set of simulations, the vibration frequency of the crystal nucleus generator was set to a constant value of 1000 Hz, and the structure characteristic formed in the melt under different degrees of undercooling on the surface of the crystal nucleus generator was explored.
Figure 6 shows the dendritic structures under the different undercooling conditions with 200–700 K, which means T   =   T m e l t   -   T s u r f , where T m e l t and T s u r f is the temperature of the melt and the temperature on the crystal nucleus generator surface at the initial stage, respectively. When the undercooling increases from 300 to 700 K, the columnar dendrites regions are more developed, but the area of the equiaxed dendrites regions decreases significantly, the number of equiaxed dendrites decreases, and the average grain size increases. The undercooling on the surface of the nucleus generator directly influenced the thermal gradient and cooling intensity in the melt. In order to analyze the influence mechanism of the nucleus generator surface undercooling, the cooling rate and temperature gradient distribution curves of the two points A and B (as illustrated in Figure 4a) were extracted. The temperature field characteristics can be clearly observed in Figure 7.
At the initial stage, the temperature gradient between A and B is relatively large and gradually decreases to a steady value. When the degree of undercooling increases, the temperature gradient distribution in the melt is significantly improved; the value of the stable temperature gradient is 1.73, 2.45, 2.89 K/mm, which can be observed from Figure 7a. The temperature gradient at the front of the solid–liquid interface directly affects the solidification manner of the dendrites.
Figure 8 shows the solute field during the dendrite growth process when the undercooling is 300 K and describes the solidification process in the microscopic area. When the temperature gradient at melt is uniform, a wider mush zone is formed, creating a condition for the interaction between dendrite growth and solute pile-up, and hence the wider mushy zone increases the nucleation probability of equiaxed dendrites.
The temperature gradient distribution in the melt is uniform, and the process showing volumetric solidification trend, the growth of columnar dendrites is blocked by the nucleation of equiaxed crystals, which corresponds to the situation in Figure 6a–c. According to Figure 8, it can be estimated that the enriched solute near the columnar dendrite’s tip can affects the nucleation undercooling distribution. The area with low solute enrichment is more conducive to nucleation and growth. For example, in Figure 8a, the solute concentration in regions A, B, C, and D are relatively low; therefore, the nucleation and growth of equiaxed dendrites preferentially appear in A’, B’, C’, and D’ in Figure 8b. Similarly, the regions E, F, and G are also priority regions for equiaxed dendrite nucleation, as shown in Figure 8c.
Figure 9 is a solute field diagram during dendrite growth when the undercooling degree is 500 K. The temperature gradient in the melt is relatively large at this condition, which is conducive to the directional growth of columnar dendrites. In addition, a narrow mush zone is formed and the nucleation of equiaxed dendrites appears in the region B between the columnar dendrites firstly, which can be clearly seen in Figure 8a. From the solidification process described in Figure 8, it can be seen that the equiaxed dendrites nucleation area is local and small, which exhibited as the layer-by-layer advancement of equiaxed dendrites. The regions A and C with lower solute enrichment evolve into the regions of equiaxed dendrites nucleation and growth, as shown in regions A’ and C’ (as illustrated in Figure 9a,b). In the same way, the regions D, E, and F gradually evolve into the regions D’, E’, F’ in Figure 9b,c. The result indicates that with the increase of the undercooling on the surface of the crystal nucleus generator, the undercooled zone width and the nucleation probability of equiaxed dendrites decrease.
The cooling rates in the mushy zone at different locations are plotted in Figure 7b,c, respectively. The cooling rate of point A gradually decreases from a high value to a low value as the solidification proceeds, which corresponds to the large discrepancy between the surface temperature of the crystal nucleus generator and the temperature in the melt at the initial stage, but the cooling rate of point A decreases visibly with the increase of the heat transfer as the solidification progresses. The cooling rate of point B rises from a lower value to a higher and steady value. The steady values are 0.56, 0.63, and 0.72 K/s, approximately corresponding to the minimum rate at point A at the same time, which illustrates that the solidification process gradually transitions from point A to point B. The large undercooling could provide a high cooling rate, which can promote the nucleation and growth of equiaxed grains; however, it is found that the large undercooling could create a strong temperature gradient distribution at the front of columnar grains, it was a favorable condition for columnar dendrites growth.
Figure 7d shows the average grain size distribution under different degrees of undercooling on the surface of the bar, which is measured from the simulation results. Another noticeable phenomenon can be observed, i.e., the average grain size is formed when the undercooling degree of the vibrating bar surface at 300 K and 400 K is finer than that at 200 K, which reflects that the influence of undercooling factors on microstructure evolution is not a simple linear relationship. The reason for the above phenomenon is probably that when the degree of undercooling on the surface of the crystal nucleus generator is relatively lower, the crystal nucleus generator does not significantly affect the distribution of the temperature field and cooling intensity in the melt, and it is not conducive to creating conditions for heterogeneous nucleation of central equiaxed dendrites; therefore, the grain size of newly formed dendrites is relatively large.
The simulation results show that different temperature field distribution conditions will significantly affect the final microstructure. It can be concluded that under the vibration frequency of 1000 Hz, the undercooling on the surface of the crystal nucleus generator was maintained at 300~400 K; it was beneficial to the formation and refinement of the central equiaxed crystal structure by affecting the temperature field distribution conditions in the melt.

3.4. Influence of the External Vibration Effect

In this group of simulations, the undercooling of the crystal nucleus generator was a certain value of 400 K, and the structure formation under different vibration frequencies of the crystal nucleus generator was explored. Figure 10 shows the dendritic structures at the vibration frequency varies from 500 to 1800 Hz. With the increase in the vibration frequency, the area of the equiaxed dendrites regions is obviously extended, the development of columnar crystal regions is hindered, the numbers of equiaxed dendrites increase, and the average grain size decreases.
As analyzed above, the possibility of dendrite fragmentation, separation, and settlement will increase with the convection effects caused by vibration are intensified, and thus the nucleation probability P n in the melt are increased to correspond to different conditions. Moreover, the enhancement of the vibration intensity can improve the convection stirring ability of the melt. It was found in previous studies that the vibration produced a circulation flow around the crystal nucleus generator, which drives the melt near the wall to collide with the mold wall and form a turbulent flow effect. As solidification progresses, the turbulent flow effect in the melt intensifies significantly.
The distribution of temperature gradient between A and B with the solidification time was investigated, as shown in Figure 11a. It is clearly shown that as solidification progresses, the temperature gradient between the two points drops significantly from a maximum value to a steady-state value. With the increase in the vibration frequency, the temperature gradient curve drops faster and reaches a relatively lower steady-state value. The large value of temperature gradient at the initial stage is due to the chilling crystal generator that is inserted into the melt; as the vibration starts, the strong fluid flow could improve the efficiency of the heat dissipation in the melt, which resulted in uniform temperature gradient distribution. Increasing the vibration frequency could significantly reduce the temperature gradient—the vibration frequency is increased from 500 to 1800 Hz, and the corresponding temperature gradient stability values in the melt after 6 s are 3.12 K/mm, 2.55 K/mm, 2.30 K/mm, 1.80 K/mm, 1.50 K/mm, respectively.
Figure 11b describes the average grain size under different vibration frequency conditions. As the vibration frequency increases, the average grain size decreases obviously. The reasons can be summarized in the following two aspects. As the vibration frequency increased, the thermal conductivity of the melt increased gradually, which resulted in the uniform distribution of temperature gradient, the superheat in front of the columnar crystal was reduced, and a larger part of the region entered an undercooled state, creating the necessary conditions for the nucleation of equiaxed crystals. Furthermore, the number of heterogeneous nucleation sites increased due to vibration force that breaks the primary dendrites and crushes them into fragments.
According to the above analysis result, it can be found that selecting the appropriate process parameters exerts an important influence on the grain structure evolution, which can effectively increase the proportion of the central equiaxed crystal area, shorten the area of the columnar crystal area, and achieve refined grains and homogenized microstructure.

4. Conclusions

In this study, a macro–micro coupled model for simulating the process of nucleation and competitive dendrite growth was developed to study the morphological evolution of columnar-to-equiaxed transition in the vibration-excited liquid metal nucleation technique. The microstructure evolution of ferritic stainless steel Cr17 was predicted and the influence of the different process parameters on the CET location, number of newly formed dendrites, and average grain size were investigated. The main conclusions are summarized as follows:
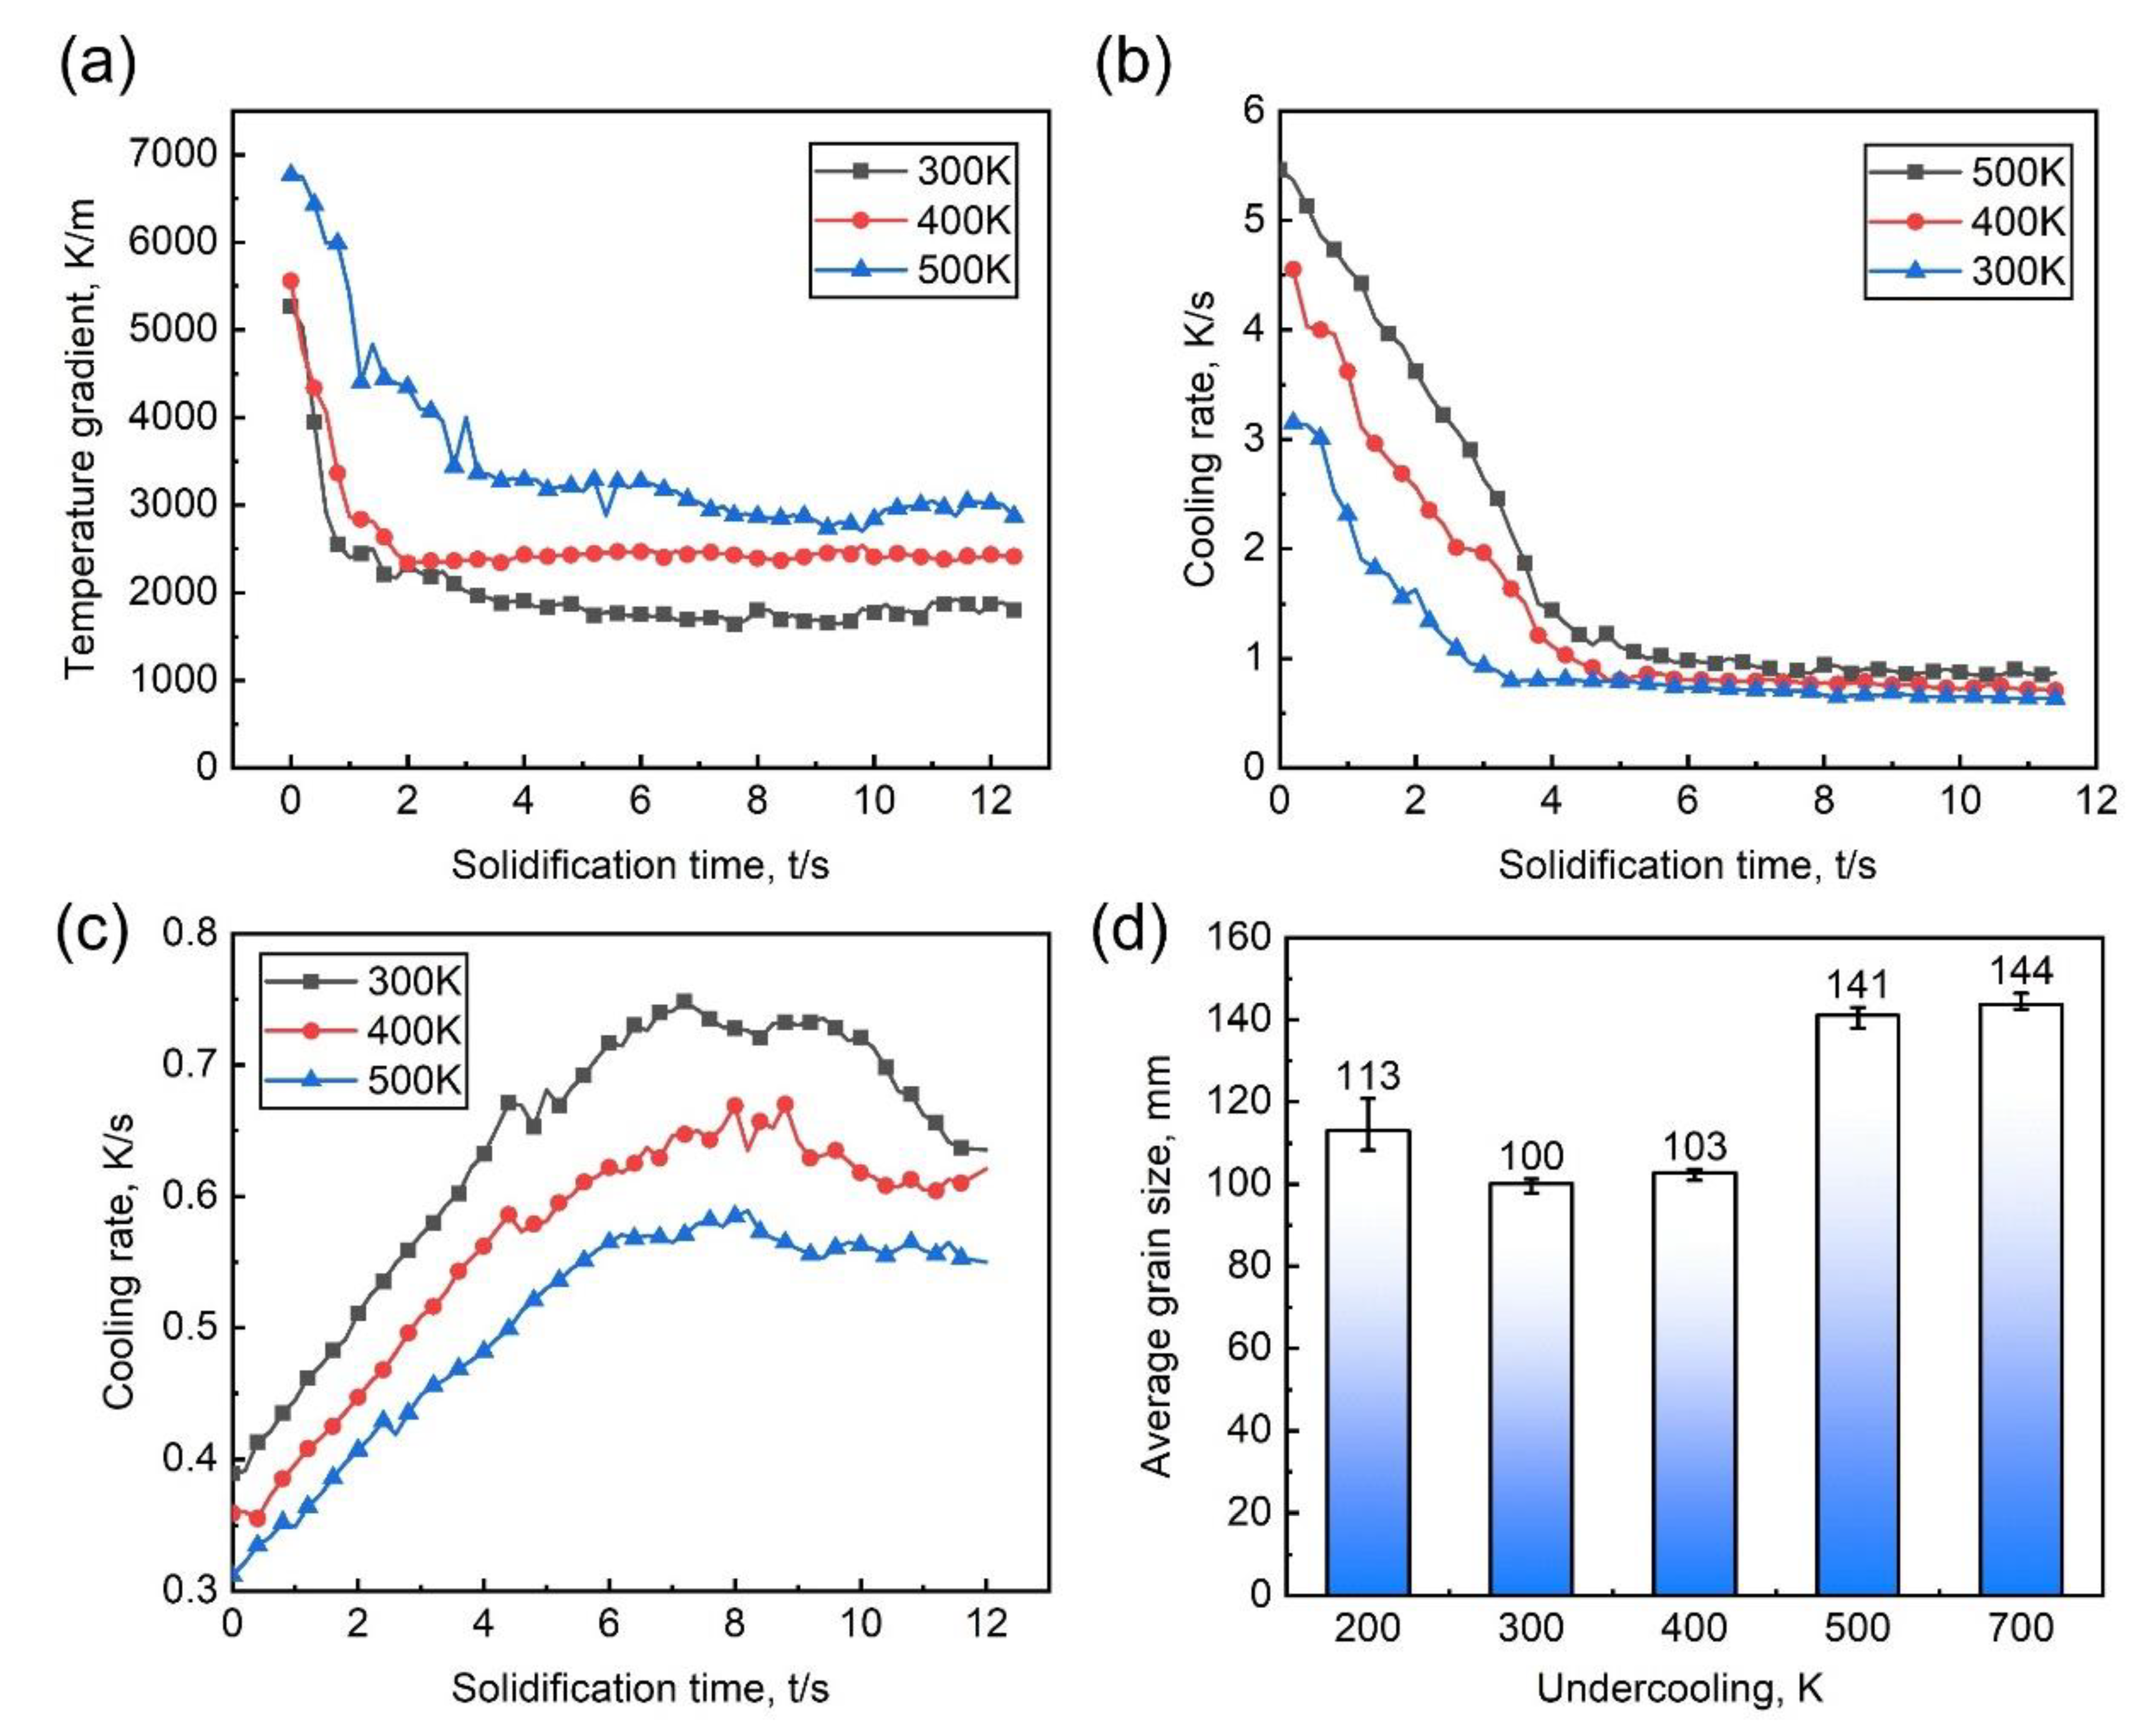
  • With the increase of surface undercooling on the crystal nucleus generator, the columnar dendrites regions are more developed, and the equiaxed dendrites regions decrease visibly, the number of new-born equiaxed dendrites decreases, and the average grain size increases. The quantitative analysis of the temperature field distribution in the melt shows that the temperature gradient at the columnar crystal front played a critical role in the nucleation and growth of the center equiaxed grain;
  • With the vibration frequency increases, the area of the equiaxed dendrites regions is obviously extended, and the refined grains and homogenized microstructure are achieved. With the vibration intensified, the possibility of dendrite fragmentation is increased by increasing the probability of nucleation in the melt; the convection stirring ability of the melt is improved, resulting in uniform temperature gradient distribution and making a large area in the melt to reach the critical nucleation undercooling.

Author Contributions

Project administration, W.W.; Software, X.Z. and Y.L.; Supervision, W.W. and Y.L.; Validation, X.Z.; Visualization, Q.S.; Writing—original draft, Q.S.; Writing—review & editing, Q.S., All authors have read and agreed to the published version of the manuscript.

Funding

This research was funded by National Natural Science Foundation of China (Grant number: 51074212) and the fund of State Key Laboratory of Solidification Processing in NWPU (Grant number: SKLSP201621).

Institutional Review Board Statement

Not applicable.

Informed Consent Statement

Not applicable.

Acknowledgments

The work was supported by the National Natural Science Foundation of China (51074212) and the fund of the State Key Laboratory of Solidification Processing in NWPU (SKLSP201621).

Conflicts of Interest

The authors declare no conflict of interest.

References

  1. Huh, M.Y.; Engler, O. Effect of intermediate annealing on texture, formability and ridging of 17%Cr ferritic stainless steel sheet. Mater. Sci. Eng. A. 2001, 308, 74–87. [Google Scholar] [CrossRef]
  2. Park, S.; Kim, K.; Lee, Y.; Park, C. Evolution of microstructure and texture associated with ridging in ferritic stainless steels. ISIJ Int. 2002, 408, 1335–1340. [Google Scholar] [CrossRef] [Green Version]
  3. Gan, Y.; Zhao, P.; Wang, M.; Zhang, H. Physical analogue of liquid metal original position nucleation stirred by vibration. J. Iron Steel Res. 2006, 8, 9–13. [Google Scholar] [CrossRef]
  4. Zhang, H.; Tao, H.; Li, F.; Wang, M.; Huang, W. Research on mechanism of nucleation in liquid metal excited by vibration. Iron Steel 2008, 8, 20–24. [Google Scholar] [CrossRef]
  5. Wang, W.; Chang, X.; Xu, R. Effect of wetting angle on crystal grains nucleation and detachment of vibration chilling surface. Foundry Technol. 2013, 34, 1682–1685. [Google Scholar]
  6. Asta, M.; Beckermann, C.; Karma, A.; Kurz, W.; Napolitano, R.; Plapp, M.; Purdy, G.; Rappaz, M.; Trivedi, R. Solidification microstructures and solid-state parallels: Recent developments, future directions. Acta Mater. 2009, 57, 941–971. [Google Scholar] [CrossRef] [Green Version]
  7. Liu, B.C.; Xu, Q.Y.; Jing, T.; Shen, H.F.; Han, Z.Q. Advances in multi-scale modeling of solidification and casting processes. JOM 2011, 63, 19–25. [Google Scholar] [CrossRef]
  8. Nakajima, K.; Zhang, H.W.; Oikawa, K.; Ohno, M.; Jönsson, P. Methodological progress for computer simulation of solidification and casting. ISIJ Int. 2010, 50, 1724–1734. [Google Scholar] [CrossRef] [Green Version]
  9. Reuther, K.; Rettenmayr, M. Perspectives for cellular automata for the simulation of dendritic solidification-A review. Comput. Mater. Sci. 2014, 95, 213–220. [Google Scholar] [CrossRef]
  10. Stefanescu, D.M. Microstructure evolution during the solidification of steel. ISIJ Int. 2006, 46, 786–794. [Google Scholar] [CrossRef] [Green Version]
  11. Stefanescu, D.M. 30 years of modeling of microstructure evolution during casting solidification. Adv. Mater. Res. 2007, 23, 9–16. [Google Scholar] [CrossRef]
  12. Zhu, M.F.; Pan, S.Y.; Sun, D.K.; Zhao, H.L. Numerical simulation of microstructure evolution during alloy solidification by using cellular automaton method. ISIJ Int. 2010, 50, 1851–1858. [Google Scholar] [CrossRef] [Green Version]
  13. Smolin, A.Y.; Shilko, E.V.; Astafurov, S.V.; Konovalenko, I.S.; Buyakova, S.P.; Psakhie, S.G. Modeling mechanical behaviors of composites with various ratios ofmatrixeinclusion properties using movable cellular automaton method. Def. Technol. 2015, 11, 18–34. [Google Scholar] [CrossRef] [Green Version]
  14. Psakhie, S.G.; Shilko, E.V.; Popov, M.V.; Popov, V.L. Key role of elastic vortices in the initiation of intersonic shear cracks. Phys. Rev. E 2015, 91, 063302. [Google Scholar] [CrossRef] [PubMed]
  15. Zhu, M.F.; Hong, C.P. A modified cellular automaton model for the simulation of dendritic growth in solidification of alloys. ISIJ Int. 2001, 41, 436–445. [Google Scholar] [CrossRef] [Green Version]
  16. Zhu, M.F.; Kim, J.M.; Hong, C.P. Modeling of globular and dendritic structure evolution in solidification of an Al-7mass%Si alloy. ISIJ Int. 2001, 41, 992–998. [Google Scholar] [CrossRef] [Green Version]
  17. Kurz, W.; Fisher, D.J. Dendrite growth at the limit of stability: Tip radius and spacing. Acta Metall. 1981, 29, 11–20. [Google Scholar] [CrossRef]
  18. Kurz, W.; Giovanola, B.; Trivedi, R. Theory of microstructural development during rapid solidification. Acta Metall. 1986, 34, 823–830. [Google Scholar] [CrossRef]
  19. Zhu, M.F.; Dai, T.; Lee, S.Y.; Hong, C.P. Modeling of solutal dendritic growth with melt convection. Comput. Math. Appl. 2008, 55, 1620–1628. [Google Scholar] [CrossRef] [Green Version]
  20. Zhu, M.F.; Lee, S.Y.; Hong, C.P. Modified cellular automaton model for the prediction of dendritic growth with melt convection. Phys. Rev. E 2004, 69, 061610. [Google Scholar] [CrossRef]
  21. Zhu, M.F.; Stefanescu, D.M. Virtual front tracking model for the quantitative modeling of dendritic growth in solidification of alloys. Acta Mater. 2007, 55, 1741–1755. [Google Scholar] [CrossRef]
  22. Pan, S.Y.; Zhu, M.F. A three-dimensional sharp interface model for the quantitative simulation of solutal dendritic growth. Acta Mater. 2010, 58, 340–352. [Google Scholar] [CrossRef]
  23. Zhu, M.F.; Li, Z.Y.; An, D.; Zhang, Q.Y.; Dai, T. Cellular automaton modeling of microporosity formation during solidification of aluminum alloys. ISIJ Int. 2014, 54, 384–391. [Google Scholar] [CrossRef] [Green Version]
  24. Yin, H.; Felicelli, S.D. Dendrite growth simulation during solidification in the LENS process. Acta Mater. 2010, 58, 1455–1465. [Google Scholar] [CrossRef]
  25. Han, R.; Dong, W.; Lu, S.; Li, D.; Li, Y. Modeling of morphological evolution of columnar dendritic grains in the molten pool of gas tungsten arc welding. Comput. Mater. Sci. 2014, 95, 351–361. [Google Scholar] [CrossRef]
  26. Han, R.; Lu, S.; Dong, W.; Li, D.; Li, Y. The morphological evolution of the axial structure and the curved columnar grain in the weld. J. Cryst. Growth 2015, 431, 49–59. [Google Scholar] [CrossRef]
  27. Ao, X.; Xia, H.; Liu, J.; He, Q. Simulations of microstructure coupling with moving molten pool by selective laser melting using a cellular automaton. Mater. Des. 2020, 185, 108230. [Google Scholar] [CrossRef]
  28. Liu, S.; Shin, Y.C. Integrated 2D cellular automata-phase field modeling of solidification and microstructure evolution during additive manufacturing of Ti6Al4V. Comput. Mater. Sci. 2020, 183, 109889. [Google Scholar] [CrossRef]
  29. Rai, A.; Markl, M.; Körner, C. A coupled cellular automaton-lattice boltzmann model for grain structure simulation during additive manufacturing. Comput. Mater. Sci. 2016, 124, 37–48. [Google Scholar] [CrossRef]
  30. Beltran-Sanchez, L.; Stefanescu, D.M. Growth of solutal dendrites: A cellular automaton model and its quantitative capabilities. Metall. Mater. Trans. A 2003, 34, 367–382. [Google Scholar] [CrossRef]
  31. Beltran-Sanchez, L.; Stefanescu, D.M. A quantitative dendrite growth model and analysis of stability concepts. Metall. Mater. Trans. A 2004, 35, 2471–2485. [Google Scholar] [CrossRef]
  32. Dong, H.B.; Lee, P.D. Simulation of the columnar-to-equiaxed transition in directionally solidified Al–Cu alloys. Acta Mater. 2005, 53, 659–668. [Google Scholar] [CrossRef]
  33. Luo, S.; Zhu, M.Y. A two-dimensional model for the quantitative simulation of the dendritic growth with cellular automaton method. Comput. Mater. Sci. 2013, 71, 10–18. [Google Scholar] [CrossRef]
  34. Wang, W.; Lee, P.D.; McLean, M. A model of solidification microstructures in nickel-based superalloys: Predicting primary dendrite spacing selection. Acta Mater. 2003, 51, 2971–2987. [Google Scholar] [CrossRef]
  35. Wang, W.L.; Luo, S.; Zhu, M.Y. Development of a CA-FVM model with weakened mesh anisotropy and application to Fe-C alloy. Crystal 2016, 6, 147. [Google Scholar] [CrossRef] [Green Version]
  36. Lin, X.; Wei, L.; Wang, M.; Huang, W.D. A cellular automaton model with the lower mesh-induced anisotropy for dendritic solidification of pure substance. Mater. Sci. Forum 2010, 654–656, 1528–1531. [Google Scholar] [CrossRef]
  37. Wei, L.; Lin, X.; Wang, M.; Huang, W.D. A cellular automaton model for the solidification of a pure substance. Appl. Phys. A Mater. 2011, 103, 123–133. [Google Scholar] [CrossRef]
  38. Wei, L.; Lin, X.; Wang, M.; Huang, W.D. Orientation selection of equiaxed dendritic growth by three-dimensional cellular automaton model. Physica B 2012, 407, 2471–2475. [Google Scholar] [CrossRef] [Green Version]
  39. Wei, L.; Cao, Y.Q.; Lin, X.; Wang, M.; Huang, W.D. Quantitative cellular automaton model and simulations of dendritic and anomalous eutectic growth. Comput. Mater. Sci. 2019, 156, 157–166. [Google Scholar] [CrossRef]
  40. Reuther, K.; Rettenmayr, M. A comparison of methods for the calculation of interface curvature in two-dimensional cellular automata solidification models. Comput. Mater. Sci. 2019, 166, 143–149. [Google Scholar] [CrossRef]
  41. Wei, L.; Cao, Y.Q.; Lin, X.; Chang, K.; Huang, W.D. Globular to lamellar transition during anomalous eutectic growth. Model. Simul. Mater. Sci. Eng. 2020, 28, 065014. [Google Scholar] [CrossRef]
  42. Wang, W.L.; Chen, J.; Li, M.M.; Wang, A.L.; Su, M.Y. Numerical simulation of temperature and fluid fields in solidification process of ferritic stainless steel under vibration conditions. Crystals 2019, 9, 174. [Google Scholar] [CrossRef] [Green Version]
  43. Thévoz, P.; Desbiolles, J.L.; Rappaz, M. Modeling of equiaxed microstructure formation in casting. Metall. Mater. Trans. A 1989, 20, 311–322. [Google Scholar] [CrossRef]
  44. Wei, L.; Lin, X.; Wang, M.; Huang, W.D. Low artificial anisotropy cellular automaton model and its applications to the cell-to-dendrite transition in directional solidification. Mater. Discov. 2016, 3, 17–28. [Google Scholar] [CrossRef] [Green Version]
  45. Gueyffier, D.; Li, J.; Nadim, A.; Scardovelli, R.; Zaleski, S. Volume-of-fluid interface tracking with smoothed surface stress methods for three-dimensional flows. J. Comput. Phys. 1999, 152, 423–456. [Google Scholar] [CrossRef] [Green Version]
  46. Sergei, N.; Vladimir, S.; Sergey, K.; Alexey, G.; Victor, G. Formation mechanism of micro- and nanocrystalline surface layers in titanium and aluminum alloys in electron beam irradiation. Metals 2020, 10, 1399. [Google Scholar] [CrossRef]
  47. Mizukami, H.; Suzuki, T.; Umeda, T.; Kurz, W. Initial stage of rapid solidification of 18-8 stainless steel. Mat. Sci. Eng. A 1993, 173, 361–364. [Google Scholar] [CrossRef]
  48. Yang, M.B.; Pan, F.S. Analysis about forming mechanism of equiaxed crystal zone for 1Cr18Ni9Ti stainless steel twin-roll thin strip. J. Mater. Process. Tech. 2009, 209, 2203–2211. [Google Scholar] [CrossRef]
Figure 1. The schematic diagram of the vibration-excited liquid metal nucleation experimental apparatus and the simulation principle: 1-cylindrical mold, 2-melt, 3-crystal nucleus generator, 4-water circulation cooling structure, 5-vibration instrument, and 6-power source and transmission. (a) Two-dimensional temperature field distribution along the A–A’ section at different times. (b) Three-dimensional fluid flow trace diagram. (c) Modeling domain for microstructure formation. (d) The full equiaxed dendrites formed at different stages. (e) The process of columnar dendrites and equiaxed dendrites competitive growth.
Crystals 11 00309 g001
Figure 2. The process of a single equiaxed dendrite growing at the undercooled melt with different undercooling. (ac) dendrite growing from at T   =   5   K after 0.24 s, 0.28 s, 0.32 s. (df) dendrite growing from at T   =   10   K after 0.12 s, 0.16 s, 0.2 s.
Crystals 11 00309 g002
Figure 3. Characteristics of the solute distribution and the growth rate of dendrite tip obtained by simulation, at the conditions of T   =   5   K and mesh size x   = 0.5 μm. (a) Solute distribution in the centerline of the dendrite arm at different times. (b) Partial enlargement of picture (a). (c) The calculated tip growth velocity as a function of time.
Crystals 11 00309 g003
Figure 4. Simulated the process of dendritic structures formed in the melt; different colors repre-sent grains with different crystallographic orientations. The calculation time is 5.5 s, 6.3 s, 7.2 s, 8.5 s, and 11.0 s, from (ae), respectively. The coordinate axis in the figure represents the number of grids, and same meaning is expressed in the following pictures.
Crystals 11 00309 g004
Figure 5. The grain structures obtained by simulation results and experiment. (a) Simulated result. (b) Columnar grain observed by experiment. (c) Equiaxed grain observed by experiment.
Crystals 11 00309 g005
Figure 6. Simulated dendritic structures formed in the melt under different degrees of undercooling on the surface of the crystal nucleus generator. The degrees of undercooling are 200, 300, 400, 500, 700 K from (ae), respectively. Different colors represent grains with different crystallographic orientations.
Crystals 11 00309 g006
Figure 7. Quantitative analysis of temperature field distribution characteristics and grain size information. (a) The temperature gradient distribution between two A and B points, as illustrated in Figure 4a. (b) The cooling rate curve of point A. (c) The cooling rate curve of point B. (d) The average grain size under different degrees of undercooling on the surface of the crystal nucleus generator.
Crystals 11 00309 g007
Figure 8. The solute field during the dendrite growth process when the undercooling of the crystal nucleus generator is 300 K. The solidification time from (ac) is 7.2, 7.5, and 7.8 s, respectively.
Crystals 11 00309 g008
Figure 9. The solute field during the dendrite growth process when the undercooling of the crystal nucleus generator is 500 K. The solidification time from (ac) is 6.8, 7.0, and 7.2 s, respectively.
Crystals 11 00309 g009
Figure 10. Simulated the dendritic structures formed in the melt under different vibration frequencies of the crystal nucleus generator. The vibration frequency is 500, 800, 1000, 1500, 1800 Hz from (ae), respectively. Different colors represent grains with different crystallographic orientations.
Crystals 11 00309 g010
Figure 11. Quantitative analysis of temperature field distribution characteristics and grain size information. (a) Temperature gradient distribution between A and B positions under different vibration frequencies. (b)The average grain size under different vibration frequencies.
Crystals 11 00309 g011
Table 1. The thermal properties of the ferritic stainless steel Cr17 used in the simulation.
Definition and SymbolsValues
Liquidus temperature, T l i q (K)1781
Solute composition, C 0 (wt.%)17.0
Partition coefficient, k e 0.83
Liquidus slope, m l (K∙wt%−1)−2.27
Gibbs–Thomson coefficient, Γ (K∙m)3.0 × 10⁻⁷
Liquid diffusion coefficient, D l (m2·s−1)5.0 × 10⁻⁹
Solid diffusion coefficient, D s (m2·s−1)3.0 × 10⁻¹³
Maximum density of nuclei, n m a x (m−3)5.5 × 10⁹
Mean nucleation undercooling,   T n (K)7.0
Standard deviation of undercooling, T σ (K) 0.1
Publisher’s Note: MDPI stays neutral with regard to jurisdictional claims in published maps and institutional affiliations.

