Article

Using a Modified Polyamidoamine Fluorescent Dendrimer for Capturing Environment Polluting Metal Ions Zn2+, Cd2+, and Hg2+: Synthesis and Characterizations

by
Abdel Majid A. Adam
1,2,*,
Tariq A. Altalhi
2,
Samy M. El-Megharbel
2,
Hosam A. Saad
2 and
Moamen S. Refat
2
1
High Altitude Research Center, Taif University, P.O. Box 11099, Taif 21944, Saudi Arabia
2
Department of Chemistry, College of Science, Taif University, P.O. Box 11099, Taif 21944, Saudi Arabia
*
Author to whom correspondence should be addressed.
Crystals 2021, 11(2), 92; https://doi.org/10.3390/cryst11020092
Submission received: 25 December 2020 / Revised: 13 January 2021 / Accepted: 19 January 2021 / Published: 22 January 2021
(This article belongs to the Section Inorganic Crystalline Materials)

Abstract

:
One of the most pressing global concerns is how to provide a clean environment for future generations given the exacerbation of urban, agricultural, industrial, and economic activities due to the escalating size of the global population. A polyamidoamine (PAMAM) dendrimer peripherally modified with 4-N,N′-dimethylethylenediamine-1,8-naphthalmide as a chromophore was synthesized and utilized to capture hazardous heavy metal ions. This modified fluorescent dendrimer (FCD) was complexed with Group 12 metal ions (Zn2+, Cd2+, and Hg2+) at a 2:1 (metal: FCD) ratio. Electronic absorption, fluorescence emission, Infra-red (IR), and nuclear magnetic resonance (1H NMR) spectroscopies, conductivity, CHN elemental, thermogravimetry, scanning electron microscopy (SEM), and transmission electron microscopy (TEM) analyses were used to characterize the resulting metal complexes. These assays revealed that the synthesized complexes were yellow-colored, thermally stable, nanoscale-sized, and composed of [M2FCD]·4Cl2. Considerable spectral shifts were observed in the emission and absorption spectra of the FCD molecule after binding the Zn2+ ions, which can be used to differentiate the Zn2+ complex from the other two complexes. This work provides basic data to facilitate the detection, quantification, and removal of environmentally hazardous heavy metal ions through complexation with a fluorescent dendrimer.

1. Introduction

It has become a great challenge worldwide to provide a clean environment and deal with hazardous chemicals and toxic pollutants, especially with respect to hazardous heavy metals. The rapid increase in population sizes, rapidly growing worldwide economy, and the development of industry have led to an increase in the amount of chemical pollution. Fossil fuel burning, petrochemistry, milling, mining, industrialization, textile and leather production, and agricultural processes all release heavy metals on a daily basis, which represents a major global threat to human health and ecosystem balance. Heavy metals are harmful to humans, animals, and plants due to their propensity to bioaccumulation, high toxicity, and carcinogenicity [1,2,3,4,5,6,7,8,9,10]. Chromium (Cr), arsenic (As), cadmium (Cd), mercury (Hg), lead (Pb), and other heavy metals are extremely toxic to humans even at very low concentrations of several micrograms per liter. Developing methods for detecting, monitoring, quantifying, and eliminating metal ions in human tissues, pharmaceuticals, food, drinking water, and the environment is of the utmost importance for improving the health and safety of humans, and the planet in general. Spectrophotometry, chemical precipitation, electrochemical methods, and ion-exchange chromatography are some of the traditional methods used for such purposes and provide high sensitivity, serviceability, and selectivity. Unfortunately, these traditional methods are costly and time-consuming and often require skilled professionals to operate complicated apparatus with high operating costs [11,12,13,14,15,16,17].
One of the novel methods developed to overcome the drawbacks of traditional methods is fluorescence-based detection. Specifically, it involves capturing hazardous metal ions using fluorescent-based compounds, chemo-sensors, dyes, and probes. This fluorescence-based method has attracted considerable interest and become a potentially useful approach for detecting metal ions in biomedicine and environmental remediation. This technique has several advantages, such as quick response speed, ease of handling, low costs, direct visual perception, high selectivity and sensitivity, intercellular detection, operational simplicity, and non-destructive methods [18,19,20,21,22,23,24,25]. Several metal ions (such as aluminum [Al3+], chromium [Cr3+], indium [In3+], copper [Cu2+], selenium [Sn2+], nickel [Ni2+], zinc [Zn2+], cadmium [Cd2+], cobalt [Co2+], gallium [Ga3+], silver [Ag+], iron [Fe3+], nickel [Ni2+], lead [Pb2+], and mercury [Hg2+]) have been selectively detected in several environments based on this technique [26,27,28,29,30,31,32,33,34,35,36,37,38,39,40,41,42,43,44,45,46].
Dendrimers are monodispersing, highly branched, three-dimensional “ball-like” polymers that can increase their molecular size stepwise through repeated reaction sequences. They are a class of macromolecules characterized by a high concentration of surface groups, compact shape, and empty internal cavities that act as room between branches for taking up gust molecules. Tomalia et al. synthesized the first dendrimers in the mid-1980s, and since many kinds of dendrimers have been synthesized including fluorescent dendrimers, which are synthesized by binding fluorophores to the dendrimer structure [47,48,49,50,51,52,53,54,55,56]. Dendrimers have several properties, including the capability to capture small molecules that render them well-suited for biological applications (such as gene therapy, drug carriers, and systems for drug delivery) and chemical applications (such as nanoreactors and catalysis) [57,58,59,60,61,62].
One important class of dendrimers is poly-amidoamine dendrimers, commonly referred to as PAMAM dendrimers. These compounds are globular, branched macromolecules with different terminal functional groups that are widely investigated for oral drug and gene delivery purposes. The structure of PAMAM dendrimers contains an ethylenediamine core and branched units composed of ethylenediamine and methyl acrylate. Their chemical structures are remarkably interesting with interiors containing both secondary (amide) and tertiary amines, and peripheries specialized with different functional groups [63,64,65,66]. The unique structure and interesting properties of PAMAM dendrimers, such as magnetic recyclability, good biocompatibility, less cost, more availability of functional groups in both the periphery and interior, and high loading capacity, impart PAMAM dendrimers with extensive applications, such as heavy metal removal, dye degradation, catalysis, bioimaging, drug delivery, gene therapy, and environmental remediation [67,68,69,70,71,72,73,74,75,76]. Environmental remediation includes recovery, removal, and investigation of contaminants, such as heavy metals from environments using AOPs, photodegradation and other means. For example, several prominent adsorption methods are used for recovering and removing heavy metals, such as polymers, inorganic materials, biomaterials, silica gel, dendrimers, AOPs, and photodegradation from water [77,78,79,80,81]. Among these adsorption processes, PAMAM dendrimers are a more significant material for the removal and recovery of metal ions because of free accessibility of metal ions and greater dispersibility in aqueous environment [82,83].
In this work, we aimed to investigate the capability of one of the modified PAMAM dendrimers with a specific chromophore that could coordinate with Zn2+, Cd2+, and Hg2+ metal ions. For this purpose, a PAMAM dendrimer with 4-N,N′-dimethylethylenediamine-1,8-naphthalmide units serving as chromophores at its rim was synthesized. The chemical structure of this fluorescent dendrimer, referred to as FCD, is presented in Figure 1. The synthesized FCD molecule was then complexed with the metal ions selected for this study. The structures of the resulting FCD–metal complexes were proposed based on data obtained from a range of spectroscopic and physicochemical techniques. Finally, the photophysical, thermal, and microstructural properties of these complexes were also determined and discussed.

2. Experimental Section

2.1. Chemicals

All of the starting materials required to synthesize the FCD molecule, solvents, and metal chlorides were analytical grade chemicals at the highest purity available from Sigma-Aldrich (USA) and Fluka (Germany) chemical companies. The starting materials used to synthesize the FCD molecule were: 4-nitro-1,8-naphthalic anhydride (purity 95%; C12H5NO5; 243.17 g/mol), PAMAM dendrimer (20 wt% in methanol; generation 0 ethylenediamine core; C14H20N2Na4O8; 436.28 g/mol), N,N-dimethylformamide (purity 99.8%; C3H7NO; 73.09 g/mol), and N,N′-dimethylethylenediamine (purity 98%; C4H12N2; 88.15 g/mol). The metal chloride salts used to generate the FCD complexes were: zinc chloride (purity ≥ 99.99%; ZnCl2; 136.30 g/mol); cadmium (II) chloride (purity ≥ 99.99%; CdCl2; 183.32 g/mol); and mercury(II) chloride (purity ≥ 99.5%; HgCl2; 271.50 g/mol).

2.2. Synthesis Methods

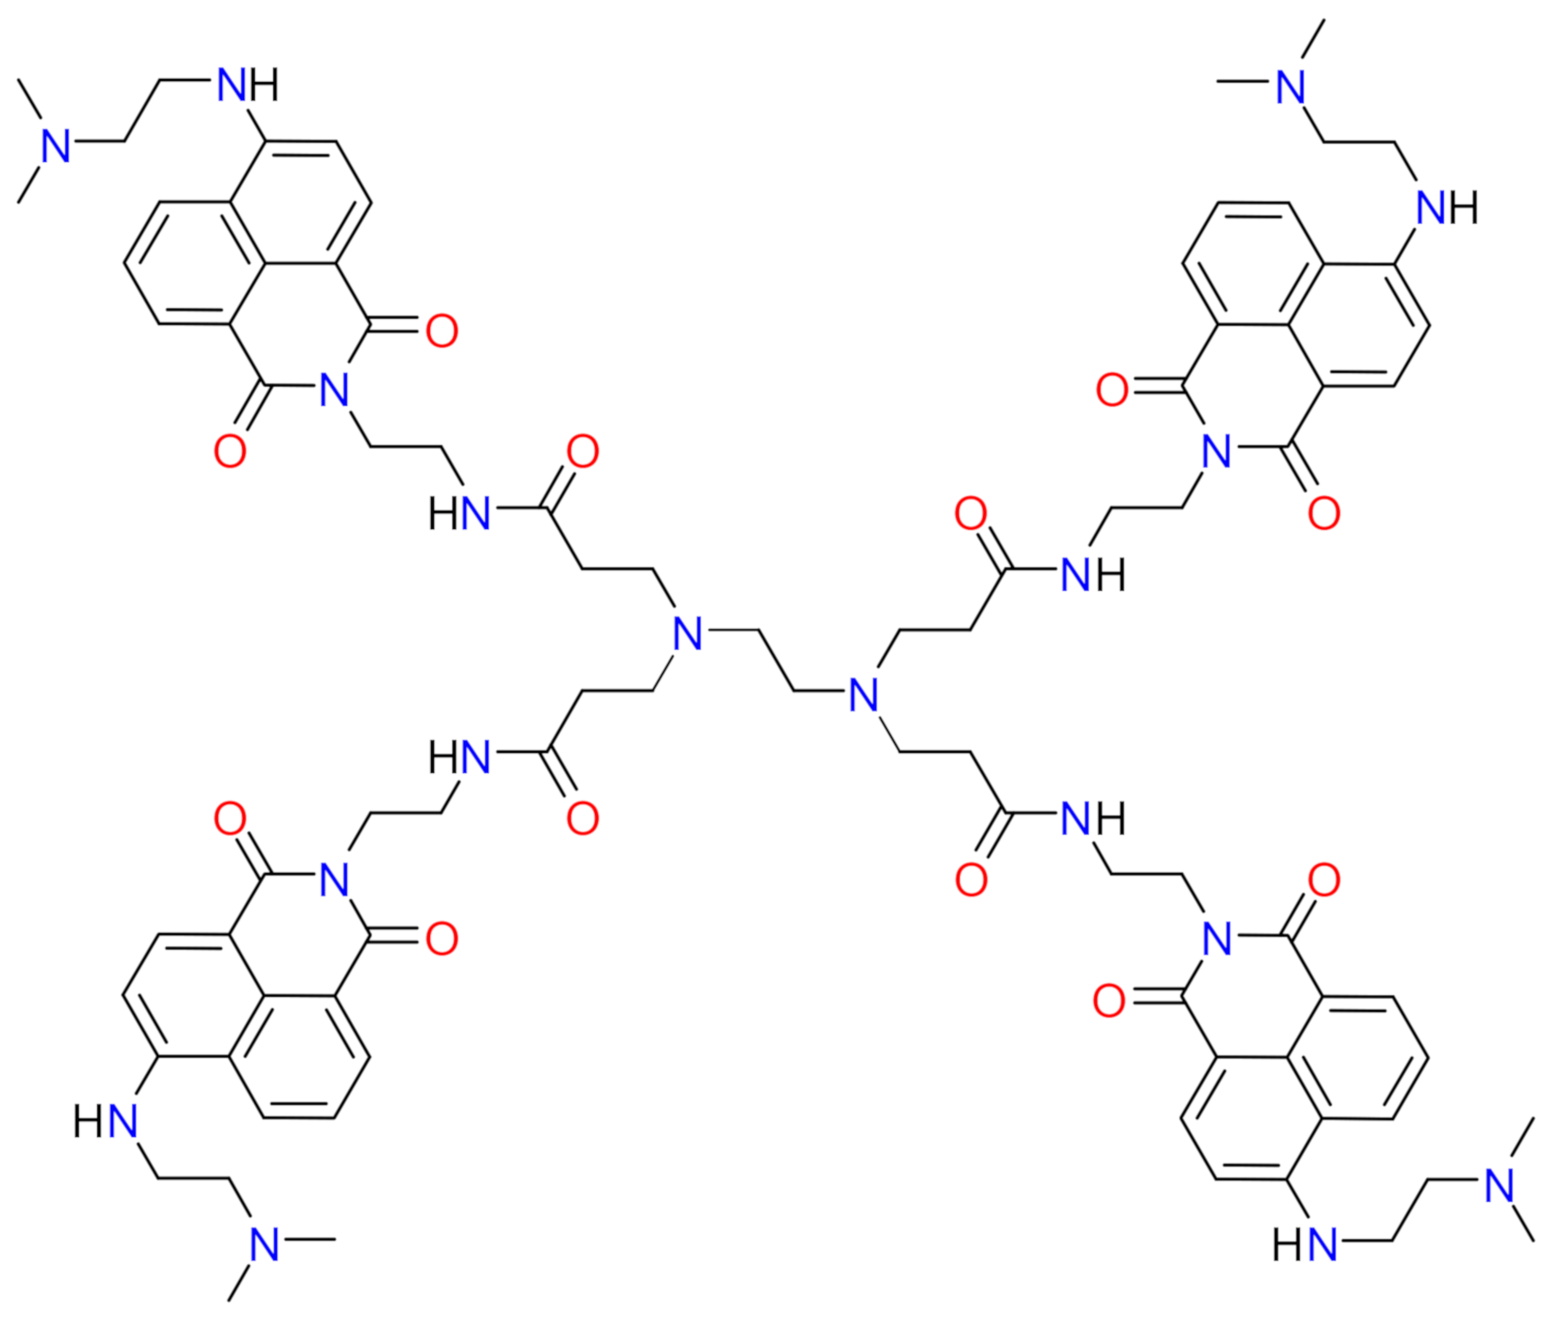
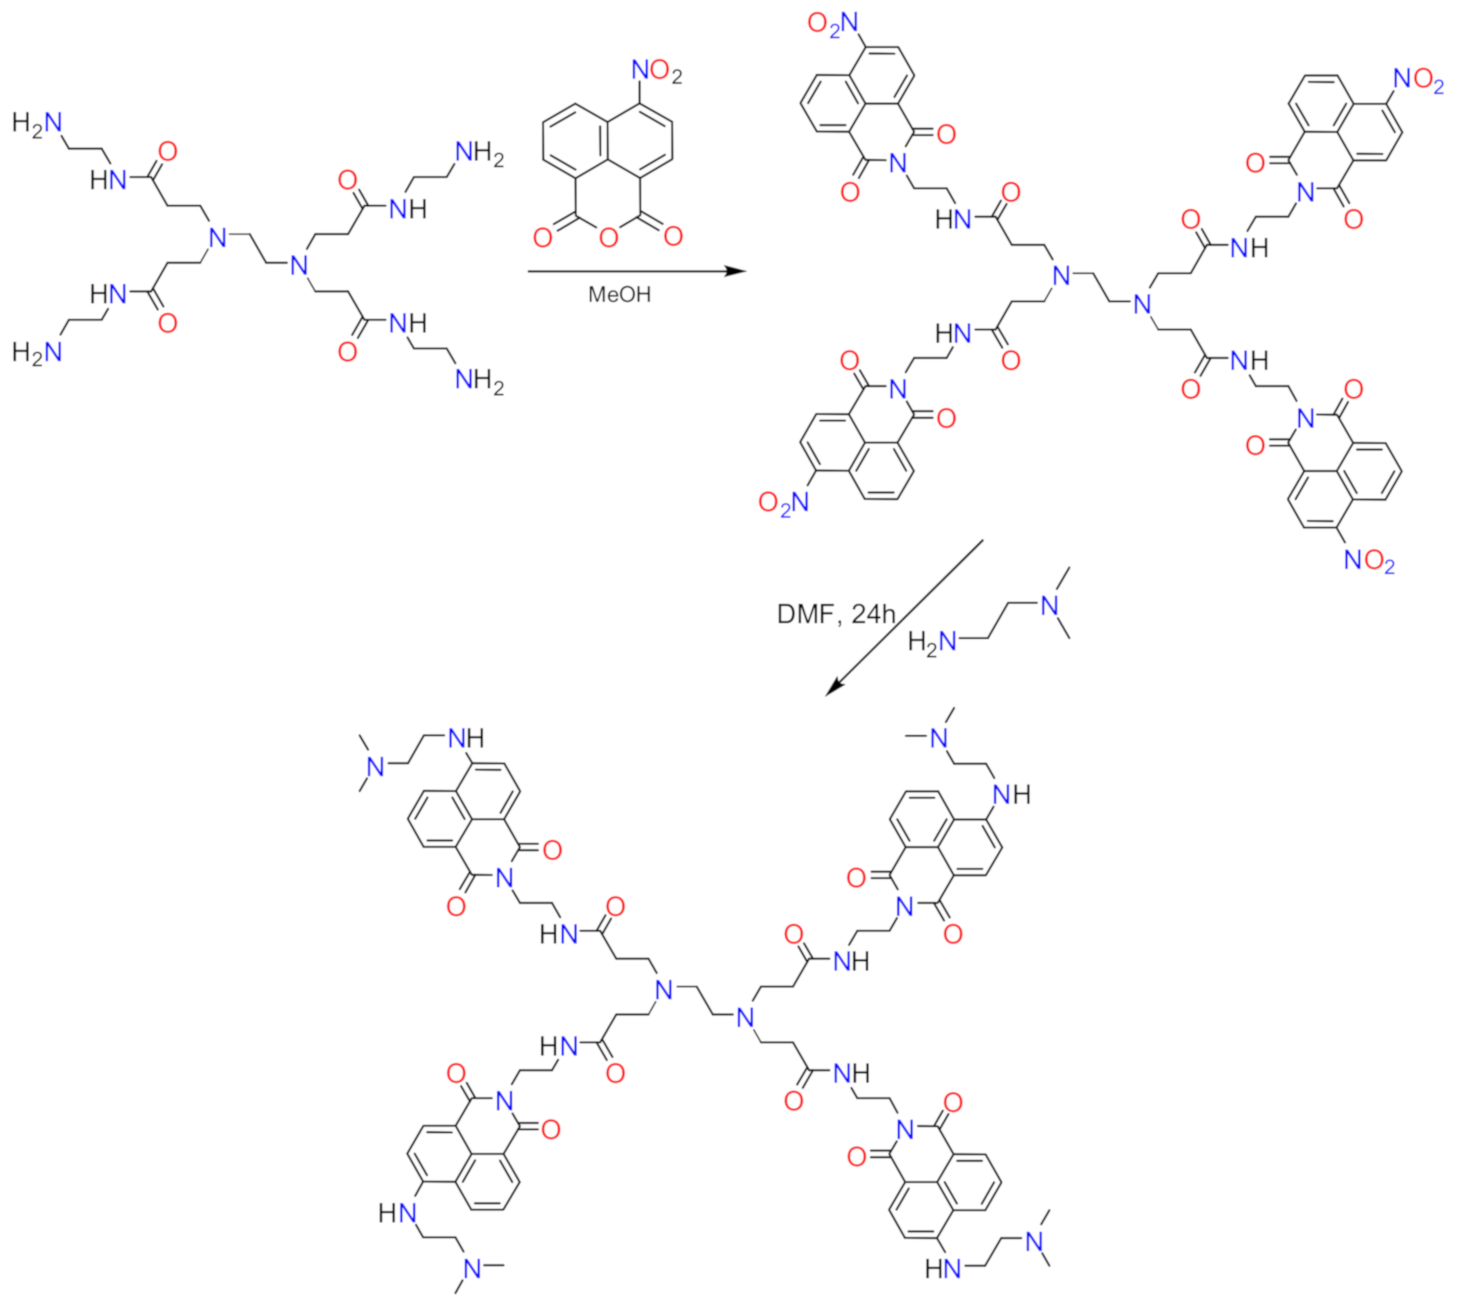
2.2.1. FCD Synthesis

The fluorescent dendrimer used in this work was a modified PAMAM dendrimer with peripheral 4-N,N′-dimethylethylenediamine-1,8-naphthalmides. It was synthesized at high yields according to published methodology [84,85,86]. Briefly, 0.04 mol of 4-nitro-1,8-naphthalic anhydride was dissolved in 25 mL of methanol (95%), then 0.01 mol of PAMAM dendrimer (20 wt% in methanol; generation 0 ethylenediamine core) was added to the solution. The resultant mixture was refluxed for 5 h. The liquid was separated and added to 200 mL of Milli-Q purified water forming a white precipitate. The white product was filtered, washed, and dried under a vacuum to give 4-nitro-1,8-naphthalimide-labelled PAMAM. Next, 0.005 mol of this product was added to a 25-mL solution of N,N-dimethylformamide containing 0.04 mol of N,N′-dimethylethylenediamine. The resultant mixture was stirred for 24 h at room temperature. Then, 500 mL of Milli-Q purified water was added to the reaction beaker, a pale yellow precipitate formed that was filtered, thoroughly washed with Milli-Q water, purified by two-fold recrystallization in toluene, and finally dried under a vacuum, resulting in the desired fluorescent 4-N,N′-dimethylethylenediamine-1,8-naphthalmide-labelled PAMAM dendrimer (FCD). The FCD product was characterized according to its 1H NMR and IR spectra, and elemental composition.

2.2.2. Metal–FCD Complex Synthesis

Three complexes between FCD and metal ions from Group 12 (Group IIB) (Zn2+, Cd2+, and Hg2+) were synthesized as follows: Three 150 mL beakers, each containing 1 mmol of the synthesized FCD molecule dissolved in 25 mL of methanol, were put on heat-controlled magnetic stirrers. The solutions were stirred for a few minutes at 50 °C, then 2 mmol of the appropriate chloride salt (Zn2+, Cd2+, or Hg2+) dissolved in 25 mL of methanol was added dropwise. The beakers were stirred for 20 min at 50 °C and then the colored precipitates were harvested by slow evaporation. Generally, the metal ions formed yellow-colored precipitates but with different degrees of yellow color: true yellow for the Zn2+ ion, yellowish white for the Cd2+ ion, and orange yellow for the Hg2+ ion. The products were filtered, thoroughly washed, dried under a vacuum, and finally characterized using data obtained by analytical, elemental, and spectral analyses.

2.3. Analysis Methods

2.3.1. Molecular and Fluorescence Spectroscopy

Electronic absorption, fluorescence emission, IR, and 1H NMR spectra were collected using Perkin−Elmer Lambda 25 UV/Vis, Perkin−Elmer LS-55 Fluorescence, Shimadzu FT−IR, and Bruker DRX-250 Spectrophotometers, respectively. The 1H NMR spectra were generated at 600 MHz with the Bruker DRX-250 instrument for the solid-state complexes with tetramethylsilane (TMS) as the internal reference and dimethylsulfoxide (DMSO-d6) as the solvent at room temperature. The IR spectra were generated from the solid-state complexes at 400 to 4000 cm−1, while complexes in DMSO solution were used to collect absorption and emission spectra in the ranges 200−600 nm and 350−600 nm, respectively.

2.3.2. Microscopic Characterizations

The JEOL JEM-1200 EX II transmission electron microscope (TEM) and Quanta FEG 250 scanning electron microscope (SEM) were utilized at accelerating voltages of 60k and 20k, respectively, to capture TEM and SEM micrographs of the synthesized complexes that contain information on the shape, size, topology, and outer surface morphology of the complexes.

2.3.3. Analytical and Thermal Analyses

Elemental, conductivity, and thermal measurements, respectively, were taken with the Perkin-Elmer 2400CHN Elemental Analyzer (to determine the H%, C%, N%, and Cl% content), the Jenway 4010 Conductivity Meter, and the Shimadzu TGA–50H Thermal Analyzer (to generate TG graphs from 25 to 800 °C under constant airflow). The gravimetric method was used to determine the metal (%) content of the complexes.

3. Results and Discussion

3.1. FCD Characterizations

Previously published protocols [84,85,86] were applied to synthesize the FCD molecule according to the synthetic route diagrammed in Figure 2. This protocol resulted in a 69% yield of a pale-yellow, high-purity FCD powder product, soluble in most organic solvents but not in water. The molecular formula of FCD is C86H104N18O12, and its molecular weight is 1580.3 g/mol. The characterization data for the FCD product generated from the elemental analysis and its 1H NMR and IR spectra agreed with those reported by Grabchev et al. (2002) for the same product [84]. A sample of the FCD molecule was subjected to CHN elemental analysis and the observed values for the N%, H%, and C% content were 16.10%, 6.80%, and 65.05%, respectively. These data agreed with the theoretical values calculated based on the molecular formula of the FCD molecule, which were 15.94%, 6.58%, and 65.30%, respectively.
The 1H NMR and IR spectra of the FCD molecule alone are presented in Figure 3a,b. The FCD molecule’s structure and atom number are presented in Figure 4. The SEM and TEM images of the FCD molecule alone are given in Figure 5a,b. The frequencies of the characteristic IR bands for FCD (cm−1) were 3365 ν(N−H), 3070 νas(C−H)aromatic, 2953 νas(CH2), 2833 νs(CH2), 1700 νas(C=O), 1657 δdef(N−H), 1624 νs(C=O), 1588 and 1549 ν(C=C), 1440 δsciss(CH2), 1385 δrock(CH2), 1347 δsciss(CH3), 1239 νas(C−N), 1190 νs(C−N), 1047 δrock(N−H), 982 δrock(CH3), 960 δwag(CH2), 850 δwag(N−H), 783 δrock(C−H)aromatic, and 537 δtwist(CH2). The eight (N−H) groups in the FCD molecule gave a strong intensity, broad band ranging from 3580 to 3170 cm−1 with a maximum intensity at 3365 cm−1. This broad band was assigned to the N−H stretching vibrations. Also, the N−H band gave three additional absorption bands. A very strong, narrow band vibrated at 1657 cm−1 due to the δdef(N−H) modes. The two medium bands at 1047 and 850 cm−1 were attributed to the rocking and wagging bending vibrations of the N−H band, respectively [84,85,86,87,88].
The aromatic protons (C−H) from the naphthalene rings generated characteristic absorption bands: a medium-strong, broad band at 3070 cm−1 caused by νas(C–H) vibrations and a very strong and very narrow, sharp band at 783 cm−1 due to the δrock(C−H) vibrations. The C=O vibrations caused two characteristic absorption bands: a strong band observed at 1700 cm−1 due to the νas(C=O) modes and a medium shoulder band at 1624 cm−1 due to the νs(C=O) modes. The C=C stretching vibrations of the naphthalene rings appeared as medium bands at 1588 and 1549 cm−1. The methylene (CH2) group displayed six fundamental assignments, two stretching and four bending vibrations. The stretching vibrations, νas(CH2) and νs(CH2), appeared between 3000 and 2800 cm−1 [89,90], observed in the IR spectrum of FCD in the form of two consecutive medium intensity, broad bands located at 2953 and 2833 cm−1, respectively. The four bending vibrations of the CH2 group, namely twisting δtwist(CH2), wagging δwag(CH2), rocking δrock(CH2), and scissoring δsciss(CH2), were observed in the IR spectrum of FCD at 537, 960, 1385, and 1440 cm−1, respectively. The bending vibrations of the CH3 group gave two bands at 1347 and 982 cm−1 assigned to the δsciss(CH3) and δrock(CH3) vibrations, respectively. The bands resonating at 1239 at 1190 cm−1 were assigned to the νas(C–N) and νs(C–N), respectively.
The FCD molecule generated the following 1H NMR chemical shifts (in ppm): δ = 2.21 (s, 24H, 8CH3), 2.59 (s, 4H, 2(CH2)1,2), 2.78 (t, 8H, 4(CH2)4,4′,4′′,4′′′), 3.04 (t, 8H, 4(CH2)12,12′,12′′,12′′′), 3.25 (t, 8H, 4(CH2)7,7′,7′′,7′′′), 3.42 (t, 8H, 4(CH2)11,11′,11′′,11′′′), 3.68 (t, 8H, 4(CH2)3,3′,3′′,3′′′), 3.71 (t, 8H, 4(CH2)6,6′,6′′,6′′′), 7.38 (d, 4H, 4(ArCH)9,9′,9′′,9′′′), 7.41 (dd. 4H, 4(ArCH)16,16′,16′′,16′′′), 7.94 (d. 4H, 4(ArCH)8,8′,8′′,8′′′), 8.15 (s, 4H, 4(NH)5,5′,5′′,5′′′), 8.28 (s, 4H, 4(NH)10,10′,10′′,10′′′), 8.45 (d, 4H, 4(ArCH)15,15′,15′′,15′′′), and 8.51 (d, 4H, 4(ArCH)17,17′,17′′,17′′′).
The FCD molecule contains a large number of protons (104 hydrogen atoms) that represent nearly 6.6% of its total molecular weight. These protons can be classified into four categories: 24 protons from the methyl (CH3) groups, 52 protons from the methylene (CH2) groups, 20 aromatic protons from the naphthalene rings, and eight protons from the imine and amide [(−NH); (−NH−C=O)] groups. Methyl and methylene protons resonated in the high magnetic field region between 2.21 and 3.71 ppm. Aromatic, imine, and amide protons resonated in the low magnetic field region between 7.38 and 8.51 for the aromatic protons and from 8.15 to 8.28 for the imine and amide protons.
The TEM micrograph of the FCD molecule showed several sparse particles all of which were spherical and ranged from 9 to 14 nm in size.

3.2. Analytical Results

The elemental analysis results (in %) for the Zn2+ complex were C 55.70, H 5.61, N 13.60, Cl 7.88, and Zn 7.06; these data agree with the theoretical values (C 55.48, H 5.42, N 13.80, Cl 7.65, Zn 7.30) calculated from its molecular formula (C86H104N18O12Zn2Cl4; 1852.86 g/mol). For the Cd2+ complex, the obtained values were C 52.79, H 5.52, N 12.72, Cl 7.11, Cd 11.80, which aligned with the corresponding theoretical values (C 53.0, H 5.34, N 12.94, Cl 7.28, Cd 11.55) calculated from its molecular formula (C86H104N18O12Cd2Cl4; 1946.92 g/mol). For the Hg2+ complex, the obtained values (C 48.75, H 5.13, N 12.10, Cl 6.90, Hg 18.65) also agreed with the theoretical values calculated from its molecular formula (C86H104N18O12Hg2Cl4; 2123.28 g/mol) of C 48.60, H 4.90, N 11.87, Cl 6.68, Hg 18.89. These analytical results confirmed that the reaction between FCD and Zn2+, Cd2+, and Hg2+ ions proceeded with a molar ratio of 2:1 (metal: FCD) in the synthesis process.
The molar conductance values (Λm) of the complexes and the FCD molecule alone were determined for each compound resuspended in DMSO at 1.0 × 10⁻³ M at room temperature. The Λm value of the FCD molecule alone was 16 μS/cm. After complexing with the metal ions, this value increased to 85 μS/cm for the Zn2+ complex, 77 μS/cm for the Cd2+ complex, and 74 μS/cm for the Hg2+ complex, suggesting that the complexes were electrolytic [91]. Elemental results showed that all complexes contained chlorine elements at 6.68−7.65%. The silver nitrate test was used to determine whether the chloride ions were present inside or outside of the coordination sphere of a complex. The results indicated that chlorine was present in the outer spheres of the Zn2+, Cd2+, and Hg2+ complexes. Based on the analytical results, the general composition of the complexes can be proposed as [M2FCD]·4Cl (M: Zn2+, Cd2+, or Hg2+).

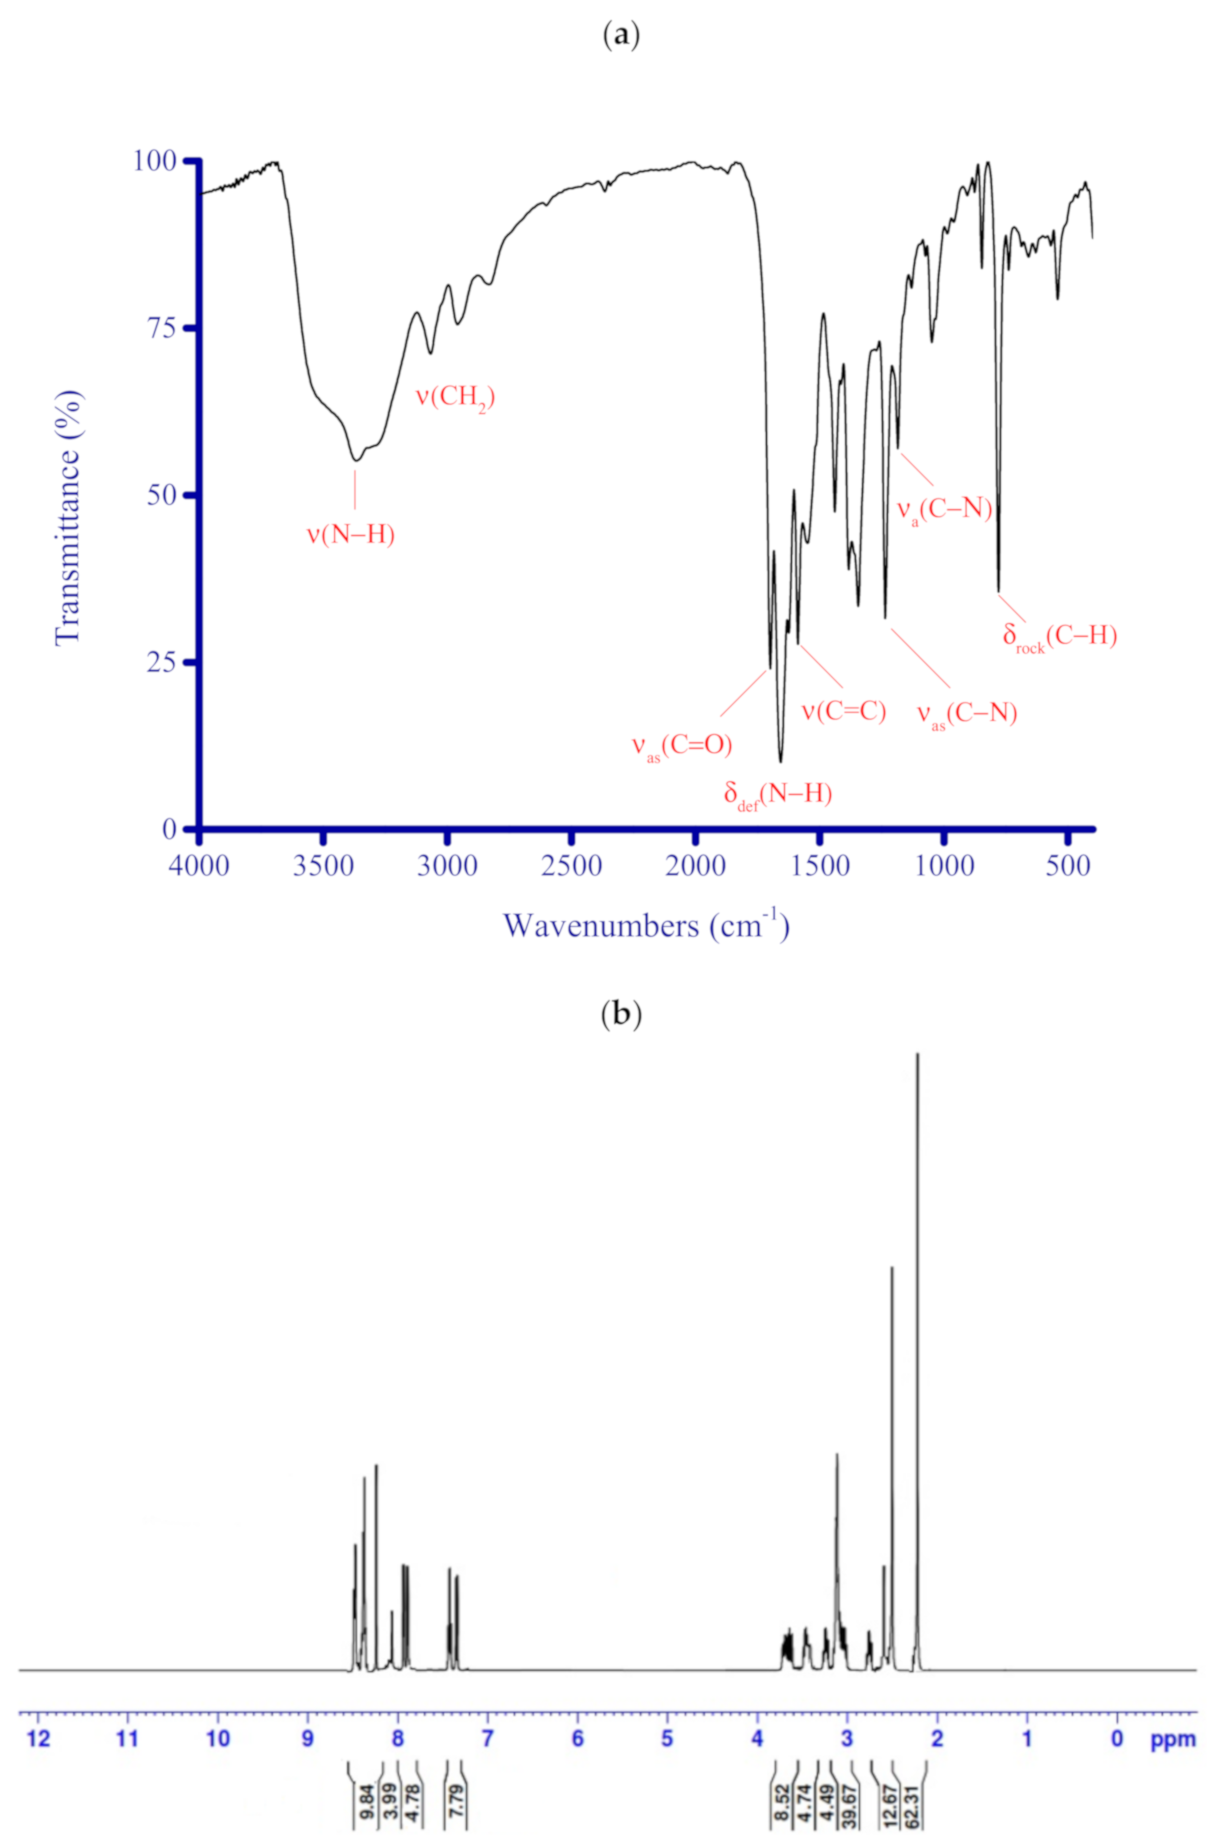
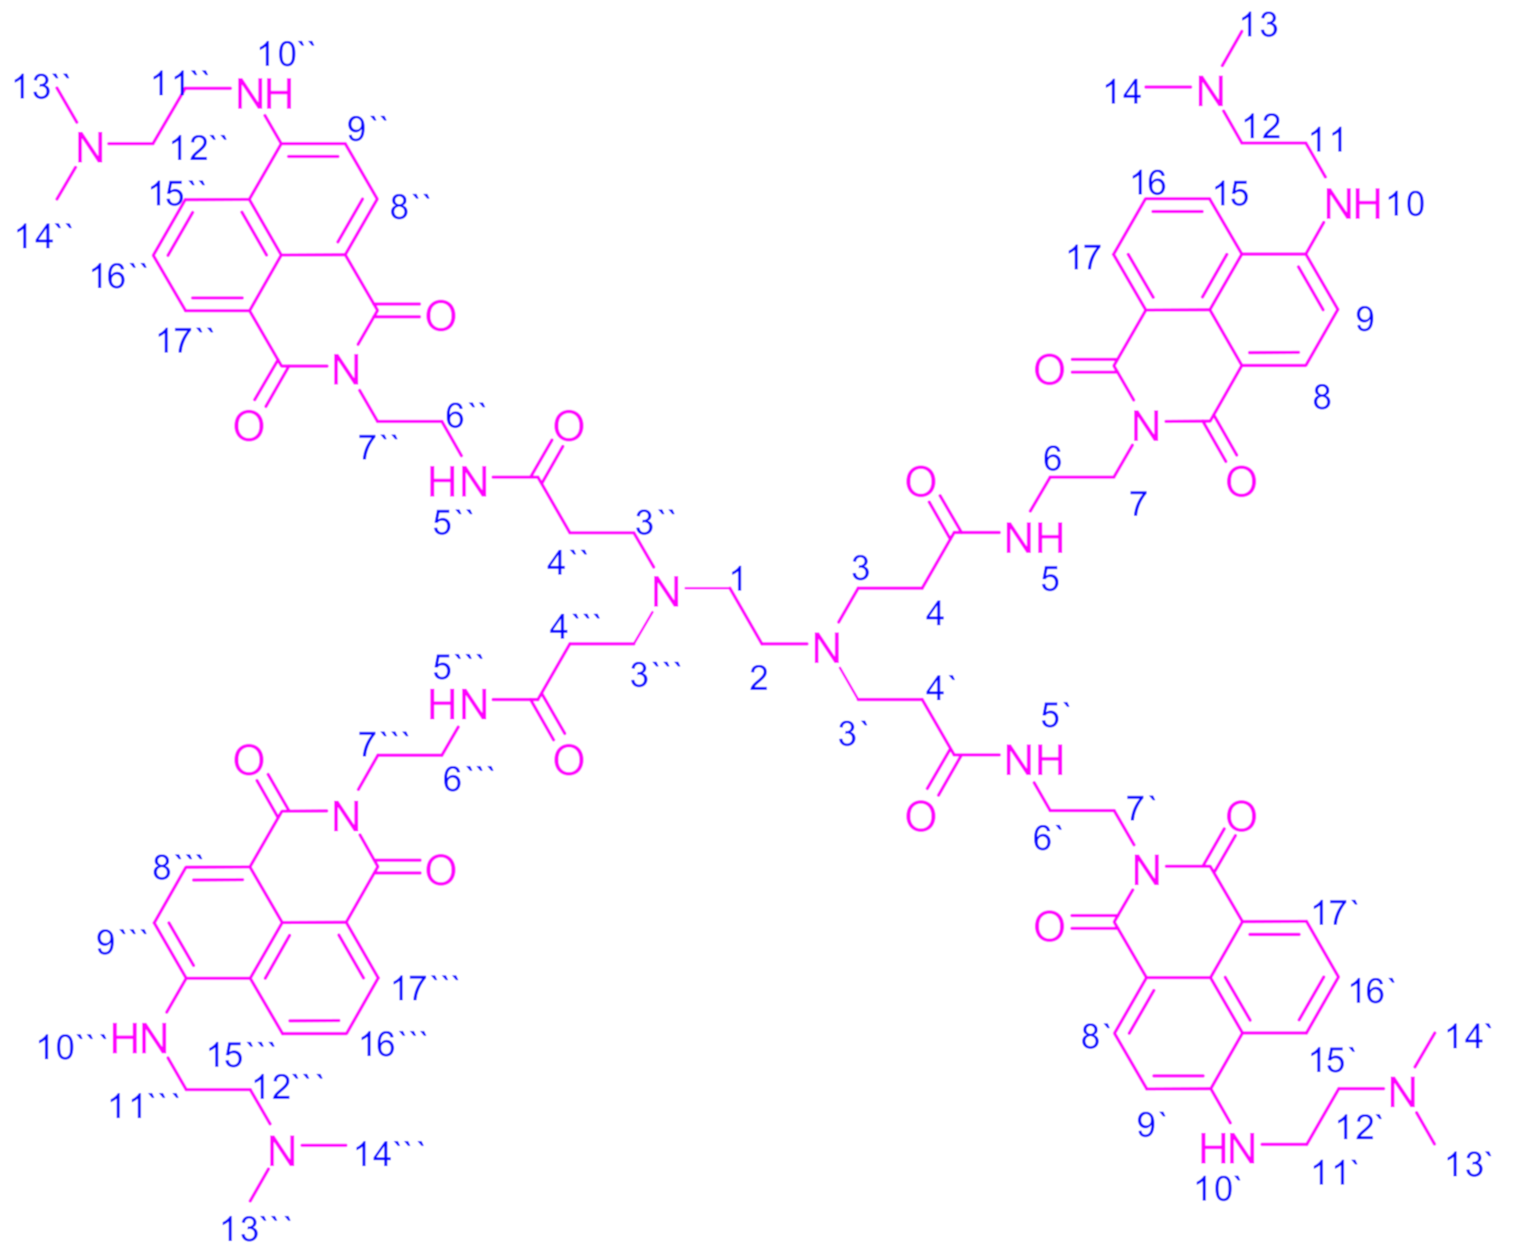
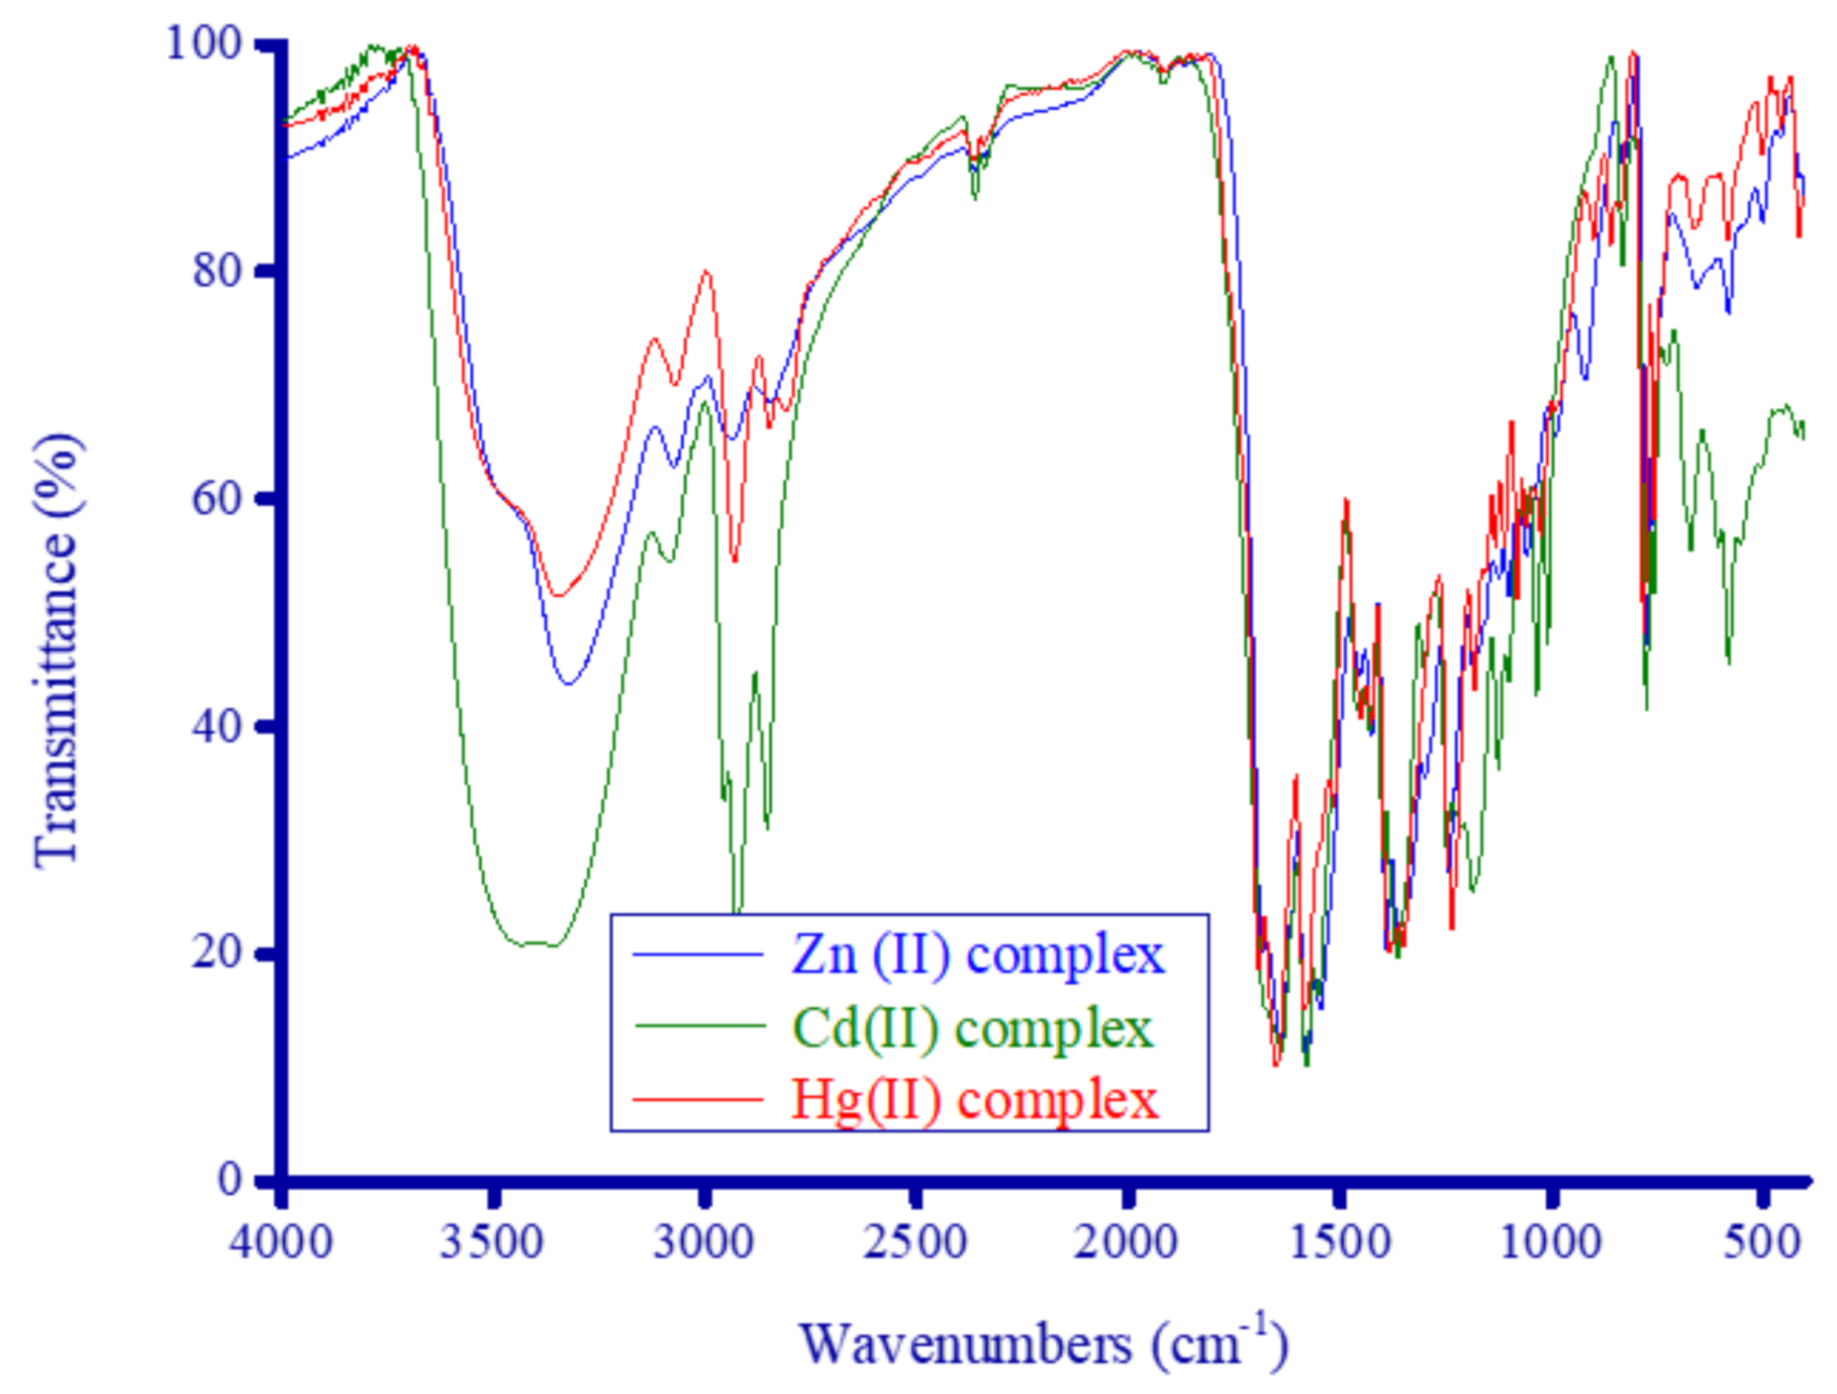
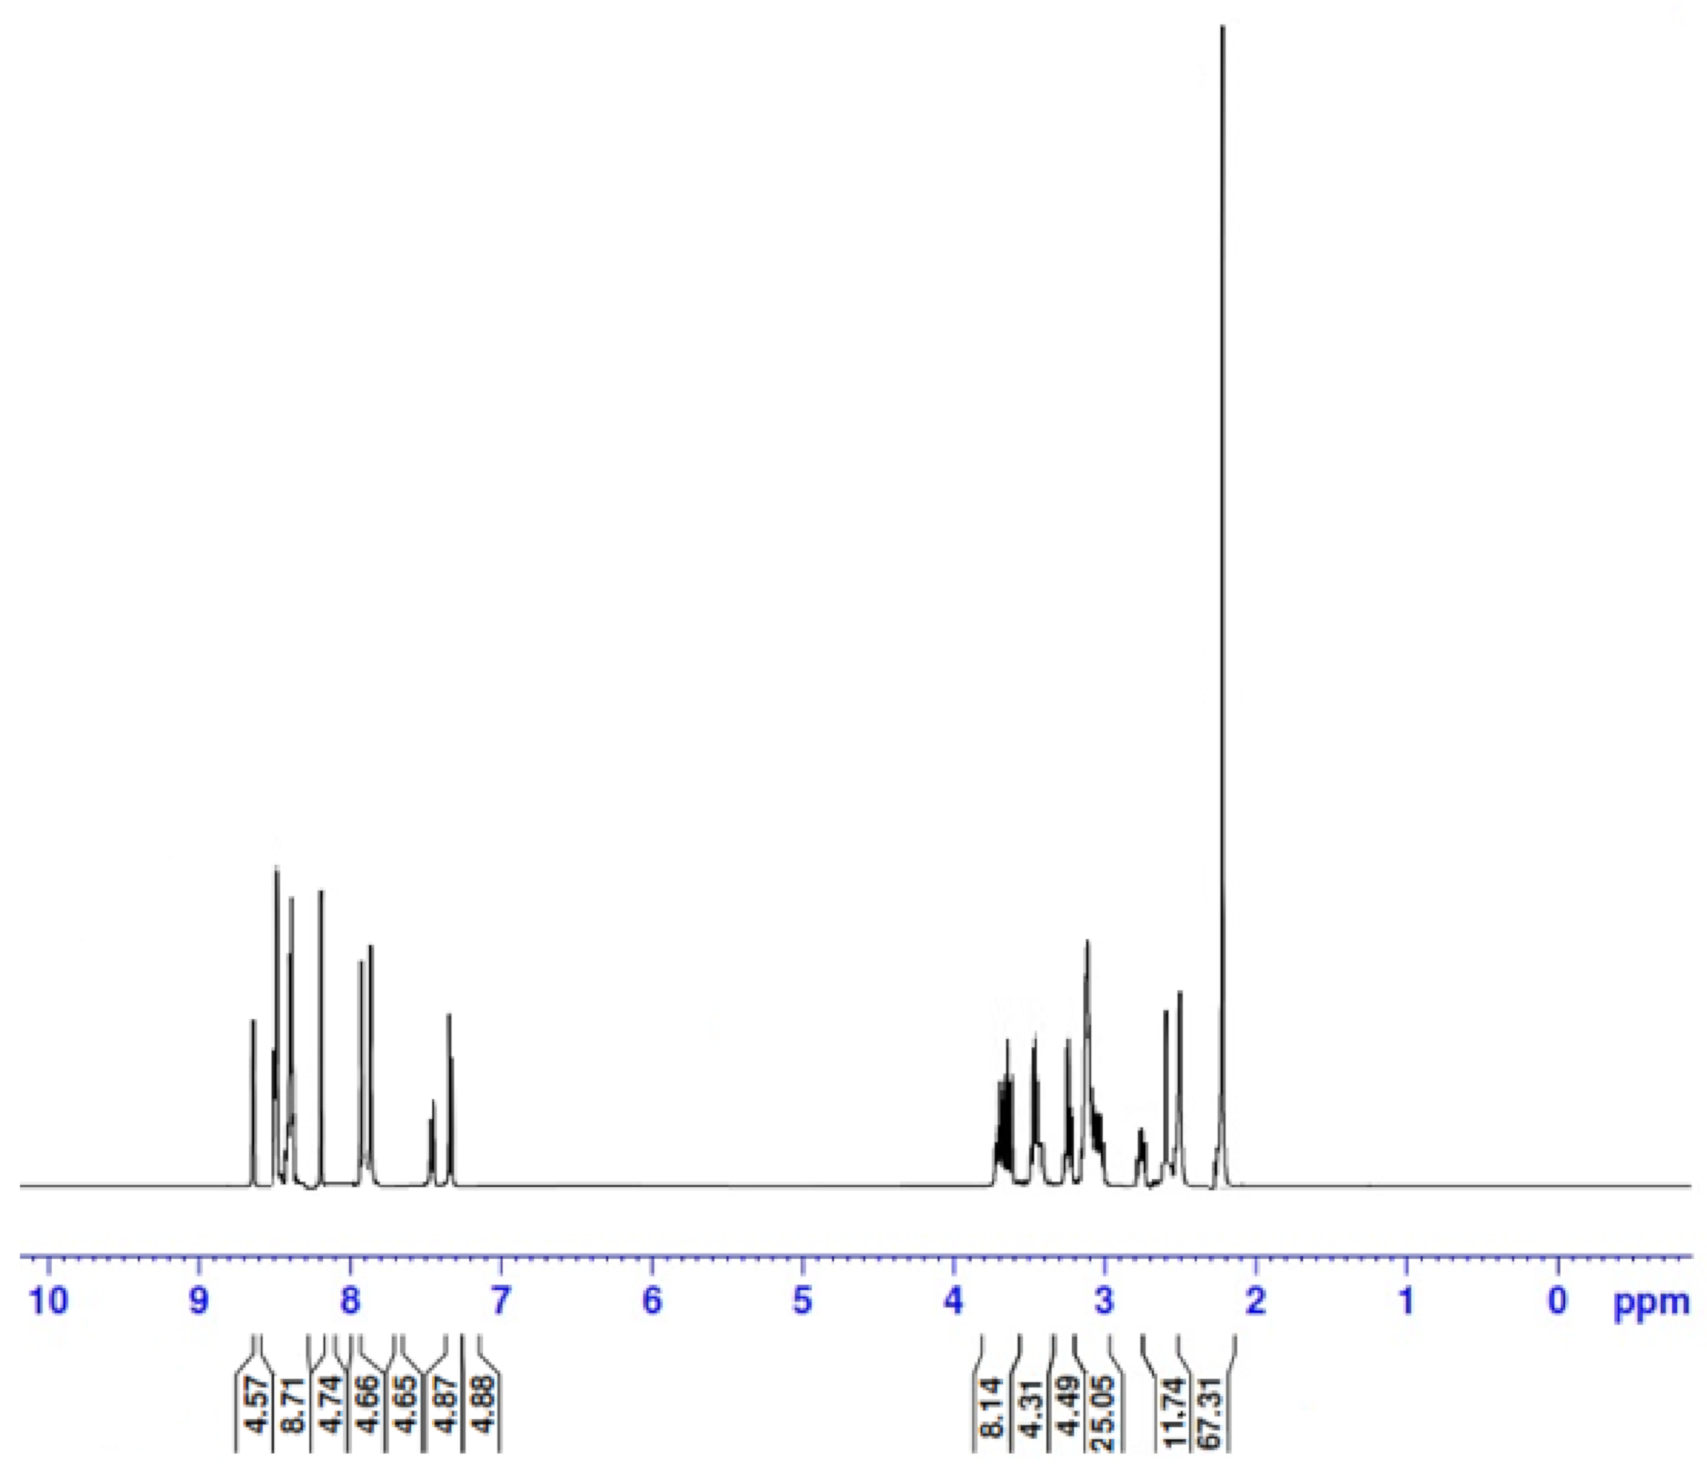
3.3. IR and 1H NMR Results

Figure 6 presents the IR spectra of the synthesized complexes, while the frequencies of the characteristic IR bands (cm−1) for the complexes are given below:
Zn2+ complex: 3320 ν(N−H), 3072 νas(C−H)Ar, 2939 νas(CH2), 2846 νs(CH2), 1682 νas(C=O), 1640 δdef(N−H), 1615 νs(C=O), 1578 and 1545 ν(C=C), 1453 δsciss(CH2), 1393 δrock(CH2), 1357 δsciss(CH3), 1240 νas(C−N), 1184 νs(C−N), 1057 δrock(N−H), 988 δrock(CH3), 919 δwag(CH2), 831 δwag(N−H), 776 δrock(C−H)Ar, 577 ν(M−O), and 502 δtwist(CH2).
Cd2+ complex: 3395 ν(N−H), 3089 νas(C−H)Ar, 2960 νas(CH2), 2857 νs(CH2), 1668 νas(C=O), 1639 δdef(N−H), 1612 νs(C=O), 1580 and 1547 ν(C=C), 1459 δsciss(CH2), 1395 δrock(CH2), 1365 δsciss(CH3), 1249 νas(C−N), 1186 νs(C−N), 1098 δrock(N−H), 1039 δrock(CH3), 1010 δwag(CH2), 834 δwag(N−H), 775 δrock(C−H)Ar, 575 ν(M−O), and 506 δtwist(CH2).
Hg2+ complex: 3347 ν(N−H), 3078 νas(C−H)Ar, 2931 νas(CH2), 2853, 2813 νs(CH2), 1690 νas(C=O), 1650 δdef(N−H), 1614 νs(C=O), 1580 and 1546 ν(C=C), 1455 δsciss(CH2), 1384 δrock(CH2), 1350 δsciss(CH3), 1235 νas(C−N), 1187 νs(C−N), 1083 δrock(N−H), 1059 δrock(CH3), 986 δwag(CH2), 860 δwag(N−H), 786 δrock(C−H)Ar, 580 ν(M−O), and 508 δtwist(CH2).
All of the vibration frequencies that characterized the FCD molecule were detected and assigned for all of the synthesized complexes. However, most of these vibrations were affected in intensity and position by the chelation process, which caused overlap between the spectral bands especially in the 1600 to 1100 cm−1 region. The most intense region observed in the IR spectra of the complexes spanned 1700 to 1500 cm−1, corresponding to the ν(C=O), ν(C=C), and δdef(N−H) vibrations. The strong, broad band observed for the FCD molecule alone ranged from 3580 to 3170 cm−1 due to the ν(N–H) vibration and was still observed in the IR spectra of the complexes within approximately the same range for the Zn2+ and Hg2+ complexes. The maximum intensity of this broad band was located at 3320, 3395, and 3347 cm−1 for the Zn2+, Cd2+, and Hg2+ complexes, respectively. Other vibration modes of the N–H band occurred in the range of 1650−1639 cm−1, 1098−1057 cm−1, and 860−831 cm−1 due to the δdef(N−H), δrock(N−H), and δwag(N−H) vibrations, respectively. In the complexes, the CH2 groups absorbed in the range of 2960−2931 cm−1, 2857−2813 cm−1, 1459−1453 cm−1, 1395−1384 cm−1, 1010−919 cm−1, and 508−502 cm−1 due to the νas(CH2), νs(CH2), δsciss(CH2), δrock(CH2), δwag(CH2), and δtwist(CH2) modes, respectively. The two bands resulting from the C=O vibrations were greatly affected in intensity and position after FCD chelated with the metal ions, especially the band associated with the νs(C=O) vibration, which was appreciably weaker than the analogous band in FCD alone. The band corresponding to the νas(C=O) vibration shifted from 1700 cm−1 in FCD alone to a lower frequency in the range of 1690−1668 cm−1 in the complexes, while the νs(C=O) vibration band shifted from 1624 cm−1 in FCD alone to a lower frequency in the range of 1615−1612 cm−1 in the complexes. The observed shifts in the asymmetric and symmetric vibrations of the C=O groups in the FCD molecule alone sample implicated them in the coordination reaction with the metal ions. The medium intensity bands observed at 577 cm−1 for the Zn2+ complex, 575 cm−1 for the Cd2+ complex, and 580 cm−1 for the Hg2+ complex that were not present in the FCD molecule alone may have resulted from the ν(M–O) stretching vibrations.
One of the synthesized complexes (Zn2+ complex) was used representative example to be examined by proton NMR analysis. The resultant 1H NMR spectrum, given in Figure 7, was compared with that of the FCD molecule alone.
The observed spectrum of the complex contained the following chemical shifts (in ppm): δ = 2.23 (s, 24H, 8CH3), 2.60 (s. 4H, 2(CH2)1,2), 2.77 (t, 8H, 4(CH2)4,4′,4′′,4′′′), 3.03 (t, 8H, 4(CH2)12,12′,12′′,12′′′), 3.24 (t, 8H, 4(CH2)7,7′,7′′,7′′′), 3.44 (t, 8H, 4(CH2)11,11′,11′′,11′′′), 3.68 (t, 8H, 4(CH2)3,3′,3′′,3′′′), 3.72 (t, 8H, 4(CH2)6,6′,6′′,6′′′), 7.37 (d. 4H, 4(ArCH)9,9′,9′′,9′′′), 7.43 (dd. 4H, 4(ArCH)16,16′,16′′,16′′′), 7.90 (d. 4H, 4(ArCH)8,8′,8′′,8′′′), 8.31 (s, 4H, 4(NH)10,10′,10′′,10′′′), 8.46 (d. 4H, 4(ArCH)15,15′,15′′,15′′′), 8.50 (d, 4H, 4(ArCH)17,17′,17′′,17′′′), and 8.66 (s, 4H, 4(NH)5,5′,5′′,5′′′).
The 1H NMR spectral data of the complex were assigned as (i) (s, 24H: CH3) at δ = 2.23 ppm; this signal was slightly up-field shifted compared with that from FCD alone, (ii) (t, 52H: CH2) at δ = 2.60−3.72 ppm range; these signals underwent slight up-field shifts compared with those of FCD alone, (iii) (s, 4H: NH) at δ = 8.31 ppm for the imine groups; these signals exhibited slight down-field shifts compared with those of FCD alone, (iv) (s, 4H: NH) at δ = 8.66 ppm for the amide groups; these signals were considerably down-field shifted compared with those of FCD alone, and (v) (d, 20H: ArCH) at δ = 7.37−8.50 ppm range for the aromatic protons of the naphthalene rings; these signals appeared at the same position in the FCD molecule alone. Generally, all of the protons in the complex resonated at a similar δ range as for the FCD molecule alone with slight shifts (up and down-field) due to the large size of the FCD molecule, except for the four protons of the amide groups (−NH−C=O), which exhibited considerable down-field shifts of nearly 0.51 ppm (from 8.15 ppm for the FCD molecule alone to 8.66 pm for the complex). This down-field shift for the amide group protons may be due to the electronic effect of the positively charged metal ion chelated at coordination sites much closer to these protons, which suggested that the coordination sites in the FCD molecule were the oxygen atoms in the (C=O) groups. The positively charged metal ions attracted the electrons around the carbon atoms much closer to the coordination sites and thus decreased the shielding effect of these atoms on the protons.

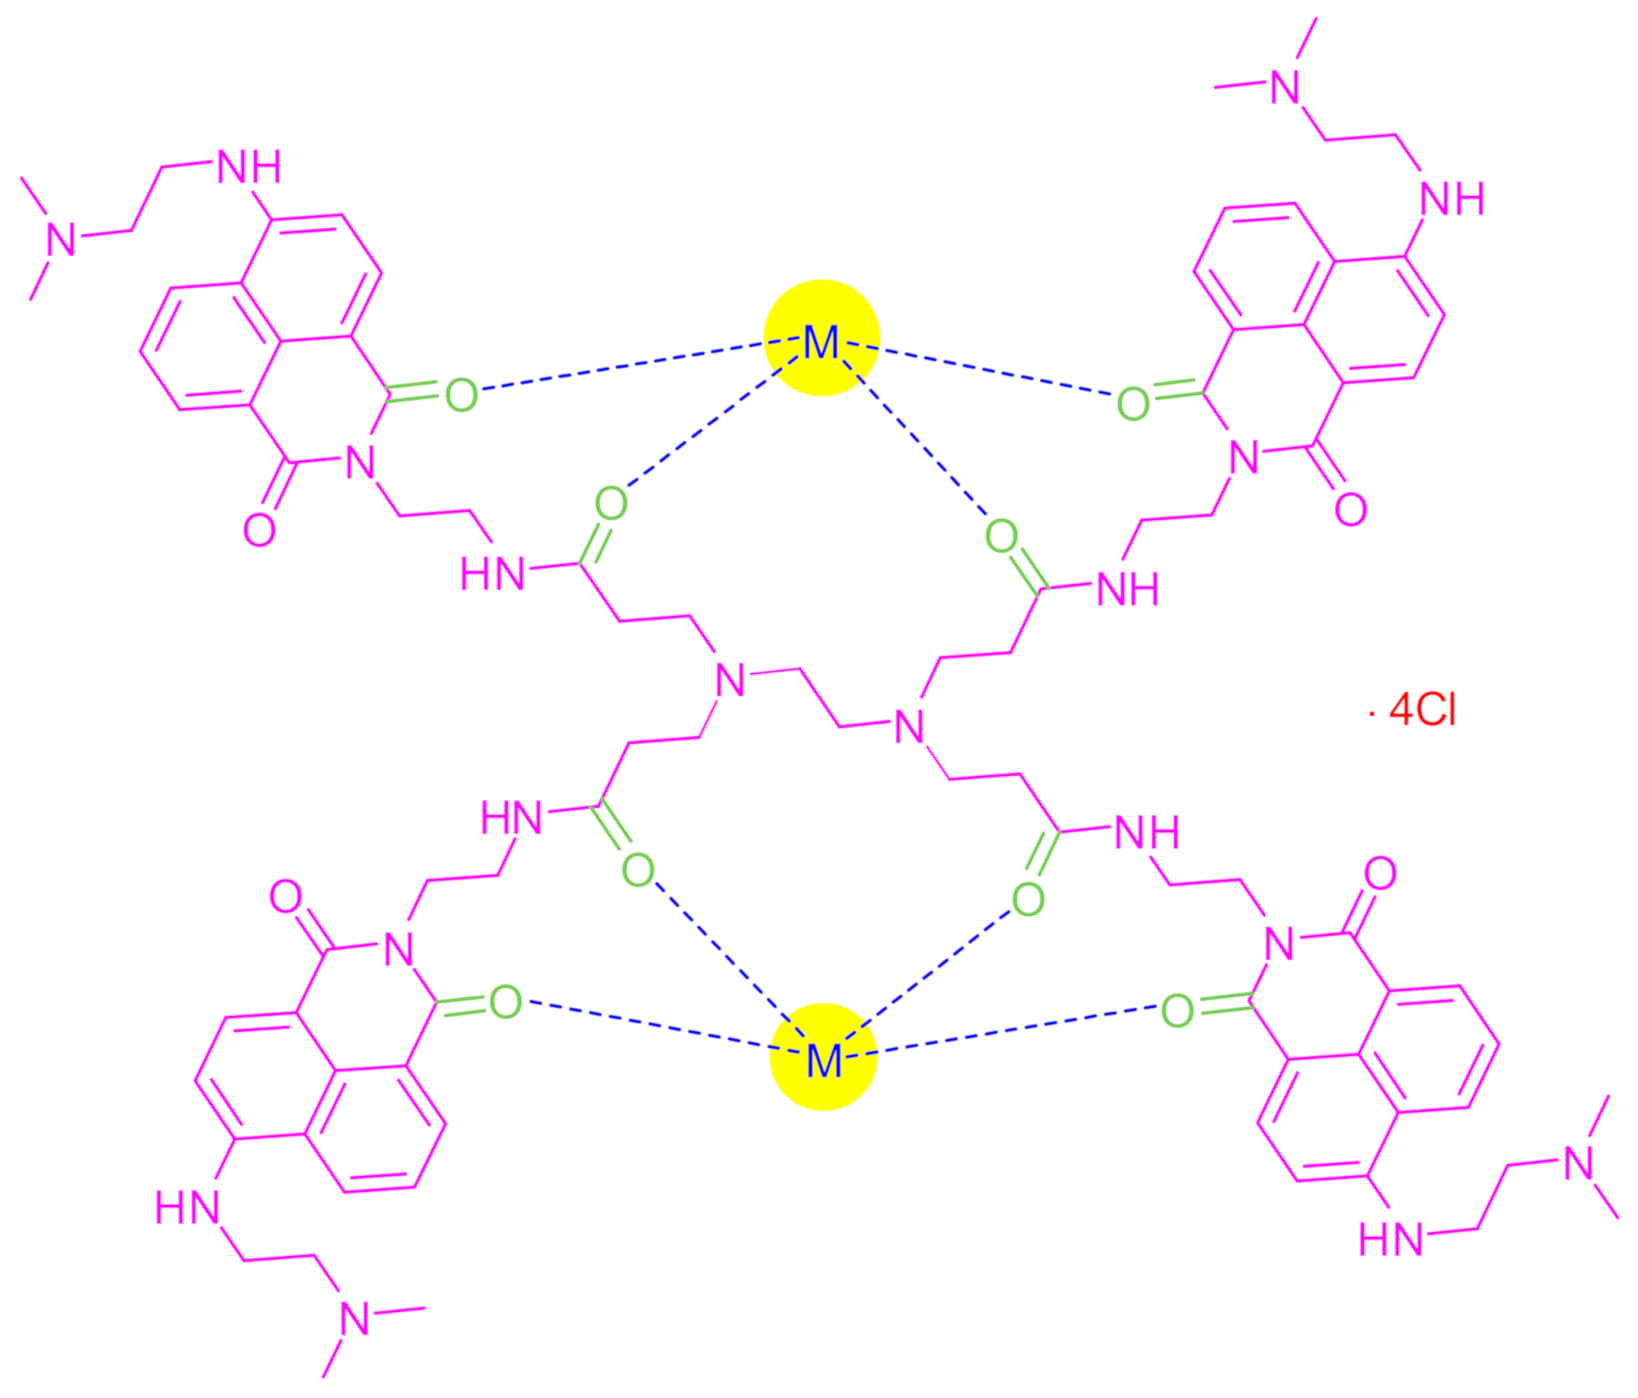
3.4. Proposed Structure of the Complexes

Figure 8 depicts the proposed structure of the synthesized complexes based on the analytical, IR and 1H NMR spectral results. In this proposed structure, the eight oxygen atoms of the (C=O) groups in the FCD molecule covalently bonded to two metal ions (M2+) and four chloride ions (Clˉ) equivalent to the positive charges of the metal ions. As such, the complexes were composed of [M2FCD]·4Cl (M: metal ion, FCD: synthesized fluorescent dendrimer). The stereochemistry around each metal in the complex was square planar.

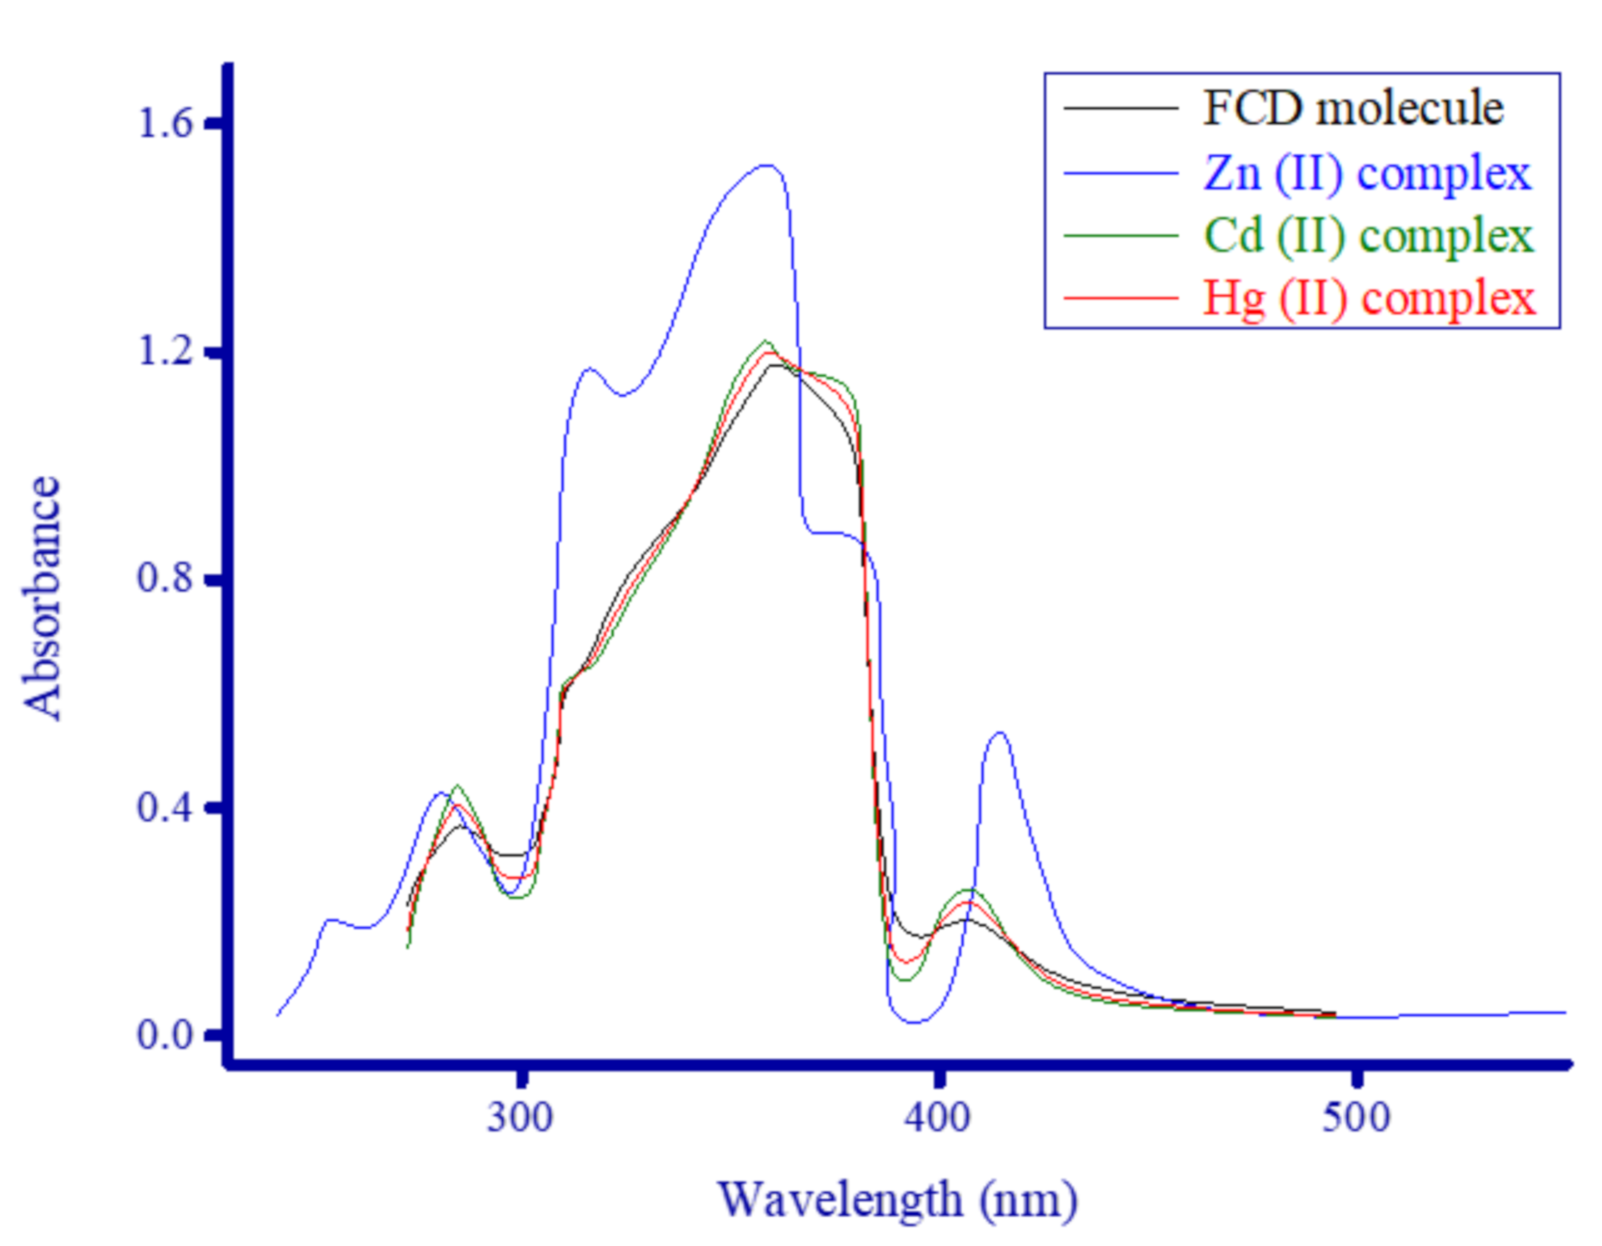
3.5. Photophysical Properties

To obtain a complete comparative picture of the influence of Zn2+, Cd2+, and Hg2+ ions on the photophysical properties of the FCD molecule, the complexes as well as the FCD molecule alone were analyzed by fluorescence and absorption spectroscopy. Figure 9 contains the electronic absorption spectra for the FCD molecule alone (1 × 10⁻³ M) and in the presence of 1 × 10⁻⁴ M Zn2+, Cd2+, and Hg2+ ions recorded from 200 to 600 nm in DMSO at room temperature. Figure 10 contains fluorescence emission spectra for the FCD molecule alone (1 × 10⁻³ M) and in the presence of 1 × 10⁻⁴ M Zn2+, Cd2+, and Hg2+ ions measured in DMSO in the 350 to 600 nm range.

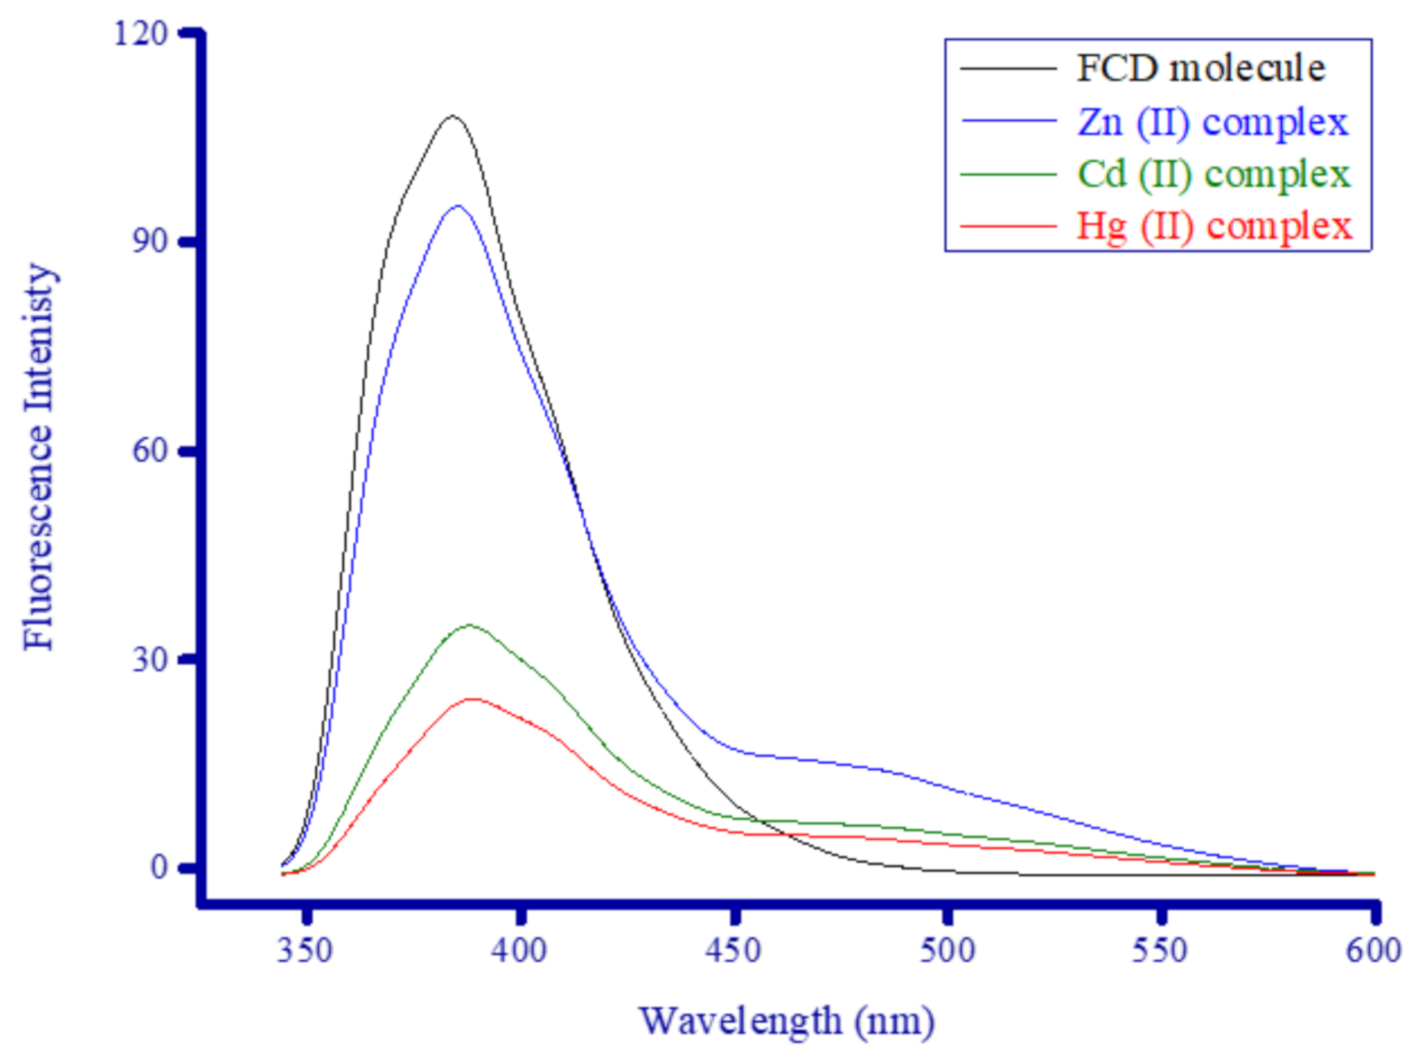
3.5.1. FCD Absorption and Emission Spectra

The FCD molecule alone exhibited three electronic absorption bands in the UV−visible region:
(i) One weak band located around 285 nm.
(ii) One very strong and broad band ranging from 305 to 385 nm (~80 nm wide) with maxima intensity at 360 nm.
(iii) One weak band observed at much longer wavelengths, centered at 406 nm.
The FCD molecule emitted an intense yellow-green fluorescence color in DMSO, and its fluorescence emission spectrum showed one very strong, broad band ranging from 345 to 460 nm (~115 nm wide) with maxima emission intensity at 385 nm. The emission band of the FCD molecule was more severe and broader than its absorption band. While the absorption maxima of FCD was λAb. = 360 nm, its fluorescence emission maxima shifted by 25 nm and appeared at a longer wavelength (λF = 385 nm).

3.5.2. Complexes’ Absorption and Emission Spectra

Upon the addition of the Zn2+, Cd2+, and Hg2+ ions, only the Zn2+ ion generated a remarkable absorption change. Binding to Cd2+ and Hg2+ ions, generally, did not elicit any remarkable change in the intensity or width of the absorption bands of the FCD molecule. The Cd2+ and Hg2+ complexes generated similar electronic absorption spectra, with the same extinction as the FCD molecule alone, and they caused a slight enhancement in the intensity of all three absorption bands of FCD alone (285, 360, and 406 nm). As seen in Figure 9, the UV−visible absorption spectrum of the FCD molecule alone was remarkably affected by the Zn2+ ion. Complexation with Zn2+ ions greatly enhanced the intensity of FCD’s absorption at 360 nm. In the Zn2+ complex, no notable change occurred to the band around 285 nm, while the intensity of the band around 406 nm greatly increased and its maxima red-shifted and appeared at a new position (414 nm). The most affected band in the complex was centered at 360 nm, the changes to this band included its intensity and shape. The intensity of the band greatly increased. The band for FCD alone had a semi-symmetrical bell curve shape, but in the complex, this curve had two shoulders, the left shoulder appeared at 316 nm, while the right shoulder appeared at 377 nm. Binding to the Cd2+ and Hg2+ ions considerably decreased the fluorescence intensity of the FCD molecule and greatly narrowed its emission band. Correspondingly, when FCD bound to the Zn2+ ion, the fluorescence intensity reduced slightly, and a new broad emission band with medium intensity ranging from 450 to 550 nm and centered at 475 nm formed. The FCD molecule alone had negligible emission in this range, while the emissions from the Cd2+ and Hg2+ complexes in this range were weak. The weakening of FCD’s fluorescence intensity from the ions occurred in the following order Hg2+ > Cd2+ > Zn2+. The Zn2+ ion increased the intensity of FCD’s absorption around 360 nm and emitted a new fluorescent signal around 475 nm. The distinct electronic absorption and fluorescence emission profiles of the Zn2+ complex distinguish it from the other two complexes.

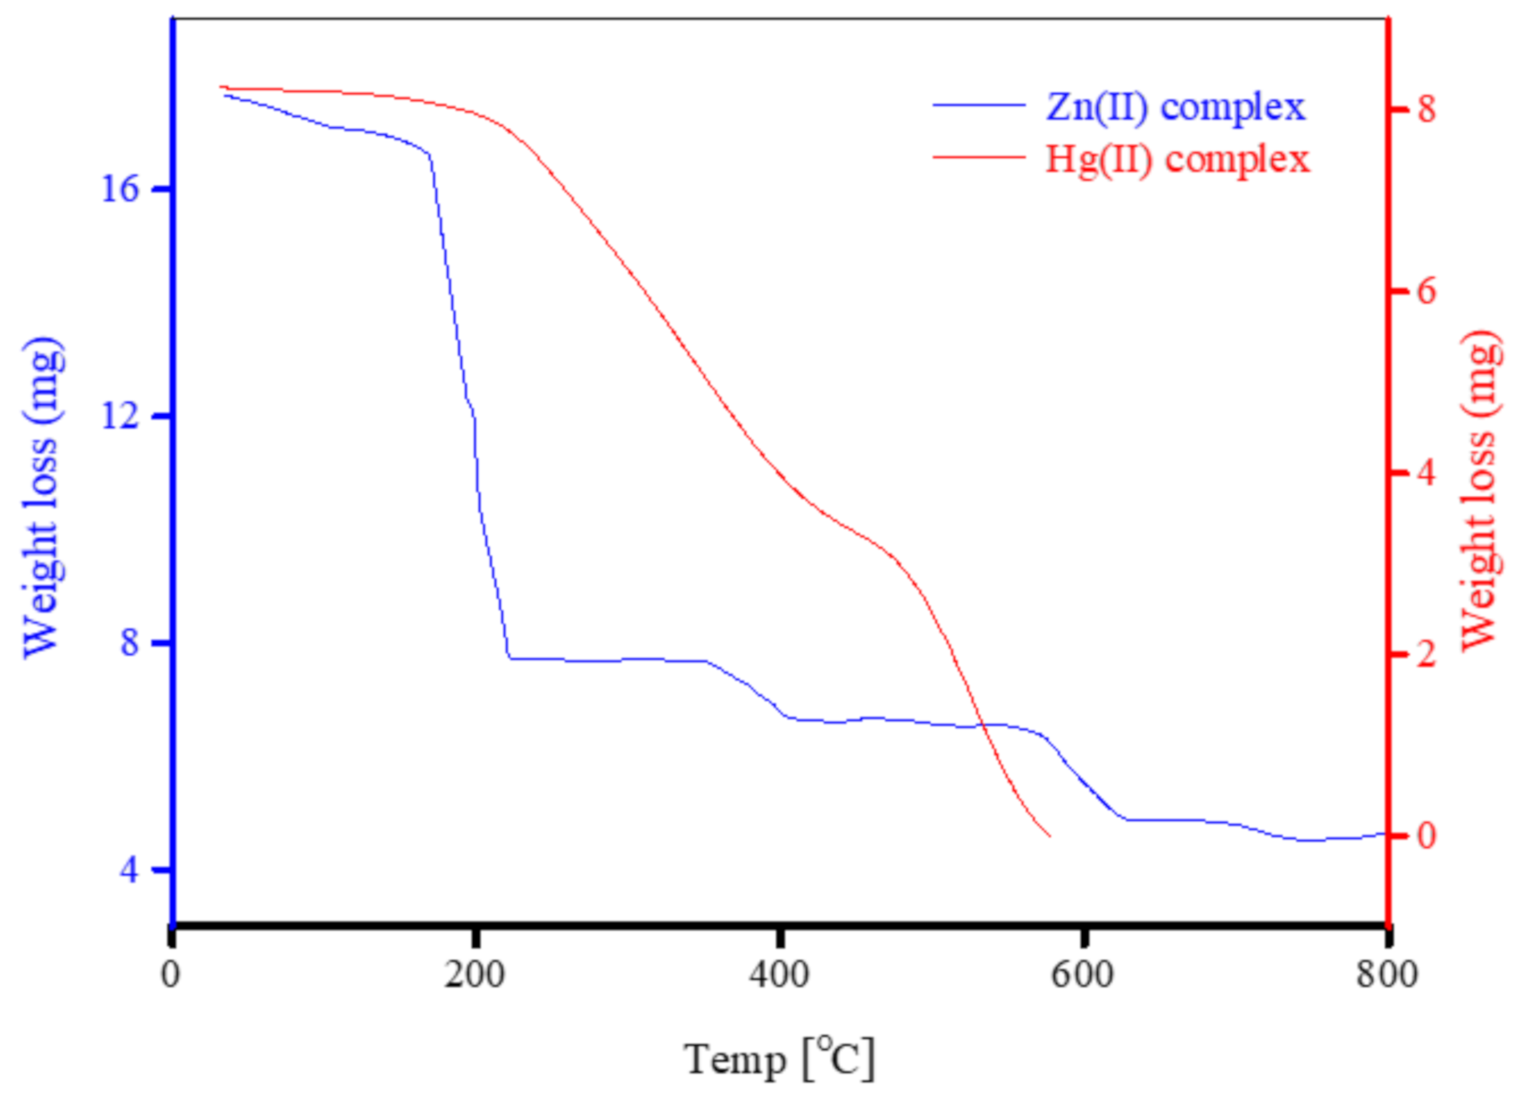
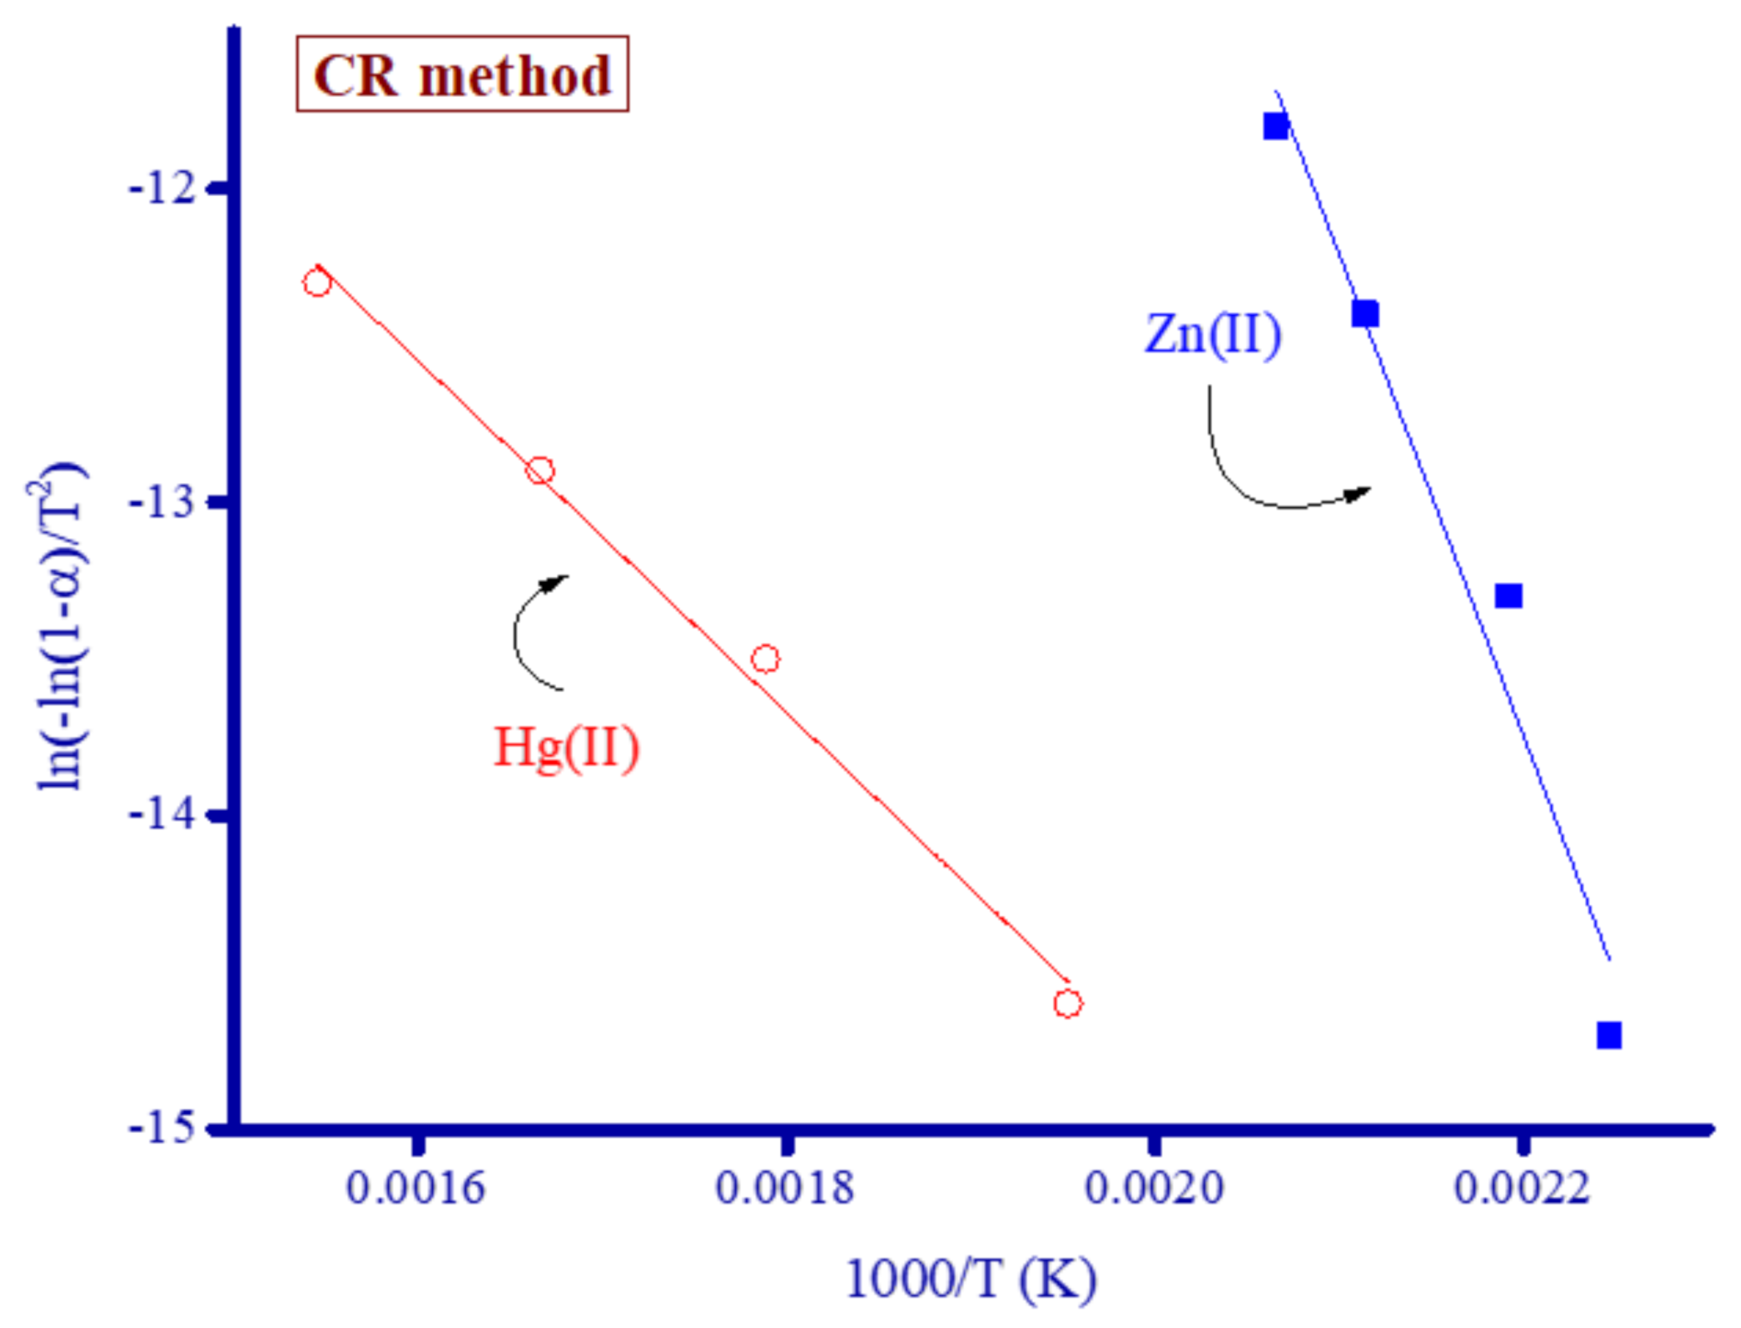
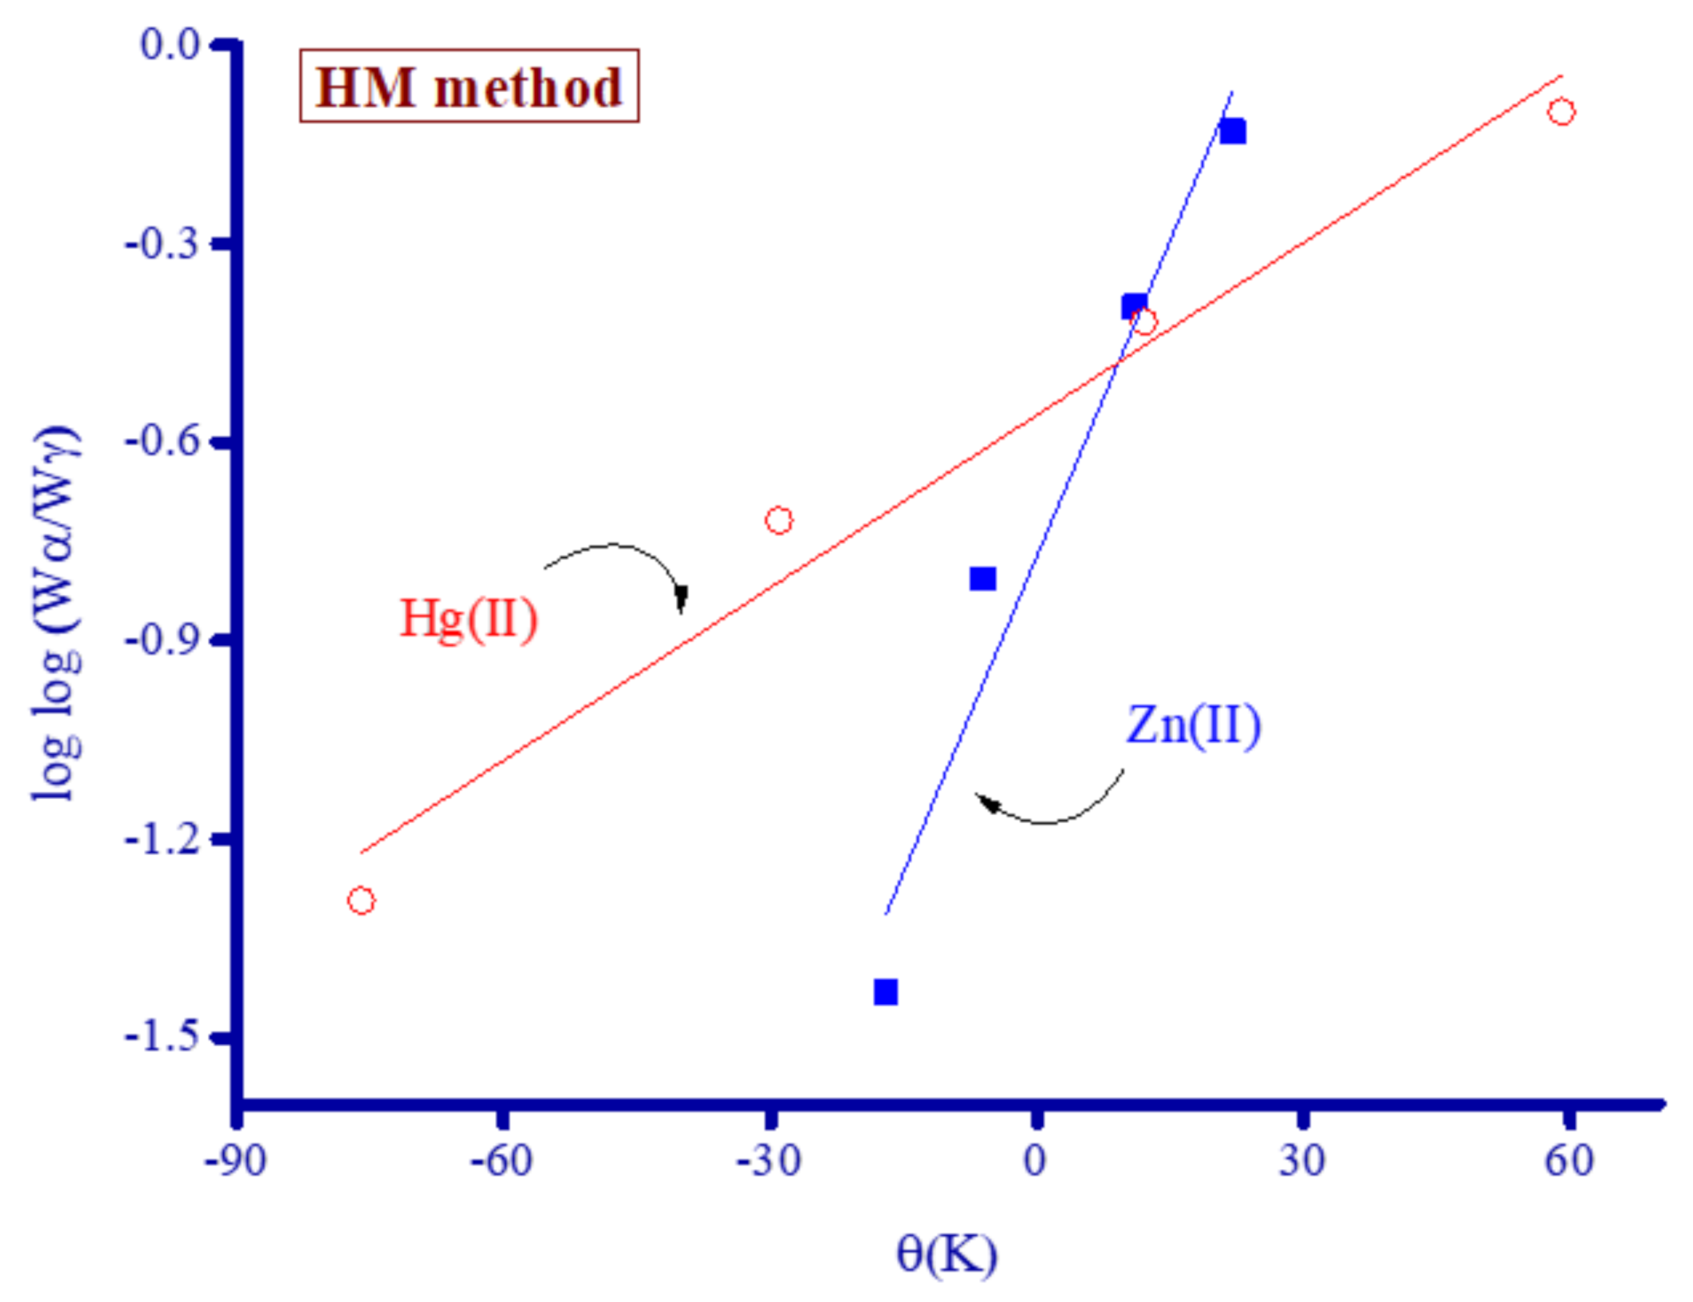
3.6. Thermal Analysis and Thermodynamic Constants

The thermal stability of the Zn2+ and Hg2+ complexes was assessed by subjecting the complexes to TG analysis. Several thermodynamic constants were evaluated graphically from the TG curves obtained using the Coats–Redfern (CR) [92] and Horowitz–Metzger (HM) [93] equations. The thermodynamic constants include the Gibbs free energy of activation (ΔG*), activation energy (E*), the entropy of activation (ΔS*), and the enthalpy of activation (ΔH*). Figure 11, Figure 12, and Figure 13, respectively, contain the TG thermograms of the Zn2+ and Hg2+ complexes, thermodynamic graphs of the complexes derived using the CR method, and thermodynamic graphs of the complexes derived from the HM method. The Zn2+ complex decomposed in three steps, but around 56% of its total weight was released and pyrolyzed in the first degradation step. This complex was thermally stable in air up to 150 °C and its three degradation steps occurred at 150–250 °C, 250–480 °C, and 480–660 °C, corresponding to weight losses of 56.36%, 6.00%, and 9.23%, respectively. The decomposition of the complex was nearly complete by ~660 °C leaving zinc oxide contaminated with a large amount of residual carbon. The final decomposition products resulting from the combustion of the complex were 2ZnO + 30C, reflected in an observed weight loss of approximately 28.05% (calculated to be 28.21%). The Hg2+ complex was more thermally stable than the Zn2+ complex. The TG profile of this complex indicated that it remained thermally stable until 200 °C and, from there, it completely decomposed in two stages ending by ~577 °C. The two stages occurred in the temperature ranges of 200–350 and 350–577 °C, which corresponded to weight losses of 38.53% and 61.40%, respectively. The total weight loss from these two stages was close to 100.0%, which indicated that the Hg2+ complex underwent complete combustion with no residual metal oxide or carbon remaining, in contrast to the degradation of the Zn2+ complex. The mercury metal in the Hg2+ complex was likely released as mercury vapor, mercury chloride, or volatile metalloorganic derivatives. The latter is most likely, given the large amounts of carbon and hydrogen contained in the complex.
The thermodynamic constants ΔG*, E*, ΔS*, and ΔH* were calculated for the Zn2+ and Hg2+ complexes using the CR and HM equations (Table 1). The value of E* was derived from the slopes of the lines generated using Equations (1) and (2) for the CR and HM methods, respectively.
Ln[−ln(1−α)/T2] = − E*/RT + ln[AR/ϕE*]
Log [log (wα/wγ)] = E*θ/2.303RTs 2 − log 2.303
Equations (3)–(5) were used to calculate the values of ΔG*, ΔS*, and ΔH*.
ΔH* = E* − RT
S* = Rln(Ah/kTs)
ΔG* = ΔH* − TΔS*
The full form of the symbols in these equations are: Ts—DTG peak temperature; h—Planck’s constant; k—Boltzmann’s constant; R—gas constant; T—derivative peak temperature; ϕ—linear heating rate; α—fraction of the product decomposed at time t; wγ—equal to wα—w; θ—equal to (TTs); w—mass loss at time t; and wα—mass loss after the reaction. The data listed in Table 1 revealed that the thermodynamic constants derived using both methods (HM and CR) for the main complex decomposition stage were comparable. Both E* values were very close to the corresponding ΔH* values. Increasing the thermal stability of a complex increased its Gibbs free energy of activation (ΔG). The ΔG value for the Hg2+ complex was 1.71 × 10⁵ J mol−1, higher than the Zn2+ complex (1.30 × 10⁵ J mol−1), which reflected the increased thermal stability of the Hg2+ complex. The values of ΔS* for both complexes were negative, indicated that the reaction was slower than normal or that the activated complexes are more ordered than that of either of the reactants [94]. The values of ΔH*, and ΔG* for both complexes were positive, suggesting that FCD and the investigated metal ions reacted non-spontaneously to form thermally stable complexes and the decomposition process was endothermic [94,95]. An extraordinarily strong linear correlation (r = 1) is observed between the values of entropy (ΔS*) and enthalpy (ΔH*) (Figure 14).

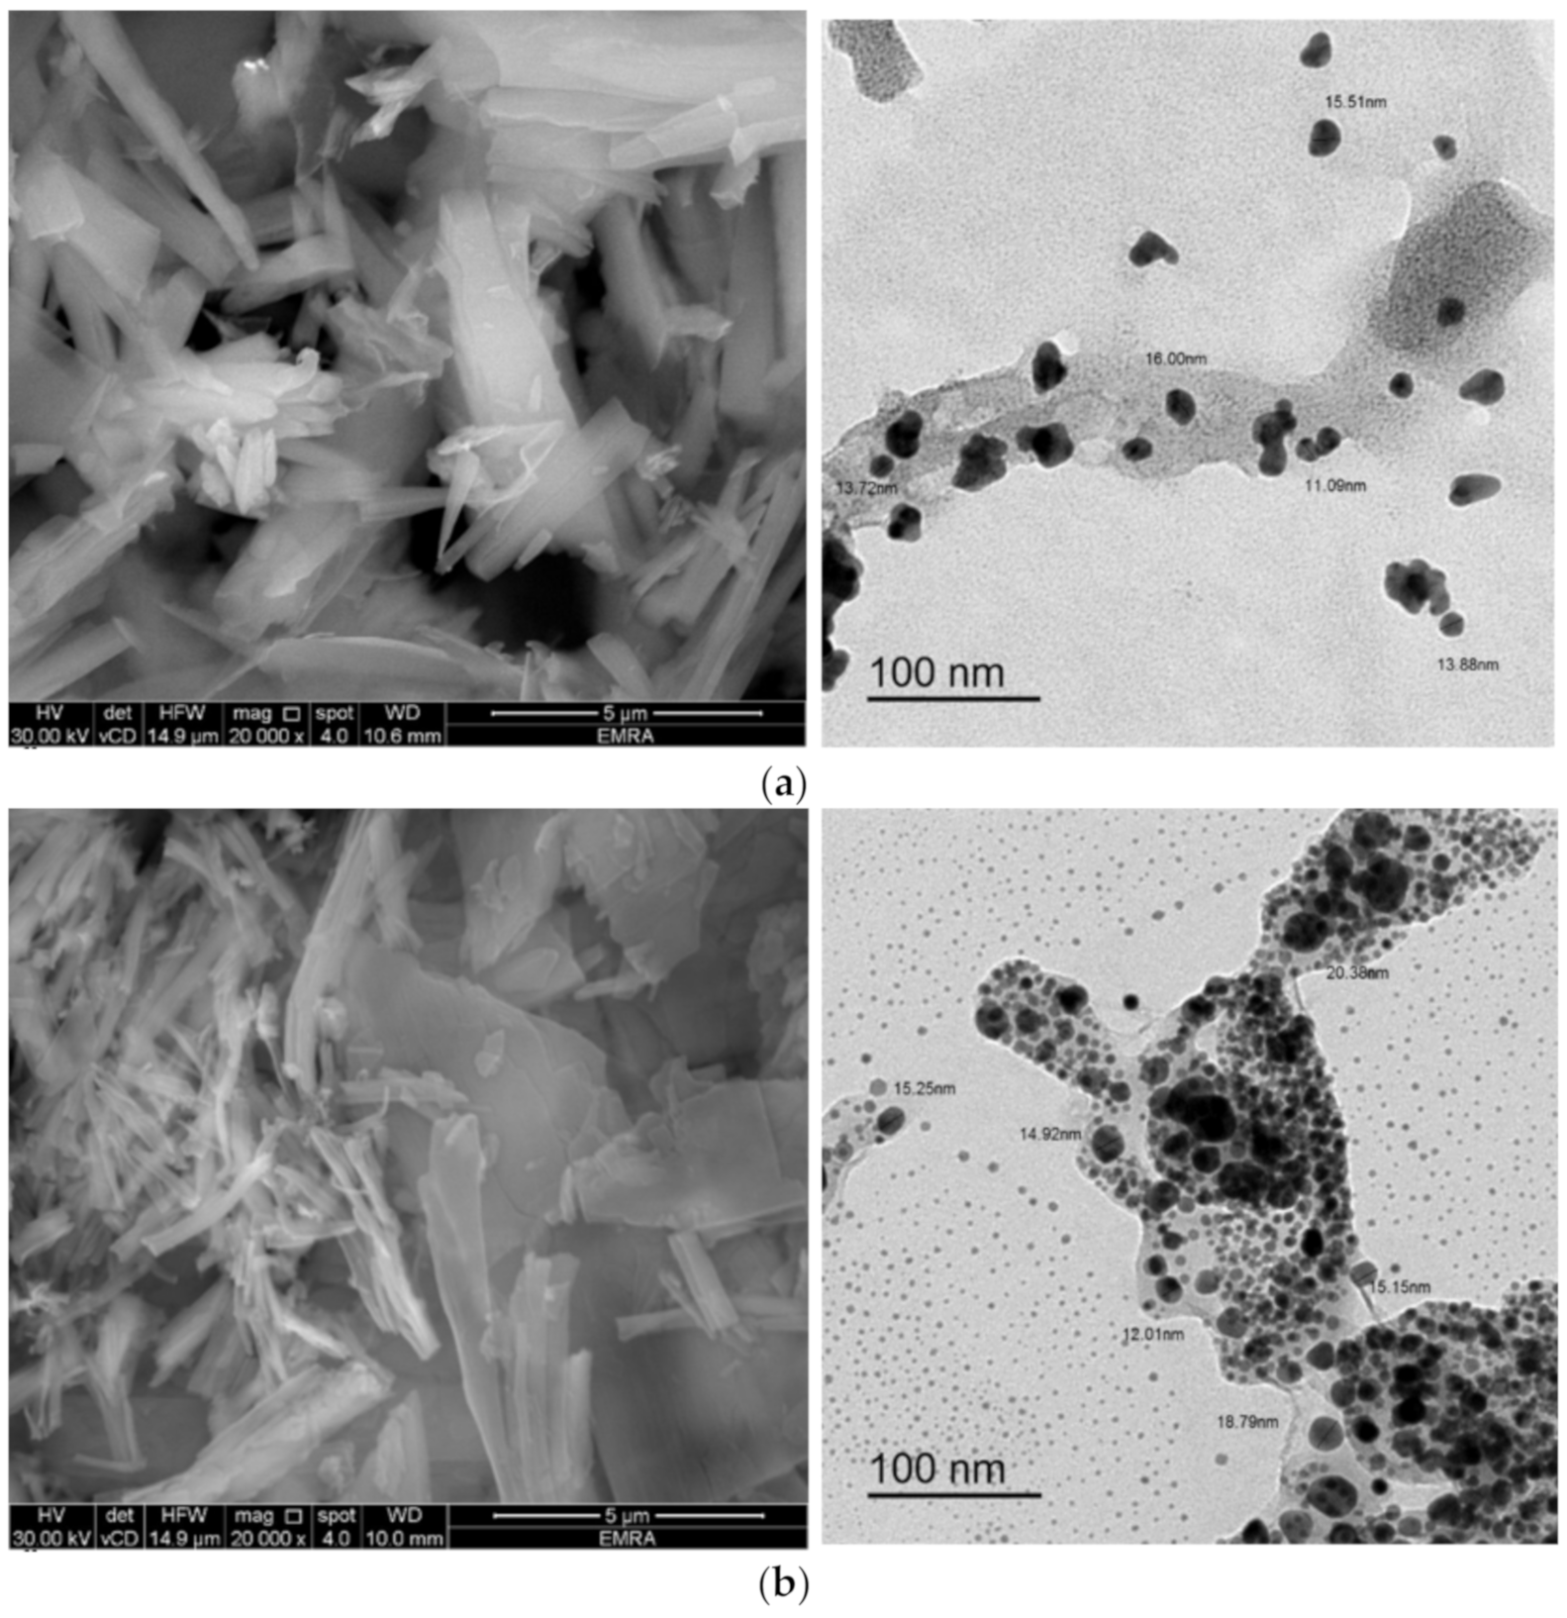
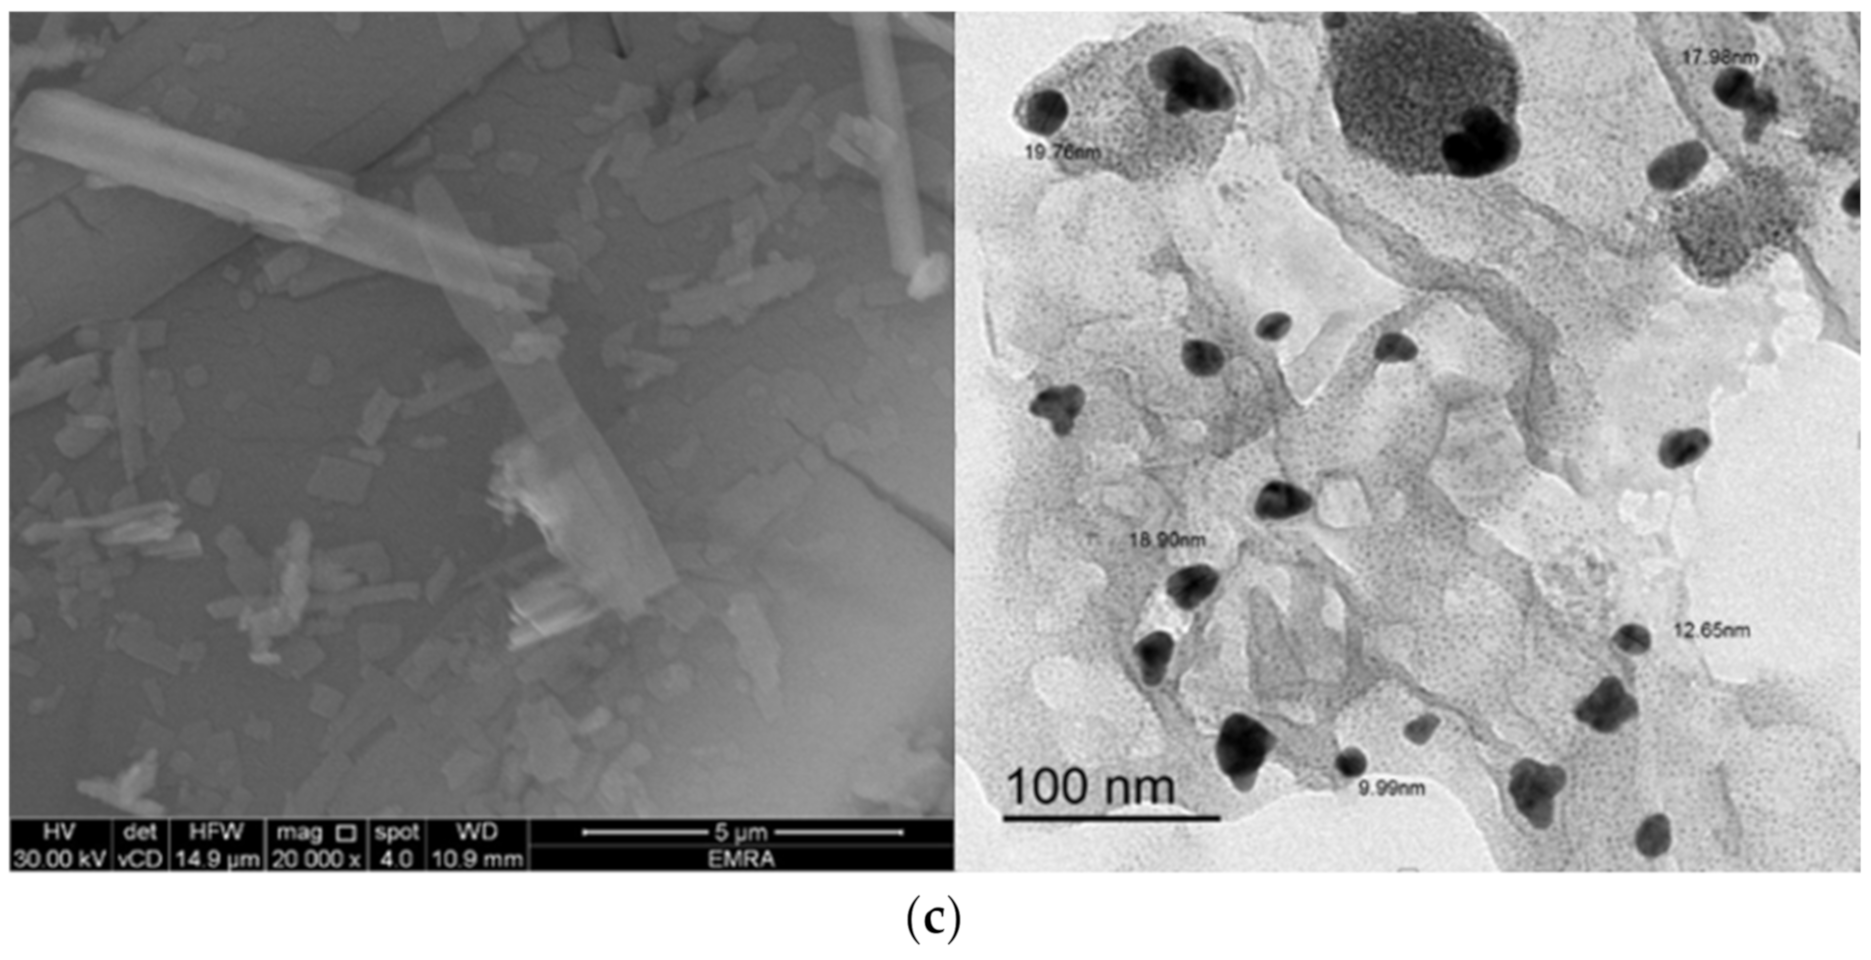
3.7. SEM, and TEM Characterizations

SEM, and TEM were employed to characterize the synthesized complexes according to their microstructure, topology, and to determine the shape and size of their particles. The micrographs of the complexes obtained by SEM and TEM are presented in Figure 15. The SEM micrographs of the complexes captured at high magnification (20,000×) demonstrated that their particles were mixed rod-like structures that grew to different lengths and widths. The surfaces of the rods were very smooth, and few granules were observed agglomerated on the surface of some rods. Micrographs obtained by TEM revealed that the particle sizes of the complexes were in the nano-size range, around 11−16, 12−19, and 10−20 nm for the Zn2+, Cd2+, and Hg2+ complexes, respectively. The particles of the complexes were spherical and semispherical in shape, and some particles were irregularly shaped with wrinkled surfaces.

4. Conclusions

A fluorescent dendrimer was synthesized by modifying a PAMAM dendrimer (ethylenediamine core of generation 0.0) with 4-N,N′-dimethylethylenediamine-1,8-naphthalmide, and labeled as FCD. Three metal–FCD complexes were synthesized by reacting FCD with Zn2+, Cd2+, and Hg2+ ions at a molar ratio of 2:1 (FCD: metal ion). Elemental, IR, and 1H NMR analyses were used to investigate the complexes’ structures, and the findings suggested that the (C=O) groups in each FCD molecule covalently bonded to two metal ions (M2+) to form complexes with the composition of [M2FCD]·4Cl. The photophysical properties of the FCD molecule alone and its metal complexes were characterized using fluorescence and absorption spectroscopy. Larger spectral shifts were observed in the absorption and emission spectra of the FCD molecule after complexation with the Zn2+ ion compared with the other two metal ions. Thermal decompositions and kinetic data indicated that the Hg2+ complex was thermally stable up to 200 °C. TEM analysis revealed that the resultant complexes had a mixed short and long rod-like morphology and their particles were nano-sized, in general, ranging from 10 to 20 nm. Taken together, the data presented in this work suggest that the synthesized fluorescent dendrimer can capture environmentally hazardous metal ions (e.g., Zn2+, Cd2+, and Hg2+ ions).

Author Contributions

Conceptualization, T.A.A. and M.S.R.; methodology, A.M.A.A.; software, H.A.S.; validation, T.A.A., M.S.R. and S.M.E.-M.; formal analysis, S.M.E.-M.; investigation, A.M.A.A.; resources, T.A.A. and M.S.R.; data curation, S.M.E.-M.; writing—original draft preparation, A.M.A.A.; writing—review and editing, H.A.S.; visualization, M.S.R. and H.A.S.; supervision, T.A.A.; project administration, A.M.A.A.; funding acquisition, M.S.R. All authors have read and agreed to the published version of the manuscript.

Funding

This work was funded by High Altitude Research Center, Taif University, Taif, Saudi Arabia; Project number: 1-440-6170.

Data Availability Statement

Data is contained within the article. The data presented in this study can be seen in the content above.

Acknowledgments

The authors would like to extend their sincere thanks to High Altitude Research Center, Taif University, Taif, Saudi Arabia, for its funding of this research through the Research Group; Project number: 1-440-6170.

Conflicts of Interest

The authors declare no conflict of interest.

References

  1. Sharma, M.; Poddar, M.; Gupta, Y.; Nigam, S.; Avasthi, D.K.; Adelung, R.; Abolhassani, R.; Fiutowski, J.; Joshi, M.; Mishra, Y.K. Solar light assisted degradation of dyes and adsorption of heavy metal ions from water by CuO-ZnO tetrapodal hybrid nanocomposite. Mater. Today Chem. 2020, 17, 100336. [Google Scholar] [CrossRef]
  2. Lv, W.; Zhao, K.; Ma, S.; Kong, L.; Dang, Z.; Chen, J.; Zhang, Y.; Hu, J. Process of removing heavy metal ions and solids suspended in micro-scale intensified by hydrocyclone. J. Clean. Prod. 2020, 263, 121533. [Google Scholar] [CrossRef]
  3. Li, C.Q.; Xu, H.; Gao, J.K.; Du, W.N.; Shang, G.; Li, Q.; Zhang, X.; Lin, R.-B.; Wu, H.; Zhou, W.; et al. Tunable titanium metal-organic frameworks with infinite 1D Ti-O rods for efficient visible-light-driven photocatalytic H2 evolution. J. Mater. Chem. A 2019, 7, 11928–11933. [Google Scholar] [CrossRef]
  4. Kumar, V.; Thakur, R.K.; Kumar, P. Assessment of heavy metals uptake by cauliflower (Brassica oleracea var. botrytis) grown in integrated industrial effluent irrigated soils: A prediction modeling study. Sci. Hortic. 2019, 257, 108682. [Google Scholar] [CrossRef]
  5. Kumar, S.; Prasad, S.; Yadav, K.K.; Shrivastava, M.; Gupta, N.; Nagar, S.; Bach, Q.; Kamyab, H.; Khan, S.A.; Yadav, S.; et al. Hazardous heavy metals contamination of vegetables and food chain: Role of sustainable remediation approaches—A review. Environ. Res. 2019, 179, 108792. [Google Scholar] [CrossRef]
  6. Gao, J.K.; Cong, J.K.; Wu, Y.H.; Sun, L.; Yao, J.M.; Chen, B.L. Bimetallic Hofmann-Type Metal-Organic Framework Nanoparticles for Efficient Electrocatalysis of Oxygen Evolution Reaction. ACS Appl. Energy Mater. 2018, 1, 5140–5144. [Google Scholar] [CrossRef]
  7. Wen, J.; Fang, Y.; Zeng, G.M. Progress and prospect of adsorptive removal of heavy metal ions from aqueous solution using metal-organic frameworks: A review of studies from the last decade. Chemosphere 2018, 201, 627–643. [Google Scholar] [CrossRef]
  8. Zhou, W.; Wu, Y.-P.; Zhao, J.; Dong, W.-W.; Qiao, X.-Q.; Hou, D.-F.; Bu, X.; Li, D.-S. Efficient Gas-Sensing for Formaldehyde with 3D Hierarchical Co3O4 Derived from Co5-Based MOF Microcrystals. Inorg. Chem. 2017, 56, 14111–14117. [Google Scholar] [CrossRef]
  9. Badawi, M.A.; Negm, N.A.; Kana, M.T.H.A.; Hefni, H.H.; Abdel, M.M. Moneem, Adsorption of aluminum and lead from wastewater by chitosan-tannic acid modified biopolymers: Isotherms, kinetics, thermodynamics and process mechanism. Int. J. Biol. Macromol. 2017, 99, 465–476. [Google Scholar] [CrossRef]
  10. Murugesan, A.; Vidhyadevi, T.; Kalaivani, S.S.; Thiruvengadaravi, K.V.; Ravikumar, L.; Anuradha, C.D.; Sivanesan, S. Modelling of lead(II) ion adsorption onto poly(thiourea imine) functionalized chelating resin using response surface methodology (RSM). J. Water Process Eng. 2014, 3, 132–143. [Google Scholar] [CrossRef]
  11. Bilgic, A.; Cimen, A. A highly sensitive and selective ON-OFF fluorescent sensor based on functionalized magnetite nanoparticles for detection of Cr(VI) metal ions in the aqueous medium. J. Mol. Liq. 2020, 312, 113398. [Google Scholar] [CrossRef]
  12. Jiao, Z.; Zhang, P.; Chen, H.; Li, C.; Chen, L.; Fan, H.; Cheng, F. Differentiation of heavy metal ions by fluorescent quantum dot sensor array in complicated samples. Sens. Actuators B Chem. 2019, 295, 110–116. [Google Scholar] [CrossRef]
  13. Mezine, Z.; Kadri, A.; Hamadou, L.; Benbrahim, N.; Chaouchi, A. Electrodeposition of copper oxides (CuxOy) from acetate bath. J. Electroanal. Chem. 2018, 817, 36–47. [Google Scholar] [CrossRef]
  14. Abbasi, P.; McKevitt, B.; Dreisinger, D.B. The kinetics of nickel recovery from ferrous containing solutions using an Iminodiacetic acid ion exchange resin. Hydrometallurgy 2018, 175, 333–339. [Google Scholar] [CrossRef]
  15. Liu, Y.-Q.; Yu, H. Indirect ultraviolet detection of alkaline earth metal ions using an imidazolium ionic liquid as an ultraviolet absorption reagent in ion chromatography. J. Sep. Sci. 2017, 40, 1660–1666. [Google Scholar] [CrossRef]
  16. Prakash, A.; Chandra, S.; Bahadur, D. Structural, magnetic, and textural properties of iron oxide-reduced graphene oxide hybrids and their use for the electrochemical detection of chromium. Carbon 2012, 50, 4209–4219. [Google Scholar] [CrossRef]
  17. Matlock, M.M.; Howerton, B.S.; Atwood, D.A. Chemical precipitation of heavy metals from acid mine drainage. Water Res. 2002, 36, 4757–4764. [Google Scholar] [CrossRef]
  18. Rasheed, T.; Bilal, M.; Nabeel, F.; Iqbal, H.M.N.; Li, C.; Zhou, Y. Fluorescent sensor based models for the detection of environmentally-related toxic heavy metals. Sci. Total Environ. 2018, 615, 476–485. [Google Scholar] [CrossRef]
  19. Firdaus, F.; Farhi, A.; Faraz, M.; Shakir, M. Benzidine based fluorescent probe for the sensitive detection of heavy metal ions via chelation enhanced fluorescence mechanism—A multiplexed sensing platform. J. Luminescence 2018, 199, 475–482. [Google Scholar] [CrossRef]
  20. Sun, T.; Niu, Q.; Li, T.; Guo, Z.; Liu, H. A simple, reversible, colorimetric and water-soluble fluorescent chemosensor for the naked-eye detection of Cu2+ in ~100% aqueous media and application to real samples. Spectrochim. Acta A 2018, 188, 411–417. [Google Scholar] [CrossRef]
  21. Hwang, S.M.; Chae, J.B.; Kim, C. A Phenanthroimidazole-based Fluorescent Turn-Off Chemosensor for the Selective Detection of Cu2+ in Aqueous Media. Bull. Korean Chem. Soc. 2018, 39, 925–930. [Google Scholar] [CrossRef]
  22. Tang, J.L.; Li, C.Y.; Li, Y.F.; Lu, X.; Qi, H.R. A highly sensitive and selective fluorescent probe for trivalent aluminum ion based on rhodamine derivative in living cells. Anal. Chim. Acta 2015, 888, 155–161. [Google Scholar] [CrossRef] [PubMed]
  23. Goswami, S.; Manna, A.; Paul, S.; Maity, A.K.; Saha, P.; Quah, C.K.; Fun, H.K. FRET based ‘red-switch’ for Al3+ over ESIPT based ‘green-switch’ for Zn2+: Dual channel detection with live-cell imaging on a dyad platform. RSC Adv. 2014, 4, 34572–34576. [Google Scholar] [CrossRef]
  24. Zhang, J.F.; Zhou, Y.; Yoon, J.; Kim, J.S. Recent progress in fluorescent and colorimetric chemosensors for detection of precious metal ions (silver, gold and platinum ions). Chem. Soc. Rev. 2011, 40, 3416–3429. [Google Scholar] [CrossRef]
  25. Que, E.L.; Domaille, D.W.; Chang, C.J. Metals in Neurobiology: Probing Their Chemistry and Biology with Molecular Imaging. Chem. Rev. 2008, 108, 1517–1549. [Google Scholar] [CrossRef]
  26. Zhou, J.; Huang, M.; Zhang, Y.; Xu, S.; Li, Z. Novel spiropyran derivative-based colorimetric and fluorescent chemosensor for detecting trivalent metal ions. Optik 2020, 218, 164991. [Google Scholar] [CrossRef]
  27. Merangmenla, A. Puzari, Microwave-induced synthesis of a new benzodiazepinone based chemosensor in chloroform under thermal agitation: A potential fluorescent sensor for multi-signaling detection of metal ions. Inorg. Chim. Acta 2020, 505, 119520. [Google Scholar] [CrossRef]
  28. Deems, J.C.; Reibenspies, J.H.; Lee, H.; Hancock, R.D. Strategies for a fluorescent sensor with receptor and fluorophore designed for the recognition of heavy metal ions. Inorg. Chim. Acta 2020, 499, 119181. [Google Scholar] [CrossRef]
  29. Abebe, F.; Perkins, P.; Shaw, R.; Tadesse, S. A rhodamine-based fluorescent sensor for selective detection of Cu2+ in aqueous media: Synthesis and spectroscopic properties. J. Mol. Struct. 2020, 1205, 127594. [Google Scholar] [CrossRef]
  30. Luo, J.; Liu, B.; Zhang, X.; Liu, R. A novel fluorescent sensor with highly response of Cu2+ based on Eu3+ post-modified metal-organic framework in aqueous media. J. Mol. Struct. 2020, 1202, 127347. [Google Scholar] [CrossRef]
  31. Wang, J.; Jiang, H.; Liu, H.; Liang, L.; Tao, J. Pyrene-imidazole conjugate as a fluorescent sensor for the sequential detection of iron(III) and histidine in aqueous solution. Spectrochim. Acta A 2020, 228, 117725. [Google Scholar] [CrossRef] [PubMed]
  32. Lee, S.C.; Kim, C. A thiourea-naphthol based turn-on fluorescent sensor for detecting In3+ and its application. Inorg. Chem. Commun. 2020, 112, 107752. [Google Scholar] [CrossRef]
  33. Abdolmaleki, S.; Ghadermazi, M.; Bagheri, F.; Rudbari, H.A.; Bruno, G. Evaluation of two novel macrocycles containing pyridine-2,6-dicarboxamide unit as cationic fluorescent sensor. Polyhedron 2020, 176, 114292. [Google Scholar] [CrossRef]
  34. Liu, D.; Zhao, Y.; Shi, J.; Zhu, H.; Zhang, T.; Qi, P.; Chen, J.; Yang, G.; He, H. A highly selective and sensitive 1,8-naphthalimide-based fluorescent sensor for Zn2+ imaging in living cells. Bioorg. Med. Chem. Lett. 2019, 29, 2646–2649. [Google Scholar] [CrossRef] [PubMed]
  35. Guo, Z.; Niu, Q.; Li, T.; Sun, T.; Chi, H. A fast, highly selective and sensitive colorimetric and fluorescent sensor for Cu2+ and its application in real water and food samples. Spectrochim. Acta A 2019, 213, 97–103. [Google Scholar] [CrossRef] [PubMed]
  36. Wang, Z.; Cui, S.; Qiu, S.; Pu, S. A dual-functional fluorescent sensor based on diarylethene for Zn2+ and Al3+ in different solvents. J. Photochem. Photobiol. A 2019, 376, 185–195. [Google Scholar] [CrossRef]
  37. Liu, Y.; Ma, L.; Shi, W.; Lu, Y.; Hou, L.; Wang, Y. Four alkaline earth metal (Mg, Ca, Sr, Ba)-based MOFs as multiresponsive fluorescent sensors for Fe3+, Pb2+ and Cu2+ ions in aqueous solution. J. Solid State Chem. 2019, 277, 636–647. [Google Scholar] [CrossRef]
  38. Feng, S.; Gao, Q.; Gao, X.; Yin, J.; Jiao, Y. Fluorescent sensor for copper(II) ions based on coumarin derivative and its application in cell imaging. Inorg. Chem. Commun. 2019, 102, 51–56. [Google Scholar] [CrossRef]
  39. Liu, D.; Deng, X.; Yin, X.; Wang, Y.; Guo, J.; Chen, J.; Yang, G.; He, H. 1,8-Naphthalimide-based fluorescent sensor with high selectivity and sensitivity for Zn2+ and its imaging in living cells. Inorg. Chem. Commun. 2019, 101, 117–120. [Google Scholar] [CrossRef]
  40. Liu, D.; Yin, X.; Deng, X.; Shi, J.; Zhu, H.; Shang, Z.; Chen, J.; Yang, G.; He, H. 1,8-Naphthalimide-based fluorescent sensor with highly selective and sensitive detection of Zn2+ in aqueous solution and living cells. Inorg. Chem. Commun. 2019, 106, 43–47. [Google Scholar] [CrossRef]
  41. Jiao, Y.; Zhou, L.; He, H.; Yin, J.; Gao, Q.; Wei, J.; Duan, C.; Peng, X. A novel rhodamine B-based “off-on’’ fluorescent sensor for selective recognition of copper (II) ions. Talanta 2018, 184, 143–148. [Google Scholar] [CrossRef] [PubMed]
  42. Wang, Z.; Cui, S.; Qiu, S.; Zhang, Z.; Pu, S. A highly sensitive fluorescent sensor for Zn2+ based on diarylethene with an imidazole unit. Spectrochim. Acta A 2018, 205, 21–28. [Google Scholar] [CrossRef] [PubMed]
  43. Sun, T.; Li, Y.; Niu, Q.; Li, T.; Liu, Y. Highly selective and sensitive determination of Cu2+ in drink and water samples based on a 1,8-diaminonaphthalene derived fluorescent sensor. Spectrochim. Acta A 2018, 195, 142–147. [Google Scholar] [CrossRef] [PubMed]
  44. Fu, Y.; Li, P.; Kang, J.; Liu, X.; Li, G.; Ye, F. A novel 1,8-naphthalimide derivative as an efficient silver(I) fluorescent sensor. J. Lumin. 2016, 178, 156–162. [Google Scholar] [CrossRef]
  45. Liu, D.; Qi, J.; Liu, X.; Cui, Z.; Chang, H.; Chen, J.; Yang, G. 4-Amino-1,8-naphthalimide-based fluorescent Cd2+ sensor with high selectivity against Zn2+ and its imaging in living cells. Sens. Actuators B Chem. 2014, 204, 655–658. [Google Scholar] [CrossRef]
  46. Zhang, Z.; Chen, Y.; Xu, D.; Yang, L.; Liu, A. A new 1,8-naphthalimide-based colorimetric and “turn-on” fluorescent Hg2+ sensor. Spectrochim. Acta A 2013, 105, 8–13. [Google Scholar] [CrossRef]
  47. Tomalia, D.A.; Baker, H.; Dewald, J.; Hall, M.; Kallos, G.; Martin, S.; Roeck, J.; Ryder, J.; Smith, P. A New Class of Polymers: Starburst-Dendritic Macromolecules. Polym. J. 1985, 17, 117–132. [Google Scholar] [CrossRef] [Green Version]
  48. Tomalia, D.A.; Baker, H.; Dewald, J.; Hall, M.; Kallos, G.; Martin, S.; Roeck, J.; Ryder, J.; Smith, P. Dendritic macromolecules: Synthesis of starburst dendrimers. Macromolecules 1986, 19, 2466–2468. [Google Scholar] [CrossRef]
  49. Tomalia, D.A.; Naylor, A.M.; Goddard, W.A. Starburst Dendrimers: Molecular-Level Control of Size, Shape, Surface Chemistry, Topology, and Flexibility from Atoms to Macroscopic Matter. Angew. Chem. Int. Ed. Engl. 1990, 29, 138–175. [Google Scholar] [CrossRef]
  50. Akiyama, H.; Miyashita, K.; Hari, Y.; Obika, S.; Imanishi, T. Synthesis of novel polyesteramine dendrimers by divergent and convergent methods. Tetrahedron 2013, 69, 6810–6820. [Google Scholar] [CrossRef]
  51. De Belder, G.; Jordens, S.; Lor, M.; Schweitzer, G.; De, R.; Weil, T.; Herrmann, A.; Wiesler, U.K.; Müllen, K.; de Schryver, F.C. Femtosecond fluorescence upconversion study of rigid dendrimers containing peryleneimide chromophores at the rim. J. Photochem. Photobiol. A 2001, 145, 61–70. [Google Scholar] [CrossRef]
  52. Weil, T.; Wiesler, U.M.; Herrmann, A.; Bauer, R.; Hofkens, J.; de Schryver, F.C.; Müllen, K. Polyphenylene Dendrimers with Different Fluorescent Chromophores Asymmetrically Distributed at the Periphery. J. Am. Chem. Soc. 2001, 123, 8101–8108. [Google Scholar] [CrossRef] [PubMed] [Green Version]
  53. Gilat, S.L.; Adronov, A.; Fréchet, J.M.J. Modular Approach to the Accelerated Convergent Growth of Laser Dye-Labeled Poly(aryl ether) Dendrimers Using a Novel Hypermonomer. J. Org. Chem. 1999, 64, 7474–7484. [Google Scholar] [CrossRef]
  54. Gilat, S.L.; Adronov, A.; Fréchet, J.M.J. Light Harvesting and Energy Transfer in Novel Convergently Constructed Dendrimers. Angew. Chem. Int. Ed. Engl. 1999, 38, 1422–1427. [Google Scholar] [CrossRef]
  55. Froehling, P.E. Dendrimers and dyes—A review. Dyes Pigm. 2001, 48, 187–195. [Google Scholar] [CrossRef]
  56. Senarath-Yapa, M.D.; Saavedra, S.S. Dye leaching from a doped sol-gel is eliminated by conjugation to a dendrimer. Anal. Chim. Acta 2001, 432, 89–94. [Google Scholar] [CrossRef]
  57. Svenson, S.; Tomalia, D.A. Dendrimers in biomedical applications—Reflections on the field. Adv. Drug. Deliv. Rev. 2012, 64, 102–115. [Google Scholar] [CrossRef]
  58. Duncan, R.; Izzo, L. Dendrimer biocompatibility and toxicity. Adv. Drug Deliv. Rev. 2005, 57, 2215–2237. [Google Scholar] [CrossRef]
  59. Paleos, C.M.; Tsiourvas, D.; Sideratou, Z. Molecular Engineering of Dendritic Polymers and Their Application as Drug and Gene Delivery Systems. Mol. Pharm. 2007, 4, 169–188. [Google Scholar] [CrossRef]
  60. Grabchev, I.; Mokreva, P.; Gancheva, V.; Terlemezyan, L. Synthesis and structural dependence of the functional properties of new green fluorescent poly(propyleneamine) dendrimers. J. Mol. Struct. 2013, 1038, 101–105. [Google Scholar] [CrossRef]
  61. Borodko, Y.; Thompson, C.M.; Huang, W.; Yildiz, H.B.; Frei, H.; Somorjai, G.A. Spectroscopic Study of Platinum and Rhodium Dendrimer (PAMAM G4OH) Compounds: Structure and Stability. J. Phys. Chem. C 2011, 115, 4757–4767. [Google Scholar] [CrossRef]
  62. Cao, J.; Zhang, H.; Wang, Y.; Yang, J.; Jiang, F. Investigation on the interaction behavior between curcumin and PAMAM dendrimer by spectral and docking studies. Spectrochim. Acta A 2013, 108, 251–255. [Google Scholar] [CrossRef] [PubMed]
  63. Domański, D.M.; Klajnert, B.; Bryszewska, M. Incorporation of fluorescent probes into PAMAM dendrimers. Bioelectrochemistry 2004, 63, 193–197. [Google Scholar] [CrossRef] [PubMed]
  64. Thiagarajan, G.; Greish, K.; Ghandehari, H. Charge affects the oral toxicity of poly(amidoamine) dendrimers. Eur. J. Pharm. Biopharm. 2013, 84, 330–334. [Google Scholar] [CrossRef] [PubMed] [Green Version]
  65. Grabchev, I.; Guittonneau, S. Sensors for detecting metal ions and protons based on new green fluorescent poly(amidoamine) dendrimers peripherally modified with 1,8-naphthalimides. J. Photochem. Photobiol. A 2006, 179, 28–34. [Google Scholar] [CrossRef]
  66. Grabchev, I.; Petkov, C.; Bojinov, V. Infrared spectral characterization of poly(amidoamine) dendrimers peripherally modified with 1,8-naphthalimides. Dyes Pigm. 2004, 62, 229–234. [Google Scholar] [CrossRef]
  67. Banaei, M.; Salami-Kalajahi, M. A “Grafting to” Approach to Synthesize Low Cytotoxic Poly(aminoamide)-Dendrimer-grafted Fe3O4 Magnetic Nanoparticles. Adv. Polym. Technol. 2018, 37, 943–948. [Google Scholar] [CrossRef]
  68. Khodadust, R.; Unsoy, G.; Gunduz, U. Development of poly (I:C) modified doxorubicin loaded magnetic dendrimer nanoparticles for targeted combination therapy. Biomed. Pharmacother. 2014, 68, 979–987. [Google Scholar] [CrossRef]
  69. Walter, A.; Garofalo, A.; Parat, A.; Jouhannaud, J.; Pourroy, G.; Voirin, E.; Laurent, S.; Bonazza, P.; Taleb, J.; Billotey, C.; et al. Validation of a dendron concept to tune colloidal stability, MRI relaxivity and bioelimination of functional nanoparticles. J. Mater. Chem. B 2015, 3, 1484–1494. [Google Scholar] [CrossRef]
  70. Yang, X.; Shang, H.; Ding, C.; Li, J. Recent developments and applications of bioinspired dendritic polymers. Polym. Chem. 2015, 6, 668–680. [Google Scholar] [CrossRef]
  71. Astruc, D.; Chardac, F. Dendritic Catalysts and Dendrimers in Catalysis. Chem. Rev. 2001, 101, 2991–3023. [Google Scholar] [CrossRef] [PubMed]
  72. Wang, D.; Astruc, D. Dendritic catalysis—Basic concepts and recent trends. Coord. Chem. Rev. 2013, 257, 2317–2334. [Google Scholar] [CrossRef]
  73. Lakshmi, K.; Rangasamy, R. Synthesis of structurally enhanced magnetite cored poly(propyleneimine) dendrimer nanohybrid material and evaluation of its functionality in sustainable catalysis of condensation reactions. React. Funct. Polym. 2020, 152, 104579. [Google Scholar]
  74. Vunain, B.M.E.; Mishra, A.K. Dendrimers, mesoporous silicas and chitosan-based nanosorbents for the removal of heavy-metal ions: A review. Int. J. Biol. Macromol. 2016, 86, 570–586. [Google Scholar] [CrossRef] [PubMed]
  75. Dong, S.; Ji, W.; Ma, Z.; Zhu, Z.; Ding, N.; Nie, J.; Du, B. Thermosensitive Fluorescent Microgels for Selective and Sensitive Detection of Fe3+ and Mn2+ in Aqueous Solutions. ACS Appl. Polym. Mater 2020, 2, 3621–3631. [Google Scholar] [CrossRef]
  76. Tan, T.H.; Moa, K.H.; Ling, T.; Lai, S.H. Current development of geopolymer as alternative adsorbent for heavy metal removal. Environ. Technol. Innov. 2020, 18, 100684. [Google Scholar] [CrossRef]
  77. Fu, F.; Wang, Q. Removal of heavy metal ions from wastewaters: A review. J. Environ. Manag. 2011, 92, 407–418. [Google Scholar] [CrossRef]
  78. Lee, Y.; Zhang, S.; Yu, K.; Choi, J.; Ahn, W. Poly(amidoamine) dendrimer immobilized on mesoporous silica foam (MSF) and fibrous nano-silica KCC-1 for Gd3+ adsorption in water. Chem. Eng. J. 2019, 378, 122133. [Google Scholar] [CrossRef]
  79. Kim, H.R.; Jang, J.W.; Park, J.W. Carboxymethyl chitosan-modified magnetic-cored dendrimer as an amphoteric adsorbent. J. Hazard. Mater. 2016, 317, 608–616. [Google Scholar] [CrossRef]
  80. Qu, H.; Ma, H.; Zhou, W.; O’Connor, C.J. In situ surface functionalization of magnetic nanoparticles with hydrophilic natural amino acids. Inorg. Chim. Acta 2012, 389, 60–65. [Google Scholar] [CrossRef]
  81. Ghosh, M.; Liu, J.; Chuang, S.S.C.; Jana, S.C. Fabrication of Hierarchical V2O5 Nanorods on TiO2 Nanofibers and Their Enhanced Photocatalytic Activity under Visible Light. ChemCatChem 2018, 10, 3305–3318. [Google Scholar] [CrossRef]
  82. Lakshmi, K.; Rangasamy, R. Synthetic modification of silica coated magnetite cored PAMAM dendrimer to enrich branched Amine groups and peripheral carboxyl groups for environmental remediation. J. Mol. Struct. 2021, 1224, 129081. [Google Scholar] [CrossRef]
  83. Kobielska, P.A.; Howarth, A.J.; Farha, O.K.; Nayak, S. Metal-organic frameworks for heavy metal removal from water. Coord. Chem. Rev. 2018, 358, 92–107. [Google Scholar] [CrossRef]
  84. Grabchev, I.; Qian, X.; Bojinov, V.; Xiao, Y.; Zhang, W. Synthesis and photophysical properties of 1,8-naphthalimide-labelled PAMAM as PET sensors of protons and of transition metal ions. Polymer 2002, 43, 5731–5736. [Google Scholar] [CrossRef]
  85. Grabchev, I.; Bojinov, V.; Chovelon, J.-M. Synthesis, photophysical and photochemical properties of fluorescent poly(amidoamine) dendrimers. Polymer 2003, 44, 4421–4428. [Google Scholar] [CrossRef]
  86. Grabchev, I.; Chovelon, J.-M.; Bojinov, V.; Ivanova, G. Poly(amidoamine) dendrimers peripherally modified with 4-ethylamino-1,8-naphthalimide. Synthesis and photophysical properties. Tetrahedron 2003, 59, 9591–9598. [Google Scholar] [CrossRef]
  87. Varsanyi, G. Assignments for Vibrational Spectra of Seven Hundred Benzene Derivatives; Academic Kiado: Budapest, Hungary, 1973; Volume 1. [Google Scholar]
  88. Silverstein, R.M.; Webster, F.X. Spectrometric Identification of Organic Compounds, 6th ed.; Jon Wiley Sons Inc.: New York, NY, USA, 1963. [Google Scholar]
  89. Sathyanarayana, D.N. Vibrational Spectroscopy—Theory and Applications, 2nd ed.; New Age International (P) Limited Publishers: New Delhi, India, 2004. [Google Scholar]
  90. Socrates, G. Infrared and Raman Characteristic Group Frequencies—Tables and Charts, 3rd ed.; Wiley: New York, NY, USA, 2001. [Google Scholar]
  91. Geary, W.J. The use of conductivity measurements in organic solvents for the characterisation of coordination compounds. Coord. Chem. Rev. 1971, 7, 81–122. [Google Scholar] [CrossRef]
  92. Coats, A.W.; Redfern, J.P. Kinetic parameters from thermogravimetric data. Nature 1964, 201, 68–69. [Google Scholar] [CrossRef]
  93. Horowitz, H.H.; Metzger, G. A New Analysis of Thermogravimetric Traces. Anal. Chem. 1963, 35, 1464–1468. [Google Scholar] [CrossRef]
  94. Frost, A.A.; Pearson, R.G. Kinetics and Mechanism; John Wiley: New York, NY, USA, 1961. [Google Scholar]
  95. El-Gammal, O.A. Mononuclear and binuclear complexes derived from hydrazone Schiff base NON donor ligand: Synthesis, structure, theoretical and biological studies. Inorg. Chim. Acta 2015, 435, 73–81. [Google Scholar] [CrossRef]
Figure 1. Chemical structure of the synthesized fluorescent dendrimer (FCD) molecule.
Crystals 11 00092 g001
Figure 2. Synthetic route to the FCD molecule.
Crystals 11 00092 g002
Figure 3. (a) IR and (b) 1H NMR spectra of the synthesized FCD.
Crystals 11 00092 g003
Figure 4. The FCD molecule’s structure with atom numbers.
Crystals 11 00092 g004
Figure 5. (a) Scanning electron microscopy (SEM) and (b) transmission electron microscopy (TEM) micrographs of the synthesized FCD.
Crystals 11 00092 g005
Figure 6. IR spectra of the synthesized metal complexes.
Crystals 11 00092 g006
Figure 7. 1H NMR spectrum of the Zn2+ complex.
Crystals 11 00092 g007
Figure 8. The proposed structure of the synthesized metal–FCD complexes (M: Zn2+, Cd2+, or Hg2+).
Crystals 11 00092 g008
Figure 9. UV–visible spectra of the synthesized metal complexes.
Crystals 11 00092 g009
Figure 10. Fluorescence emission spectra of the synthesized metal complexes.
Crystals 11 00092 g010
Figure 11. Thermograms of Zn2+ and Hg2+ complexes.
Crystals 11 00092 g011
Figure 12. Thermodynamic graphs of Zn2+ and Hg2+ complexes derived using the CR method.
Crystals 11 00092 g012
Figure 13. Thermodynamic graphs of Zn2+ and Hg2+ complexes derived using the HM method.
Crystals 11 00092 g013
Figure 14. Linear correlation between the entropy and the enthalpy of Zn2+ and Hg2+ complexes.
Crystals 11 00092 g014
Figure 15. SEM and TEM micrographs of the (a) Zn2+ complex, (b) Cd2+ complex, and (c) Hg2+ complex.
Crystals 11 00092 g015aCrystals 11 00092 g015b
Table 1. The thermodynamic constants of Zn2+ and Hg2+ complexes.
ConstantMethodComplexes
Zn2+Hg2+
E (J mol−1)CR1.28 × 1054.67 × 104
HM1.30 × 1055.76 × 104
ΔS (J mol−1 K−1)CR−1.35 × 101−2.20 × 10²
HM4.00 × 10−1−1.97 × 10²
ΔH (J mol−1)CR1.24 × 1054.18 × 104
HM1.27 × 1055.27 × 104
ΔG (Jmol−1)CR1.30 × 1051.71 × 105
HM1.26 × 1051.68 × 105
Correlation coefficient (r)CR0.980980.99646
HM0.977540.98807
Publisher’s Note: MDPI stays neutral with regard to jurisdictional claims in published maps and institutional affiliations.

