Abstract
In this paper we present the synthesis method and a detailed description of the crystal structure, as well as thermal, dielectric and phonon properties, of the [CH3NH2CH2CH2NH2CH3][Zn2(HCOO)6] (dmenH2-Zn) metal organic framework. The negative charge of the anionic framework ([Zn2(HCOO)6]2-) is balanced by N,N′-dimethylethylenediamine (dmenH22+) ions located in the voids of the framework. Thermal analysis revealed that dmenH2-Zn underwent a reversible structural phase transition at around room temperature (Tc~300 K). The single-crystal X-ray diffraction showed that dmenH22+ templates were dynamically disordered at 295 K, since N-H…O bonds were too weak to surmount their thermally activated motions. Reduction in the temperature resulted in ordering of the dmenH22+ cations as a consequence of freezing of their reorientational movements. This behavior caused a symmetry change from P-31c (trigonal) to C 2/c (monoclinic). The mechanism of the observed phase transition of dmenH2-Zn compound was also investigated by temperature-dependent IR measurements. These spectroscopic studies showed that the ordering of the dmenH22+ ions also resulted in the distortion of the anionic framework. Dielectric investigations revealed the occurrence of the dipolar relaxation process clearly defined in the monoclinic phase. The asymmetric shape of the studied process, which indicated a non-Debye-like relaxation, was analyzed using the Havriliak–Negami relaxation function, leading to an Ea value of approximately 0.36 eV.
1. Introduction
The family of dense hybrid metal–organic framework (MOF) materials based on formate ions as ligands has gained interest due to the variety of their achievable structures and promising applications in many areas such as optics and electronics [1,2]. These compounds are characterized by modular structures that can be freely varied using different organic cations as guest molecules and metal ions [3]. In this context, the presence of midsized alkylammonium ions (like dimethylammonium (CH3)2NH2+, ethylammonium CH3CH2NH2+, and formamidinium NH2-CH+-NH2) lead to the formation of MOFs that possess a perovskite topology. Widely studied [(CH3)2NH2][M(HCOO)3] (where M = Mn, Ni, Co, Fe) materials that exhibit dielectric, magnetic, magnetoelectric or even multiferroic properties belong to this group [4,5,6,7,8,9]. Within this class of materials, the occurrence of phase transitions between 160 K and 185 K is associated with the order–disorder of (CH3)2NH2+ cations located in the channel of the anionic framework, while the magnetic properties arise from the presence of metal ions inside the framework skeletons [4,5,6,7,8,9,10,11].
In contrast, usage of small cations such NH4+ lead to MOFs with the formula [NH4][M(HCOO)3] (where M = Mn, Ni, Co, Fe, Mg, Zn), which have a chiral topology [12,13]. This class of materials exhibits an attractive paraelectric-to-ferroelectric transition, along with a structural phase transition accompanied by changes in the crystal structure from a nonpolar hexagonal space group P6322 to the polar hexagonal space group P63 (Tc = 191–255 K) [12,13]. As in the case of MOFs with perovskite-like topology, the ordering of NH4+ ions at low temperatures is observed here as well.
Application of larger alkylammonium cations like CH3NH2CH2CH2NH2CH3 (the double-protonated N,N′-dimethylethylenediamine cation, dmenH22+) leads to the formation of frameworks that have a niccolite architecture. Such materials, however, are still rarely described in the literature [14,15]. In 2011, Gao et al. reported the synthesis of formate MOFs templated by dmenH22+ and divalent metal ions ([dmenH2][M2(HCOO)6] (M = Mn, Fe, Co, Ni, Cu and Zn)) for the first time [14]. In their structures, two nonequivalent octahedrally coordinated M2+ ions are linked by the anti–anti formate ligands. The dmenH22+ templates, which form hydrogen bonds to the anionic framework, can be found inside the cavities. The mentioned compounds are isostructural, and crystallize in the trigonal space group P-31c. The copper formate framework shows lower symmetry and structural difference compared to other materials templated by dmenH22+ ions; that is, it belongs to the space group of C2/c. This behavior arises from the occurrence of the Jahn–Teller effect on the Cu2+ ion [14]. It is worth mentioning that among reported dmenH2-M, only zinc exhibits a structural phase transition. It is suggested that the observed transformation is caused by the ordering of the organic templates at low temperatures, as in other dense formate MOFs. Nevertheless, due to complicated twinning of the crystals at low temperatures, the zinc structure could not be resolved below 300 K [14]. Thus, we decided to obtain high-quality crystals of a dmenH2-Zn compound to better understand the mechanism that is hidden behind the observed transformation. We also extended our research to include the dielectric and temperature-dependent IR measurements. These studies will be reported for the first time.
2. Experimental
2.1. Synthesis
The dmenH2-Zn crystals were obtained by slow evaporation at room temperature of a solution prepared by dissolving 0.5 mmol of ZnCl2 (Sigma Aldrich, St. Louis, MO, USA), 0.3 mmol of N,N′-dimethylethylenediamine (Sigma Aldrich, St. Louis, MO, USA) and 1.5 mmol of HCOOH (Sigma Aldrich, St. Louis, MO, USA) acid in 20 mL of methanol–water solvent (v:v = 5:1). High-quality crystals of dmenH2-Zn grew by the next day, and were harvested from the mother solution, washed with methanol and dried in air. This synthesis method is an adaptation of a previously described form of dmenH2-M materials [14]. The good agreement between the experimental powder XRD and the calculated one based on the single-crystal structure implied the correctness of the found structure in the direct-space method (Figure S1).
2.2. Single-Crystal X-ray Data Collection
X-ray intensity data for the crystals of dmenH2-Zn were collected using graphite monochromatic MoKα radiation on a four-circle κ geometry KUMA KM-4 diffractometer equipped with a two-dimensional area CCD detector at 100(1) and 295(1) K. The ω-scan technique with Δω = 1.0° for each image was applied for data collection. The unit cell parameters were refined by the least squares method based on all measured reflections. One image was selected as a standard after every 40 images to monitor the crystal stability and data collection. No adjustment to the relative changes in intensity was needed. The CrysAlis CCD program was used for data collection [16]. The data collection, integration, scaling of the reflections, and corrections for Lorenz and polarization effects, as well as absorption corrections, were done using the CrysAlis program [16]. The structure was solved by the direct methods using the SHELXT 2014/7 program [17] and refined with the help of the SHELXL-2018/3 program [18]. The hydrogen atoms of the NH2 groups were located in difference Fourier maps and refined for structure at 100(1) K, whereas for the structure at 295(1) K, due to the disorder, they were impossible to locate. The hydrogen atoms bonded to carbon atoms were generated geometrically (C-H 0.96 Å) and refined as a riding model. The final difference Fourier maps were devoid of peaks of chemical significance. Details of the data-collection parameters, together with crystallographic data and the final agreement parameters, are listed in Table 1. Selected geometrical parameters and the hydrogen-bonding geometry are summarized in Table 2 and Table 3. The Diamond 3.0 program was applied to the visualization of the structure [19].

Table 1.
Crystallographic data for dmenH2-Zn.
Table 2.
Selected geometrical parameters (Å, º).
Table 3.
Hydrogen-bond geometry (Å, º).
2.3. Differential Scanning Calorimetry (DSC)
DSC measurements were made with a Mettler Toledo DSC-1 (Zurich, Switzerland) calorimeter with a high resolution of 0.4 μW. The heat-flow thermograms were studied in the 260–420 K temperature range. The dynamic DSC measurement was performed at a constant heating and cooling rate (5 K/min). Nitrogen was used as a purging gas.
2.4. Dielectric Properties
A Novocontrol Alpha (Frankfurt, Germany) impedance analyzer was used for dielectric measurements. The sample was measured as a pellet with a diameter of 5 mm and a thickness of 0.7 mm. All dielectric measurements were performed every 1 K over a temperature range of 150–300 K and a frequency range of 106 Hz–1 Hz.
2.5. Raman and IR Studies
The Raman spectrum at room temperature was collected using a Bruker FT 100/S spectrometer (Karlsruhe, Germany) equipped with Nd:YAG laser excitation (1064 nm). IR spectra in the range of 3200–400 cm−1 and at temperatures of 100–295 K were acquired for the sample in a KBr pellet with a Biorad 575 C FT-IR spectrometer (Hercules, CA, USA) using a helium-flow Oxford cryostat, while IR spectra in the range of 3200–400 cm−1 and at temperatures of 295–400 K were measured for the sample in a KBr pellet using a homemade furnace. The resolution of all experiments was set at 2 cm−1.
3. Results and Discussion
3.1. Structural Studies
Refinement of the structure established that, at room temperature, the double-protonated dmenH22+ cation was disordered and lay on the rotoinversion -3 axis, whereas at low temperatures, the cation was ordered. The molecular structure of dmenH2-Zn at 100(1) and 295(1) K is illustrated in Figure 1a,b, respectively. Selected bond lengths, together with angles for both phases of the dmenH2-Zn, can be found in Table 2. At room temperature, the studied compound was trigonal (P-31c) and the dmenH22+ cation was disordered, whereas at low temperatures, the compound dmenH2-Zn was monoclinic (C2/c), and the organic templates were ordered (Figure 1).
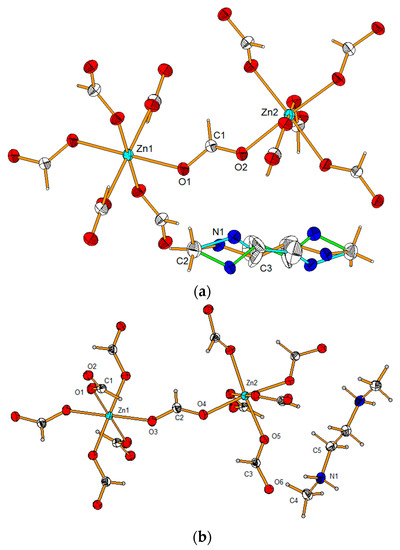
Figure 1.
View of the molecular structure of (a) high-temperature trigonal and (b) low-temperature monoclinic modifications of the dmenH2-Zn compound showing anisotropic displacement parameters at 30% and 50% probability levels for the high- and low-temperature phases, respectively. For the trigonal phase, the orange, green and blue represent the three possible orientations of the dmenH22+ cation.
In both phases, the zinc ion was octahedrally coordinated by HCOO− ions, which connected neighboring coordinating spheres in the anti–anti mode. Such a coordination mode, also found in many similar compounds with formate as the bridge ligand [20,21,22,23], allowed us to obtain the 3D pseudo-perovskite anionic Zn formate framework of {[Zn(HCOO)3]−}n (see Figure 2 and Figure S2).
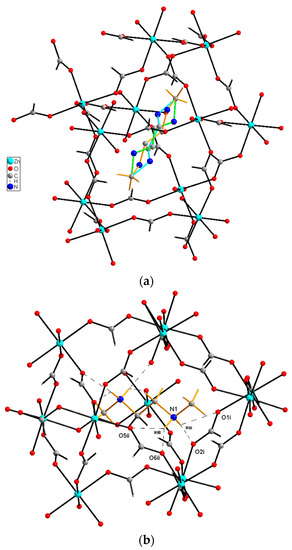
Figure 2.
View of the of dmenH22+ cation inside the void for (a) trigonal and (b) monoclinic phases. The three orientations of the cation for the room temperature phase are marked in blue, green and yellow, while for the low-temperature monoclinic phase, dashed lines illustrate the N—H...O hydrogen bonds. Symmetry codes are as shown in Table 3.
Figure 3a,b present a projection of the crystal structure of the zinc formate framework {[Zn(HCOO)3]−} together with the dmenH22+ templates located in the formed voids of both high- (trigonal) and low-temperature (monoclinic) phases, respectively.
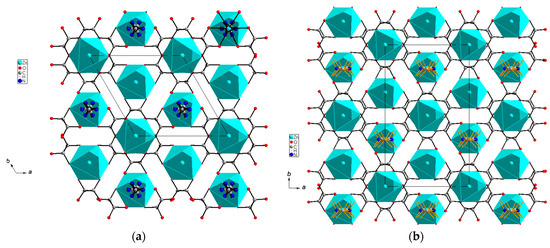
Figure 3.
Projection of the anionic pseudo-perovskite Zn formate framework together with the dmenH22+ templates in the voids in the (a) trigonal and (b) monoclinic modifications viewed along the c axis.
3.2. Thermal Properties
Calorimetric measurement of the dmenH22+ indicated a clear reversible anomaly at 300 K and 306 K upon cooling and heating, respectively (Figure S3). This result corresponded well with previously reported data, when the phase transition was observed at ~304 K [14].
Figure 4 shows the temperature dependences of the measured specific heat, as well as the calculated excess specific heat and entropy. Starting from the low temperatures in the heating cycle, the anomaly associated with the phase transition began at ~280 K, and the maximum transformation occurred at 306 K. The asymmetric shape of the observed ΔCp and the continuous character of the ΔS point of that phase transition was of a second-order character.
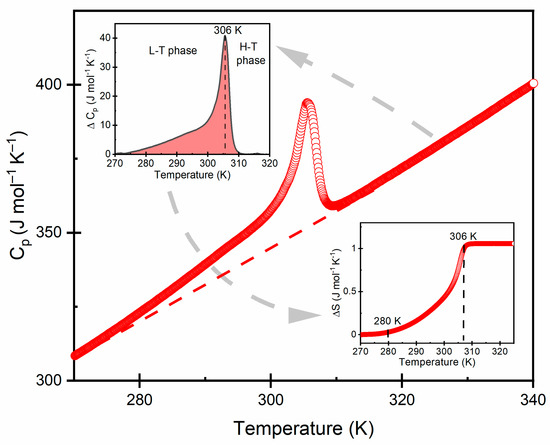
Figure 4.
Heat capacity of dmenH2-Zn for the heating run. The insets show the change in heat capacity and entropy for the phase transition.
X-ray diffraction results indicated that the observed phase transition was a consequence of the structural ordering. The single-crystal X-ray data revealed that dmenH22+ cation occupied three disordered sites at room temperature (N2 = 3) and became ordered at low temperatures (N1 = 1). According to the Boltzmann–Planck equation, the entropy difference can be derived from: =. In the experiment, changes in specific heat and entropy of a measured sample were determined by subtraction of the estimated network heat (baselines). The estimated value of ΔS was ~1.3 (J mol−1 K−1), which was much smaller compared with the value predicted from the structural order changes. The result suggests that the observed phase transition was more complex than predicted by the approximation of the threefold order–disorder model, in which the partial impacts of the vibrational and configurational entropy is difficult to determine [24]. A similar behavior was observed in other formates, e.g., [NH2CHNH2][Mn(HCOO)3] [25], [CH3NH2NH2][M(HCOO)3] [26] and [(CH3)2NH2][FeIIIMgII(HCOO)6] [27].
3.3. Dielectric Properties
The broadband dielectric spectroscopy measurements were performed for a pellet in a 1 Hz–106 Hz frequency range. The temperature dependence of the real and imaginary parts of the complex dielectric permittivity ( is illustrated in Figure 5 for selected frequencies. The real part of dielectric permittivity ε′ exhibited a smeared step-like shape that shifted to higher temperatures for increasing frequencies, whereas the dielectric loss ε″ curves showed a bell shape, which is typical for the dielectric relaxation process. The observed changes of dielectric permittivity ε′ near the phase-transition temperature were subtle (Figure 5, inset). The dipolar relaxation process was clearly seen at the low-temperature phase (170–280 K). To probe the relaxation dynamics of the dmenH2-Zn material, we performed an analysis of the observed process in the monoclinic phase.
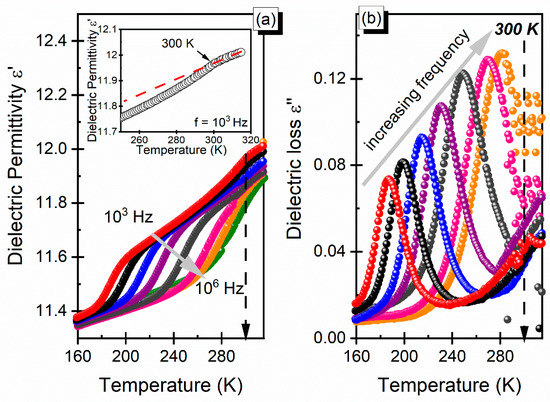
Figure 5.
(a) Dielectric permittivity (the temperature of the phase transition region is presented in the inset for the selected frequency) and (b) dielectric loss as a function of temperature in dmenH2-Zn.
The observed relaxation process that manifested itself in the frequency dependencies of ε′ and ε″ for several temperatures is presented in Figure 6a. To parameterize the relaxation process, the Havriliak–Negami equation with a conductivity term was used. In order to determine the basic parameter, i.e., activation energy, that described the relaxation dynamics of the dipolar process, the dependence of the dielectric relaxation time τ was resolved as a function of the inverse of temperature. For the dmenH2-Zn compound, the dependence exhibited a clear linear Arrhenius behavior, for which (where Ea and τ0 indicate the activation energy and attempt time, respectively, and k is the Boltzmann constant). The linear fit to the experimental data gave an estimated activation energy of Ea = 0.36 eV (Figure 6b). We compared the estimated value of the activation energy to the results for another niccolite with a different organic cation, [NH3(CH2)4NH3][Zn2(HCOO)6] [28,29]. The determined value of the activation energy was lower than the value of 0.50 eV reported for [NH3(CH2)4NH3][Zn2(HCOO)6]. The smaller value of activation energy of dmenH2-Zn suggests that the dmenH22+ cation was less strongly confined by the framework than the [NH3(CH2)4NH3]2+ cation. A convergence of the activation energy value may indicate similar behavior, and led us to the conclusion that the observed relaxation process was caused by the reorientational motion of the organic cation. However, in the investigated compound, the reorientational motion of cation was most likely connected with the translational motion. It was deduced based on facts that the rotational motion disappeared at low temperatures, and this was confirmed by the structural investigations.
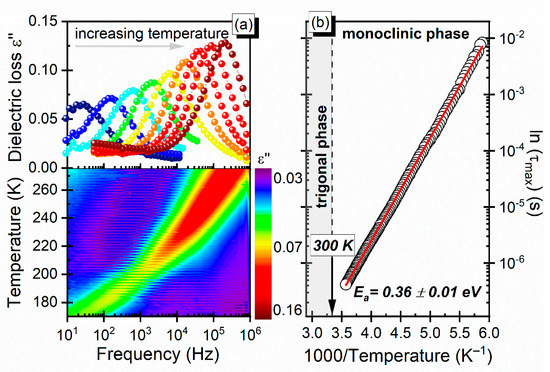
Figure 6.
(a) Frequency dependence of the loss spectra (temperature map in lower panel) and (b) relaxation map with τ as a function of 1000/T.
3.4. Vibrational Properties
3.4.1. Selection Rules
The IR spectra of the studied niccolite may be comprehended by dividing k = O vibrations into internal vibrations of the dmenH22+ and HCOO− ions and lattice vibrational motions. An isolated formate anion possess C2v symmetry, and among its fundamental internal modes, one can distinguish: C-H stretching (ν1), symmetric (ν2) and asymmetric (ν4) C-O stretching, symmetric OCO bending (ν3), C-H in-plane bending (ν5) and C-H out-of-plane bending (ν6) (Table S1) [30]. The isolated dmenH22+ ion had C1 symmetry, and its 54 internal vibrations were divided among 54 A representation, as shown in Table S1. These modes are as follows: (1) symmetric (νs) and antisymmetric stretching (νas), rocking (ρ), wagging (ω), scissoring (δ) and torsion (τ) modes of the CH2/NH2 groups; (2) symmetric (νs(CH3)) and antisymmetric stretching (νas(CH3)), rocking (ρ(CH3)), bending (δ(CH3)) and torsion (τ(CH3)) modes of the CH3 group; and (3) stretching (ν) and bending (δ) modes of the CCN/NCN moieties. The dmenH22+ ion was disordered in the P-31c phase; thus, we show distribution of the vibrational modes of this cation among the irreducible representation only for the low-temperature phase (C2/c) (Table S1). The lattice modes consisted of translational (T’) modes of Zn2+, formate and dmenH22+ ions, as well as librational (L) modes of both organic ions.
3.4.2. Assignment of Modes
Experimental room-temperature IR and Raman spectra of the powdered dmenH2-Zn crystal are illustrated in Figure S4, and wavenumbers of all observed modes, as well as the suggested assignment, are summarized in Table S2. The assignment of bands arising from vibrational motions of the formate and zinc ions was in a good agreement with the literature data for other related MOFs [25,26,27]. Thus, the detailed description will be avoided here. Instead, we will focus on assignment modes coming from vibrational motions of dmenH22+ ions. There are only a few papers that have reported the phonon properties of compounds composed of the mentioned alkylammonium cations in the literature. Therefore, we based our investigation on the DFT calculation made for the isolated CH3NHCH2CH2NHCH3 amine (dmen) [31]. It is worth mentioning that such a theoretical analysis did not consider the possibility of forming hydrogen bonds by the dmen molecule. Thus, the significant shifts in the positions of experimental and calculated modes belonging to the NH2 moieties were expected to be observed. For instance, the DFT calculation predicted that the N-H stretching (νNH2) and N-H bending (δNH2) modes should be located near 3370 cm−1 and 1440–1460 cm−1, respectively [31]. However, we supposed that these modes gave contributions to bands observed at 3030–3095 cm−1 and 1537 cm−1, respectively (Table S2). Our assumption was in agreement with the data obtained for related formates templated by diprotonated 1,4-diaminobutane [28]. It was reported that νNH2 modes gave rise to bands located at 3030–3200 cm−1, whereas δNH2 modes gave rise to bands near 1520 cm−1. The positions of the observed vibrations of the CH2/CH3 groups in the dmenH2-Zn were very similar to the theoretical data for the dmen molecule. This was due to the fact that these groups were not involved in the formation of the hydrogen bond system. For example, the DFT calculations predicted that the τ(CH2) and ω(CH2) modes should be present at 1248–1268 cm−1 and 1342–1362 cm−1, respectively [30], whereas our room-temperature measurements showed that these modes were observed at 1211–1232 cm−1 and 1325–1365 cm−1, respectively.
3.4.3. Temperature-Dependent IR Studies
The IR spectra of the dmenH2-Zn sample recorded as a function of temperature (100–400 K) are presented in Figure 6 and Figure S5. Decreasing the temperature resulted in narrowing and shifting of bands. As a consequence, many bands that were overlapped at high temperature became visible and could be easily resolved. Furthermore, the splitting of the already-present band, as well as the emergence of additional bands, confirmed that the dmenH2-Zn underwent a structural phase transition below room temperature, which is in agreement with structural data. This conclusion is also supported by the wavenumber’s dependence on the temperature of a few selected IR bands (Figure 7 and Figure 8). Below we present the most important observations that accompany our IR measurements.
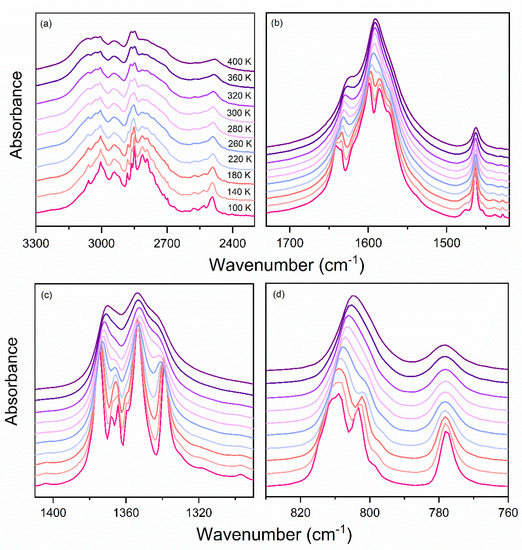
Figure 7.
Details of IR spectra for dmenH2-Zn measured at selected temperatures in a spectral range: (a) 2500–3300 cm−1, (b) 1420–1730 cm−1, (c) 1290–1410 cm−1, (d) 760–830 cm−1.
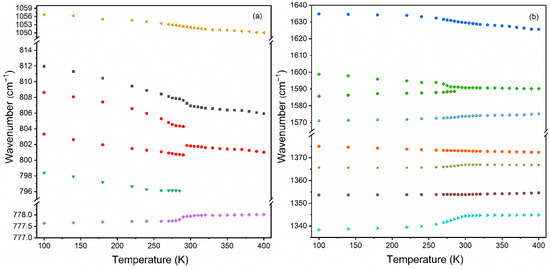
Figure 8.
Temperature evolution of the IR wavenumber of the selected modes observed in the (a) 777–1060 cm−1 and (b) 1335-1640 cm−1 spectral range.
First, when the temperature of the dmenH2-Zn decreased, a few bands exhibited some increase in their intensity; for example, the IR peaks at 777, 1052 and 1462 cm−1 (100K) (Figure 7). However, these changes were not sudden, which confirmed the second-order character of the observed phase transition. Moreover, this also applied to the vibrational motions of the dmenH22+ templates, which proved that the phase transformation was related to changes taking place in the organic cation.
Another important observation regarding the observed cooling was the narrowing of vibrational bands. The largest changes concerned bands at 1318–1368 and 2713–3094 cm−1 (100 K), which were mainly assigned to vibrations of dmenH22+ cations. Such narrowing was clear evidence of the order–disorder nature of the observed phase transition in the studied compound. Furthermore, the narrowing was especially visible in the region of N-H stretching vibrations (around 2850–3000 cm−1), which points to the important impact of the hydrogen-bonding system on the mechanism of this transformation. It is worth noting that upon cooling, the positions of these bands remained practically unchanged. For instance, the peaks located at 400 K at 3029 and 3060 cm−1 shifted toward lower wavenumbers by 6 and 2 cm−1, respectively (Table S2). Likewise, the mentioned bands were only slightly increased in intensity. This proves that the hydrogen bonds strengthened insignificantly in the C2/c structure. This conclusion was confirmed by the crystallographic data.
Third, the presence of the structural transformation in the dmenH2-Zn was also clearly visible in bands around 1591 cm−1 ascribed to the ν4 mode of the formate ligand. As can be seen for the IR spectrum measured at 400 K, upon cooling, a singlet observed at 1591 cm−1 at 400 K transformed into doublet at 1599 + 1587 cm−1 (100 K). These changes indicated that some distortion of the anionic framework accompanied the structural phase transition. The described splitting clearly visible at the temperature evolution of the IR wavenumbers (Figure 8) demonstrated that the transition in the dmenH2-Zn had some characteristics that were unique to first-order phase transitions.
The studied dmenH2-Zn compound underwent a phase transition around 300 K. Since its nature was second-order, the observed changes in the IR spectra that accompanied this transformation were minor. As mentioned above, when the temperature dropped to around 290–300 K, insignificant narrowing and shifting of bands was observed. However, larger changes were visible upon further cooling. For instance, the bands located around 2800–3050 cm−1 attributed to N-H stretching modes exhibited a significant narrowing below 140 K. X-ray diffraction measurements were performed at temperatures of 300 K and 100 K. According to those measurements, the dmenH22+ cations were disordered in the trigonal (high-temperature) phase (300 K) and became ordered in the monoclinic (low-temperature) phase (100 K). The minor changes observed in the IR spectra at the temperature close to Tc and larger ones visible upon further cooling suggested that the phase transition was accompanied by a partial ordering of the dmenH22+ cations, whereas their complete freezing occurred at the lowest temperature. Similar behavior was observed in manganese formate template by formamidinium cations (FMD+), [NH2-CH-NH2][Mn(HCOO)3] [2]. Here, the amine cations were only partially ordered near the structural transformation, while their complete freezing took place below 100 K. Structural studies have shown that at around 300 K, 20% of the FMD+ templates were still disordered and took up three positions, one with 80% probability and two equivalent positions with 10% probability [25]. Further reduction in the temperature led to a complete ordering of the FMD+ cations, and as a consequence, the mentioned templates occupied only one position below 100 K. It is suggested that such behavior was connected to significant thermally activated motions of FMD+, which cannot be stopped by forming hydrogen bonds, even below the temperature of the structural phase transition [25].
4. Conclusions
In this paper, we reported the structural, dielectric, thermal and phonon properties of the niccolite zinc–metal formate dmenH2-Zn containing double-protonated N,N′-dimethylethylenediamine cations as templates. This compound was first reported by Gao in 2011. It was shown that dmenH2-Zn underwent a structural phase transition around 300 K [14]. However, the authors were unable to resolve the structure of the low-temperature phase, so the mechanism of the observed transformation in the studied compound remained unexplored. Our research group decided to obtain this material again and investigate its properties. Our structural studies showed that upon cooling, dmenH2-Zn underwent an order–disorder phase transition from trigonal P-31c to monoclinic C2/c. This conclusion was in agreement with our temperature-dependent IR measurements. Dielectric investigations showed that the occurrence of the dipolar relaxation process was clearly defined in the monoclinic phase. The asymmetric shape of the studied process, which indicated a non-Debye-like relaxation, was analyzed using the Havriliak–Negami relaxation function, leading to an Ea value of approximately 0.36 eV.
Supplementary Materials
The following are available online at https://www.mdpi.com/2073-4352/11/2/213/s1, Figure S1: Powder XRD patterns for the as-prepared bulk sample of dmenH2-Zn with the calculated one based on the single crystal structures at 300 K; Figure S2: Projection of the anionic pseudo-perovskite Zn-formate framework together with the dmenH22+ counter-ions in the cavities in the RT trigonal (a) and LT monoclinic (b) modifications viewed along the b and c axis; Figure S3: DSC data for dmenH2-Zn between 260K and 420K for cooling and heating run; Figure S4: The polycrystalline IR and Raman spectra of the studied dmenH2-Zn compound; Figure S5: The temperature-dependent IR spectra of the dmenH2-Zn; Table S1: Factor group analysis for dmenH2-Zn. The number of nonequivalent HCOO- ions is six and divalent zinc ions (Zn2+) is two, therefore, the total number of vibrational modes for formate ion is six time larger and for metal ions two times larger than presented by the correlation diagram; Table S2: The assignment of the bands (in cm−1) of dmenH2-Zn.
Author Contributions
A.C.-L.: conceptualization, investigation, writing—original draft preparation, review and editing, supervision; J.J.: visualization, investigation, writing—original draft preparation; P.P.: visualization, investigation, writing—original draft preparation; A.S.: visualization, investigation, writing—original draft preparation. All authors have read and agreed to the published version of the manuscript.
Funding
This research received no external funding.
Data Availability Statement
Data is contained within the article or supplementary material.
Conflicts of Interest
The authors declare no conflict of interest.
References
- Nagabhushana, G.P.; Shivaramaiah, R.; Navrotsky, A. Thermochemistry of Multiferroic Organic–Inorganic Hybrid Perovskites [(CH3)2NH2] [M(HCOO)3] (M = Mn, Co, Ni, and Zn). J. Am. Chem. Soc. 2015, 137, 10351–10356. [Google Scholar] [CrossRef] [PubMed]
- Sanchez, C.; Julian, B.; Belleville, P.; Popall, M. Applications of hybrid organic–inorganic nanocomposites. J. Mater. Chem. 2005, 15, 3559–3592. [Google Scholar] [CrossRef]
- Wang, Z.; Hu, K.; Gao, S.; Kobayashi, H. Formate—Based Magnetic Metal—Organic Frameworks Templated by Protonated Amines. Adv. Mater. 2010, 22, 1526–1533. [Google Scholar] [CrossRef]
- Jain, P.; Ramachandran, V.; Clark, R.J.; Zhou, H.D.; Toby, B.H.; Dalal, N.S.; Kroto, H.W.; Cheetham, A.K. Multiferroic behavior associated with an order-disorder hydrogen bonding transition in metal-organic frameworks (MOFs) with the perovskite ABX3 architecture. J. Am. Chem. Soc. 2009, 131, 13625–13627. [Google Scholar] [CrossRef]
- Guo, M.; Cai, H.L.; Xiong, R.G. Ferroelectric metal organic framework (MOF). Inorg. Chem. Commun. 2010, 13, 1590–1598. [Google Scholar] [CrossRef]
- Fu, D.W.; Zhang, W.; Cai, H.L.; Zhang, Y.; Ge, J.Z.; Xiong, R.G.; Huang, S.D.; Nakamura, T. A Multiferroic Perdeutero Metal–Organic Framework. Angew. Chem. Int. Ed. 2011, 50, 11947–11951. [Google Scholar] [CrossRef] [PubMed]
- Stroppa, A.; Barone, P.; Jain, P.; Perez-Mato, J.M.; Picozzi, S. Hybrid Improper Ferroelectricity in a Multiferroic and Magnetoelectric Metal–Organic Framework. Adv. Mater. 2013, 25, 2284–2290. [Google Scholar] [CrossRef]
- Wang, W.; Yan, L.-Q.; Cong, J.-Z.; Zhao, Y.-L.; Wang, F.; Shen, S.-P.; Zhou, T.; Zhang, D.; Wang, S.-G.; Han, X.-F.; et al. Magnetoelectric coupling in the paramagnetic state of a metal-organic framework. Sci. Rep. 2013, 3, 2024. [Google Scholar] [CrossRef]
- Mączka, M.; Gągor, A.; Macalik, B.; Pikul, A.; Ptak, M.; Hanuza, J. Order–Disorder Transition and Weak Ferromagnetism in the Perovskite Metal Formate Frameworks of [(CH3)2NH2][M(HCOO)3] and [(CH3)2ND2][M(HCOO)3] (M = Ni, Mn). Inorg. Chem. 2014, 53, 457–467. [Google Scholar] [CrossRef]
- Šimėnas, M.; Balčiūnas, S.; Ciupa, A.; Vilčiauskas, L.; Jablonskas, D.; Kinka, M.; Sieradzki, A.; Samulionis, V.; Mączka, M.; Banys, J. Elucidation of dipolar dynamics and the nature of structural phases in the [(CH3)2NH2][Zn(HCOO)3] hybrid perovskite framework. J. Mater. Chem. C 2019, 7, 6779–6785. [Google Scholar] [CrossRef]
- Peksa, P.; Trzmiel, J.; Fedoruk, K.; Gągor, A.; Šimėnas, M.; Ciupa, A.; Pawlus, S.; Banys, J.; Mączka, M.; Sieradzki, A. Impact of the Copper-Induced Local Framework Deformation on the Mechanism of Structural Phase Transition in [(CH3)2NH2][Zn(HCOO)3] Hybrid Metal—Formate Perovskite. J. Phys. Chem. C 2019, 123, 23594–23603. [Google Scholar] [CrossRef]
- Xu, G.-C.; Zhang, W.; Ma, Z.-M.; Chen, Y.-H.; Zhang, L.; Cai, H.-L.; Wang, Z.-M.; Xiong, R.-G.; Gao, S. Coexistence of Magnetic and Electric Orderings in the Metal–Formate Frameworks of [NH4][M(HCOO)3]. J. Am. Chem. Soc. 2011, 133, 14948–14951. [Google Scholar] [CrossRef] [PubMed]
- Shang, R.; Xu, G.-C.; Wang, Z.-M.; Gao, S. Phase Transitions, Prominent Dielectric Anomalies, and Negative Thermal Expansion in Three High Thermally Stable Ammonium Magnesium–Formate Frameworks. Chem. Eur. J. 2014, 20, 1146–1158. [Google Scholar] [CrossRef]
- Li, M.-Y.; Kurmoo, M.; Wang, Z.-M.; Gao, S. Metal—Organic Niccolite: Synthesis, Structures, Phase Transition, and Magnetic Properties of [CH3NH2(CH2)2NH2CH3][M2(HCOO)6] (M=divalent Mn, Fe, Co, Ni, Cu and Zn). Chem. Asian J. 2011, 6, 3084–3096. [Google Scholar] [CrossRef] [PubMed]
- Wang, Z.; Zhang, X.; Batten, S.R.; Kurmoo, M.; Gao, S. [CH3NH2(CH2)2NH2CH3][M2(HCOO)6] (M = MnII and CoII): Weak Ferromagnetic Metal Formate Frameworks of Unique Binodal 6-Connected (412·63)(49·66) Topology, Templated by a Diammonium Cation. Inorg. Chem. 2007, 46, 8439–8441. [Google Scholar] [CrossRef] [PubMed]
- CrysAlis CCD and CrysAlis Red, Version 1.171.38.41; Rigaku Oxford Diffraction: Oxford, UK, 2015.
- Sheldrick, G.M. SHELXS97, Programs for Crystal Structures Solution and Refinement; University of Göttingen: Göttingen, Germany, 1997. [Google Scholar]
- Sheldrick, G.M. Crystal structure refinement with SHELXL. Acta Cryst. 2015, C71, 3–8. [Google Scholar]
- Brandenburg, K.; Putz, H. DIAMOND Version 3.0; Crystal Impact GbR: Bonn, Germany, 2006. [Google Scholar]
- Wang, Z.-M.; Zhang, B.; Fujiwara, H.; Kobayashi, H.; Kurmoo, M. Mn3(HCOO)6: A 3D porous magnet of diamond framework with nodes of Mn-centered MnMn4 tetrahedron and guest-modulated ordering temperature. Chem. Commun. 2004, 416–417. [Google Scholar] [CrossRef]
- Cornia, A.; Caneschi, A.; Dapporto, P.; Faberetti, A.C.; Gatteschi, D.; Malevasi, W.; Sangregorio, C.; Sessoli, R. Manganese(III) Formate: A Three—Dimensional Framework That Traps Carbon Dioxide Molecules. Angew. Chem. Int. Ed. 1999, 38, 1780–1781. [Google Scholar] [CrossRef]
- Rettig, S.J.; Thompson, R.C.; Trotter, J.; Xia, S.-H. Crystal Structure and Magnetic Properties of Polybis(formamide)bis(μ-formato)cobalt(II): An Extended Two-Dimensional Square Lattice Material Which Exhibits Spontaneous Magnetization below 9 K. Inorg. Chem. 1999, 38, 1360–1363. [Google Scholar] [CrossRef]
- Kubo, H.; Zenmyo, K.; Matsumura, M.; Takeda, K.; Alhara, K.; Yamagata, K. Study of Spin Configuration in Mn Formate Di-Urea by Proton NMR. J. Phys. Soc. Jpn. 1999, 68, 253–257. [Google Scholar] [CrossRef]
- Butler, K.T.; Walsh, A.; Cheetham, A.K.; Kieslich, G. Organised chaos: Entropy in hybrid inorganic–organic systems and other materials. Chem. Sci. 2016, 7, 6316–6324. [Google Scholar] [CrossRef] [PubMed]
- Mączka, M.; Ciupa, A.; Gągor, A.; Sieradzki, A.; Pikul, A.; Macalik, B.; Drozd, M. Perovskite Metal Formate Framework of [NH2-CH+-NH2]Mn(HCOO)3]: Phase Transition, Magnetic, Dielectric, and Phonon Properties. Inorg. Chem. 2014, 53, 5260–5268. [Google Scholar] [CrossRef]
- Mączka, M.; Gągor, A.; Ptak, M.; Paraguassu, W.; da Silva, T.A.; Sieradzki, A.; Pikul, A. Phase Transitions and Coexistence of Magnetic and Electric Orders in the Methylhydrazinium Metal Formate Frameworks. Chem. Mater. 2017, 29, 2264–2275. [Google Scholar] [CrossRef]
- Ciupa, A.; Mączka, M.; Gągor, A.; Sieradzki, A.; Trzmiel, J.; Pikul, A.; Ptak, M. Temperature-dependent studies of [(CH3)2NH2][FeIIIMII(HCOO)6] frameworks (MII = Fe and Mg): Structural, magnetic, dielectric and phonon properties. Dalton Trans. 2015, 44, 8846–8854. [Google Scholar] [CrossRef]
- Mączka, M.; Ptak, M.; Pawlus, S.; Paraguassu, W.; Sieradzki, A.; Belciunas, S.; Simenas, M.; Banys, J. Temperature- and pressure-dependent studies of niccolite-type formate frameworks of [NH3(CH2)4NH3][M2(HCOO)6] (M = Zn, Co, Fe). Phys. Chem. Chem. Phys. 2016, 18, 27613–27622. [Google Scholar] [CrossRef] [PubMed]
- Szeremeta, A.Z.; Nowok, A.; Sieradzki, A.; Simenas, M.; Vilciauskas, L.; Gągor, A.; Mączka, M.; Paluch, M.; Pawlus, S. Relaxing under pressure with a rigid niccolite formate framework. J. Mater. Chem. C 2020, 8, 16736–16741. [Google Scholar] [CrossRef]
- Mączka, M.; Hanuza, J.; Kamińskii, A.A. Polarized IR, spontaneous and stimulated Raman spectra of Y(HCOO)3·2H2O single crystal—a new Raman laser material. J. Raman Spectrosc. 2006, 37, 1257–1264. [Google Scholar] [CrossRef]
- Boesch, S.E.; York, S.S.; Frech, R.; Wheeler, R.A. An experimental and computational investigation of the structure and vibrations of dimethylethylenediamine, a model for poly(ethylenimine). Phys. Chem. Comm. 2001, 4, 1–10. [Google Scholar] [CrossRef]


Publisher’s Note: MDPI stays neutral with regard to jurisdictional claims in published maps and institutional affiliations. |
© 2021 by the authors. Licensee MDPI, Basel, Switzerland. This article is an open access article distributed under the terms and conditions of the Creative Commons Attribution (CC BY) license (http://creativecommons.org/licenses/by/4.0/).