Abstract
In a study designed to investigate the melting behaviour of natural gas hydrates which are usually formed in porous mineral sediments rather than in bulk, hydrate phase equilibria for binary methane and water mixtures were studied using high-pressure differential scanning calorimetry in mesoporous and macroporous silica particles having controlled pore sizes ranging from 8.5 nm to 195.7 nm. A dynamic oscillating temperature method was used to form methane hydrates reproducibly and then determine their decomposition behaviour—melting points and enthalpies of melting. Significant decreases in dissociation temperature were observed as the pore size decreased (over 6 K for 8.5 nm pores). This behaviour is consistent with the Gibbs–Thomson equation, which was used to determine hydrate–water interfacial energies. The melting data up to 50 MPa indicated a strong, essentially logarithmic, dependence on pressure, which here has been ascribed to the pressure dependence of the interfacial energy in the confined media. An empirical modification of the Gibbs–Thomson equation is proposed to include this effect.
1. Introduction
Methane hydrates are one example of a class of crystalline substances called ‘clathrates’ [1], where host molecules are trapped inside hydrogen-bonded solvent cages—in this case a gas hydrate where methane gas molecules are trapped inside hydrogen-bonded water cages of various geometries. Natural gas hydrates occur in nature and contain more methane, the cleanest burning fossil fuel, than all the conventional oil and gas reservoirs put together [2,3]. Understanding their phase behaviour is therefore fundamental to devising safe and cost-effective processes for extracting gas from them. Methane hydrates are distributed on the continental shelf and also found in permafrost regions [1], usually distributed in porous soft sand-clay sediments. These ‘hydrate crystal’ deposits are an increasingly favoured target for future energy production [4,5,6,7]. However, most thermodynamic studies of gas hydrates have been carried out on bulk hydrates rather than under confined conditions.
In porous media, capillary forces arising from surface tension can change the equilibrium pressure of naturally occurring methane hydrates, which will in turn affect not only the conditions required to extract the gas but also the interpretation measurements seeking to locate the hydrates in the subsurface, such as the bottom simulating reflector (BSR) data [8,9] obtained from seismic surveys.
Due to the critical importance of hydrate properties in confinements to the prediction of gas production potential in natural gas deposits, an increasing number of studies have been conducted in recent decades by using porous media, such as artificial silica sands [10,11,12], fine natural sands [13], and controlled-pore Vycor glass, to simulate situations in reservoirs. Handa and Stupin [14] were the first to use laboratory prepared porous silica to study changes in hydrate equilibrium conditions caused by confinement. Since then, different techniques (e.g., PVT Measurement [14,15,16,17,18] and Differential Thermal Analysis [19]) have been employed in measuring the equilibrium conditions of methane hydrates in porous Vycor glass. The experimental conditions studied are summarized in Table 1.

Table 1.
Literature experimental parameters of confined methane hydrates in porous Vycor glass.
Although considerable experimental data were collected, the variation of thermodynamic properties of confined methane hydrates were restricted to fairly low pressures, up to 14 MPa. In the present work, we report the equilibrium behaviour for confined methane hydrates over a much wider pressure range in both mesoporous and macro-porous media. Improved experimental procedures are introduced which enable enthalpies of fusion for hydrates to be determined with greater precision than previously reported measurements. Based on these experimental data, a modified Gibbs–Thomson equation is developed with a new parameter presenting the pressure effect. An empirical equation which combines confined melting points with pressures and pore sizes is also proposed, enabling a simple calculation of the dissociation temperatures of confined methane hydrate without its bulk properties being known.
2. Materials and Methods
2.1. Materials
CP grade methane was supplied by BOC with a minimum mole fraction of 0.995. Industrial grade nitrogen provided by BOC was used as a purging gas. Ultrapure Millipore water with an electrical resistivity higher than 18 MΩ cm at 298 K was deionized by using a Millipore Q system. Six silica-based Controlled Pore Glass (CPG, also known as Vycor Glass [22], Sigma-Aldrich) with different pore diameters were used in this study.
2.2. Characterisation
The pore morphology of CPG samples was acquired with a Gemini 1525 FEGSEM scanning electron microscope (SEM) instrument with a field emission gun. A bi-continuous solid–void structure was observed, which was consistent with previous studies [22] (see Figure 1). All the Vycor Glass samples shared a similar pore morphology.
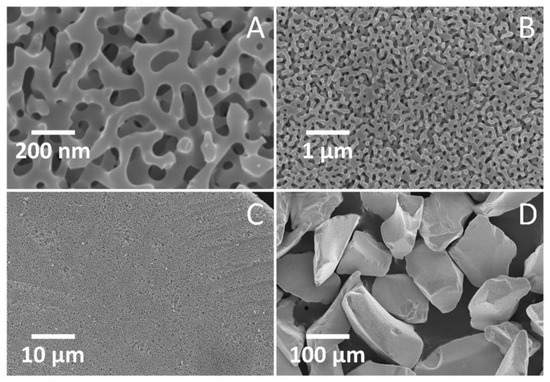
Figure 1.
SEM images of Vycor 196 samples (A) 100,000X (B) 25,000X (C) 5,000X (D) 500X; (A,B) illustrate the micro-porosity and (C,D) for the macro-porosity.
The pore size distribution was determined with Mercury Intrusion Porosimetry (MIP) injection profiles over a pressure range of 0.0005MPa to 227.49MPa, which were recorded using an AutoPore IV 9500 (Micromeritics Instrument Corporation, Norcross, GA, USA). A non-wetting contact angle of 130° and non-wetting (mercury) interfacial tension of 484 mJ/m2 were assumed to convert the measured intrusion pressures into pore diameters for the different samples. Both mesopore and macro-pore (inter particle voids) intrusion was observed. Nearly typical H1 type hysteresis loop [23] was observed for the six Vycor samples. The mean pore size of each sample was calculated by fitting the data to Gaussian peaks using Origin 9.0 software. Figure 2 shows the pore size distributions of the various Vycor materials.
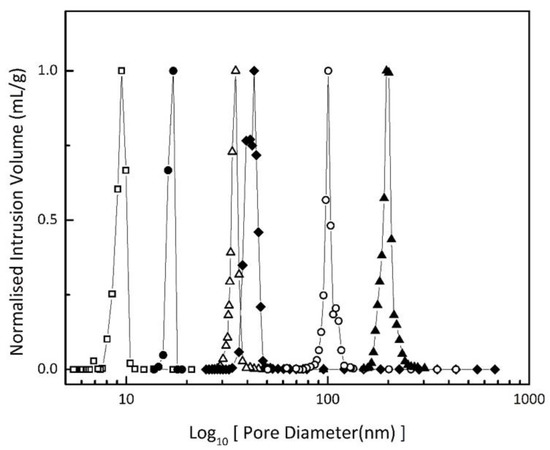
Figure 2.
Intrusion volume versus calculated pore size of Controlled Pore Glass (CPG) samples; ☐, Vycor 8; ●, Vycor 17; △, Vycor 35; ◆, Vycor 40; ◯, Vycor 95; ▲, Vycor 196.
The surface area was measured by nitrogen adsorption at 77 K with a Micromeritics Tristar 3000 device (Micromeritics, Norcross, GA, USA) from BET analysis and pore dimensions from BJH analysis [24]. Values of pore volume, calculated pore diameter, internal (pore) surface area, and particle size are summarized in Table 2.
Table 2.
Physical properties of Controlled Pore Glass (CPG) samples.
2.3. DSC Measurement
A micro differential scanning calorimeter (µDSC Evo VII, Setaram, Caluire-et-Cuire, France; HP-DSC) was used in this work to study hydrate melting behaviours. Two Hastelloy cells were sealed by Nitrile rubber or Hydrogenated Nitrile rubber (Polymax Ltd., Bordon GU35 0FJ, UK) and PTFE supporting O-rings. These cells, the sample cell and the reference cell, were enclosed in a two-stage Peltier thermal element controlled furnace. The temperature was recorded by 12 evenly distributed thermocouples around the sample cell and the reference cell. The heat flux resolution was 0.02 µW. A thermostat (F-33 EH, Julabo GmbH, Seelbach, Germany) filled with deionized water at 285 K removed excess heat from the furnace. Industrial grade nitrogen (Oxygen-free, BOC Ltd., Guildford GU2 7XY, UK) was used as a purging gas to prevent condensation around the furnace. A high-pressure panel (HP 50-1000 Top-Industries, Vaux le Penil, France) was used to deliver a pressure up to 100 MPa in either a constant pressure or constant volume mode. A pressure transducer with a full-scale range of 100 MPa (33X, Keller, Dorchester DT1 1AH, UK) recorded the cell system pressure via an RS485 cable. The voltage output of the pressure transducer was displayed by a readout unit (EV-06, Keller, Dorchester DT1 1AH, UK), and the digital output (RS485) was interfaced by a USB converter (K-114A, Keller, Dorchester DT1 1AH, UK). All process variables, including the temperature, heat flux and pressure were recorded using a Calisto software package (Setaram, Caluire-et-Cuire, France). The high-pressure DSC apparatus is schematically shown in Figure 3.
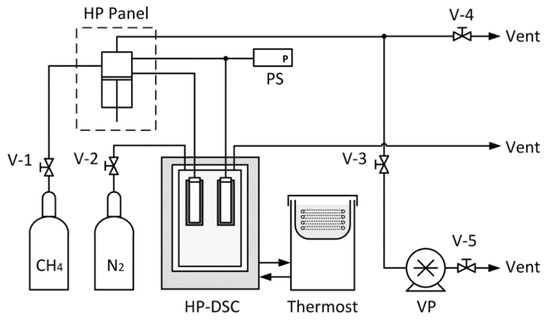
Figure 3.
Schematic diagram of the high-pressure DSC apparatus; V-1, V-2, V-3, V-4 and V-5: manual valves; HP Panel: high-pressure pump panel; PS: pressure sensor; HP-DSC: high-pressure DSC; VP: vacuum pump.
2.3.1. Calibration
The calibration of the µDSC was made using ultrapure deionized water from Millipore, certificated naphthalene, and mercury. In a typical calibration experiment for ice and mercury, a 20 mg to 50 mg sample was placed in the sample cell, and the mass was measured by an analytical balance with 0.01 mg resolution (PR5003, Mettler Toledo Ltd., LE4 1AW, UK). The furnace temperature was ramped down to 237 K and kept at 237 K for 30 min to provide sufficient time for the nucleation of ice or mercury. The isothermal holding period was followed by a slow heating ramp from 237 K to 293 K with a heating rate of 0.2 K/min. For naphthalene, 4.02 mg of certificated sample was sealed into a stainless-steel plug while a reference plug with the same weight was empty. During the naphthalene calibration, the sample and reference plugs were placed into the sample cell and reference cell, respectively. The furnace temperature was ramped from 295 K to 373 K at a scanning rate of 0.2 K/min, followed by a cooling step from 373 K to 295 K with the same ramp rate.
The onset temperature, which is taken to be the intersection of the heat flux baseline and the slope of the endothermic/exothermic peak, was regarded as the melting point of the sample. The uncertainty of the melting point measurement was estimated to be ± 0.08 K. The pressure transducer was calibrated with a high-pressure pneumatic calibrator (PPCH-G, Fluke, Everett, WA, USA) over the full pressure range of 100 MPa. The accuracy of the RS485 pressure reading was estimated to be ± 30 kPa.
2.3.2. Formation of Methane Hydrates in Porous Media
In a typical experiment, 50 mg silica and 20 to 57 mg water were loaded into the sample cell. The pore volume, which was measured as above by MIP, determined the amount of water loading required. 110% micropore-filling ratio was used for all mesoporous and macro-porous silica samples. The system was subsequently sealed and evacuated by a vacuum pump under 0.8 kPa (BOC Edward, KNF-057500) for 30 min. The vacuum step not only removed air from the system but also facilitated water entering the pores. Methane was subsequently introduced into the system and pressurized by the high-pressure panel to an elevated pressure. In a static system such as this µDSC, the formation rate of methane hydrates was very slow. This limitation results in hydrate formation along with ice. Hence, a temperature oscillation method was applied to accelerate the formation of methane hydrates [25]. The system temperature was set to oscillate between a low-temperature set point (i.e., 243 K) and a high-temperature set point (i.e., 280 K). The high set point is above the ice point but below the equilibrium temperature of gas hydrates. Thus, with a further oscillating cycle, an increasing fraction of water with memory effect would be converted from ice into hydrates.
In each experiment, the furnace temperature was firstly slowly cooled down to 243 K from room temperature with a ramping rate of 1 K/min and followed by 10 to 30 cycles between 243 K to 280 K with a cooling/heating rate of 3 K/min. The final stage was a dynamic heating step from 243 K to 303 K at a rate of 0.2 K/min, designed to melt the now substantially 100% hydrate phase. Figure 4 illustrates the heating cycle method.
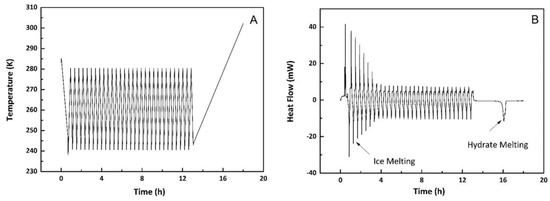
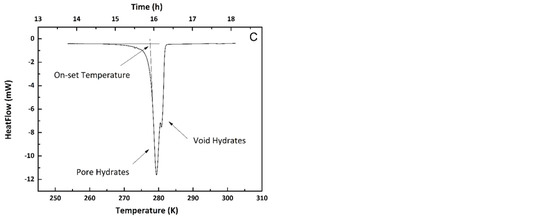
Figure 4.
(A) Temperature profile during DSC experiment; (B) Heat flow during DSC experiment, and (C) Endothermic melting peak of hydrates (expansion of hydrate melting section in plot (B)).
A slow initial cooling step was found to promote the conversion of more water into hydrates at the first step. The repeated annealing process between 243 K and 280 K converted a small amount of water into hydrates in each cycle while hydrates remained (meta) stable during the whole process. During the final heating step, the hydrates formed inside the pores and in the voids between particles (macro-pores) were melted and the heat flow during this process is shown in Figure 4C. The onset temperature of the endothermic peak was regarded as the melting point of the methane hydrates in the confined geometry.
3. Results and Discussion
3.1. Experimental Conditions
3.1.1. Impact of Particle Size
In the current setup, silica particles were randomly packed in the reactor. Hydrate formation occurred at two different locations. Pore hydrates were formed inside the porous structure of silica particles, and void hydrates were formed in the void spaces between silica particles. Two types of hydrates were identified in the integrated heat flow peak during the decomposition process (see Figure 5). In order to measure the phase behaviour in confined geometries, accurately controlling the formation of methane hydrates between the void spaces of different particles played a significant role in the experiment. In theory, for a packed bed of particles, the inter-particle space ranged from an infinitely small pore to essentially bulk. Therefore, the effects of the particle size along with the hydrates formed in the voids between particles was crucial to the accurate measurement of the phase behaviour of methane hydrates in the porous media.
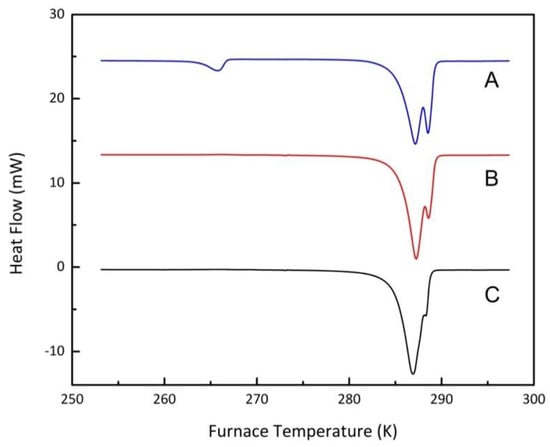
Figure 5.
Effect of particle size on DSC melting peak shape with different particle sizes; (A), 106–120 µm; (B), 53–75 µm; C, 38–53µm.
Vycor 8 was used to investigate the particle size effect. The original particles were crushed and sieved by a series of stainless-steel sieves (IMPACT Laboratory Test Sieve, UK). The particles were sieved into five different ranges, which are 38–53 μm, 53–75 μm, 75–90 μm, 90–106 μm, and 106–120 µm respectively. The experimental procedure followed the protocol described in the previous section, working at a pressure of 20 MPa. Figure 5 shows the decomposition of methane hydrates in Vycor 8 samples with different particle sizes. Each experiment was repeated at least twice to check reproducibility.
As shown in Figure 5, the particle size did not affect the onset temperature of methane hydrates in porous media but altered the relative amount of methane hydrates formed in micropores and in macro-porous void spaces between particles. For smaller particle sizes, more hydrates were present in the pores than the void spaces. At the beginning of each experiment, capillary pressure and the initial vacuum conditions facilitated water entering the micropores. In the static (unstirred) experimental conditions, the surfaces of small particles with their larger surface area per unit volume were more accessible for the water. In the tested particle size range, fewer void hydrates were found as the particle size decreased. However, one should note that when the particle size was small enough (i.e., less than 50 μm), the void hydrates have essentially the same melting point as the micropore hydrates. The impact of particle size was also confirmed for Vycor 95 particles.
3.1.2. Impact of Sample Mass
Excess water is essential to fill all of the pore size distribution, where the mean pore diameter could be used to interpret the melting point. The effect of excess water was also tested using Vycor 8 at 20 MPa with a heating rate of 0.5 K/min. The pore volume data from MIP were used to calculate the mass of water to fill all the available pore volume. Following the protocol explained in the previous section, different amounts of water were injected into the system. Figure 6 shows the final decomposition heat flows after ten heating and cooling preparation cycles using different initial water contents.
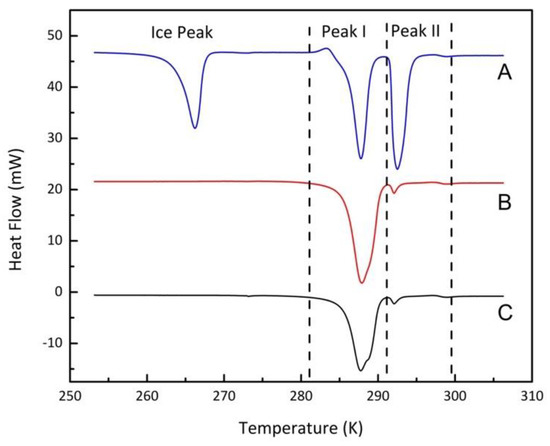
Figure 6.
DSC melting peak shape of methane hydrates formed from different water loadings; (A), 40.2 mg (200.9% micropore filling); (B), 19.8 mg (99.0% micropore filling); (C), 14.9 mg (74.5% micropore filling).
As illustrated in Figure 6, Peak I denotes the pore hydrates, and bulk hydrates contributing to Peak II. When the amount of water increased, the area of peak II increased. Although excess water contributed to enabling nearly full filling of the pore size distribution, bulk hydrates and void hydrates affected the accurate interpretation of the micropore hydrates’ melting point. When the majority of heat flow came from void hydrates, the onset temperature was heavily influenced by the void hydrates (compare the 19.8 mg water curve with that for 14.9 mg in Figure 6). Even if deconvolution of overlapping peaks could resolve the actual onset temperature of the micropore hydrates, it was not the preferred method. Hence, the excess ratio was controlled at 110% by water mass, which was large enough to resolve slight indication of void hydrates without the latter peak markedly distorting the onset of melting of the micropore hydrates.
3.1.3. Impact of Evacuation Duration
The sample containing the porous particles (Vycor 8) and water sample was maintained at vacuum (around 0.8 kPa) for 30 min. After the vacuum process, high-pressure methane was injected into the system and pressurized to the desired operating pressure. Pore capillary pressure, high-pressure gas, and the initial vacuum conditions facilitated water entering the pore structure. The melting peaks of hydrates indicated that the initial vacuum state promoted water occupying the pore volume, consequently leading to high pore hydrate to void/bulk hydrate ratio. Figure 7 shows the effect of vacuum and the absence of a vacuum process. Clearly, the pore/void hydrate ratio is markedly affected by the initial imposition of a vacuum before the high-pressure gas injection.
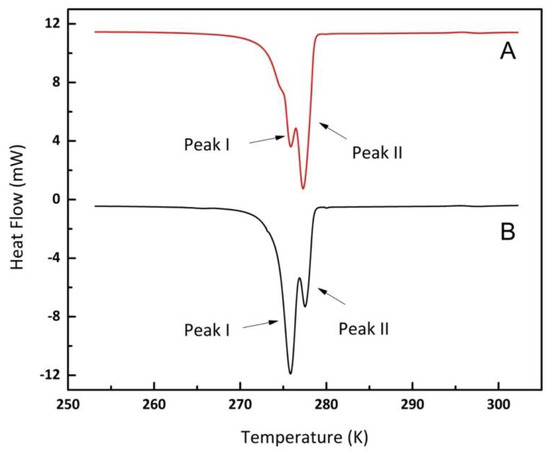
Figure 7.
DSC Thermogram of methane hydrates using Vycor 8 samples formed at 5 MPa without the vacuum step (A) and with the vacuum step (B).
3.1.4. Impact of Formation Durations
In the absence of agitation, the conversion of water and gas into gas hydrates was a relatively slow process, which was governed by the small reaction rate at low temperatures and mass transfer of gas into the liquid–solid phase. Hence, the heating cycle method was applied to accelerate the formation rate of methane hydrates. The annealing process took place between 243 K and 280 K. When the system pressure was above 5 MPa, a temperature of 243 K was low enough to initiate the heterogeneous nucleation of methane hydrates and ice, whereas a temperature of 280 K provided a sufficient temperature difference and heat to melt the unreacted ice, whilst leaving more metastable hydrate in the solid state. Cooling back to 243 K converted some of the water into hydrates and as the number of heating-cooling cycles increased, the ratio of methane hydrates to unreacted ice increased.
The onset temperature of gas hydrate melting was independent of the number of heating cycles but depended on both the pressure and the pore distribution of the material. However, when the system was under high conversion of water/ice into hydrates, the dominant large decomposition peak of gas hydrates contributed to the accurate extrapolation of onset temperature. Additionally, it was observed that unreacted ice could form gas hydrates during the heating process, which caused an exothermic shift of the baseline (see Figure 4A). The drifted baseline was also observed by Gupta and coworkers [26].
In order to avoid low conversions and baseline drifting, ten annealing cycles between 243 K and 280 K were used for experiments above a pressure of 15 MPa and 30 annealing cycles were used for experiments below that pressure. There was one exception for Vycor 8 at 5 MPa, where pore hydrates would melt at 280 K due to the very small pore size. The annealing cycle was therefore conducted between 243 K to 278 K for this condition.
3.1.5. Memory Effects
Memory effects of gas hydrates have been widely observed in the literature [1]. In general, when hydrates were fully melted, it took less time to form hydrates again. This memory effect was also observed in mesoporous silica. It requires fewer annealing cycles to convert all water and/or ice into hydrates when a melted sample was used.
Although this memory effect had no impact on the melting point of pore hydrates and void hydrate, fresh silica and water sample were used for all experiments. In addition, Takeya, et al. [27] proposed that dissolved gas has a potential impact on the nucleation process of gas hydrates. Due to the heterogeneity of the mesoporous silica system, such an effect was not observed here for deionized water with or without degasification.
3.2. Experimental Results
3.2.1. Confined Melting Points of Ice
Melting points of confined ice in mesoporous media have been intensively investigated by various techniques, including NMR spectroscopy [28], neutron diffraction [29], differential thermal analysis [19], and calorimetry [16]. The experimental results obtained in this study are shown in Figure 7, where is plotted versus the reciprocal of the mean pore radius. It is seen that Figure 7 is consistent with the Gibbs–Thomson equation [30], which relates the change in melting point.
from the bulk () to confinement in a pore () to the pore radius , the interfacial tension , the ice density and the enthalpy of fusion :
The slope of Figure 8 was used to obtain the ice–water interfacial energy, values for = 6.01kJ/mol and = 917 kg/m3, assuming a fully wetted contact angle. The interfacial energy of ice/water surface from this analysis 31.4 ± 1.5 mJ/m2 is in good agreement with the literature values of (32 ± 2 mJ/m2) [19] and (31.7 ± 2.7 mJ/m2) [31].
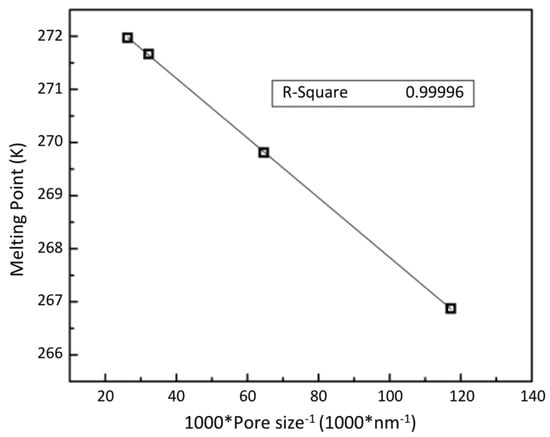
Figure 8.
Confined melting points of ice in mesoporous silica.
3.2.2. Methane Hydrates in Confined Media
The melting points of methane hydrates at eight isobars were investigated in the present work over the pressure range 5 to 50MPa and pore size range 8.5 to 195.7 nm. Melting points of methane hydrates in bulk were also measured under relative conditions. The reproducibility of the hydrate melting temperature was within ± 0.1 K. The results are plotted in Figure 9.
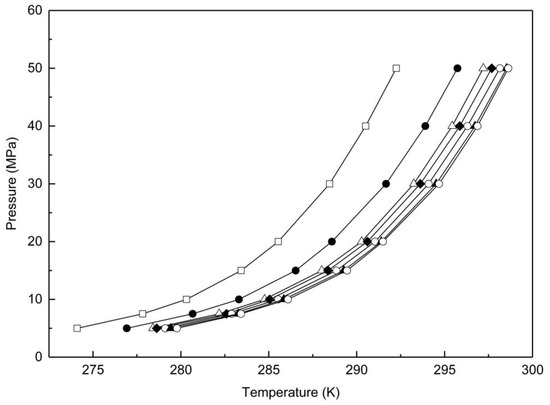
Figure 9.
Melting points of methane hydrates in a range of porous particles and in bulk; ☐, Vycor 8; ●, Vycor 17; △, Vycor 35; ◆, Vycor 40; ◯, Vycor 95; ▲, Vycor 196; ◯, Bulk hydrates.
Overall a significant inhibition of the melting point was observed in the confined mesoporous and macro-porous silica, consistent with earlier work [19] and with thermodynamic expectations. As the pore size decreased, the melting point of the micropore hydrates decreased. This depression of the melting point was also observed to be pressure dependent, the effect being more pronounced at higher pressures. The trend of the pore hydrate melting points with pressure was consistent with that for bulk hydrates, which increased exponentially with increase of the pressures. The pore inhibition effect became far less significant for pore sizes larger than 200 nm. Melting points of methane hydrates in another macro-porous sample (pore size around 300 nm) showed identical melting points as bulk hydrates at the same pressure.
3.2.3. Interfacial Energy and the Gibbs–Thomson Equation
Figure 10 shows the isobaric melting point of pore hydrates versus the reciprocal of pore size; the linear behaviour is consistent with the Gibbs–Thomson equation (G-T equation) expressed in terms of hydrate properties:
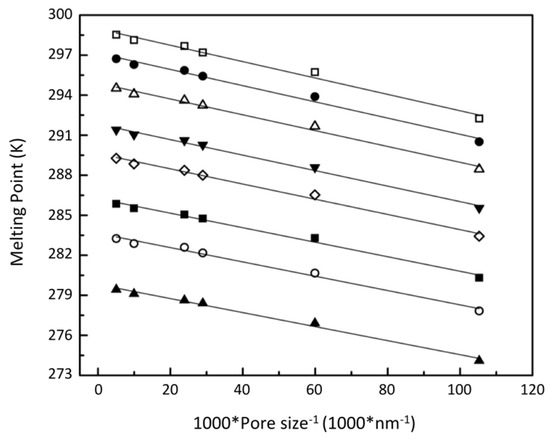
Figure 10.
Melting point of methane hydrate versus reciprocal of pore sizes; ☐, 50 MPa; ●, 40 MPa; △, 30 MPa; ▼, 20 MPa; ♢, 15 MPa; ■, 10 MPa; ◯, 7.5 MPa; ▲, 5 MPa.
The G-T equation has been adopted by different researchers [16,18,19] to explain the confinement effect of methane hydrates’ melting point in both interpreting experimental data and thermodynamic modelling. By applying the G-T equation, the data presented in Figure 9 can be used to determine the methane hydrate/water interfacial tension. As indicated by NMR analysis [28,32] and calorimetry measurements [33,34], an unfrozen water layer, which has a thickness of around 0.4 nm, is present along the pore wall. Hence, a fully wetted contact angle of was assumed along with a constant density and melting enthalpy of hydrates to calculate the interfacial tension of methane hydrates with a porous material [33]. By assuming the same density and enthalpy used by Anderson, et al. [19] (914 kg/m3 and 53.2 kJ/mol), the calculated interfacial tension at low pressures is comparable with the values obtained by Uchida, et al. [16] and Anderson, et al. [19]. The interfacial tension obtained by Anderson, et al. [19] is 32 ± 3 mJ/m2 over a pressure range of 3.6 MPa to 14.1 MPa. The averaged interfacial tension of 5 MPa, 7.5 MPa, 10 MPa, and 15 MPa from this study is 34.3 ± 1.9 mJ/m2.
As illustrated in Figure 11, the calculated interfacial tensions increase significantly with pressure in an approximately logarithmic manner. Therefore, an empirical parameter was added into the Gibbs–Thomson equation as follows.
where , , , and represent the hydrate-water interfacial energy at a reference pressure , enthalpy of hydrate fusion, density of hydrates, and pore diameter, respectively. and are the melting points of hydrates in bulk and porous media. A parameter, , was used to include the pressure () effect on confined melting points using the function:
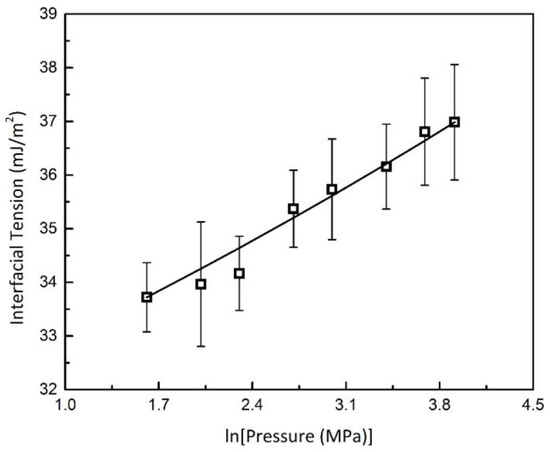
Figure 11.
Interfacial Tension of Methane Hydrates in Silica Media; ☐, interfacial tension calculated from experimental data; solid line, fitted exponential trend based on Equation (4).
Parameters and were fitted to the data presented in Figure 11. The fitted parameters and associated physical properties are summarized in Table 3:
Table 3.
Parameters and physical properties used in the modified Gibbs–Thomson Equations (3) and (4).
The empirical parameters were calculated with respect to the interfacial energy at a reference pressure of 5 MPa and assuming constant density and enthalpy of fusion. These thermophysical properties are difficult to measure in porous media. In the bulk phase, the density of hydrates could be estimated with the thermal expansion coefficient and compressibility with an assumption of 94% cage occupancy [35]. The enthalpy of fusion is known to vary with pressures. However, the enthalpy data from this study and density data from Helgerud, et al. [35] suggest that the pressure variation in bulk density and bulk enthalpy for solid hydrate is not strong. In the light of the difficulties in obtaining properties in porous media, the bulk density, the melting enthalpy in bulk, and measured interfacial energy at 5 MPa were applied to the modified G-T Equation (3). The empirical parameter, β, was used to compensate for any pressure effects, most likely associated with interfacial tension. The modified G-T equation provides a semi-empirical equation to calculate the confined melting points under elevated pressures within the range 5–50 MPa and 274.1–298.5 K. The expanded uncertainty of the correlation was estimated to be 0.20 K with a confidence interval of 95%.
3.2.4. Empirical Correlation
The Gibbs–Thomson equation predicts the melting temperature shifts from the bulk melting points. It requires a knowledge of methane hydrates’ bulk melting points to predict the melting points in porous media. When the bulk properties are unknown, it is helpful to have an empirical equation to correlate pressures, confined melting points, and pore sizes. The following empirical equation is valid in a pressure range of 5 MPa to 50 MPa and a temperature range of 274.1 K to 298.5 K. All data from this study were used to fit one equation, containing in total seven parameters, as follows:
The parameters in Equation (5) are given in Table 4. The expanded uncertainty of the empirical correlation was estimated to be 0.11 K at a 95% confidence interval. A comparison of the melting temperatures of confined methane hydrates from the literature () and their calculated data based on Equation (5) ( is demonstrated in Figure 12, in which the relative differences are within ± 5%, proving the validity of this empirical equation.
Table 4.
Parameters in Equation (5) for the correlation of the melting temperature of confined methane hydrates.
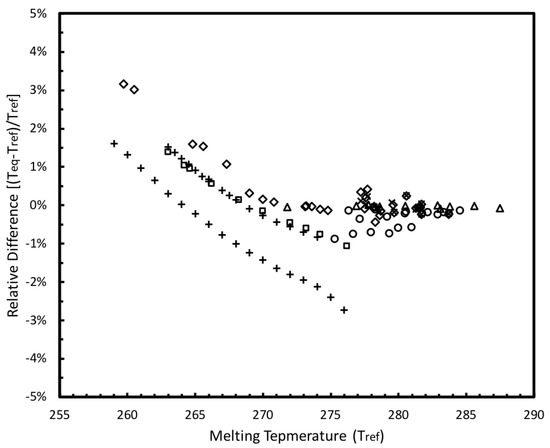
Figure 12.
Comparison of the melting temperatures of confined methane hydrates from the literature and their calculated data based on Equation (5). ☐, Handa, Y.P et al. [14]; ×, Uchida, T. et al. [15]; ♢, Uchida, T. et al. [16]; +, Smith, D.H. et al. [17]; ◯, Seo, Y. et al. [18]; △, Anderson, R. et al. [19].
3.2.5. Enthalpy of Fusion
Methane hydrates’ enthalpy of fusion can be extracted from the experimental data by using the Clausius–Clapeyron and Clapeyron equations. Anderson [36] demonstrated a mathematical approach based on the Clapeyron equation to calculate the heat of dissociation with fewer assumptions. Enthalpy of fusion is known to vary with temperature. Regarding methane hydrates, we have seen that elevated pressures lead to a higher melting point which may affect the enthalpy of the methane hydrates’ decomposition. A few experimental values have been reported previously at low pressures, but there are no data above 20 MPa. Here we report the determination of the enthalpy of methane hydrates’ fusion data using an improved experimental procedure.
To determine the enthalpy of fusion accurately, a stable baseline and an accurate initial water content are crucial. It is known that the unreacted ice can form methane hydrate before hydrates start to decompose, which causes an exothermic shift of the heat flux. The shifted baseline led to difficulties in determining accurately the boundary conditions when the peaks were deconvoluted and integrated. The oscillating temperature procedure was therefore used to convert all ice/water into hydrates, which generated a stable baseline during the subsequent heating step. Another important aspect was the mass of the initial water sample. Since the sample weight for the DSC Evo 7 is typically around 5 mg to 20 mg, the sample mass determined gravimetrically led to a significant error in the enthalpy measurements. In this study, the sample weight was determined calorimetrically from the area under the DSC ice melting peak by using the ice enthalpy of fusion at ambient pressure. The experimental values determined from the heat flux area of the hydrate melting curves are summarized in Table 5.
Table 5.
Enthalpy of methane hydrate dissociation at different pressures.
In the investigated pressure range, the enthalpy of fusion increased slightly on increasing the pressure.
4. Conclusions
Hydrate phase equilibria of binary methane and water mixtures were measured by high-pressure differential scanning micro-calorimetry in mesoporous and microporous silica which have controlled pore size ranging from 8.5 nm to 195.7 nm. An oscillating method was used to form hydrates and the equilibrium temperatures of gas hydrates were determined calorimetrically. Other properties including enthalpy of fusion, formation, and decomposition kinetics in a static system were also experimentally measured. The enthalpy of fusion of methane hydrates showed a minor pressure dependency and increased 1.8% from 5 to 40 MPa. Memory effect and Self-preservation effect were observed when gas hydrates formed and melted at different pressures.
In conclusion, it has been demonstrated that the melting points of methane hydrates in porous media are strongly influenced by pressure and pore size. For a given surface chemistry (here silica), the melting points of methane hydrates are depressed by confinement in micropores in a way that is consistent with the Gibbs–Thomson equation, the reduction depending linearly on the reciprocal of the pore radius. This can lead to reduction of 6 K or more for pores of 8.5 nm diameter. Furthermore, this effect shows a marked (essentially logarithmic) dependence on pressure, which has been ascribed here to the known variation of interfacial tension with pressure. An empirical modification of the Gibbs–Thomson Equation has been adopted to include this effect. This has large implications for the melting behaviour of natural gas hydrates formed in sediments of different mineralogizes.
Author Contributions
Conceptualization, K.H., G.C.M., and J.Y.Y.H.; methodology, H.B., K.H., G.C.M., and J.Y.Y.H.; validation, H.B. and L.A.; formal analysis, H.B., L.A., K.H., G.C.M., and J.Y.Y.H.; investigation, H.B. and L.A.; resources, K.H., G.C.M. and J.Y.Y.H.; data curation, H.B. and L.A.; writing—original draft preparation, H.B. and L.A.; writing—review and editing, K.H., G.C.M., and J.Y.Y.H.; supervision, K.H., G.C.M.,. and J.Y.Y.H.; project administration, G.C.M.; funding acquisition, K.H. and G.C.M. All authors have read and agreed to the published version of the manuscript.
Funding
This research received no external funding.
Institutional Review Board Statement
Not applicable.
Informed Consent Statement
Not applicable.
Data Availability Statement
Not applicable.
Conflicts of Interest
The authors declare no conflict of interest.
References
- Sloan, E.D., Jr.; Koh, C.A. Clathrate Hydrates of Natural Gases, 3rd ed.; CRC Press: Boca Raton, FL, USA, 2007; pp. 1–730. [Google Scholar]
- Jamadagni, S.N.; Godawat, R.; Garde, S. Annual review of chemical and biomolecular engineering. Ann. Rev. Palo Alto 2011, 2, 237–257. [Google Scholar]
- Chong, Z.R.; Yang, S.H.B.; Babu, P.; Linga, P.; Li, X.-S. Review of natural gas hydrates as an energy resource: Prospects and challenges. Appl. Energy 2016, 162, 1633–1652. [Google Scholar] [CrossRef]
- Boswell, R.; Collett, T.S. Current perspectives on gas hydrate resources. Energy Environ. Sci. 2011, 4, 1206–1215. [Google Scholar] [CrossRef]
- Li, X.-S.; Xu, C.-G.; Zhang, Y.; Ruan, X.-K.; Li, G.; Wang, Y. Investigation into gas production from natural gas hydrate: A review. Appl. Energy 2016, 172, 286–322. [Google Scholar] [CrossRef]
- Konno, Y.; Fujii, T.; Sato, A.; Akamine, K.; Naiki, M.; Masuda, Y.; Yamamoto, K.; Nagao, J. Key Findings of the World’s First Offshore Methane Hydrate Production Test off the Coast of Japan: Toward Future Commercial Production. Energy Fuels 2017, 31, 2607–2616. [Google Scholar] [CrossRef]
- Casco, M.E.; Silvestre-Albero, J.; Ramírez-Cuesta, A.J.; Rey, F.; Jordá, J.L.; Bansode, A.; Urakawa, A.; Peral, I.; Martínez-Escandell, M.; Kaneko, K.; et al. Methane hydrate formation in confined nanospace can surpass nature. Nat. Commun. 2015, 6, 6432. [Google Scholar] [CrossRef]
- Klauda, J.B.; Sandler, S.I. Predictions of gas hydrate phase equilibria and amounts in natural sediment porous media. Mar. Pet. Geol. 2003, 20, 459–470. [Google Scholar] [CrossRef]
- Shukla, K.M.; Kumar, P.; Yadav, U.S. Gas hydrate reservoir identification, delineation, and characterization in the Krishna-Godavari basin using subsurface geologic and geophysical data from the national gas hydrate program 02 expedition, offshore India. Mar. Pet. Geol. 2019, 108, 185–205. [Google Scholar] [CrossRef]
- Lei, L.; Seol, Y.; Choi, J.-H.; Kneafsey, T.J. Pore habit of methane hydrate and its evolution in sediment matrix—Laboratory visualization with phase-contrast micro-CT. Mar. Pet. Geol. 2019, 104, 451–467. [Google Scholar] [CrossRef]
- Moridis, G.J.; Seol, Y.; Kneafsey, T.J. Studies of Reaction Kinetics of Methane Hydrate Dissocation in Porous Media. 2005. Available online: https://escholarship.org/uc/item/8q50w5cn (accessed on 28 January 2021).
- Kneafsey, T.J.; Tomutsa, L.; Moridis, G.J.; Seol, Y.; Freifeld, B.; Taylor, C.E.; Gupta, A. Methane hydrate formation and dissociation in a partially saturated sand—measurements and observations. J. Pet. Sci. Eng. 2007, 56, 108–126. [Google Scholar] [CrossRef]
- Nikitin, V.V.; Dugarov, G.A.; Duchkov, A.A.; Fokin, M.I.; Drobchik, A.N.; Shevchenko, P.D.; De Carlo, F.; Mokso, R. Dynamic in-situ imaging of methane hydrate formation and self-preservation in porous media. Mar. Pet. Geol. 2020, 115, 104234. [Google Scholar] [CrossRef]
- Handa, Y.P.; Stupin, D.Y. Thermodynamic properties and dissociation characteristics of methane and propane hydrates in 70-.ANG.-radius silica gel pores. J. Phys. Chem. 1992, 96, 8599–8603. [Google Scholar] [CrossRef]
- Uchida, T.; Ebinuma, T.; Ishizaki, T. Dissociation Condition Measurements of Methane Hydrate in Confined Small Pores of Porous Glass. J. Phys. Chem. B 1999, 103, 3659–3662. [Google Scholar] [CrossRef]
- Uchida, T.; Ebinuma, T.; Takeya, S.; Nagao, J.; Narita, H. Effects of pore sizes on dissociation temperatures and pressures of methane, carbon dioxide, and propane hydrates in porous media. J. Phys. Chem. B 2002, 106, 820–826. [Google Scholar] [CrossRef]
- Smith, D.H.; Wilder, J.W.; Seshadri, K. Methane Hydrate Equilibria in Silica Gels with Broad Pore-Size Distributions. Aiche J. 2002, 48, 393–400. [Google Scholar] [CrossRef]
- Seo, Y.; Lee, H.; Uchida, T. Methane and Carbon Dioxide Hydrate Phase Behavior in Small Porous Silica Gels: Three-Phase Equilibrium Determination and Thermodynamic Modeling. Langmuir 2002, 18, 9164–9170. [Google Scholar] [CrossRef]
- Anderson, R.; Llamedo, M.; Tohidi, B.; Burgass, R.W. Experimental Measurement of Methane and Carbon Dioxide Clathrate Hydrate Equilibria in Mesoporous Silica. J. Phys. Chem. B 2003, 107, 3507–3514. [Google Scholar] [CrossRef]
- Kang, S.P.; Ryu, H.J.; Seo, Y. Phase Behavior of CO2 and CH4 Hydrate in porous media. Int. J. Appl. Sci. Eng. Technol. 2007, 4, 189–194. [Google Scholar]
- Kang, S.P.; Lee, J.W.; Ryu, H.J. Phase behavior of methane and carbon dioxide hydrates in meso-and macro-sized porous media. Fluid Phase Equilibria 2008, 274, 68–72. [Google Scholar] [CrossRef]
- Kluijtmans, S.G.J.M.; Dhont, J.K.G.; Philipse, A.P. A Light-Scattering Contrast-Variation Study of Bicontinuous Porous Glass Media. Langmuir 1997, 13, 4976–4981. [Google Scholar] [CrossRef]
- Sing, K.S. Reporting physisorption data for gas/solid systems with special reference to the determination of surface area and porosity (Recommendations 1984). Pure Appl. Chem. 1985, 57, 603–619. [Google Scholar] [CrossRef]
- Allen, T. Particle Size Measurement; Springer: Dordrecht, The Netherlands, 1997; Volume 1, ISBN 978-94-009-0417-0. [Google Scholar]
- Lee, S.; Lee, Y.; Lee, J.; Lee, H.; Seo, Y. Experimental verification of methane–carbon dioxide replacement in natural gas hydrates using a differential scanning calorimeter. Environ. Sci. Technol. 2013, 47, 13184–13190. [Google Scholar] [CrossRef] [PubMed]
- Gupta, A.; Lachance, J.; Sloan Jr, E.D.; Koh, C.A. Measurements of methane hydrate heat of dissociation using high pressure differential scanning calorimetry. Chem. Eng. Sci. 2008, 63, 5848–5853. [Google Scholar] [CrossRef]
- Takeya, S.; Hori, A.; Hondoh, T.; Uchida, T. Freezing-memory effect of water on nucleation of CO2 hydrate crystals. J. Phys. Chem. B 2000, 104, 4164–4168. [Google Scholar] [CrossRef]
- Schmidt, R.; Hansen, E.W.; Stoecker, M.; Akporiaye, D.; Ellestad, O.H. Pore size determination of MCM-51 mesoporous materials by means of 1H NMR spectroscopy, N2 adsorption, and HREM. A Preliminary Study. J. Am. Chem. Soc. 1995, 117, 4049–4056. [Google Scholar] [CrossRef]
- Liu, E.; Dore, J.C.; Webber, J.B.W.; Khushalani, D.; Jähnert, S.; Findenegg, G.; Hansen, T. Neutron diffraction and NMR relaxation studies of structural variation and phase transformations for water/ice in SBA-15 silica: I. The over-filled case. J. Phys. Condens. Matter 2006, 18, 10009. [Google Scholar]
- Jackson, C.L.; McKenna, G.B. The melting behavior of organic materials confined in porous solids. J. Chem. Phys. 1990, 93, 9002–9011. [Google Scholar] [CrossRef]
- Hillig, W.B. Measurement of interfacial free energy for ice/water system. J. Cryst. Growth 1998, 183, 463–468. [Google Scholar] [CrossRef]
- Overloop, K.; Vangerven, L. Freezing phenomena in adsorbed water as studied by NMR. J. Magn. Reson. Ser. A 1993, 101, 179–187. [Google Scholar] [CrossRef]
- Schreiber, A.; Ketelsen, I.; Findenegg, G.H. Melting and freezing of water in ordered mesoporous silica materials. Phys. Chem. Chem. Phys. 2001, 3, 1185–1195. [Google Scholar] [CrossRef]
- Jähnert, S.; Chávez, F.V.; Schaumann, G.; Schreiber, A.; Schönhoff, M.; Findenegg, G. Melting and freezing of water in cylindrical silica nanopores. Phys. Chem. Chem. Phys. 2008, 10, 6039–6051. [Google Scholar] [CrossRef]
- Helgerud, M.; Waite, W.F.; Kirby, S.; Nur, A. Elastic wave speeds and moduli in polycrystalline ice Ih, sI methane hydrate, and sII methane-ethane hydrate. J. Geophys. Res. Solid Earth 2009, 114. [Google Scholar] [CrossRef]
- Anderson, G.K. Enthalpy of dissociation and hydration number of methane hydrate from the Clapeyron equation. J. Chem. Thermodyn. 2004, 36, 1119–1127. [Google Scholar] [CrossRef]


Publisher’s Note: MDPI stays neutral with regard to jurisdictional claims in published maps and institutional affiliations. |
© 2021 by the authors. Licensee MDPI, Basel, Switzerland. This article is an open access article distributed under the terms and conditions of the Creative Commons Attribution (CC BY) license (http://creativecommons.org/licenses/by/4.0/).