We performed kinetic Monte Carlo simulations of the lattice model on a system with size
in lattice units
a. In all the simulations the temperature is fixed at
and the bulk density fixed by the reservoir is
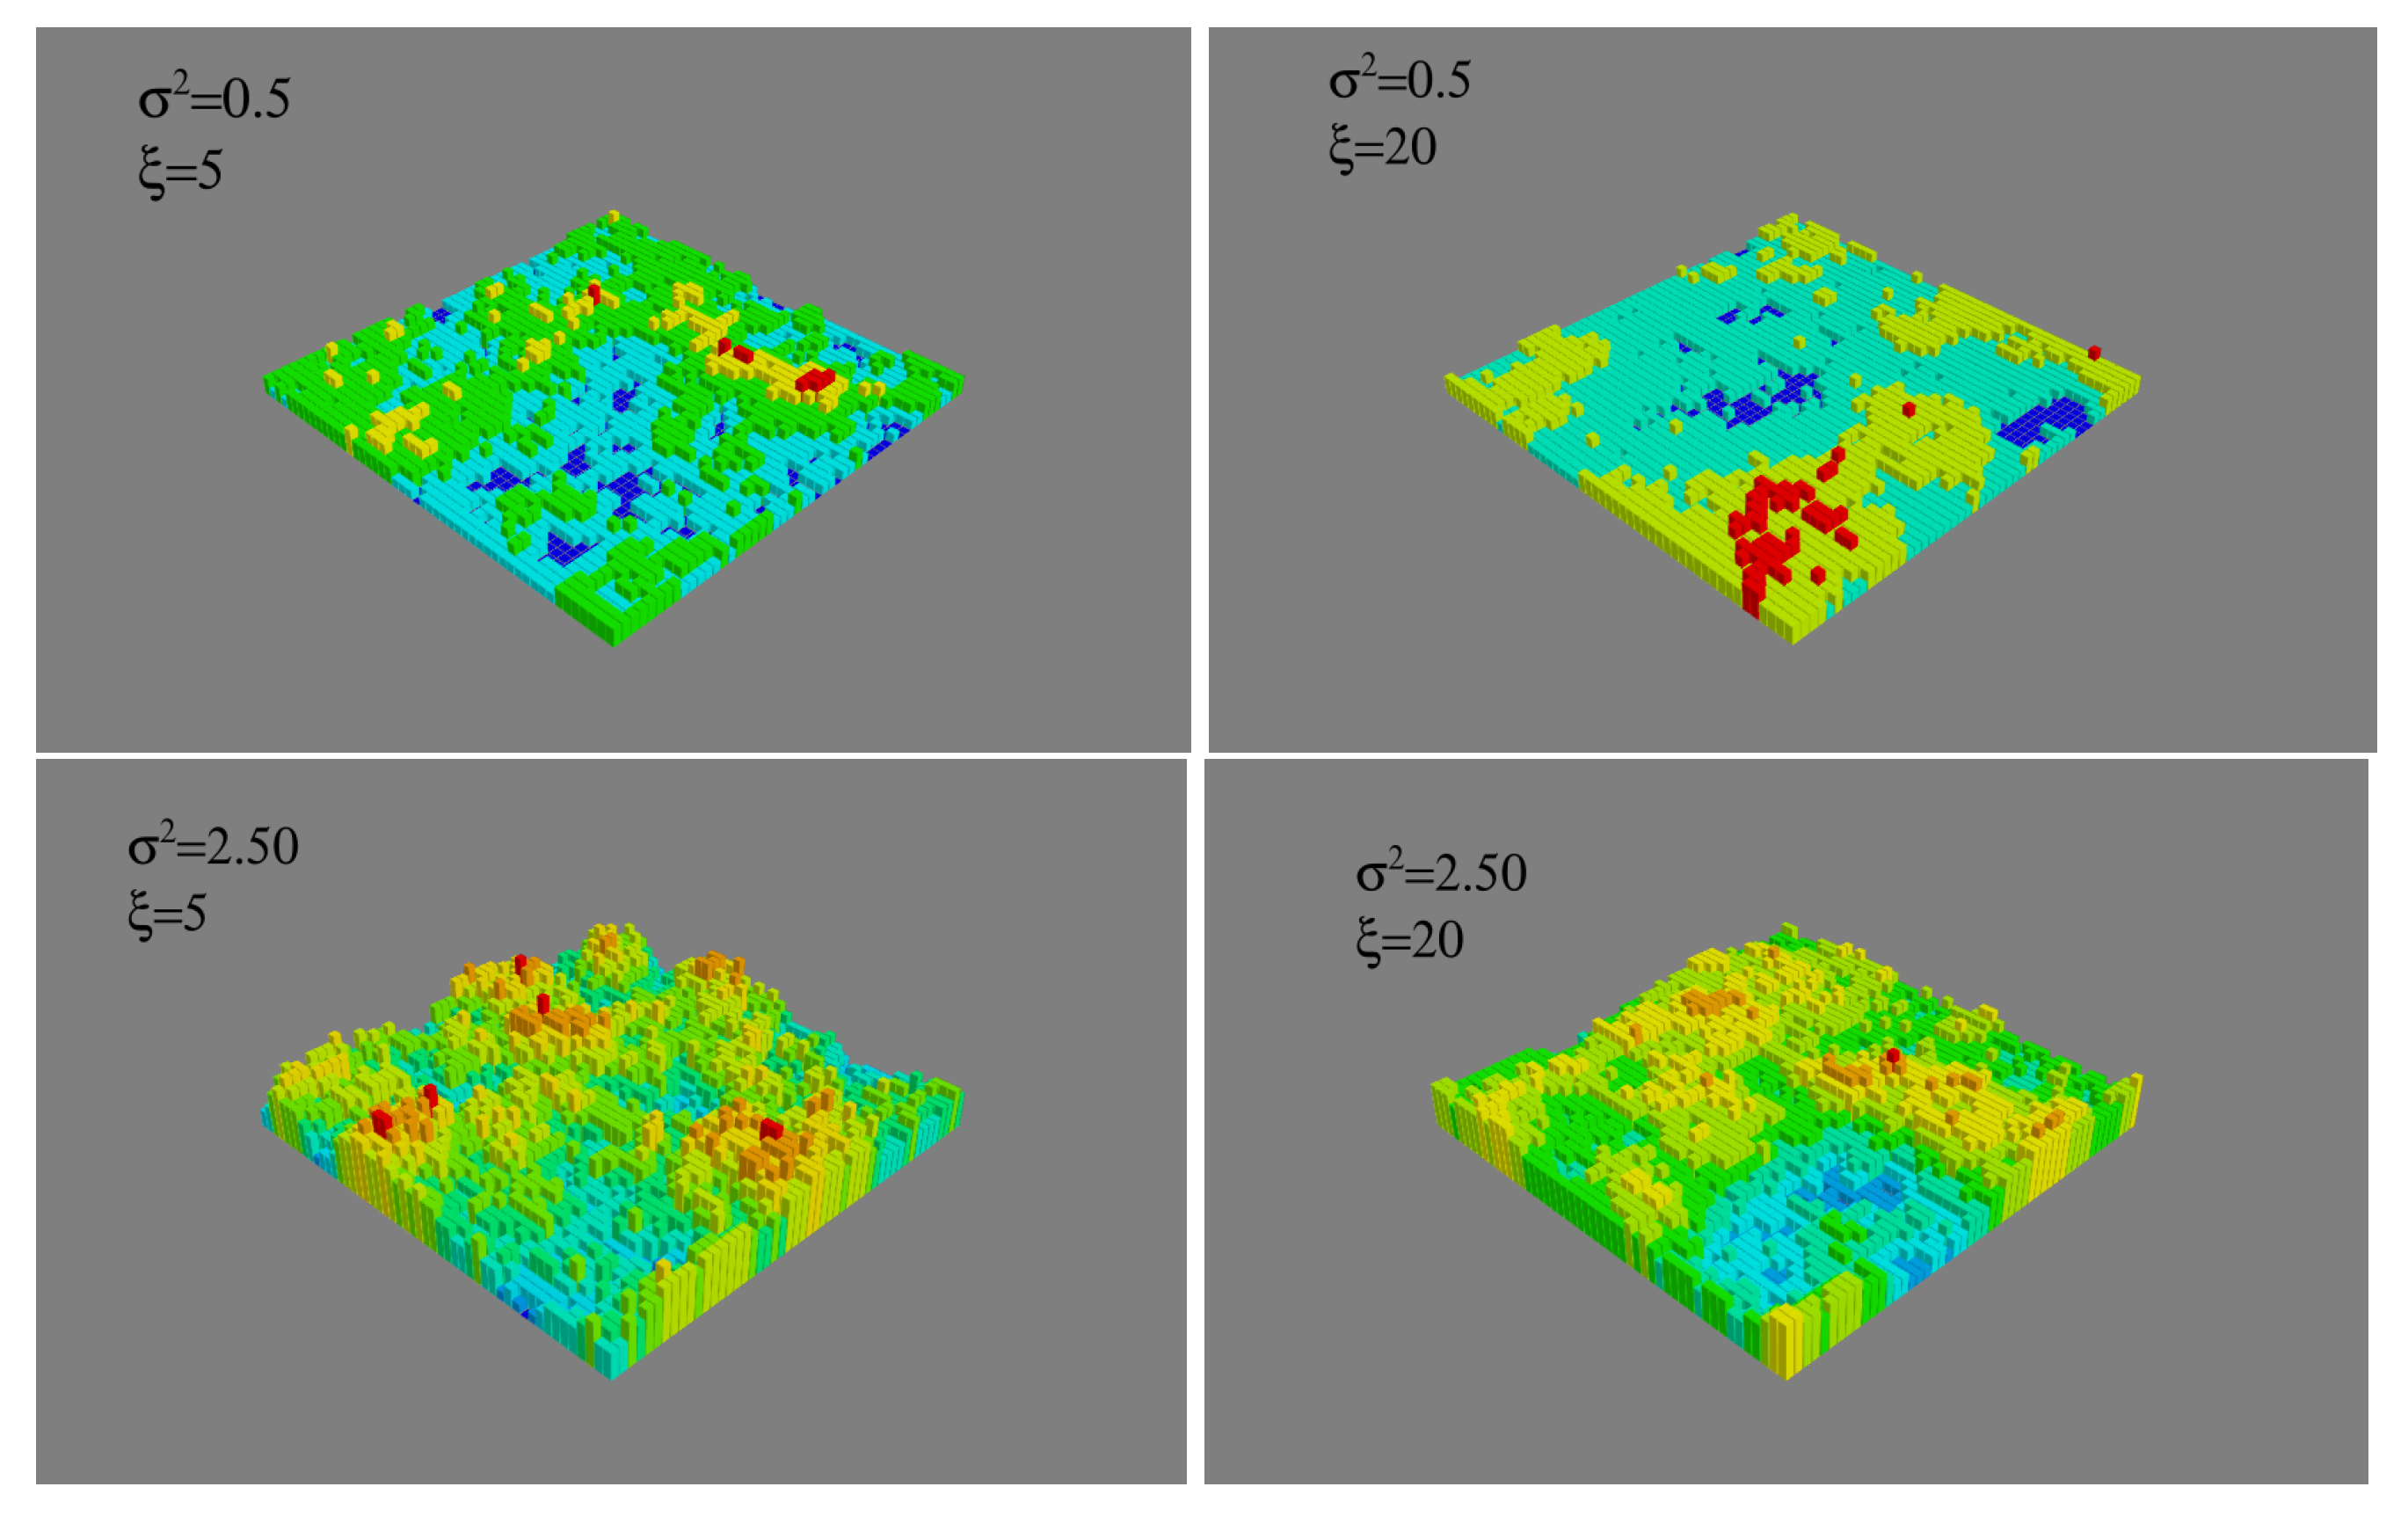
in lattice units. The bulk density was chosen sufficiently low that the nucleation was not instantaneous—making impossible to meaningfully study the effect of substrates—but sufficiently high that the critical cluster was not large compared to system dimensions. (Typical critical clusters consisted of between 60 and 100 molecules, so with diameters between 5 and 6 lattice sites.) We generated exponentially correlated random rough surfaces with given variance
and correlation length
, typical examples of which are shown in
Figure 1.
3.1. For Hard Walls, Roughness Is not Important
The first question addressed was whether purely entropic—i.e., geometric—effects, induced by the substrate topography may influence the nucleation rate through an effect of confinement.
Figure 2 shows the rate of formation of clusters when the solution is in contact with purely repulsive substrates (
) or substrates slightly attractive (
) with varying topographies. As can be seen, the rate of formation of clusters is unaffected by changes in the variance of the height indicating that entropic effects alone, in the absence of significant attractive interactions, do not significantly affect the nucleation rate.
In contrast, when the substrate is attractive (
), the nucleation rate becomes quite sensitive to the surface topography. The combined effect of enthalpy and surface roughness is clearly seen in
Figure 3 showing the critical sizes of the clusters and
Figure 4 which shows the rate of cluster formation for different values of the height variance with correlation lengths
(upper graphic), and
(lower graphic). For the different surface topographies investigated, at fixed correlation length, the critical size decreases from about 87 to just above 60 and the nucleation rate increases by a factor
as the variance increases from
to
. Moreover, at fixed variance the nucleation rate increases by a factor of a thousand as the correlation length decreases from
to
. The critical size decreases almost monotonically for the smaller correlation length but at larger correlation length it is unaffected until the roughness exceeds
. Our goal in the following is to understand the mechanisms behind these variations.
3.2. Roughness of Attractive Walls Increases Absorption
The usual explanation for the variation of nucleation rate with roughness is that a rough substrate has a larger surface area than a flat substrate so that more molecules can adsorb onto it leading to heterogeneous nucleation. To understand the effect of roughness on molecular adhesion one can follow the thermodynamic analysis and assume that the amount of molecules in contact with the substrate is proportional to the energy of adhesion
which for a flat solid surface is defined by [
21,
22]
where
,
, and
, are the interfacial tension for substrate–vapor, substrate–crystal, and crystal–vapor interfaces. By combining (
5) with Young’s equation
one obtains the Young–Dupre equation
where
is the equilibrium contact angle of the crystal on the substrate. For a rough surface the adhesion energy and the contact angle become spatial-dependent [
23]
where
is the contact angle modified by the local slope at the surface,
. In the discrete model, there is a perfect contact between molecules and the surface since the lattice spacing is identical to the molecular size. In this case the average energy of adhesion is proportional to number of plaquettes of the solid surface in contact with molecules,
, and using Equation (
A25) from the
Appendix A, gives the high-roughness estimate
This shows that for fixed correlation length, adhesion energy increases with increasing variance, . Conversely, for fixed variance, adhesion energy decreases with increasing correlation length. All of this is consistent with the intuition that crystal that forms in small valleys on the substrate will have more contact with the substrate and so lower energy than the same volume of crystal on a flat substrate: in other words, roughness over molecular length scales lowers the crystal–substrate surface tension. Assuming that the amount of absorbed molecules at the substrate is proportional to the adhesion energy, the effect of roughness on adhesion is demonstrated by measuring the molecular surface density as a function of and . The surface density is defined as the number of molecules whose distance from the plane is lower so that is normalized by the surface area of the plane, .
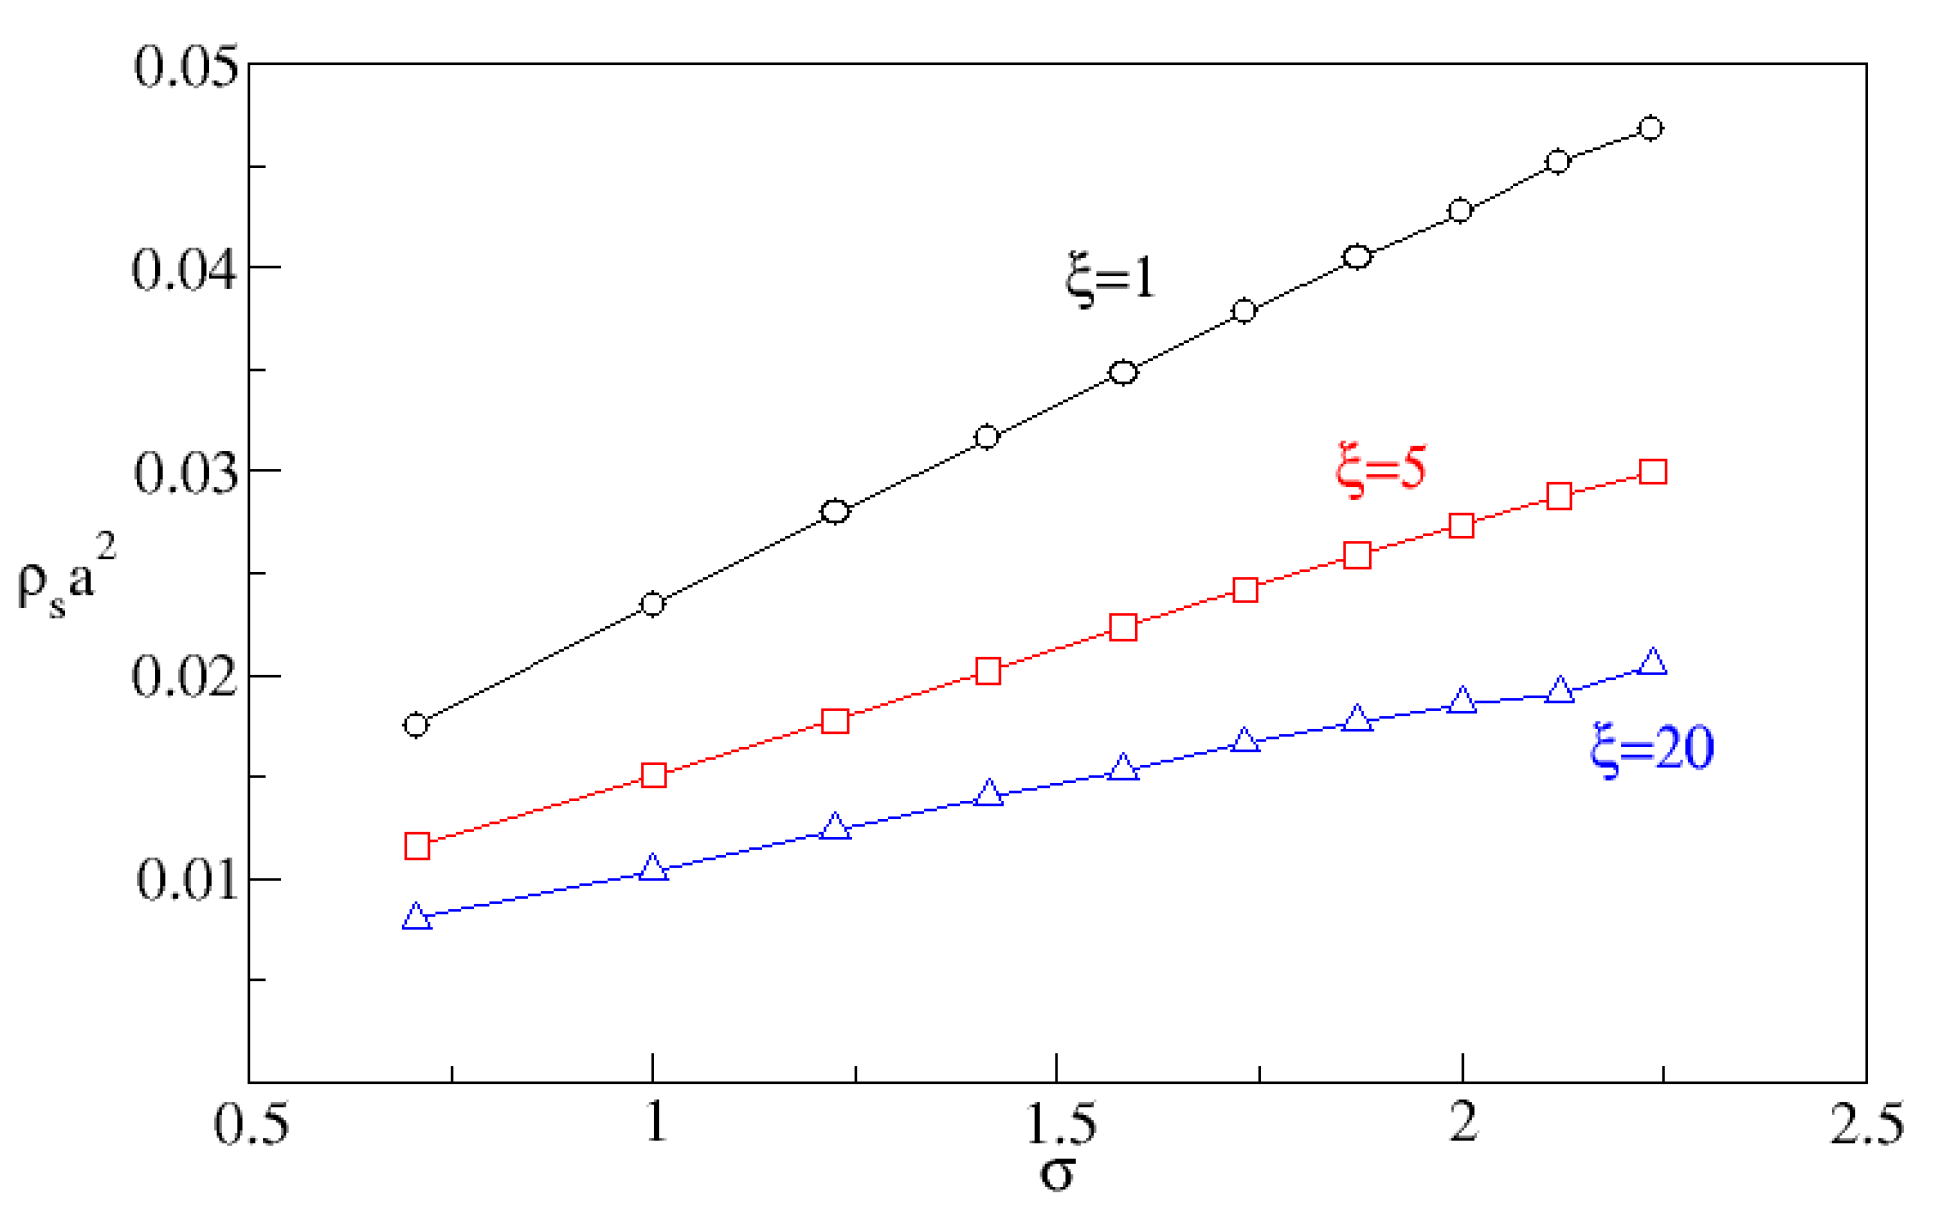
Figure 5 shows that
is indeed proportional to
, and that by increasing the correlation length one reduces the surface density. Furthermore, the observed local increase in concentration is well-correlated with the nucleation rate as shown in
Figure 6.
3.3. Correlation Plays an Important Role
While these results ascertain that rougher substrates adsorb more molecules and that this is correlated with a higher nucleation rate,
Figure 5 suggests that
is not the only factor. Clearly, substrates with the same roughness but different correlation lengths absorb different numbers of molecules so that the topography also plays an important role.
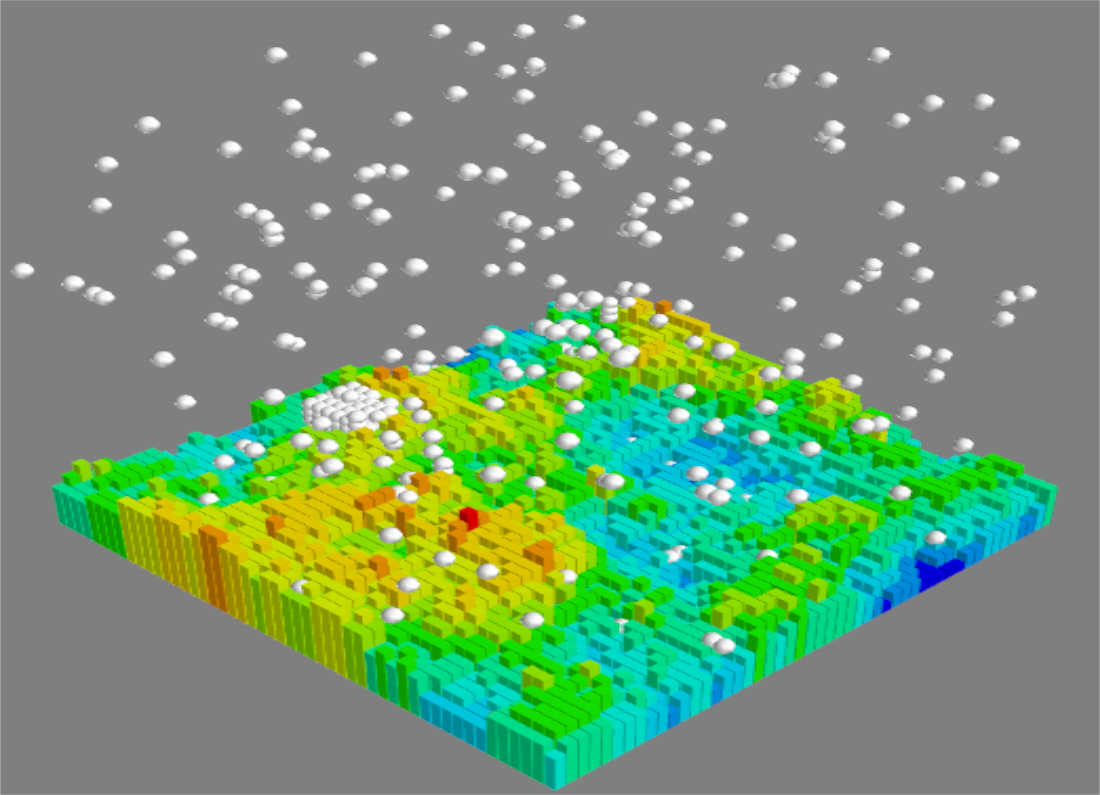
A clue as to the role of surface correlations comes from an examination of post-critical clusters, see
Figure 7. Contrary to what one might expect, clusters are not all in contact with the substrate and, in fact, some grow far away from it. To quantify this, we measured the contact surface
, between the substrate and the largest cluster, corresponding to
, as a function of
and
.
The probability distribution of
, obtained from a thousand substrate–cluster configurations, is displayed
Figure 8. One observes that for
the most probable configuration is that the cluster has no contact with the substrate while at higher variances, the probability of no-contact decreases until at
, all clusters grow on the solid substrate. To understand this better,
Figure 9 shows the evolution of the contact area for different values of
, as a function of the size of the growing crystal: in other words, how the contact area changes as a function of cluster size.
The behavior of
as a function of cluster size demonstrates that when the roughness is small, crystals start to grow on the substrate that favors heterogeneous nucleation, but they detach from the substrate when reaching a critical size
, while for rougher substrates, they always remain attached to the substrate. A similar behavior is observed in seeded heterogeneous crystallization [
24]. In [
24], the sequence of crystallite structures is followed during crystallization in a colloidal system in contact with a spherical glass bead. Depending on the bead diameter, the crystallite detaches from the curved seed surface once it reaches a critical size. The origin of this behavior is attributed to a mismatch between the crystalline structure and the curved surface that induces elastic stress in the crystal. Because the distortion that leads to the detachment depends on the crystallite-seed relative curvature, the critical crystal diameter is a function of the seed diameter. In the present model, the detachment could not be attributed to the relaxation of an elastic distortion, however, a similar conclusion can be drawn by considering the interfacial energy of the crystal.
To begin with, it is clear that a cluster of two molecules will be more stable if it is in contact with the substrate (which contributes some bonding energy) than in the bulk fluid. For this reason, small clusters are more likely to be found in the valleys of the rough surface where they can maximize their contact with the substrate (or, in other words, replace as much vapor–crystal surface with crystal–substrate surface as possible). For larger clusters, there are two competing effects. First, if they form in the valleys of the substrate, they continue to replace the crystal–vapor interface with the crystal–substrate interface, which is energetically favored. Indeed, one can estimate the crystal–vapor surface tension to be whereas the crystal–substrate surface tension is . Second, however, is that in bulk, a cluster can minimize its surface area (by becoming spherical) and hence lower its energy: this is not possible for clusters growing in the substrate which are constrained by the geometry of the pores. Thus, one expects that small clusters will be energetically favored to form on the substrate while large clusters may have lower energy in the bulk, away from the substrate. An important question here will be the stability of the clusters that form in the pores. Small clusters will, generally, be unstable but there may be a critical size beyond which the clusters in the pores become stable. In this case, one expects to find large clusters growing on the substrate. However, as the clusters grow they fill the pores and it may be that stability is never attained until they exceed the size of a pore in which case, they may be less stable than equal-sized clusters in the bulk.
This picture is confirmed by
Figure 9 which shows the average area of contact with the substrate as a function of cluster size. Note that this is an average over
all clusters including those that are not in contact with the substrate at all. As expected from our argument, for the smallest clusters, the average contact area increases with increasing cluster size regardless of the roughness. For the case of low variability of the surface height, a maximum is reached at a certain cluster size and the contact area then decreases until eventually reaching zero, indicating that detached clusters become increasingly favored. For the rougher cases, however, the contact area increases monotonically showing that clusters remain attached to the substrate as they grow.
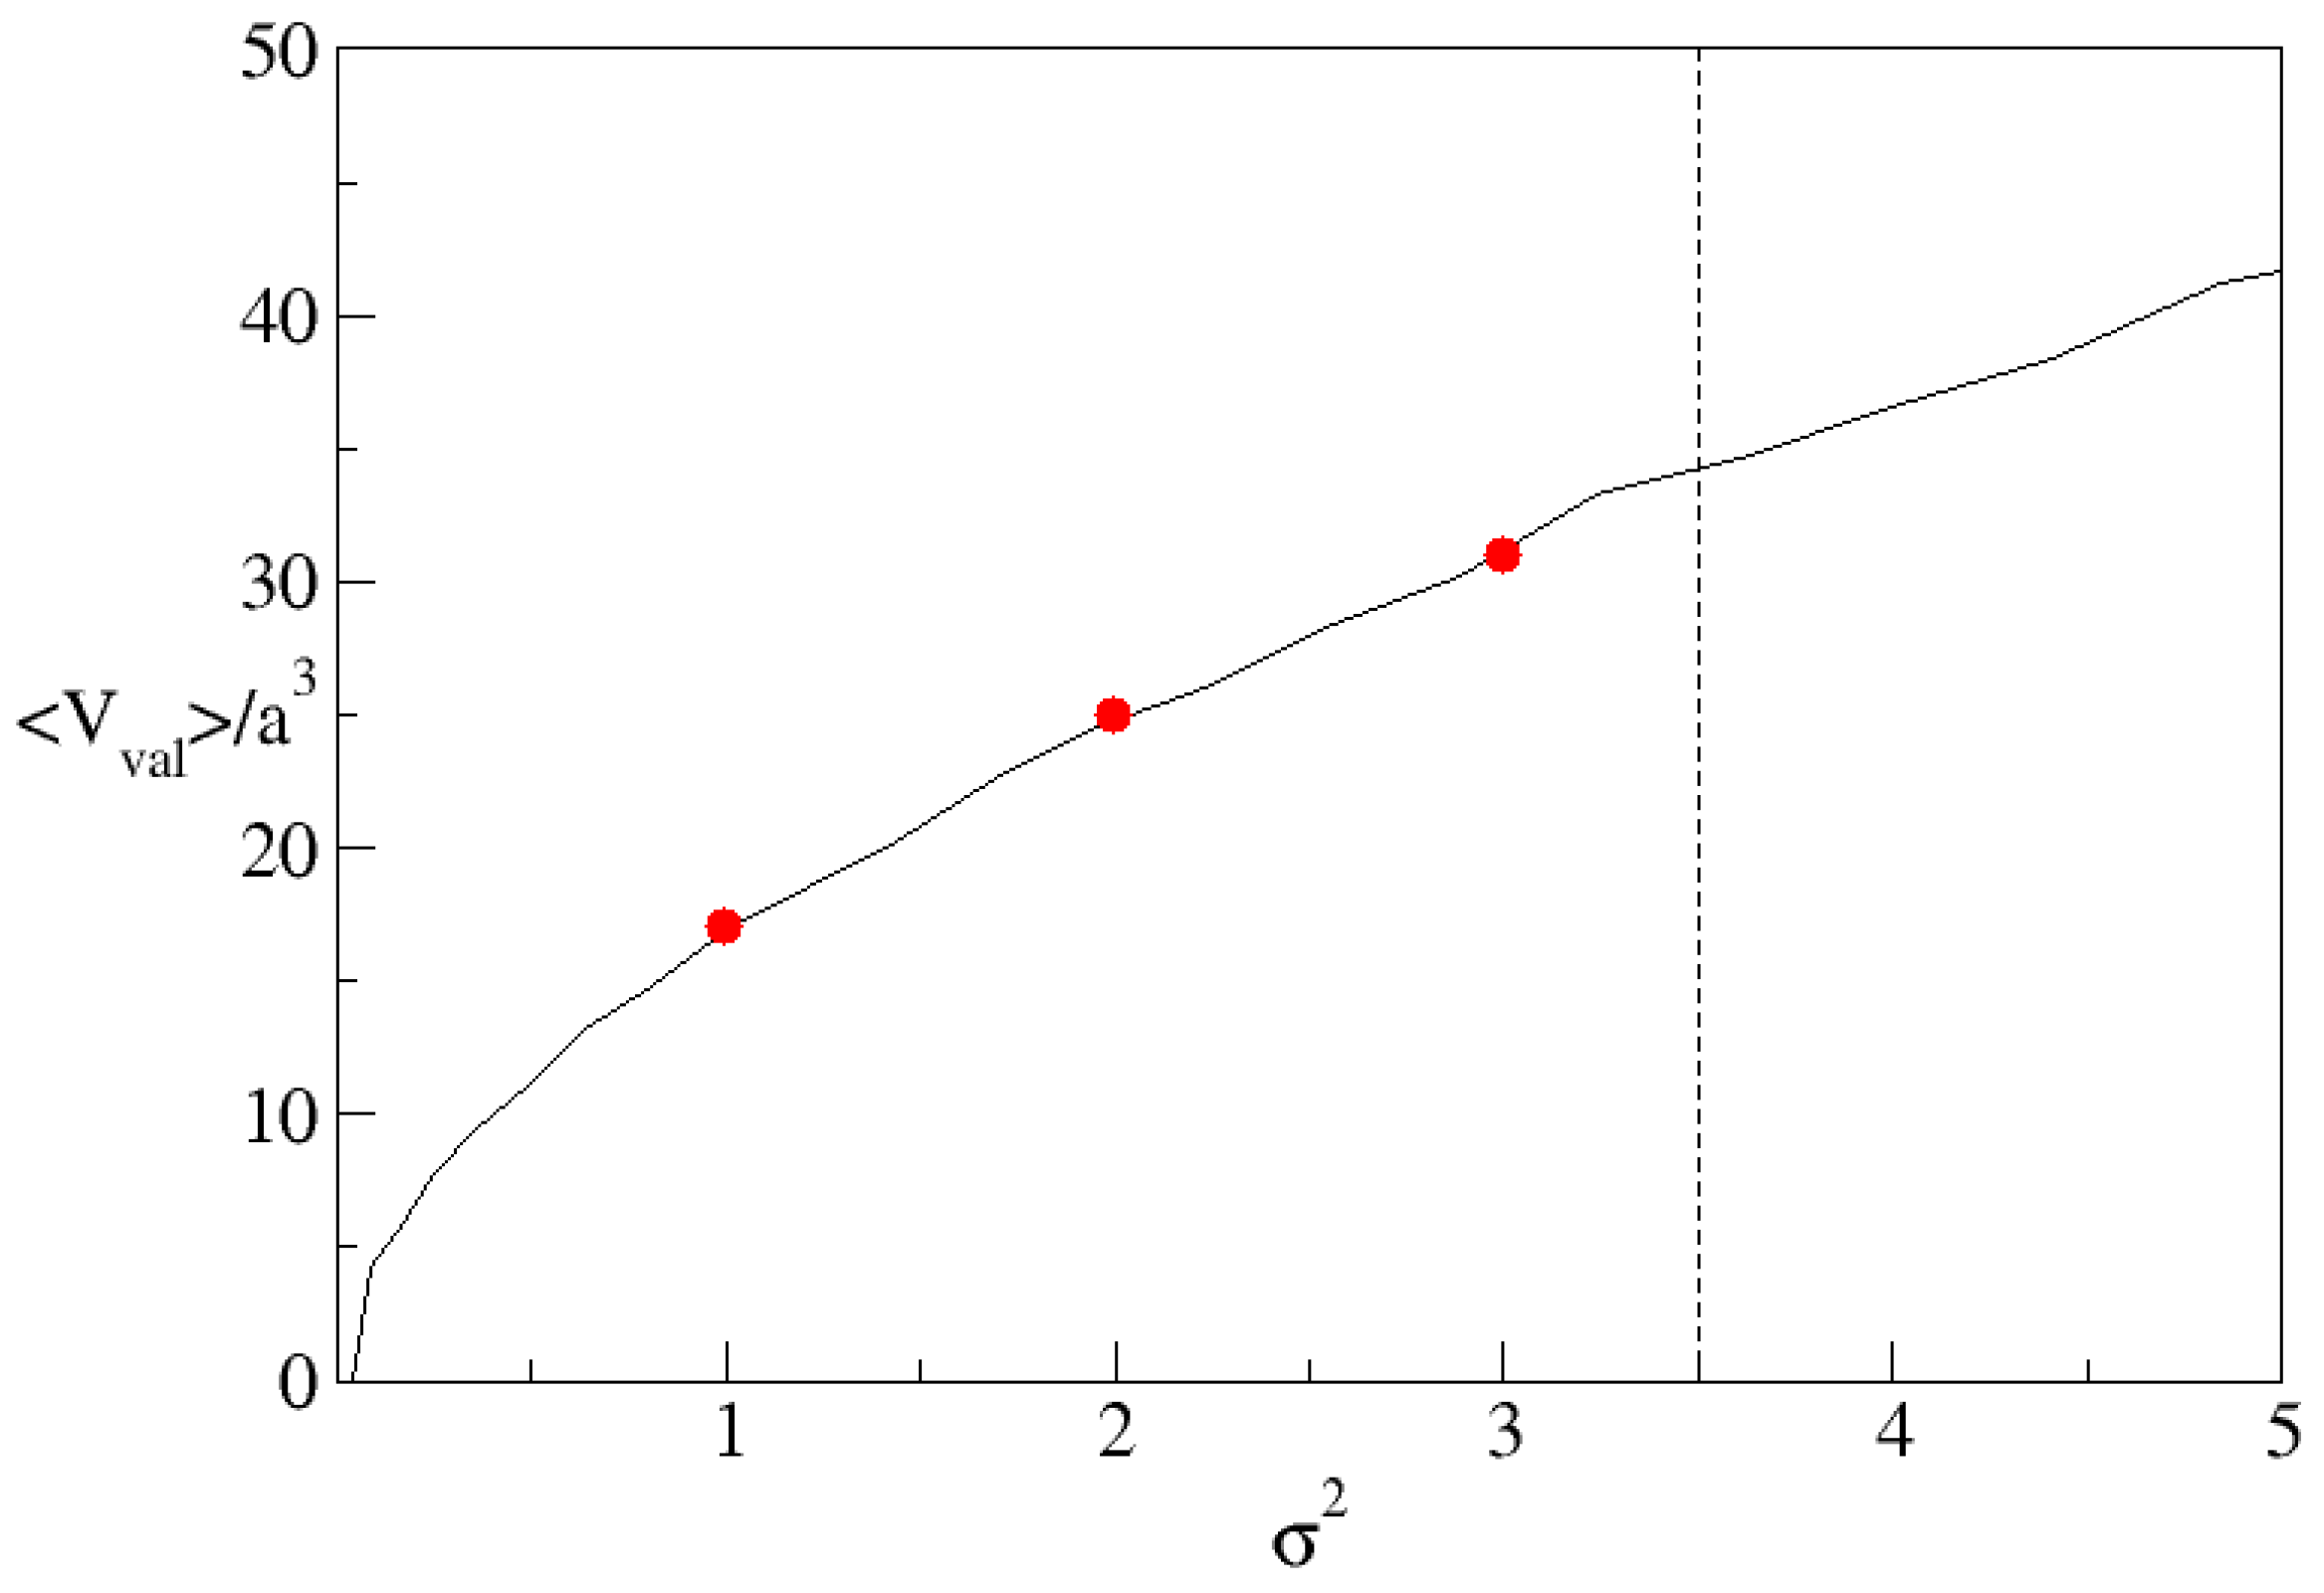
Figure 10 shows the average volume of a valley on the substrate as a function of variance of the height. We find that, as one would expect, the volume of the valleys increases with roughness and, furthermore, that the volumes are close to the observed maxima of the contact area at lower roughness. This suggests that bulk clusters become more stable than surface clusters once the clusters fill the pores unless, as argued above, the pores exceed a critical volume in which case clusters on the substrate can continue to grow indefinitely.
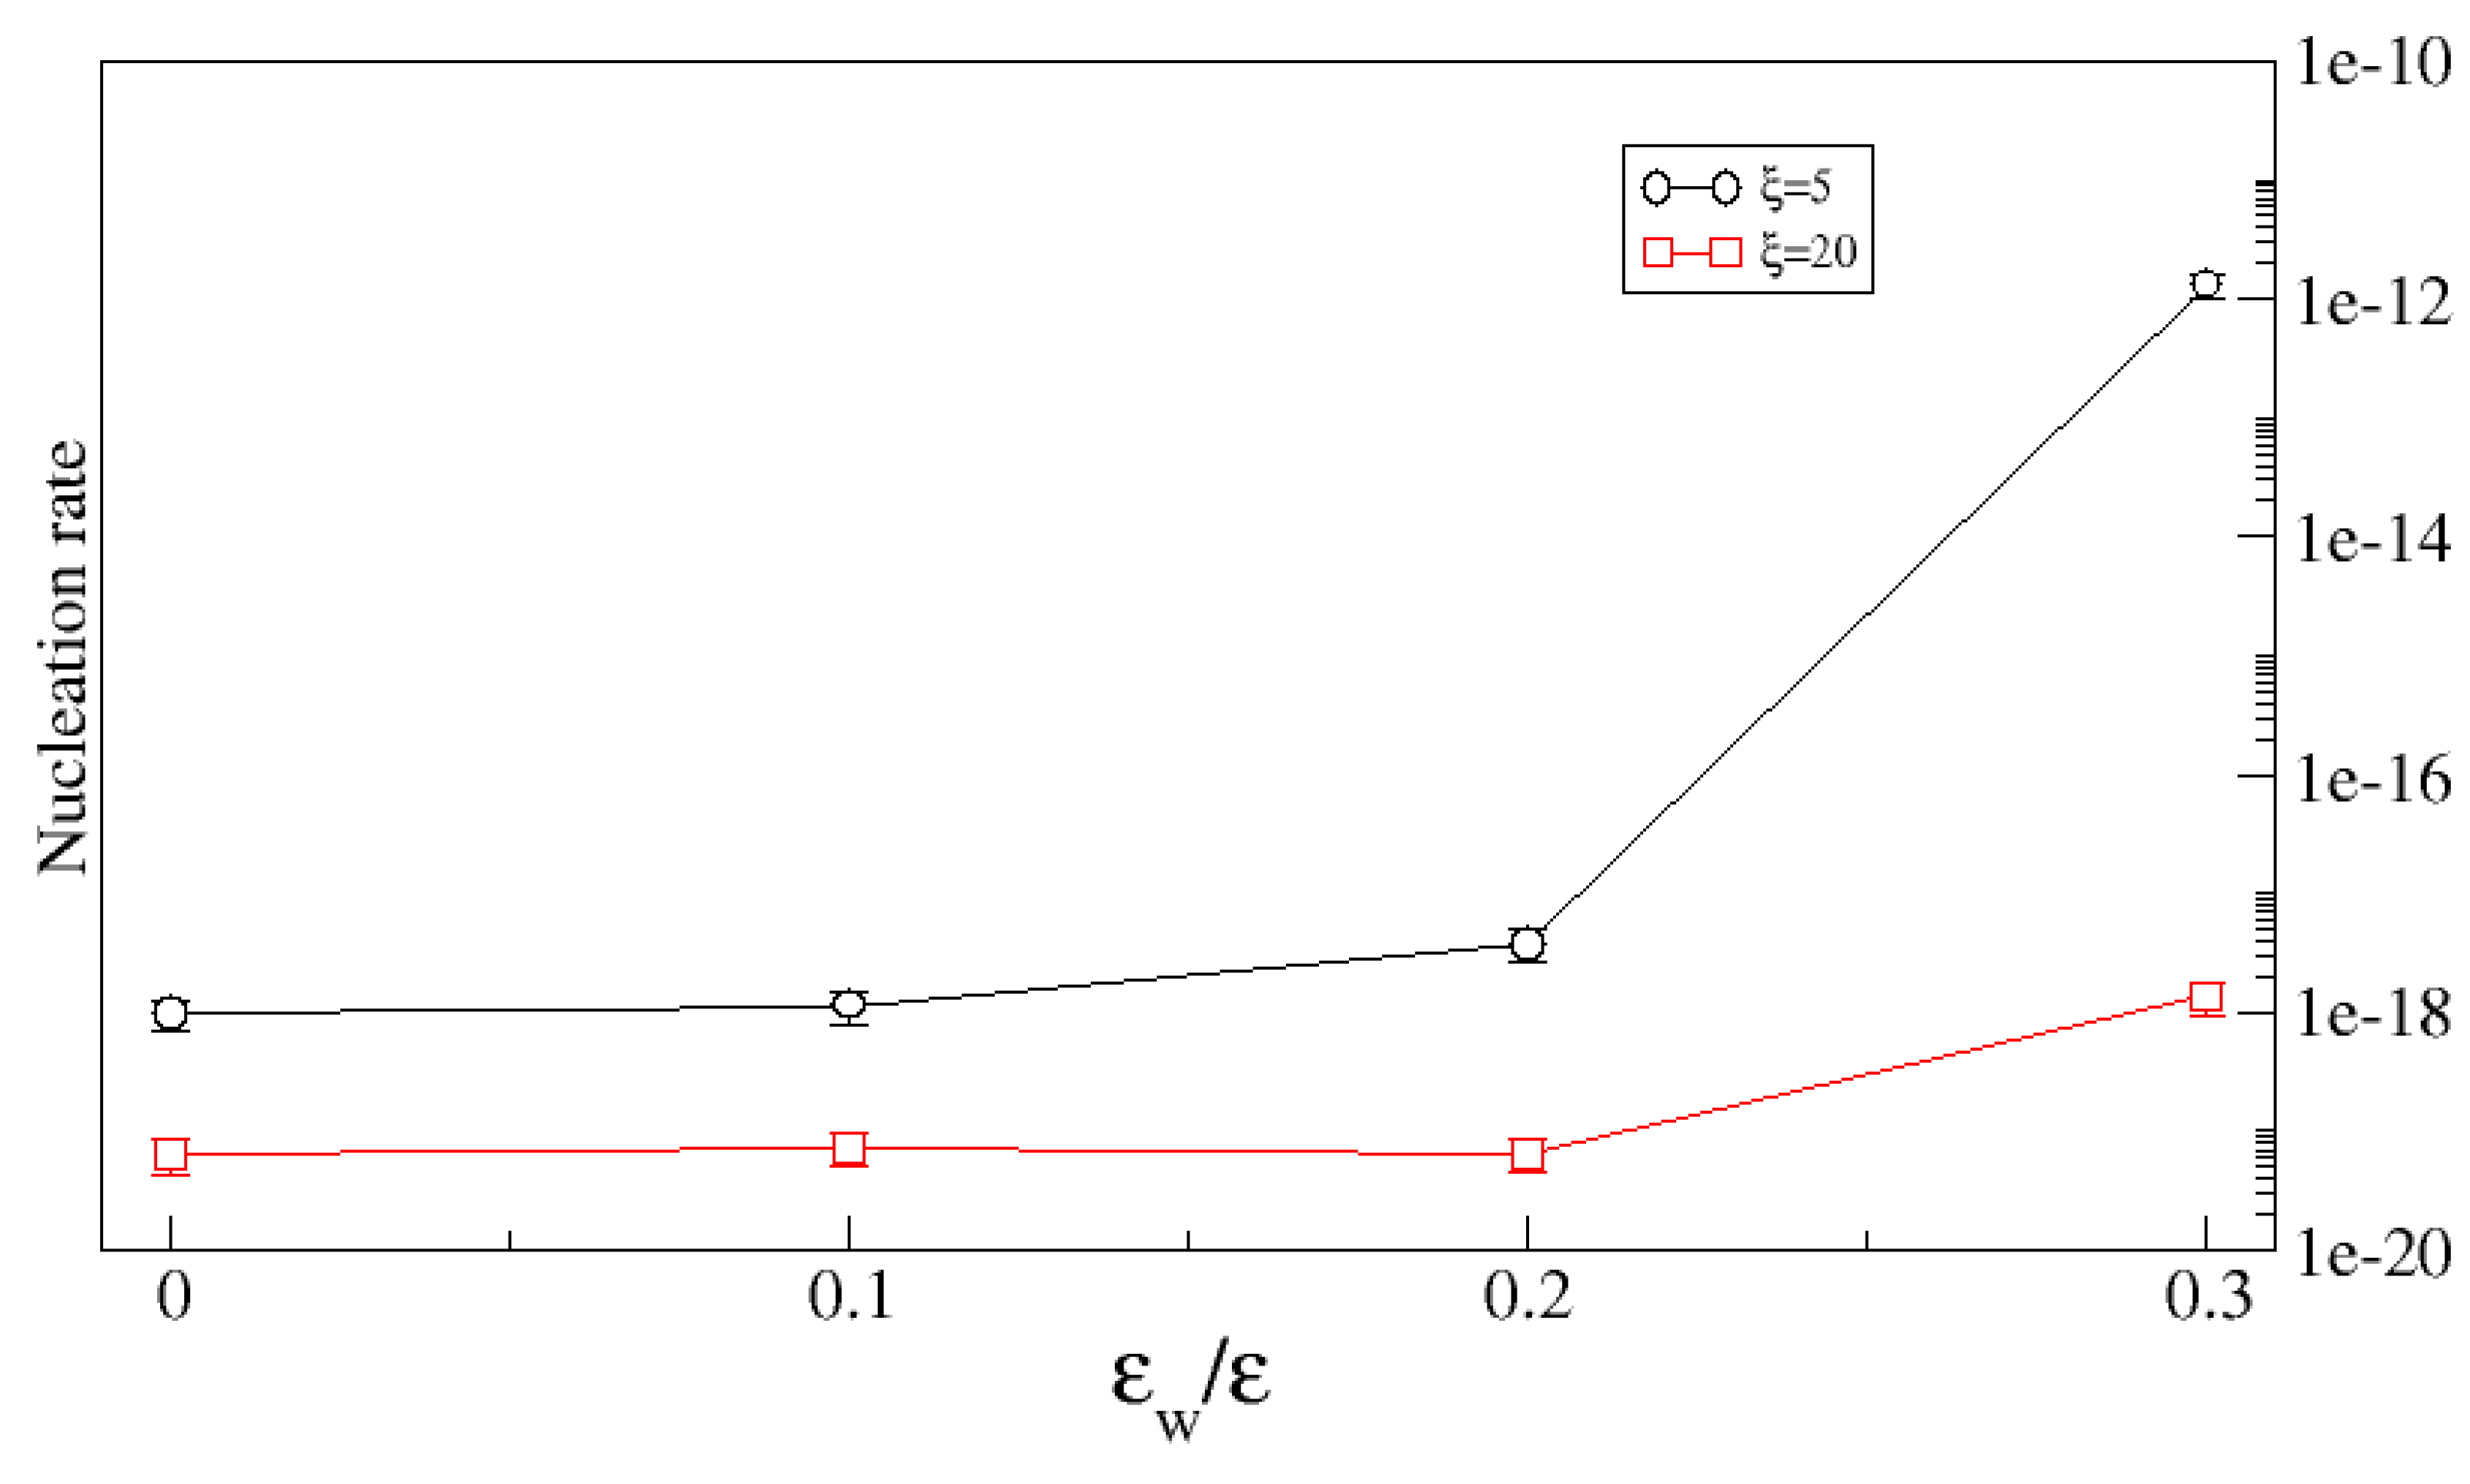
The overall impact of the substrate roughness on the nucleation rate depends on both the surface geometry (i.e., its roughness is controlled by both the variance of the height and the correlation length) and on the substrate chemistry (here characterized by the binding energy of the crystal molecules to the substrate). Clearly, as the strength of the crystal–substrate bond decreases, the crystal–substrate surface tension increases and the geometric constraint of the pores makes it increasingly unlikely that clusters will form in them. This is illustrated in
Figure 11 which shows the nucleation rate as a function of crystal–substrate bond strength for a fixed variance (
) and two different correlation lengths. In both cases, the nucleation rate is unaffected by the roughness up to a critical bond strength beyond which the substrate enhances the nucleation rate. As expected, the enhancement is greater for the smaller correlation length since in that case, one expects the pores to have a larger average volume.
This scenario depends on both the length scales, and its impact on the nucleation rate, as explained above, is heavily dependent on the binding energy.
Figure 11 shows the nucleation rate as a function of the binding energy for two values of the correlation length. When
, where
is a critical binding strength, the nucleation rate is almost independent of
, while for
, the nucleation rate increases with
. However, increasing interaction leads to irreversible adsorption on the substrate, therefore hence the limit
.


