Article

Low Frequency Vibrations and Diffusion in Disordered Polymers Bearing an Intrinsic Microporosity as Revealed by Neutron Scattering

by
Reiner Zorn
1,
Paulina Szymoniak
2,
Mohamed A. Kolmangadi
2,
Richard Malpass-Evans
3,†,
Neil B. McKeown
3,
Madhusudan Tyagi
4,
Martin Böhning
2 and
Andreas Schönhals
2,*
1
Forschungszentrum Jülich GmbH, Jülich Centre for Neutron Science (JCNS-1), Institute for Biological Information Processing (IBI-8), 52425 Jülich, Germany
2
Bundesanstalt für Materialforschung und -prüfung (BAM), Unter den Eichen 87, 12205 Berlin, Germany
3
School of Chemistry, University of Edinburgh, Edinburgh EH9 3FJ, UK
4
NIST Center for Neutron Research Gaithersburg MD 20899 and Department of Material and Engineering, University of Maryland, College Park, MD 20742, USA
*
Author to whom correspondence should be addressed.
Current address: APC Ltd., Building 11, Cherrywood Business Park, Loughinstown, Dublin D18 DH50, Ireland.
Crystals 2021, 11(12), 1482; https://doi.org/10.3390/cryst11121482
Submission received: 2 November 2021 / Revised: 26 November 2021 / Accepted: 26 November 2021 / Published: 29 November 2021
(This article belongs to the Special Issue Impact of Lattice Vibrations on Diffusion in Solids)

Abstract

:
The microscopic diffusion and the low frequency density of states (VDOS) of PIM-EA-TB(CH3) are investigated by inelastic and quasi-elastic neutron scattering where also the demethylated counterpart of PIM-EA-TB(H2) is considered. These intrinsic microporous polymers are characterized by large BET surface area values of several hundred m2/g and pore sizes between 0.5 and 2 nm. Detailed comparison is made to the archetype of polymers of intrinsic microporosity, PIM-1, and polynorbornenes also bearing a microporosity. Due to the wavelength of neutrons, the diffusion and vibrations can be addressed on microscopic length and time scales. From the inelastic neutron scattering experiments the low frequency density of states (VDOS) is estimated which shows excess contributions to the Debye-type VDOS known as Boson peak. It was found that the maximum frequency of the Boson peak decreases with increasing microporosity characterized by the BET surface area. However, besides the BET surface area, additional factors such as the backbone stiffness govern the maximum frequency of the Boson peak. Further the mean squared displacement related to microscopic motions was estimated from elastic fixed window scans. At temperatures above 175 K, the mean squared displacement PIM-EA-TB(CH3) is higher than that for the demethylated counterpart PIM-EA-TB(H2). The additional contribution found for PIM-EA-TB(CH3) is ascribed to the rotation of the methyl group in this polymer because the only difference between the two structures is that PIM-EA-TB(CH3) has methyl groups where PIM-EA-TB(H2) has none. A detailed comparison of the molecular dynamics is also made to that of PIM-1 and the microporous polynorbornene PTCNSi1. The manuscript focuses on the importance of vibrations and the localized molecular mobility characterized by the microscopic diffusion on the gas transport in polymeric separation membranes. In the frame of the random gate model localized fluctuations can open or close bottlenecks between pores to enable the diffusion of gas molecules.

1. Introduction

Green key technology for the separation of gasses is membrane processes employing glassy polymers as materials for the active separation layer. Compared to other approaches which are based on cryogenic processes or on adsorption they are essentially more energy and cost efficient. Moreover, separation devices based on polymer membranes can be employed in large-scale applications such as purification of natural gas as well as in small-scale processes such as the upgrading of biogas.
The generally accepted approach to describe the gas transport in solid polymers is the solution diffusion model [1]. The gas molecules are adsorbed at a membrane, where this process is described by the solubility S. After the adsorption process the gas molecules diffuse through the film. The relevant parameter for this process is the diffusion coefficient D which is directly related to the molecular mobility of the polymer. The first relevant property characterizing a material for gas separation processes is the permeability P given by the product P = S*D. P describes mainly the gas flux through the membrane [2,3]. Besides a high permeability the polymer membranes must be selective. This is described by the second relevant quantity the permselectivity α a b that is defined as the ratio of the permeabilities of two different gases a and b.
The analysis of the values of a high number of polymers revealed that there is a trade-off relationship between permselectivity and permeability which is called Robeson upper-bound in a double-logarithmic plot of the permselectivity α a b plotted against the permeability of gas Pa which is more permeable [2,3,4,5,6]. A theoretical basis of the empirical Robeson upper-bound was given by Freeman [7,8].
Currently, the focus of research is to synthesize polymers with a high permeability and permselectivity values above the Robeson upper-bound. This concerns mainly glassy polymers having a large fractional free volume such as poly(trimethylsilylpropyne) (PTMSP) [9] as well as poly(4-methyl-2-pentyne) (PMP) [10,11]. For these polymers from the group of the polyacetylenes, the permeability is orders of magnitude higher compared to conventionally glassy polymers but with low permselectivity values. Based on these developments, the research has led to novel classes of polymers characterized by an exceptional high free volume as the polymers of intrinsic microporosity (PIMs) [12,13]. PIMs have high values of Brunauer/Emmett/Teller (BET) surface areas of several hundred m2/g. The high value of the BET surface area goes along with the formation of a continuous void phase due to the high free volume [14,15].
It is worth noting that the microporosity of PIMs is due to their rigid backbone structure with a contorted chain structure ins some cases due to spiro-centers resulting in an ineffective packing of segments in the solidified state. Another approach to obtain polymers bearing an intrinsic microporosity is to consider “addition” polymerized polynorbornenes with bulky side groups [16,17]. In the case of these polynorbornenes the microporosity arises, besides from a (semi)stiff chain structure, mainly from the bulky side groups which prevent conformational changes causing an ineffective chain packing in the solid state. In this group, polynorbornenes with Si-substituted bulky sides gain some importance [18,19,20].
The diffusivity of a gas molecule in a membrane based on polymers is related to its (effective) size. This means the minimal diameter of a gas molecule enabling its transport through a dynamic or rigid bottleneck in a polymer. Often the effective kinetic diameter is employed for such considerations, which can be obtained from experiments with zeolites [4,21,22,23]. Therefore, based on the solution diffusion model the permselectivity of high-performance polymers for membranes can be discussed in a frame of discrimination to the effective diameter of the considered gas molecule.
It is known that PIMs have a quite high permeability combined with a reasonable selectivity. The same is true for polynorbornenes bearing a microporosity with large values of BET surface area. Because of the interconnected pore network, the latter point is surprising as a more Knudsen-like transport should be expected rather than a size-depending, activated sieving mechanism. For thermally rearranged polymers and PIMs an approximate linear relationship between the diffusivity and the effective diameter of the gas molecules is suggested [24]. A more detailed analysis reveals that there is a transition of a less pronounced pore size dependence observed for H2 and He to a stronger one for gases with a larger effective kinetic diameter such as O2, CO2, N2 and CH4 [25,26]. This is essentially different to the behavior found for glassy polymers such as poly(1-trimethylsilyl-1-propyne) which have permeability values comparable to PIMs but lower permselectivities. Moreover, molecular dynamic simulations show the existence of characteristic bottlenecks which form windows between the different free volume elements [25,27]. The bottlenecks have sizes between the effective diameter for H2 and He and that of gasses with larger sizes. This means gas molecules with smaller sizes can diffuse through these bottlenecks without restrictions whereas for gasses with larger effective diameters their passage relates to the dynamics of the characteristic bottlenecks which is due to the molecular mobility of the polymer. Even localized fluctuations can open or close these bottlenecks for the transport of gas molecules with a larger kinetic diameter. Therefore, it is important to understand the molecular mobility and the vibrations in polymers of intrinsic microporosity as even fluctuations of small groups can open or partly close these bottlenecks and so might be relevant for their attractive permselectivities.
Quasi-elastic neutron scattering has been utilized study the microscopic mobility of such high-performance polymers [28,29,30]. Molecular fluctuations with characteristic time ranges of picoseconds at room temperatures are found to be important for the gas transport properties of polymers. Additionally, a correlation between the measured diffusion coefficient of gas molecules and the neutron data has been discussed [30]. This discussion was made in terms of a random gate model introduced by Kanaya [29]. In these considerations it is also assumed that localized fluctuations can play the role of door openers at bottlenecks between free volume elements. More recently, quasi-elastic neutron scattering studies have been reported for PIM-1 [31] and for highly permeable polynorbornenes [32]. In these investigations also the role of localized mobility is emphasized for gas transport through microporous polymers.
Besides molecular mobility, vibrations are important characteristics for materials. In difference to crystals, disordered materials such as polymers are characterized by additional contributions to the low frequency vibrational density of states g(ω) (VDOS, ω—angular frequency) in comparison to the VDOS g(ω) predicted by the sound wave model of Debye [33]. These excess vibrations are observed in the frequency range of ω = 0.2–1 ps−1 which corresponds to an energy range 1–5 meV. In the representation g(ω)/ω2 these excess contributions result in a peak, known as the Boson peak (BP) [34,35]. Although the molecular origin of the BP is discussed for a long time, currently there is no general agreement reached about it. Further, there is an intense discussion of how the low frequency density of states is related to the thermodynamic state of the considered material [35]. There are several groups of theoretical approaches to the Boson peak. In the soft potential model, the BP is assigned to quasi-localized excitations in a soft potential which are characteristic for the amorphous state, and which do not exist in the highly ordered crystalline structure [36,37,38]. In this picture the quasi-localized modes are assumed to be different from sound waves. In a further group of theoretical considerations it is assumed that the Boson peak is related to the van Hove-singularity of the corresponding (hypothetical) crystalline system which is for the amorphous state broadened and shifted on the frequency scale due to the disorder [39]. In a somehow intermediate approach pioneered by Schirmacher [40], the corresponding excitations are considered to have properties of soundwaves, but the BP is not a modification of the van Hove-singularity. “Soft spots” are considered reminiscent to the first group of theories [41]. Additionally, it was shown by numerical calculation that the Boson peak can be also ascribed to a breaking of center-inversion symmetry on a localized scale [42].
As evidenced by results found for low molecular weight glass formers and polymers also including confinement investigations, the Boson peak of amorphous materials is related to collective effects for instance sound waves [43,44,45,46,47]. Moreover, direct experimental relationships between the Boson peak and the thermodynamic state were discussed for geological aged amber [48,49], vapor deposited ultra-stable glasses [50,51] and polymer spheres [52]. Recently a correlation was found of the maximum frequency of the Boson peak and the microporosity described by the BET surface area for microporous polynorbornenes and PIM-1 [53].
Here, the microscopic diffusion in two polymers of intrinsic microporosity, PIM-EA-TB (CH3) [13,54] and the demethylated counterpart PIM-EA-TB(H2) [55] is investigated by neutron backscattering. In detail elastic or fixed window scans are used to characterize the molecular mobility in these two polymers on a time scale that corresponds to the resolution of the instrument (ca. 2 ns). Moreover, a comparison is made to the molecular mobility of PIM-1 [31] and one microporous polynorbornene PTCNSi1 [19,20]. Elastic scans and quasi-elastic neutron scattering data for PTCNSi1 can be found elsewhere [32].
In addition to the molecular mobility the VDOS is investigated by inelastic neutron scattering using a time-of-flight (TOF) instrument. Detailed comparison is made to the VDOS of PIM-1 [56] and that of microporous polynorbornenes [54].

2. Materials and Methods

Materials: As model polymers of intrinsic microporosity first PIM-EA-TB(CH3) is considered [13,55]. Its chemical structure is given in Figure 1, where the synthesis of it is described elsewhere [13]. The molecular weight of the polymer is 155,800 g/mol. The microporosity of PIM-EA-TB(CH3) characterized by the corresponding BET surface value is found to be 1030 m2/g.
Due to the stiff and contorted backbone structure of PIM-EA-TB(CH3) the glass transition temperature could not be estimated by normal differential scanning calorimetry. By employing fast scanning calorimetry, the kinetics of the glass transition and thermal degradation can be disentangled, and 663 K could be estimated as glass transition temperature for a heating rate of 104 K/s [57].
In addition to PIM-EA-TB(CH3), PIM-EA-TB(H2) can be prepared which has the same backbone as PIM-EA-TB(CH3) but no methyl groups (see Figure 1) For the details of the synthesis (see [57]). Its molecular weight is estimated to 62,000 g/mol where the BET surface area is 845 cm2/g.
For comparison also the chemical structure of PIM-1 is given which is the archetype of polymers of intrinsic microporosity. The BET surface values of the polymers discussed here are summarized in Table 1.
For sample preparation, both polymers were solved in chloroform. The concentration of the solution was adjusted to a value that the final films will have a thickness which enables an approximately 10% scattering to reduce multiple scattering events. The solution was cast into a mold made from Teflon. The mold was placed in a closed chamber. The atmosphere of the chamber was saturated with the vapor of chloroform. So, the initial evaporation of the solvent from the sample was controlled. After three days a film was formed. Then the mold was transferred to a vacuum oven (oil free vacuum) and annealed at 348 K for three days to evaporate the solvent completely. Finally, the sample was welded in an aluminum sample cell for the measurements. It is important to note that aluminum is nearly transparent for neutrons.
For comparison corresponding data for PIM-1 were included as well as results for the highly permeable super glassy polynorbornene PTCNSi1.
Neutron scattering: Inelastic neutron scattering measurements were carried out at the cold neutron time of flight disk chopper spectrometer (DCS) operated at the NIST Center for Neutron Research [58,59]. It was used in standard configuration that leads to a resolution of 63–66 μeV (full width at half maximum of the energy resolution, depending slightly on the angle). The spectrometer resolution was estimated by a measurement of the sample at 4 K, assuming that all molecular fluctuations and vibrations besides zero-point quantum motions are frozen.
The data from the neutron scattering time-of-flight spectrometer DCS were reduced by the MSLICE procedure of the DAVE software suite [60]. The procedure performs an empty cell subtraction, conversion of TOF to energy transfer, vanadium normalization, and flat-plane self-shielding correction. Energy rebinning was not chosen to preserve the original resolution given by the TOF channels. Binning to angular detector groups of 5° width was chosen instead of q slices because the algorithm used to calculate the VDOS is able to cope with varying q values within a spectrum. The detectors used were in the range 20°–105°. ‘Negative angle’ detectors were not used.
The high flux neutron backscattering spectrometer HFBS [61] operated at the NIST Center for Neutron Research was used in the so-called fixed window mode (elastic scans) to characterize the molecular mobility at a time scale of ca. 2 ns which corresponds to the resolution of the instrument. The resolution of HFBS (full width at half maximum) is 0.87–0.91 μeV for the high angle detectors and 0.99–1.22 μeV for the three lowest detectors (<30°). The applied heating rate was 0.6 K/min for PIM-EA-TB(CH3) and 0.71 K/min for PIM-EA-TB(H2). The counting time for each data point was 1 min, so that the spacing on the temperature axis is 0.66 K and 0.71 K. At the lowest temperature (5 K) the registration of the scattered intensity was extended to 20 min to improve the statistic of that data point because it is used for the normalization of all other points. The empty cell was measured while cooling down the cryostat with an average rate of −0.8 K/min.
The reduction of the elastic scan data from HFBS was done by a self-written Python program. It allows the concatenation of interrupted runs with matching the intensities in case of changes due to re-inserting the sample after a break. In addition, it allows the subtraction of an empty cell run which is not done with the same heating rate or even in cooling (linear interpolation of nearest temperatures). The program neither performs a vanadium normalization nor a self-shielding correction. The resulting indeterminacy of the q-dependent intensity factor is not relevant here because in all further evaluations only the ratio Iel(q, T)/Iel(q, 5 K) is used.

3. Results and Discussion

Due to the wavelength of neutrons, neutron scattering is sensitive to microscopic lengths and time scales [61]. The fundamental experimental quantity is double differential cross-section d 2 σ d Ω   d ω :
d 2 σ d Ω   d ω = 1 4 π   k f k i   ( σ c o h S c o h ( q , ω ) + σ i n c S i n c ( q , ω ) )
Here ω is connected to the energy transfer ΔE = ħω (ħ = Planck’s constant divided by 2 π ). Ω is the solid angle of observation. The incident and the final wave vector of the neutron beam are denoted as ki and kf. There difference gives the scattering vector q = kf − ki. Si( ω , q) (i—coherent, incoherent) are the coherent and incoherent dynamic scattering functions (dynamic structure factors) whose contributions are weighted by the corresponding cross-sections σcoh and σinc for coherent and incoherent scattering, also providing the contrast. The difference between the two terms is that the coherent scattering results from two-particle correlations while the incoherent results from self-correlations. As provided by Figure 1, PIM-EA-TB (CH3) and PIM-EA-TB(H2) consist of carbon (C), hydrogen (H) and nitrogen (N). For PIM-EA-TB(CH3) this results in the macroscopic cross-sections per volume σcoh = 0.0421 and σinc = 0.3896 mm−1 while for PIM-EA-TB(H2) the corresponding values are 0.0416 and 0.3438 mm−1. This indicates a predominately incoherent scattering for both polymers. The majority of the incoherent cross section is from hydrogen atoms. Therefore, the experiments performed here mainly reflect the self-correlation of hydrogen atoms. For details of the calculation of the scattering cross-sections see Supporting Information.
The publication is organized as follows: In the first part the low frequency density of states is considered. A detailed comparison is made to related compounds. The second section focuses on microscopic diffusion as studied by elastic fixed window scans (elastic scans) and in the last and third section it is tried to interrelate both quantities.

3.1. Low Frequency Density of States

Figure 2a shows Sinc(q, ΔE) normalized by the maximum of the elastic line measured at 50 K by DCS for PIM-EA-TB(CH3) while Figure 2b gives the same for PIM-EA-TB(H2). Scattering contributions at an energy transfer of ca. 1 to 2 meV are observed at this temperature compared to the resolution of the spectrometer indicating the Boson peak. The detailed approach to extract the VDOS from Sinc(q, ΔE) is given in [53]. As main input the standard expression for one-phonon scattering [62] is used which defined by:
S ( q , ω ) = e 2 W ( q ) ( δ ( ω ) + ħ q 2 2 m ¯ g ( ω ) ω × ( 1 e x p ( ħ ω k B T ) ) 1 ) .
kB denotes the Boltzmann constant and e 2 W ( q ) is the Debye–Waller factor. m ¯ represents the average mass of an atom. The hydrogen nuclei dynamics is overestimated in the result due to its high scattering cross-section. Nevertheless, assuming that the hydrogen atoms take part proportionately in the total vibrational spectrum of the material in the studied frequency region. Therefore, in a thermodynamic sense the obtained result corresponds to a VDOS.
What is measured during a quasielastic or here inelastic neutron scattering is the convolution of the signal coming from the sample with the resolution of the spectrometer. Compared to the resolution of the instrument the Boson peak is a broad feature. Therefore, the convolution can be approximated by a sum [63]:
S obs ( q , ω ) = R ( q , ω ) S ( q , ω ) e 2 W ( q ) ( R ( q , ω ) + q 2 2 m ¯ g ( ω ) ω × ( 1 exp ( ω k B T ) ) 1 )
By measuring spectra of the sample at two different temperatures (here 4 K and 50 K) from Equation (3) a system of two linear equations is derived. From this system the density of states g(ω) is estimated. The obtained VDOS should be independent of the q vector for principal reasons. Therefore, to increase the accuracy, g(ω) was averaged over the detector range 65°–100° corresponding to elastic scattering vectors q = 1.1–1.6 Å−1.
Figure 3a depicts the density of states in the reduced form g(ω)/ω2 versus frequency. As expected from the raw data PIM-EA-TB(CH3) and PIM-EA-TB(H2) show a Boson peak, where the BP for PIM-EA-TB(CH3) moved to lower frequencies in comparison to that of PIM-EA-TB(H2). This should be expected from a correlation of the maximum frequency of the Boson peak with BET surface area [53] as PIM-EA-TB(CH3) has a higher BET surface area value compared to that of PIM-EA-TB(H2) (see Figure 3a). As discussed above, recently a correlation between the maximum position of the Boson peak and the BET surface area was found for polynorbornenes bearing an intrinsic microporosity (see Figure 3) [53]. The data for PIM-1 fits well to this correlation. This is not the case for the results obtained for PIM-EA-TB(CH3) and PIM-EA-TB(H2). These data points are located above the previously reported correlation line. This might be discussed in the sound wave approach to the Boson peak. In the corresponding theories, a continuum is considered which is described by an elastic modulus. Due to the amorphous character of the materials that elastic modulus is subjected to spatial fluctuations around an average value [64]. One result of this approach is that the BP will move to lower frequencies when a material becomes softer. Investigations to this end were done where the stiffness of materials was changed in a controlled way either by adding another component [65] or by modifying the chemical structure of a materials in a continuous way [66]. In both cases a decrease of the maximum position of the BP was found. Moreover, this line of argumentation was further supported by a study of a nanoconfined discotic liquid crystal [67].
The shift of the maximum of the BP with the increasing BET surface area was discussed in the framework that with increasing microporosity the sponge-like structure of the considered polymers increases. A structure which is more sponge-like (higher BET value) should allow a higher compressibility, at a length scale defined by the lowest q value considered, than a more densely packed structure with a lower BET surface area value. The experimental observation that the data for PIM-EA-TB(CH3) and PIM-EA-TB(H2) have a similar trend regarding the BET surface area evidence that the microporosity is one discriminating parameter but not the only one. One has to consider that in addition the backbone stiffness of PIM-EA-TB(CH3) and PIM-EA-TB(H2) is much higher than that of PIM-1 and the polynorbornenes. A stiffer backbone will lead to a decrease of the local compressibility for the same value of the BET surface area. According to the consideration discussed above this will lead to a shift of the maximum frequency of the Boson peak to higher frequencies for the same value of the BET surface area. A correlation of the maximum position of the Boson peak and the microscopic stiffness was discussed in the literature [68,69,70]. For conventional polymers the chain stiffness is characterized by the characteristic ratio. Due to the ladder-type chain structure this property cannot be defined for PIMs in a senseful manner. Additionally, for the polynorbornenes values of the characteristic ratio are not known. Therefore, a more quantitative comparison could not be established.
In the literature also a relationship is discussed between the position of the Boson peak and the fragility of the material [71,72]. The fragility is estimated from the temperature dependence of the viscosity, or the relaxation rates of glassy dynamics close to the thermal glass transition temperature. As discussed above no glass transition temperature could be measured by conventional calorimetry before the thermal decomposition of the polymers. Therefore, also no temperature of the viscosity or the glassy dynamics could be estimated, and the fragility values remains unknown, and this correlation could not be evaluated here.
It is further interesting to note that the Boson peak for PIM-EA-TB(CH3) has a higher intensity than that of PIM-EA-TB(H2). Currently the intensity of a Boson peak is under controversial discussion and no convincing approach is available. Therefore, this point needs further experimental and theoretical investigations.

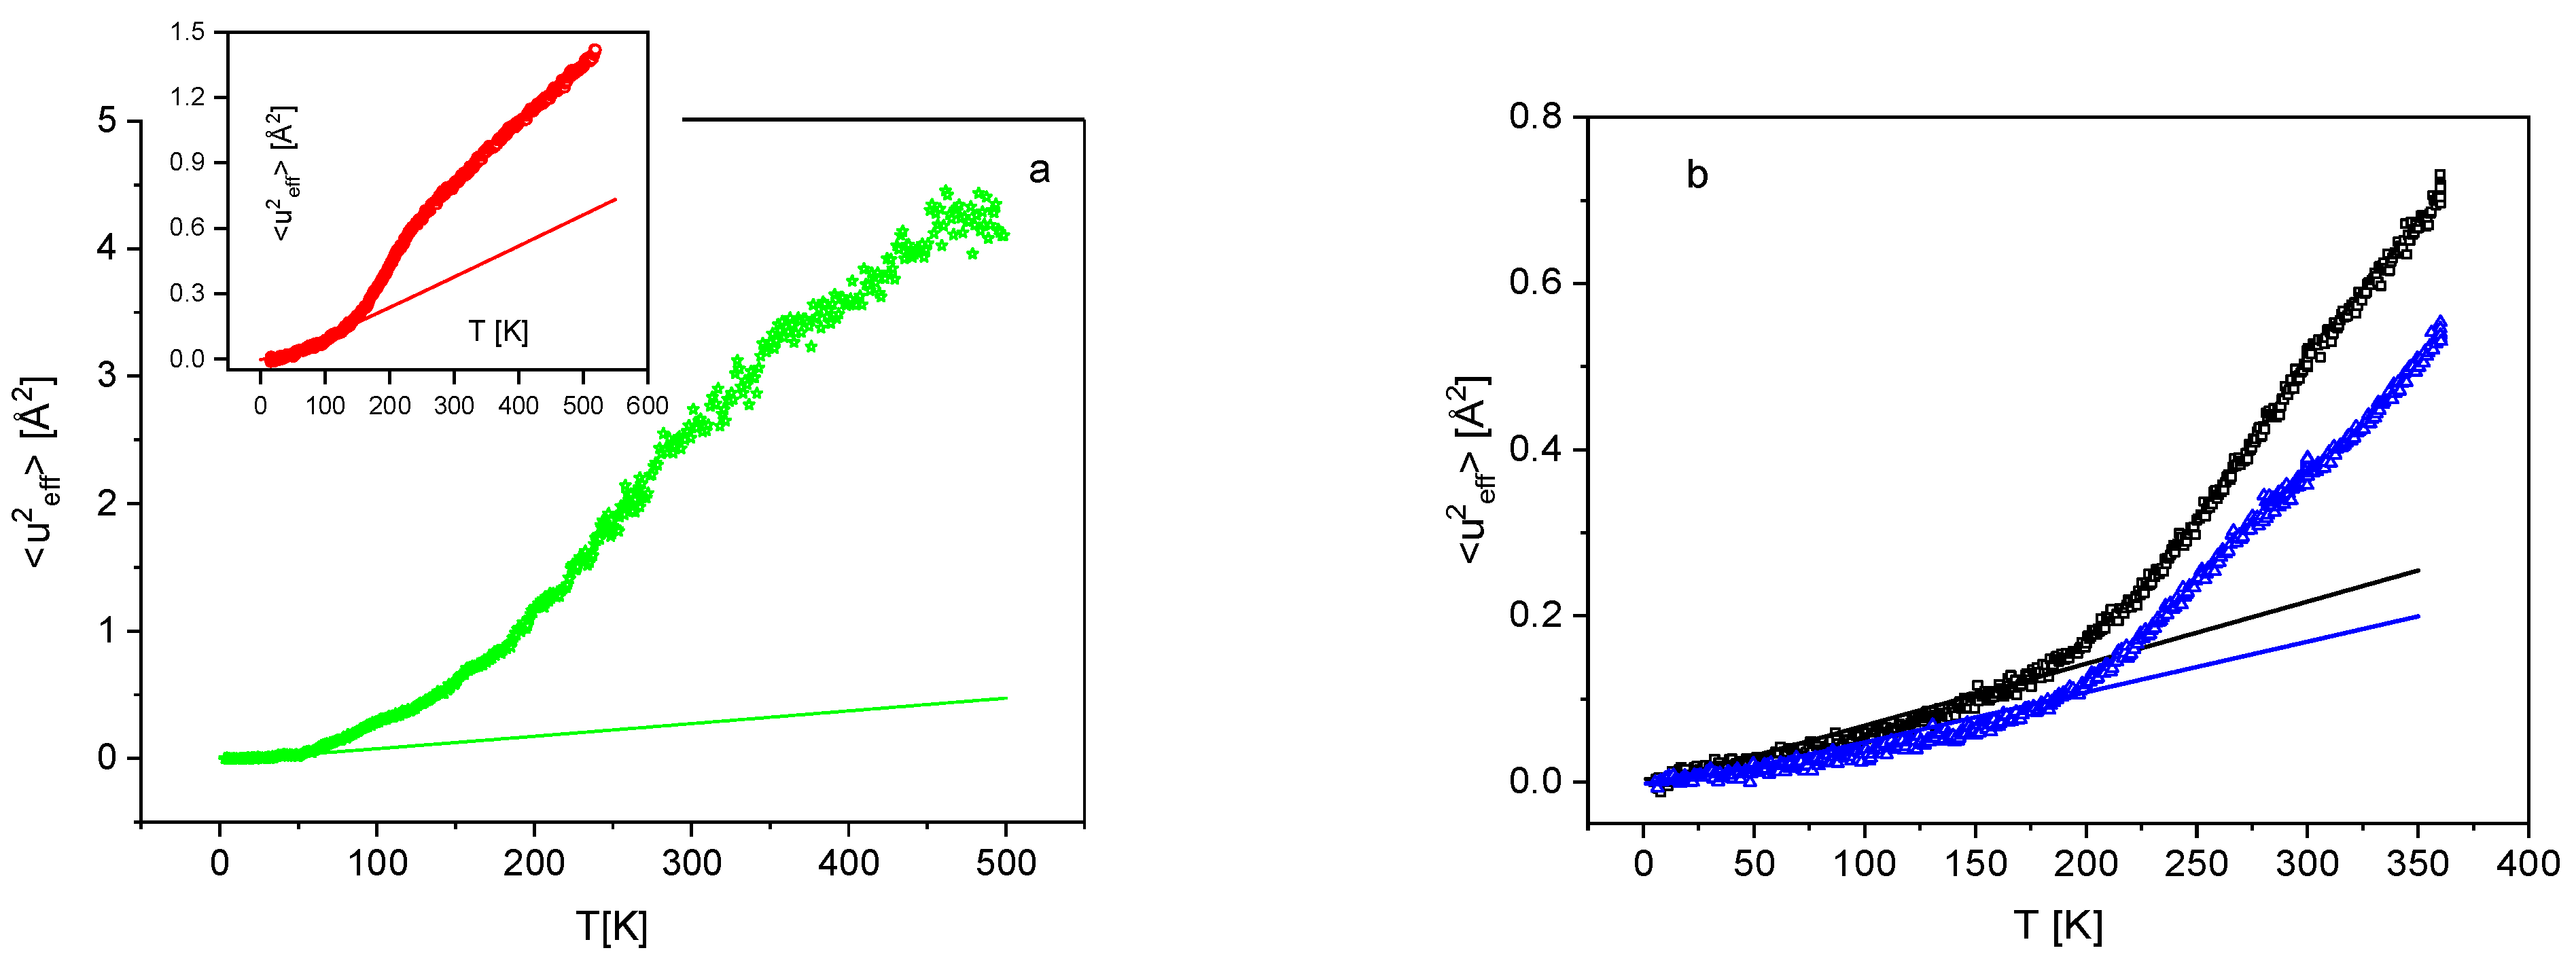
3.2. Microscopic Diffusion

To characterize the microscopic diffusion an effective mean-square displacement <u2eff> was estimated from the elastically scattered intensities measured at HFBS (elastic fixed window scans, ΔE ≈ 0). Such measurements provide information of the molecular mobility at a time scale characterized by the resolution of the backscattering spectrometer (ca. 2 ns). The calculation of <u2eff> was based on the conventional Gaussian form:
I el ( q ) I 0 ( q ) =   e ( q 2 u e f f 2 3 )
with a correction due to multiple scattering [73]. Iel(q) and I0(q) denote the elastically and totally scattered intensities where I0(q) was recorded with an improved statistic at 4 K. As the values of <u2eff> are low compared to those on other experiments employing the fractal model used earlier [74] was unnecessary and even turned out to increase the uncertainty of the results.
Figure 4a compares of the effective mean squared displacement for PIM-EA-TB(CH3), PIM-1 and PTCNSi1 in its temperature dependence. The chemical structure of PTCNSi1 is given as inset in Figure 4a. Figure 4b compares the temperature dependences for PIM-EA-TB(CH3) and PIM-EA-TB(H2).
At low temperatures the temperature dependence of <u2eff> is related to vibrations for all materials. This issue will be further discussed below. For PTCNSi1 a strong step-like change is observed in the temperature dependence of <u2eff> which is assigned partly to the rotation of methyl groups (see also [32]). Additionally, the data for PIM-1 show a step-like increase of the mean squared displacement which was also related to the methyl group rotation of PIM-1 [31]. The onset temperature of the methyl group rotation is shifted to higher temperatures in comparison to PTCNSi1 which is due to a higher activation energy of the methyl group rotation in PIM-1 compared to PTCNSi1 as discussed elsewhere [32]. In the case of PIM-EA-TB(CH3) the effective mean squared displacement is higher than that of PIM-EA-TB(H2). These higher values of <u2eff> must be attributed to the mobility of the methyl group because PIM-EA-TB(H2) has a similar backbone structure as PIM-EA-TB(CH3) but without methyl groups. There seems to be also a step-like change of the effective mean squared displacement at even higher temperatures than the step-like change observed for PIM-1. The only mobile fluctuation that can be imagined from the chemical structure of PIM-EA-TB(CH3) at these temperatures is the rotation of the methyl groups. Therefore, the onset of molecular mobility observed for PIM-EA-TB(CH3) is also assigned to the rotation of methyl groups. This argument is further supported by the experimental result that no step-like change is observed in the temperature dependence of the effective mean squared displacement of PIM-EA-TB(H2) which has no methyl groups in its structure (see inset Figure 1).
At first glance, the different temperature dependence of <u2eff>might be related to the fact that a different number of methyl groups is present in the different materials. While PIM-1 has four methyl groups, PTCNSi1 carries three methyl groups and only two methyl groups are present in PIM-EA-TB(CH3). Because the scattering cross-sections of all monomeric units are approximately similar, without a detailed calculation from the chemical structure of the polymers the ratios in the step-height of effective mean squared displacement Δ<u2eff>CH3 should be approximately PIM-1:PTCNSI1:PIM-EA-TB(CH3) = 4:3:2. For a more detailed elaboration, the fraction of the scattering cross-section from the methyl groups fCH3 is considered. The mean squared displacement of a hydrogen atom in a methyl group can easily be calculated in the long-time limit. For a jump length of 1.779 Å which is derived from the geometry of the methyl group, the corresponding mean squared displacement is 1.055 Å2. Multiplying the two values gives the expected step height in the <u2>(T) plot contributed by the methyl groups (see Table 2).
These calculated data were added to Figure 4a as vertical double arrows. For PIM-1 where the measured step-high for the methyl group rotation is smaller than the one calculated here. As it was discussed in [31] the detailed analysis of quasi-elastic neutron scattering shows that a fraction of the methyl groups is immobilized with regard their rotation. A closer inspection of Figure 1c reveals that the arrangement of the methyl in PIM-1 is demanding from the sterically point of view which might lead to blocking of the methyl group rotation. Additionally, for PIM-EA-TB(CH3) the measured step for the methyl group rotation is smaller than the calculated one. This observation points to a blocking of methyl groups such as for PIM-1. This aspect will be further studied by quasi-elastic neutron scattering experiments.
Finally, the step observed in the mean squared displacement for PTCNSi1 is much higher than that predicted. The calculated Δ<u2eff>CH3 would fit the low temperature part of <u2eff> up to ca. 200 K. It is worth to noting that this temperature range was analyzed in [32] to estimate the elastic incoherent structure factor (EISF) for the methyl group rotation in PTNCSi1. The q dependence reveals a jump diffusion in a three-fold potential characteristic for the methyl group rotation. Further, the quantitative analysis gives the fraction of mobile hydrogen nuclei which corresponds to the number of hydrogens present in the methyl groups. The increase of <u2eff>(T) at temperatures above ca. 220 K must be due to the onset of fluctuations that are different from the methyl group rotation. Dielectric investigations on PTCNSi1 show that a β-relaxation sets in at temperatures above 200 K [75]. The β-relaxation will introduce an additional mobility to the polymer matrix.
A scaling procedure as discussed for PTCNSi1, PIM-1 and PIM-EA-TB(CH3) in previous work [31,32] cannot be carried out to compare <u2eff> measured for PIM-EA-TB(CH3) and PIM-EA-TB(H2) because the latter polymer has no methyl groups.
Figure 4b shows that t <u2eff> (T) shows a strong change at ca. 175 K (TBend) for PIM-EA-TB(CH3) and PIM-EA-TB(H2). Such a change in the scattering behavior was related by Colmenero et al. to the onset of a fast dynamics related to the Carbon-Carbon torsional barrier [76]. Considering the backbone structure of PIM-EA-TB such a Carbon-Carbon torsion does not seem possible. Nevertheless, atomistic molecular dynamic simulations carried for PIM-1 indicated some localized fluctuations (bend and flex fluctuation) [77,78]. The change in the temperature dependence of <u2eff> (see inset Figure 4a) might indicate experimentally that such fluctuations are also possible for PIM-EA-TB as also indicated by atomistic molecular dynamic simulations [78]. The change in the temperature dependence of <u2eff> at TBend cannot be assigned to methyl groups because it is observed for PIM-EA-TB(CH3) and PIM-EA-TB(H2). It should be noted that such bend and flex fluctuation are also discussed to be the origin of the glass transition found for PIM-EA-TB(CH3) [59]. Such a change in the temperature dependence of <u2eff> is not clearly observed for PTCNSi1 and PIM-1. In those cases, <u2eff> related to the methyl group rotation is much larger and probably overlay that what is due to the bend and flex fluctuation.
In this section the microscopic diffusion was derived from elastic scans measured by neutron scattering. Localized molecular fluctuations might be of importance to understand the permselectivity in polymers bearing a microporosity because they can be door openers of bottleneck between the interconnected pores.

3.3. Microscopic Dynamics from the Vibrational Density of States

From the vibrational density of states g(ω) the effective mean squared displacement can be calculated by [62]:
u eff 2 = 3 ħ 2   m ¯   0 ω max g ( ω ) ω   coth ( ħ ω 2 k B T )   d ω .
where ωmax is the highest frequency in the vibrational spectrum. The results are given in Figure 5.
Figure 5a shows that the vibrational part of <u2eff> is well described by Equation (5). The same is true for PIM-1 (see inset Figure 5a). For PIM-EA-TB(CH3) and PIM-EA-TB(H2) there is also a reasonable agreement between the measured data and the calculated values (see Figure 5b). Moreover, it becomes also clear from Figure 5b that the change in the temperature dependence of <u2eff> at around 175 K found for PIM-EA-TB(CH3) and PIM-EA-TB(H2) cannot be related to vibrations. This result provides some further evidence that the temperature dependence should be related to the onset of some molecular mobility such as bend and flex fluctuations.

4. Conclusions

Polymers bearing an intrinsic microporosity are attractive materials for gas separation membranes as active layer. Currently it not well understood why these group has a reasonable permselectivity values in addition to high permeabilities.
Here, the low frequency density of states (Boson peak) and the molecular mobility at a time scale of 2 ns is investigated for PIM-EA-TB(CH3) and its demethylated counterpart PIM-EA-TB(H2) by neutron scattering employing inelastic neutron scattering at a time-of-flight spectrometer (low frequency density of states) and elastic fixed window scans on a backscattering device (microscopic diffusion). A detailed comparison is made to the archetype of polymers of intrinsic microporosity, PIM-1, and to the highly permeable polynorbornene PTCNSi1 which also bears an intrinsic microporosity. The investigation is motivated by the idea that vibrations and especially localized molecular fluctuations can play the role door openers of bottlenecks between pores to allow for the diffusion of gasses.
It was found that the maximum frequency position of the Boson peak shifts on the one hand to lower frequency values with increasing microporosity characterized by the BET surface value. On the other hand, the comparison with other polymers having also an intrinsic microporosity reveals that other parameters such as the stiffness of the polymer backbone will influence the frequency position of the Boson peak too.
From the elastic fixed window scans an effective mean squared displacement was calculated. As a result, it as was found that <u2eff> is higher for PIM-EA-TB(CH3) compared to PIM-EA-TB(H2). This difference was attributed to the methyl groups present in PIM-EA-TB(CH3) but not in PIM-EA-TB(H2). A small step-like change is present in the temperature dependence of <u2eff> measured for PIM-EA-TB(CH3) which might indicate the onset of the methyl group rotation in that polymer. The temperature dependence of the effective mean squared displacement of PIM-EA-TB(CH3) is compared with that found for PIM-1 and PTCNSi1, where an estimation of the increments of <u2eff>(T) due to the methyl groups deduced from the chemical structure is employed. Further a kink-like change was found in the temperature dependence of <u2eff> for PIM-EA-TB(CH3) and PIM-EA-TB(H2) at ca. 175 K (TBend) which is at temperatures below the onset of the methyl group rotation. This change in <u2eff>(T) was assigned to the onset of a localized molecular mobility such as bend and flex fluctuations predicted by atomistic molecular dynamic simulations. This argumentation was supported by a comparison of the <u2eff> values measured with that calculated from the low frequency density of states. The presented studies will be extended by quasi-elastic neutron scattering experiments to characterize the molecular mobility and diffusion in these systems in more detail. Furthermore, the data will be correlated to the results of gas transport measurements.

Author Contributions

A.S. concepted and lead the investigation; R.M.-E. and N.B.M. synthesized PIM-EA-TB(CH3) and PIM-EA-TB(H2); M.A.K. prepared the samples, R.Z., P.S.; M.T. and A.S. conducted the neutron scattering experiments; R.Z., M.T. and A.S. carried out data reduction and analysis, M.B. contributed substantially to the discussion, R.Z.; P.S. and A.S., wrote the manuscript. All authors have read and agreed to the published version of the manuscript.

Funding

This research received no external funding.

Institutional Review Board Statement

Not applicable.

Informed Consent Statement

Not applicable.

Data Availability Statement

The data presented in this study are available on request from the corresponding author.

Acknowledgments

Access to HFBS was provided by the Center for High Resolution Neutron Scattering, a partnership between the National Institute of Standards and Technology and the National Science Foundation under agreement no. DMR-1508249.

Conflicts of Interest

The authors declare that there is no conflict of interest.

References

  1. Wijmans, J.G.; Baker, R.W. The solution-diffusion model: A review. J. Membr. Sci. 1995, 107, 1–21. [Google Scholar] [CrossRef]
  2. Baker, R.W. Membrane Technology and Applications; John Wiley & Sons: Chichester, UK, 2004. [Google Scholar]
  3. Yampolskii, Y. Polymeric gas separation membranes. Macromolecules 2012, 45, 3298–3311. [Google Scholar] [CrossRef]
  4. Robeson, L.M. The upper bound revisited. J. Membr. Sci. 2008, 320, 390–400. [Google Scholar] [CrossRef]
  5. Swaidan, R.; Ghanem, B.; Pinnau, I. Fine-tuned intrinsically ultramicroporous polymers redefine the permeability/selectivity upper bounds of membrane-based air and hydrogen separations. ACS Macro Lett. 2015, 4, 947–951. [Google Scholar] [CrossRef] [Green Version]
  6. Comesaña-Gándara, B.; Chen, J.; Bezzu, C.G.; Carta, M.; Rose, I.; Ferrari, M.-C.; Esposito, E.; Fuoco, A.; Jansen, J.C.; McKeown, N.B. Redefining the Robeson upper bounds for CO2/CH4 and CO2/N2 separations using a series of ultrapermeable benzotriptycene-based polymers of intrinsic microporosity. Energy Environm. Sci. 2019, 12, 2733–2740. [Google Scholar] [CrossRef] [Green Version]
  7. Freeman, B.D. Basis of permeability/selectivity tradeoff relations in polymeric gas separation membranes. Macromolecules 1999, 32, 375–380. [Google Scholar] [CrossRef]
  8. Robeson, L.M.; Freeman, B.D.; Paul, D.R.; Rowe, B.W. An empirical correlation of gas permeability and permselectivity in polymers and its theoretical basis. J. Membr. Sci. 2009, 341, 178–185. [Google Scholar] [CrossRef]
  9. Higashimura, T.; Masuda, T.; Okada, M. Gas permeability of polyacetylenes with bulky substituents. Polym. Bull. 1983, 10, 114–117. [Google Scholar] [CrossRef]
  10. Masuda, T.; Kawasaki, M.; Okano, Y.; Higashimura, T. Polymerization of methylpentynes by transition metal catalysts: Monomer structure, reactivity, and polymer properties. Polym. J. 1982, 14, 371–377. [Google Scholar] [CrossRef] [Green Version]
  11. Morisato, A.; Pinnau, I. Synthesis and gas permeation properties of poly(4-methyl-2-pentyne). J. Membr. Sci. 1996, 121, 243–250. [Google Scholar] [CrossRef]
  12. Budd, P.M.; Msayib, K.J.; Tattershall, C.E.; Ghanem, B.S.; Reynolds, K.J.; McKeown, N.B.; Fritsch, D. Gas separation membranes from polymers of intrinsic microporosity. J. Membr. Sci. 2005, 251, 263–269. [Google Scholar] [CrossRef]
  13. Carta, M.; Malpass-Evans, R.; Croad, M.; Rogan, Y.; Jansen, J.C.; Bernardo, P.; Bazzarelli, F.; McKeown, N.B. An efficient polymer molecular sieve for membrane gas separations. Science 2013, 339, 303–307. [Google Scholar] [CrossRef] [PubMed]
  14. Hofmann, D.; Heuchel, M.; Yampolskii, Y.; Khotimskii, V.; Shantarovich, V. Free volume distributions in ultrahigh and lower free volume polymers:  Comparison between molecular modeling and positron lifetime studies. Macromolecules 2002, 35, 2129–2140. [Google Scholar] [CrossRef]
  15. Heuchel, M.; Fritsch, D.; Budd, P.M.; McKeown, N.B.; Hofmann, D. Atomistic packing model and free volume distribution of a polymer with intrinsic microporosity (PIM-1). J. Membr. Sci. 2008, 318, 84–99. [Google Scholar] [CrossRef]
  16. Alentiev, D.A.; Bermeshev, M. Design and synthesis of porous organic polymeric materials from norbornene derivatives. Polym. Rev. 2021, 38. [Google Scholar] [CrossRef]
  17. Wang, X.; Wilson, T.J.; Alentiev, D.; Gringolts, M.; Finkelshtein, E.; Bermeshev, M.; Long, B.K. Substituted polynorbornene membranes: A modular template for targeted gas separations. Polym. Chem. 2021, 12, 2947–2977. [Google Scholar] [CrossRef]
  18. Yampolskii, Y.P. A current position of polyacetylenes among other highly permeable membrane materials. Polym. Rev. 2017, 57, 200–212. [Google Scholar] [CrossRef]
  19. Chapala, P.P.; Bermeshev, M.V.; Starannikova, L.E.; Belov, N.A.; Ryzhikh, V.E.; Shantarovich, V.P.; Lakhin, V.G.; Gavrilova, N.N.; Yampolskii, Y.P.; Finkelshtein, E.S. A novel, highly gas-permeable polymer representing a new class of silicon-containing polynorbornens as efficient membrane materials. Macromolecules 2015, 48, 8055–8061. [Google Scholar] [CrossRef]
  20. Gringolts, M.; Bermeshev, M.; Yampolskii, Y.; Starannikova, L.; Shantarovich, V.; Finkelshtein, E. New high permeable addition poly(tricyclononenes) with Si(CH3)3 side groups. synthesis, gas permeation parameters, and free volume. Macromolecules 2010, 43, 7165–7172. [Google Scholar] [CrossRef]
  21. Breck, D.W. Zeolite Molecular Sieves: Structure, Chemistry, and Use; John Wiley & Sons: New York, NY, USA, 1974. [Google Scholar]
  22. Teplyakov, V.; Meares, P. Correlation aspects of the selective gas permeabilities of polymeric materials and membranes. Gas Sep. Purif. 1990, 4, 66–74. [Google Scholar]
  23. Robeson, L.M.; Smith, Z.P.; Freeman, B.D.; Paul, D.R. Contributions of diffusion and solubility selectivity to the upper bound analysis for glassy gas separation membranes. J. Membr. Sci. 2014, 453, 71–83. [Google Scholar] [CrossRef]
  24. Robeson, L.M.; Dose, M.E.; Freeman, B.D.; Paul, D.R. Analysis of the transport properties of thermally rearranged (TR) polymers and polymers of intrinsic microporosity (PIM) relative to upper bound performance. J. Membr. Sci. 2017, 525, 18–24. [Google Scholar] [CrossRef] [Green Version]
  25. Fuoco, A.; Rizzuto, C.; Tocci, E.; Monteleone, M.; Esposito, E.; Budd, P.M.; Carta, M.; Comesañ-Gándara, B.; McKeown, N.B.; Jansen, J.C. The origin of size-selective gas transport through polymers of intrinsic microporosity. J. Mater. Chem. A 2019, 7, 20121–20126. [Google Scholar] [CrossRef]
  26. Malpass-Evans, R.; Rose, I.; Fuoco, A.; Bernardo, P.; Clarizia, G.; McKeown, N.B.; Jansen, J.C.; Carta, M. Effect of the bridgehead methyl substituts on the gas permeabiliby of Tröger‘s-base derived polymers of intrinsic microporosity. Membranes 2020, 10, 62. [Google Scholar] [CrossRef] [PubMed] [Green Version]
  27. Mazo, M.; Balabaev, M.; Alentiev, A.; Yampolskii, Y. Molecular dynamics simulation of nanostructure of high free volume polymers with SiMe3 side groups. Macomolecules 2018, 51, 1398–1408. [Google Scholar] [CrossRef]
  28. Inoue, R.; Kanaya, T.; Masuda, T.; Nishida, K.; Yamamuro, O. Relationship between the local dynamics and gas permeability of para-substituted poly(1-chloro-2-phenylacetylenes). Macromolecules 2012, 45, 6008–6014. [Google Scholar] [CrossRef]
  29. Kanaya, T.; Teraguchi, M.; Masuda, T.; Kaji, K. Local mobility of substituted polyacetylenes measured by quasielastic neutron scattering and its relationship with gas permeability. Polymer 1999, 40, 7157–7161. [Google Scholar] [CrossRef]
  30. Kanaya, T.; Kawaguchi, T.; Kaji, K.; Sakaguchi, T.; Kwak, G.; Masuda, T. Role of local dynamics in the gas permeability of glassy substituted polyacetylenes. A quasielastic neutron scattering study. Macromolecules 2002, 35, 5559–5564. [Google Scholar] [CrossRef]
  31. Zorn, R.; Lohstroh, W.; Zamponi, M.; Harrison, W.J.; Budd, P.; Böhning, M.; Schönhals, A. Molecular mobility of a polymer of intrinsic microporosity revealed by quasielastic neutron scattering. Macromolecules 2020, 53, 6731–6739. [Google Scholar] [CrossRef]
  32. Schönhals, A.; Szymoniak, P.; Kolmangadi, M.A.; Böhning, M.; Zamponi, M.; Frick, B.; Appel, M.; Günther, G.; Russina, M.; Alenttiev, D.A.; et al. Microscopic dynamics of highly permeable super glassy polynorbornenes revealed by neutron scattering. J. Membr. Sci. 2021. [Google Scholar] [CrossRef]
  33. Shintani, H.; Tanaka, H. Universal link between the boson peak and transverse phonons in glass. Nat. Mat. 2008, 7, 870. [Google Scholar] [CrossRef] [PubMed]
  34. Zallen, R. The Physics of Amorphous Solids; John Wiley & Sons: New York, NY, USA, 1983. [Google Scholar]
  35. Angell, C.A.; Yue, Y.; Wang, L.-M.; Copley, J.R.; Borick, S.; Mossa, S. Potential energy, relaxation, vibrational dynamics and the boson peak of hyperquenched glasses. J. Phys. Cond. Matt. 2003, 15, S1051. [Google Scholar] [CrossRef] [Green Version]
  36. Malinovsky, V.K.; Novikov, V.N.; Sokolov, A.P. Investigation of structural correlations in disordered materials by Raman scattering measurements. J. Non-Cryst. Solids 1987, 90, 485–488. [Google Scholar] [CrossRef]
  37. Buchenau, U.; Galperin, Y.M.; Gurevich, V.L.; Parshin, A.D.; Ramos, M.A.; Schober, H.R. Interaction of soft modes and sound waves in glasses. Phys. Rev. B Condens Matter Mater. Phys. 1992, 46, 2798–2808. [Google Scholar] [CrossRef]
  38. Laird, B.B.; Schober, H.R. Localized low-frequency vibrational modes in a simple model glass. Phys. Rev. Lett. 1991, 66, 636–639. [Google Scholar] [CrossRef] [Green Version]
  39. Taraskin, S.N.; Loh, Y.L.; Natarajan, G.; Elliott, S.R. Origin of the boson peak in systems with lattice disorder. Phys. Rev. Lett. 2001, 86, 1255–1258. [Google Scholar] [CrossRef]
  40. Schirmacher, W.; Diezemann, G.; Ganter, C. Harmonic vibrational excitations in disordered solids and the “boson peak”. Phys. Rev. Lett. 1998, 81, 136–139. [Google Scholar] [CrossRef] [Green Version]
  41. Wang, Y.; Hong, L.; Wang, Y.; Schirmacher, W.; Zhang, J. Disentangling boson peaks and Van Hove singularities in a model glass. Phys. Rev. B 2018, 98, 174207. [Google Scholar] [CrossRef] [Green Version]
  42. Milkus, R.; Zaccone, A. Local inversion-symmetry breaking controls the boson peak in glasses and crystals. Phys. Rev. B 2016, 93, 094204. [Google Scholar] [CrossRef]
  43. Schönhals, A.; Zorn, R.; Frick, B. Inelastic neutron spectroscopy as a tool to investigate nanoconfined polymer systems. Polymer 2016, 105, 393–406. [Google Scholar] [CrossRef]
  44. Zorn, R.; Mayorova, M.; Richter, D.; Schönhals, A.; Hartmann, L.; Kremer, F.; Frick, B. Effect of nanoscopic confinement on the microscopic dynamics of glass-forming liquids and polymers studied by inelastic neutron scattering. AIP Conf. Proc. 2008, 982, 79–84. [Google Scholar]
  45. Asthalter, T.; Bauer, M.; van Bürck, U.; Sergueev, I.; Franz, H.; Chumakov, A.I. Confined phonons in glasses. Eur. Phys. J. E: Soft Matter Biol. Phys. 2003, 12, S9–S12. [Google Scholar] [CrossRef]
  46. Schönhals, A.; Goering, H.; Schick, C.; Frick, B.; Zorn, R. Glass transition of polymers confined to nanoporous glasses. Colloid Polym. Sci. 2004, 282, 882–891. [Google Scholar] [CrossRef]
  47. Zorn, R. Boson peak in confined disordered systems. Phys. Rev. B: Condens. Matter Phys. 2010, 81, 054208. [Google Scholar] [CrossRef] [Green Version]
  48. Pérez-Castañeda, T.; Jiménez-Riobóo, R.J.; Ramos, M.A. Two-level systems and boson peak remain stable in 110-million-year-old amber glass. Phys. Rev. Lett. 2014, 112, 165901. [Google Scholar] [CrossRef] [Green Version]
  49. Pogna, E.; Chumakov, A.; Ferrante, C.; Ramos, M.; Scopigno, T. Tracking the connection between disorder and energy landscape in glasses using geologically hyperaged amber. J. Phys. Chem. Lett. 2019, 10, 427. [Google Scholar] [CrossRef] [PubMed] [Green Version]
  50. Pérez-Castañeda, T.; Rodríguez-Tinoco, C.; Rodríguez-Viejo, J.; Ramos, M.A. Suppression of tunneling two level systems in ultrastable glasses of indomethacin. Proc. Natl. Acad. Sci. USA 2014, 111, 11275. [Google Scholar] [CrossRef] [Green Version]
  51. Singh, S.; Ediger, M.D.; De Pablo, J.J. Ultrastable glasses from in silico vapour deposition. Nat. Mater. 2013, 12, 139. [Google Scholar] [CrossRef] [PubMed]
  52. Monnier, X.; Colmenero, J.; Wolf, M.; Cangialosi, D. Reaching the ideal glass in polymer spheres: Thermodynamics and vibrational density of states. Phys. Rev. Lett. 2021, 126, 118004. [Google Scholar] [CrossRef] [PubMed]
  53. Zorn, R.; Szymoniak, P.; Kolmangadi, M.; Wolf, M.; Alentiev, D.; Bermeshev, M.; Böhning, M.; Schönhals, A. Low frequency vibrational density of state of highly permeable super glassy polynorbornenes—The Boson peak. Phys. Chem. Chem. Phys. 2020, 22, 8381–18387. [Google Scholar] [CrossRef]
  54. Rose, I.; Bezzu, C.G.; Carta, M.; Comesaña-Gándara, B.; Lasseuguette, E.; Ferrari, M.C.; Bernardo, P.; Clarizia, G.; Fuoco, A.; Jansen, J.C.; et al. Polymer ultrapermeability from the inefficient packing of 2D chains. Nat. Mater. 2017, 16, 932. [Google Scholar] [CrossRef]
  55. Bernardo, P.; Scorzafave, V.; Clarizia, G.; Tocci, E.; Jansen, J.C.; Borgogno, A.; Malpass-Evans, R.; McKeown, N.B.; Carta, M.; Tasselli, F. Thin film composite membranes based on a polymer of intrinsic microporosity derived from Tröger’s base: A combined experimental and computational investigation of the role of residual casting solvent. J. Membr. Sci. 2019, 569, 17–31. [Google Scholar] [CrossRef] [Green Version]
  56. Zorn, R.; Yin, H.; Lohstroh, W.; Harrison, W.; Budd, P.M.; Pauw, B.R.; Böhning, M.; Schönhals, A. Anomalies in the low frequency vibrational density of states for a polymer with intrinsic microporosity—The Boson peak of PIM-1. Phys. Chem. Chem. Phys. 2018, 20, 1355–1363. [Google Scholar] [CrossRef] [Green Version]
  57. Yin, H.; Yang, B.; Chua, Y.Z.; Szymoniak, P.; Carta, M.; Malpass-Evans, R.; McKeown, N.; Harrison, W.J.; Budd, P.M.; Schick, C.; et al. Effect of backbone rigidity on the glass transition of polymers of intrinsic microporosity probed by fast scanning calorimetry. ACS Macro Lett. 2019, 8, 1022–1028. [Google Scholar] [CrossRef]
  58. Copley, J.R.D.; Cook, J.C. The disk chopper spectrometer at NIST: A new instrument for quasielastic neutron scattering studies. Chem. Phys. 2003, 292, 477. [Google Scholar] [CrossRef]
  59. Azuah, R.T.; Kneller, L.R.; Qiu, Y.; Tregenna-Piggott, P.L.W.; Brown, C.M.; Copley, J.R.D.; Dimeo, R.M. DAVE: A comprehensive software suite for the reduction, visualization, and analysis of low energy neutron spectroscopic data. J. Res. Natl. Inst. Stan. Technol. 2009, 114, 341. [Google Scholar] [CrossRef] [PubMed]
  60. Meyer, A.; Dimeo, R.M.; Gehring, P.M.; Neumann, D.A. The high-flux backscattering spectrometer at the NIST Center for Neutron Research. Rev. Sci. Inst. 2003, 74, 2759–2777. [Google Scholar] [CrossRef] [Green Version]
  61. Bée, M. Quasielastic Neutron Scattering, Principles and Applications in Solid State Chemistry, Biology and Materials Science; CRC Press: Boca Raton, FL, USA, 1988. [Google Scholar]
  62. Lovesey, S.W. Theory of Neutron Scattering from Condensed Matter; Oxford University: New York, NY, USA, 1987; Volume 1, p. 121. [Google Scholar]
  63. Zorn, R.; Hartmann, L.; Frick, B.; Richter, D.; Kremer, F.J. Inelastic neutron scattering experiments on the dynamics of a glass-forming material in mesoscopic confinement. Non-Cryst. Solids 2002, 307, 547–554. [Google Scholar] [CrossRef]
  64. Schirmacher, W.; Schmid, B.; Tomaras, C.; Viliani, G.; Baldi, G.; Ruocco, G.; Scopigno, T. Vibrational excitations in systems with correlated disorder. Phys. Status Solidi C 2008, 5, 862–866. [Google Scholar] [CrossRef] [Green Version]
  65. Cicerone, M.T.; Soles, C.L. Fast dynamics and stabilization of proteins: Binary glasses of trehalose and glycerol. Biophys. J. 2004, 86, 3836–3845. [Google Scholar] [CrossRef] [Green Version]
  66. Krause, C.; Zorn, R.; Emmerling, F.; Falkenhagen, J.; Frick, B.; Huber, P.; Schönhals, A. Vibrational density of states of triphenylene based discotic liquid crystals: Dependence on the length of the alkyl chain. Phys. Chem. Chem. Phys. 2014, 16, 7324–7333. [Google Scholar] [CrossRef] [PubMed] [Green Version]
  67. Krause, C.; Zorn, R.; Frick, B.; Schönhals, A. Thermal properties and vibrational density of states of a nanoconfined discotic liquid crystal. Colloid Polym. Sci. 2014, 292, 1949–1960. [Google Scholar] [CrossRef]
  68. DeGiuli, E.; Laversanne-Finot, A.; Düring, G.; Lerner, G.; Wyart, M. Effects of coordination and pressure on sound attenuation, boson peak and elasticity in amorphous solid. Soft Matter 2014, 10, 5628–5644. [Google Scholar] [CrossRef] [PubMed] [Green Version]
  69. Beltukov, Y.M.; Parshin, D.A. Boson peak in various random-matrix models. JETP Lett. 2016, 104, 552–556. [Google Scholar] [CrossRef]
  70. Conyuh, D.A.; Beltukov, Y.M. Random matrix approach to the boson peak and Ioffe-Regeln criterion in amorphous solids. Phys. Rev. B 2021, 103, 104204. [Google Scholar] [CrossRef]
  71. Sokolov, A.P.; Calemczuk, R.; Salce, B.; Quittmann, D.; Duval, E. Low- temperature anomalies in strong and fragil glass formers. Phys. Rev. Lett. 1997, 73, 2405. [Google Scholar] [CrossRef]
  72. Srivastava, S.; Das, S.P. Fragility and boson peak formation in a supercooled liquid. Phys. Lett. A 2001, 286, 76–79. [Google Scholar] [CrossRef] [Green Version]
  73. Zorn, R. Multiple scattering correction of neutron scattering elastic scans. Nucl. Instr. Meth. A 2007, 572, 874–881. [Google Scholar] [CrossRef]
  74. Zorn, R. On the evaluation of neutron scattering elastic scan data. Nucl. Instr. Meth. A 2009, 603, 439–445. [Google Scholar] [CrossRef]
  75. Yin, H.; Chapala, P.; Bermeshev, M.; Pauw, B.R.; Schönhals, A.; Böhning, M. Influence of trimethylsilyl side groups on the molecular mobility and charge transport in highly permeable glassy polynorbornenes. ACS Appl. Polym. Sci. 2019, 1, 844–855. [Google Scholar] [CrossRef]
  76. Colmenero, J.; Arbe, A. Carbon-carbon torsional barriers driving the fast dynamics in glass-forming polymers. Phys. Rev. B 1998, 57, 1358–13513. [Google Scholar] [CrossRef]
  77. Golzar, K.; Modarress, H.; Amjad-Iranagh, S. Effect of pristine and functionalized single- and multi-walled carbon nanotubes on CO2 separation of mixed matrix membranes based on polymers of intrinsic microporosity (PIM-1): A molecular dynamics simulation study. J. Mol. Model. 2017, 23, 266. [Google Scholar] [CrossRef] [PubMed]
  78. Kupgan, G.; Abbot, L.J.; Hart, K.E.; Colina, C.M. Modeling amorphous microporous polymers for CO2 capture and separations. Chem. Rev. 2018, 11, 5488–5538. [Google Scholar] [CrossRef] [PubMed]
Figure 1. Chemical structure of the investigated PIMs: (a) PIM-EA-TB (CH3), (b) PIM-EA-TB (H2) and (c) PIM-1.
Crystals 11 01482 g001
Figure 2. Sinc(q, ΔE) normalized by the maximum of the elastic line measured for (a) PIM-EA-TB(CH3) and (b) PIM-EA-TB(H2) at DCS at 50 K compared to the spectrometer obtained by measuring the sample at 4 K. The data were averaged over all angles.
Crystals 11 01482 g002
Figure 3. (a) Low frequency density of states divided by ω2 vs. frequency for PIM-EA-TB (CH3) (red squares) and PIM-EA-TB(H2) (blue circles). The lines are guides for the eyes. (b) Maximum frequency of the Boson peak versus BET surface area. Squares—Matrimid, data was taken from [58]. Asterisks—polynorborenes, where the data was taken from [53], Circles—Polymers of intrinsic microporosity as indicated. The data for PIM-1 was taken form [56]. Lines are guides for the eye.
Crystals 11 01482 g003
Figure 4. (a) Temperature dependence of <u2eff>: Black squares—PIM-EA-TB(CH3), red circles—PIM-1 and green asterisks—PTCNSi1. The dashed lines are guides for the eyes. The vertical solid lines give the theoretical contribution of the methyl groups to <u2eff>. The color code is same than for the materials. (b) Comparison of <u2eff> for PIM-EA-TB(CH3) (black squares) with that of PIM-EA-TB(H2) (blue triangles). Lines are guides for the eye.
Crystals 11 01482 g004
Figure 5. (a) Comparison of the measured effective mean squared displacement (green asterisks) with that calculated by Equation (5) (green line) for PTCNSi1. The inset shows the same for PIM-1: red circles -measured; red line calculated. (b) Comparison of the measured <u2eff> for PIM-EA-TB(CH3) (black squares) and PIM-EA-TB(H2) (blue triangles) with those calculated by Equation (5): black line—PIM-EA-TB(CH3), blue line—PIM-EA-TB(H2). In both (a,b) the <u2eff> values shown have the value due to the removed zero-point motion. Because the experiments start at a finite temperature, the experimental values of <u2eff> were shifted to coincide with the theoretical vibrational at the lowest temperature of the experiment.
Crystals 11 01482 g005
Table 1. BET surface values for the discussed polymers.
PIM-EA-TB(CH3)PIM-EA-TB(H2)PIM-1PTCNSi1
BET surface area m2/g1030845720610
Table 2. Relative scattering cross-section of the methyl group fCH3 and contribution of the methyl groups to the effective mean squared displacement Δ<u2eff>CH3.
PIM-1PTCNSi1PIM-EA-TB(CH3)
fCH30.5230.4230.271
Δ<u2eff>CH30.552 Ǻ20.446 Ǻ20.286 Ǻ2
Publisher’s Note: MDPI stays neutral with regard to jurisdictional claims in published maps and institutional affiliations.

