Article

Green Synthesis of Ni-Cu-Zn Based Nanosized Metal Oxides for Photocatalytic and Sensor Applications

1
Department of Physics, College of Science, King Faisal University, P.O. Box 400, Hofuf, Al-Hassa 31982, Saudi Arabia
2
Department of Basic Science, Preparatory Year Deanship, King Faisal University, P.O. Box 400, Hofuf, Al-Hassa 31982, Saudi Arabia
3
Department of Biomedical Engineering, Faculty of Engineering King Faisal University, P.O. Box 400, Hofuf, Al-Hassa 31982, Saudi Arabia
4
Research Centre, Department of Chemistry, East West Institute of Technology, VTU, Bangalore-91, Karnataka 560091, India
5
Department of Chemistry, PES University, Karnataka 560085, India
6
Department of Applied Chemistry, School of Applied Natural Sciences, Adama Science and Technology University, Adama 1888, Ethiopia
*
Author to whom correspondence should be addressed.
Crystals 2021, 11(12), 1467; https://doi.org/10.3390/cryst11121467
Submission received: 16 November 2021 / Revised: 21 November 2021 / Accepted: 25 November 2021 / Published: 26 November 2021
(This article belongs to the Section Materials for Energy Applications)

Abstract

:
The preparation, characterization, and application of Nickel oxide (NiO)–Copper oxide (CuO)–Zinc oxide (ZnO) transition nanometal oxides have significantly enhanced their tunable properties for superior multifunctional performances compared with well-known metal oxides. NiO–CuO–ZnO nano transition metal oxides were synthesized by a simple eco-friendly solution combustion method. X-ray diffraction studies revealed distinct phases such as monoclinic, cubic, and hexagonal wurtzite for CuO, NiO, and ZnO, respectively, with NiO having the highest composition. The particle sizes were found to be in the range between 25 and 60 nm, as determined by powder X-ray diffraction. The energy bandgap values were found to be 1.63, 3.4, and 4.2 eV for CuO, ZnO, and NiO, respectively. All metal oxides exhibited a moderate degradation efficiency for AR88 dye. The results of ultraviolet–visible absorption spectra helped identify the bandgap of metal oxides and a suitable wavelength for photocatalytic irradiation. Finally, we concluded that the electrochemical studies revealed that the synthesized materials are well suitable for sensor applications.

1. Introduction

Developing nations have encountered dangerous environmental risks in the last couple of decades owing to a failure to deliver pure water. More than 10 million individuals were afflicted with different diseases due to water contamination [1], according to the World Health Organization (WHO, 2014). The United Nations (WWAP 2016) recently estimated that one billion people depended largely on water sources [2]. For all creatures and the world economy, clean water is, therefore, an essential component. On the other hand, the organic industry directly disposes of its chemical waste to clean water sources, resulting in many environmental problems [3]. Therefore, for the most important environmental and sustainable growth of human existence, society must guarantee adequate safety measures.
In recent times, researchers have been more interested in nanosized metal oxides as photocatalysts for their possible usefulness in wastewater treatment [3,4,5,6,7,8,9,10,11,12]. Nanosized materials offer improved degradation efficiencies compared with micro and bulk materials because they provide good characteristic outcomes through a quantum containment effect [13]. For the study of photocatalytic and sensing applications, binary metal oxide nanocomposites with distinct morphology and structure are currently being developed, which is an important perspective. Synthetic dyes are widely used in various industries, including textiles, photography, cosmetics, and food, due to their rapid production process. The discharge of industrial effluents into natural water bodies results in polluting both water as well as the environment. In addition to this, 10–15% of the population were negatively affected, the wastewater discharged by these industries is severely hazardous due to the carcinogenic nature of the organic contaminants present. It also has adverse effects on aquatic life. Nanometal oxides are a viable option for the treatment of wastewater and have been used in a range of applications, such as fuel cells, gas sensors, solar cells, water storage, antimicrobial activities [8,9,10,11,12]. The interest shown in synthesizing metal oxides with more appealing morphologies was tremendous. Nanosized metal oxides have been synthesized using various methods since their size, shape, and structure, such as nanospheres, nanowires, nanocombs, nanoleaves, and nanobelts, are related to the characteristics of these nanomaterials [13,14,15,16]. Recent publications have focused on synthesizing nanometal oxides using different physical and chemical techniques, such as sol-gel, hydrothermal, precipitation, thermal breakdown, and combustion methods [7,8,9,10,11,12]. The production of nanosized metal oxide in superior morphological forms or sizes is of growing importance. To synthesize the nanomaterials with desired morphology, high stable a new era of green synthesis has been proposed and this method is gaining interest among many researchers. Primarily, the nanomaterials can be synthesized by green synthesis through regulation, cleaning, and control, and with the remediation process will help to overcome environmental problems. The reduction of derivatives, prevention of waste, and use of safe solvents that are nontoxic to the environment are the basic principles of the green synthesis approach.
As the chemical industry develops, a great deal of industrial waste is increasingly released into the environment, which is highly likely to have negative effects on human immunological function and reproductive system, resulting in neurological and behavioral abnormalities in humans. The treatment or cure for several diseases such as diabetes is still under process therefore it is important to manage the life conditions with this disease. The monitoring of blood glucose levels is considered an important way to early detect this disease and control its side effect. In addition to that, the sensing of blood glucose can be very helpful for patient treatment. The creation of novel sensors has thus become a highly important topic of study to detect chemicals at trace levels. Electrochemical detection methods offer benefits over other traditional approaches [8,14]. One of the fastest expanding fields is electrochemical sensors. To produce oxidation or reduction of an electroactive species, amperometric sensors employ the voltage between a reference and an electrode [14].
The study’s main objective is to use Centella asiatica plant powder as a fuel for the synthesis of metal oxide nanoparticles, such as zinc oxide (ZnO), copper oxide (CuO), and nickel oxide (NiO). The produced distinct metal oxide characteristics were categorized by several techniques, including X-ray diffraction (XRD), transmission electron microscopy (TEM), and energy-dispersive X-ray spectroscopy (EDS). Similarly, the produced metal oxides were applied to degrade Acid red 88 (AR88 MW. 400.38 g/mol) dye by a photocatalytic interaction with ultraviolet (UV) light radiation.

2. Experimental

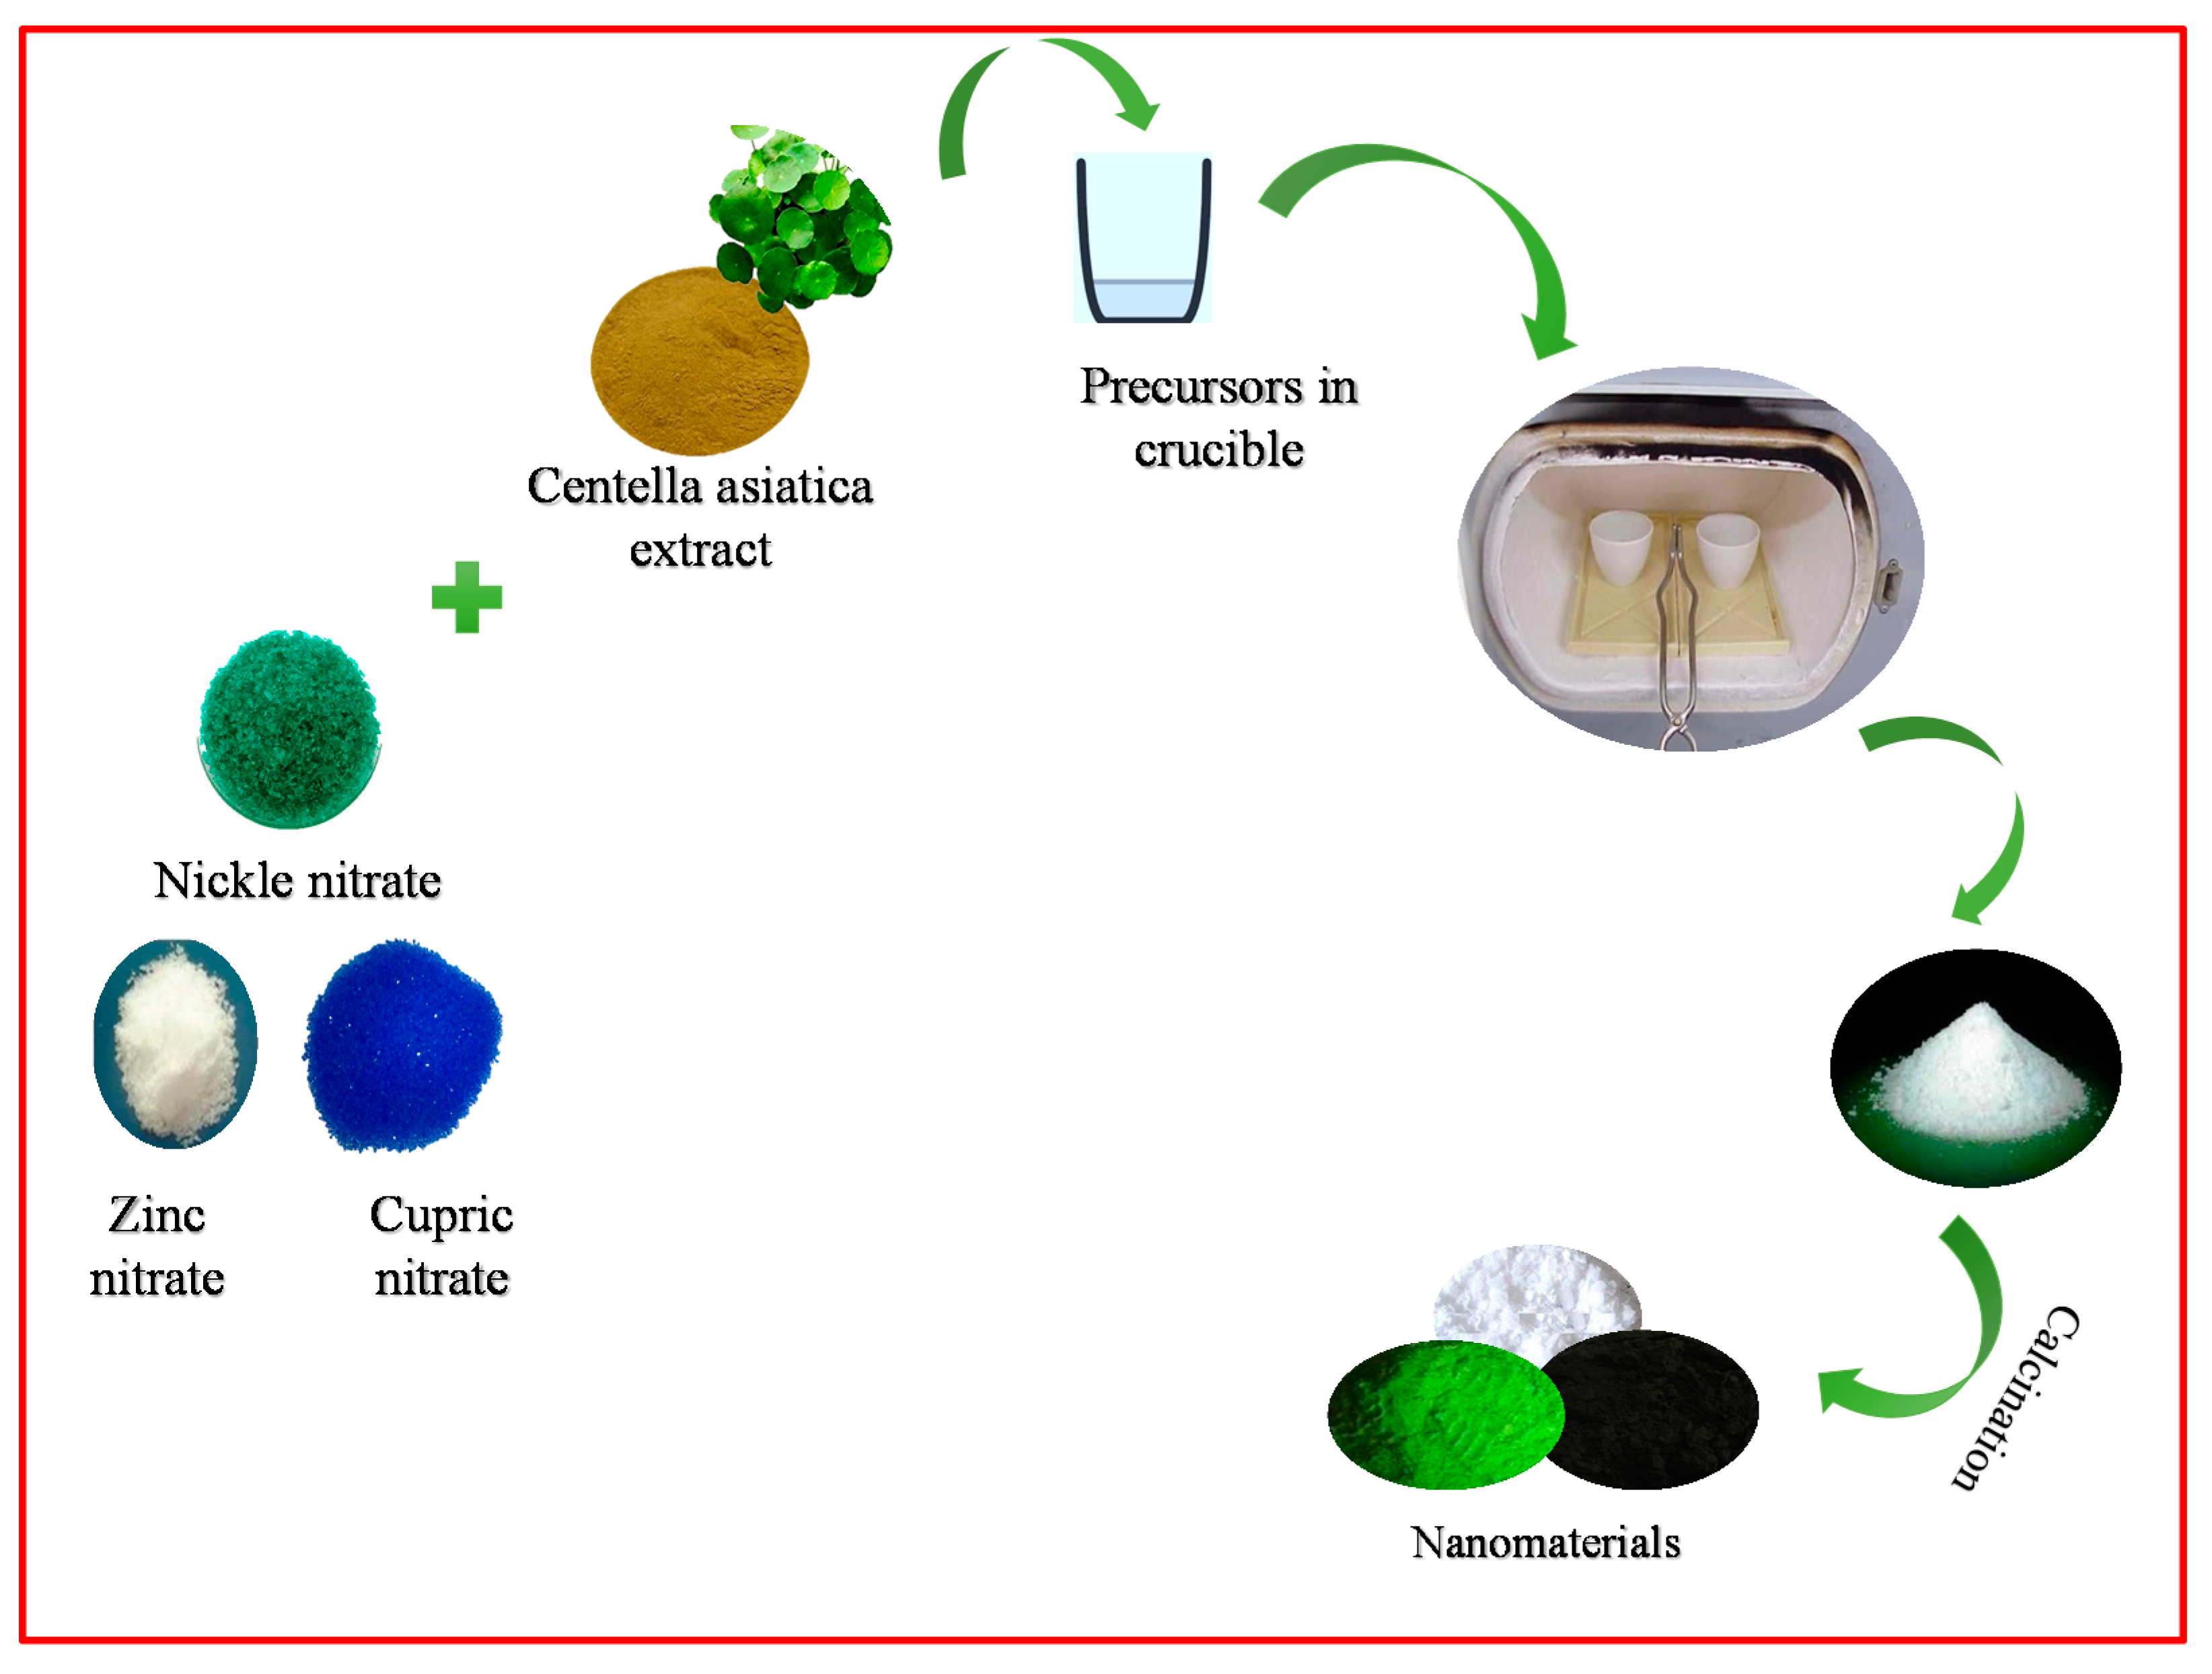
2.1. Preparation of NiO, CuO, and ZnO NPs

NiO, CuO, and ZnO NPs were synthesized using a solution of Centella asiatica plant (India) extract as a green fuel, the dried leaves of Centella Asiatica plant were used to green synthesize NPs by combustion. The plant leaves were subjected to drying in an autoclave and the fine powder was obtained when ground in a mortar. In brief, a stoichiometric measure of 2.0 g of nickel nitrate, cupric nitrate, and zinc nitrate (ACS reagent ≥99.99% purity) (Sigma-Aldrich, St. Louis, MO, USA) was mixed separately with 10 mL of Centella asiatica plant extract used as a fuel to get a homogeneous mixture. The blends were kept in a preheated muffle furnace maintained at 400 ± 10 °C using a silicon crucible. The reaction mixture bubbled to bring out a transparent gel, and later white-colored highly porous powders were left behind in each crucible. Finally, each powder was further calcined at 800 °C to obtain the final product [17]. Figure 1 shows a pictorial representation of the synthesis of NiO, CuO, and ZnO (NCZ).

2.2. Characterization

Powder X-ray diffraction (PXRD) patterns (2θ = 10°–80°) were obtained using a Siemens diffractometer (D5000) (Siemans, Berlin, Germany) with CuKα1 radiation. Functional group analysis was carried out using a Fourier-transform infrared (FTIR) spectrometer (Nicolet Avatar 370, Waltham, MA, USA). TEM was used to examine the morphologies and existent elements within the metal oxides (JEOL JSM 2100, Tokyo, Japan) Diffuse reflectance spectroscopy (DRS) was applied to calculate the metal oxide bandgap energies (performed in the range of 200–800 nm using a Shimadzu UV–vis 1800 double-beam spectrophotometer) (Shimadzu, Tokyo, Japan). The cyclic voltametric (CV) tests were performed on a CHI608E potentiostat (CH Instruments, Inc. Austin, TX, USA).

3. Results and Discussion

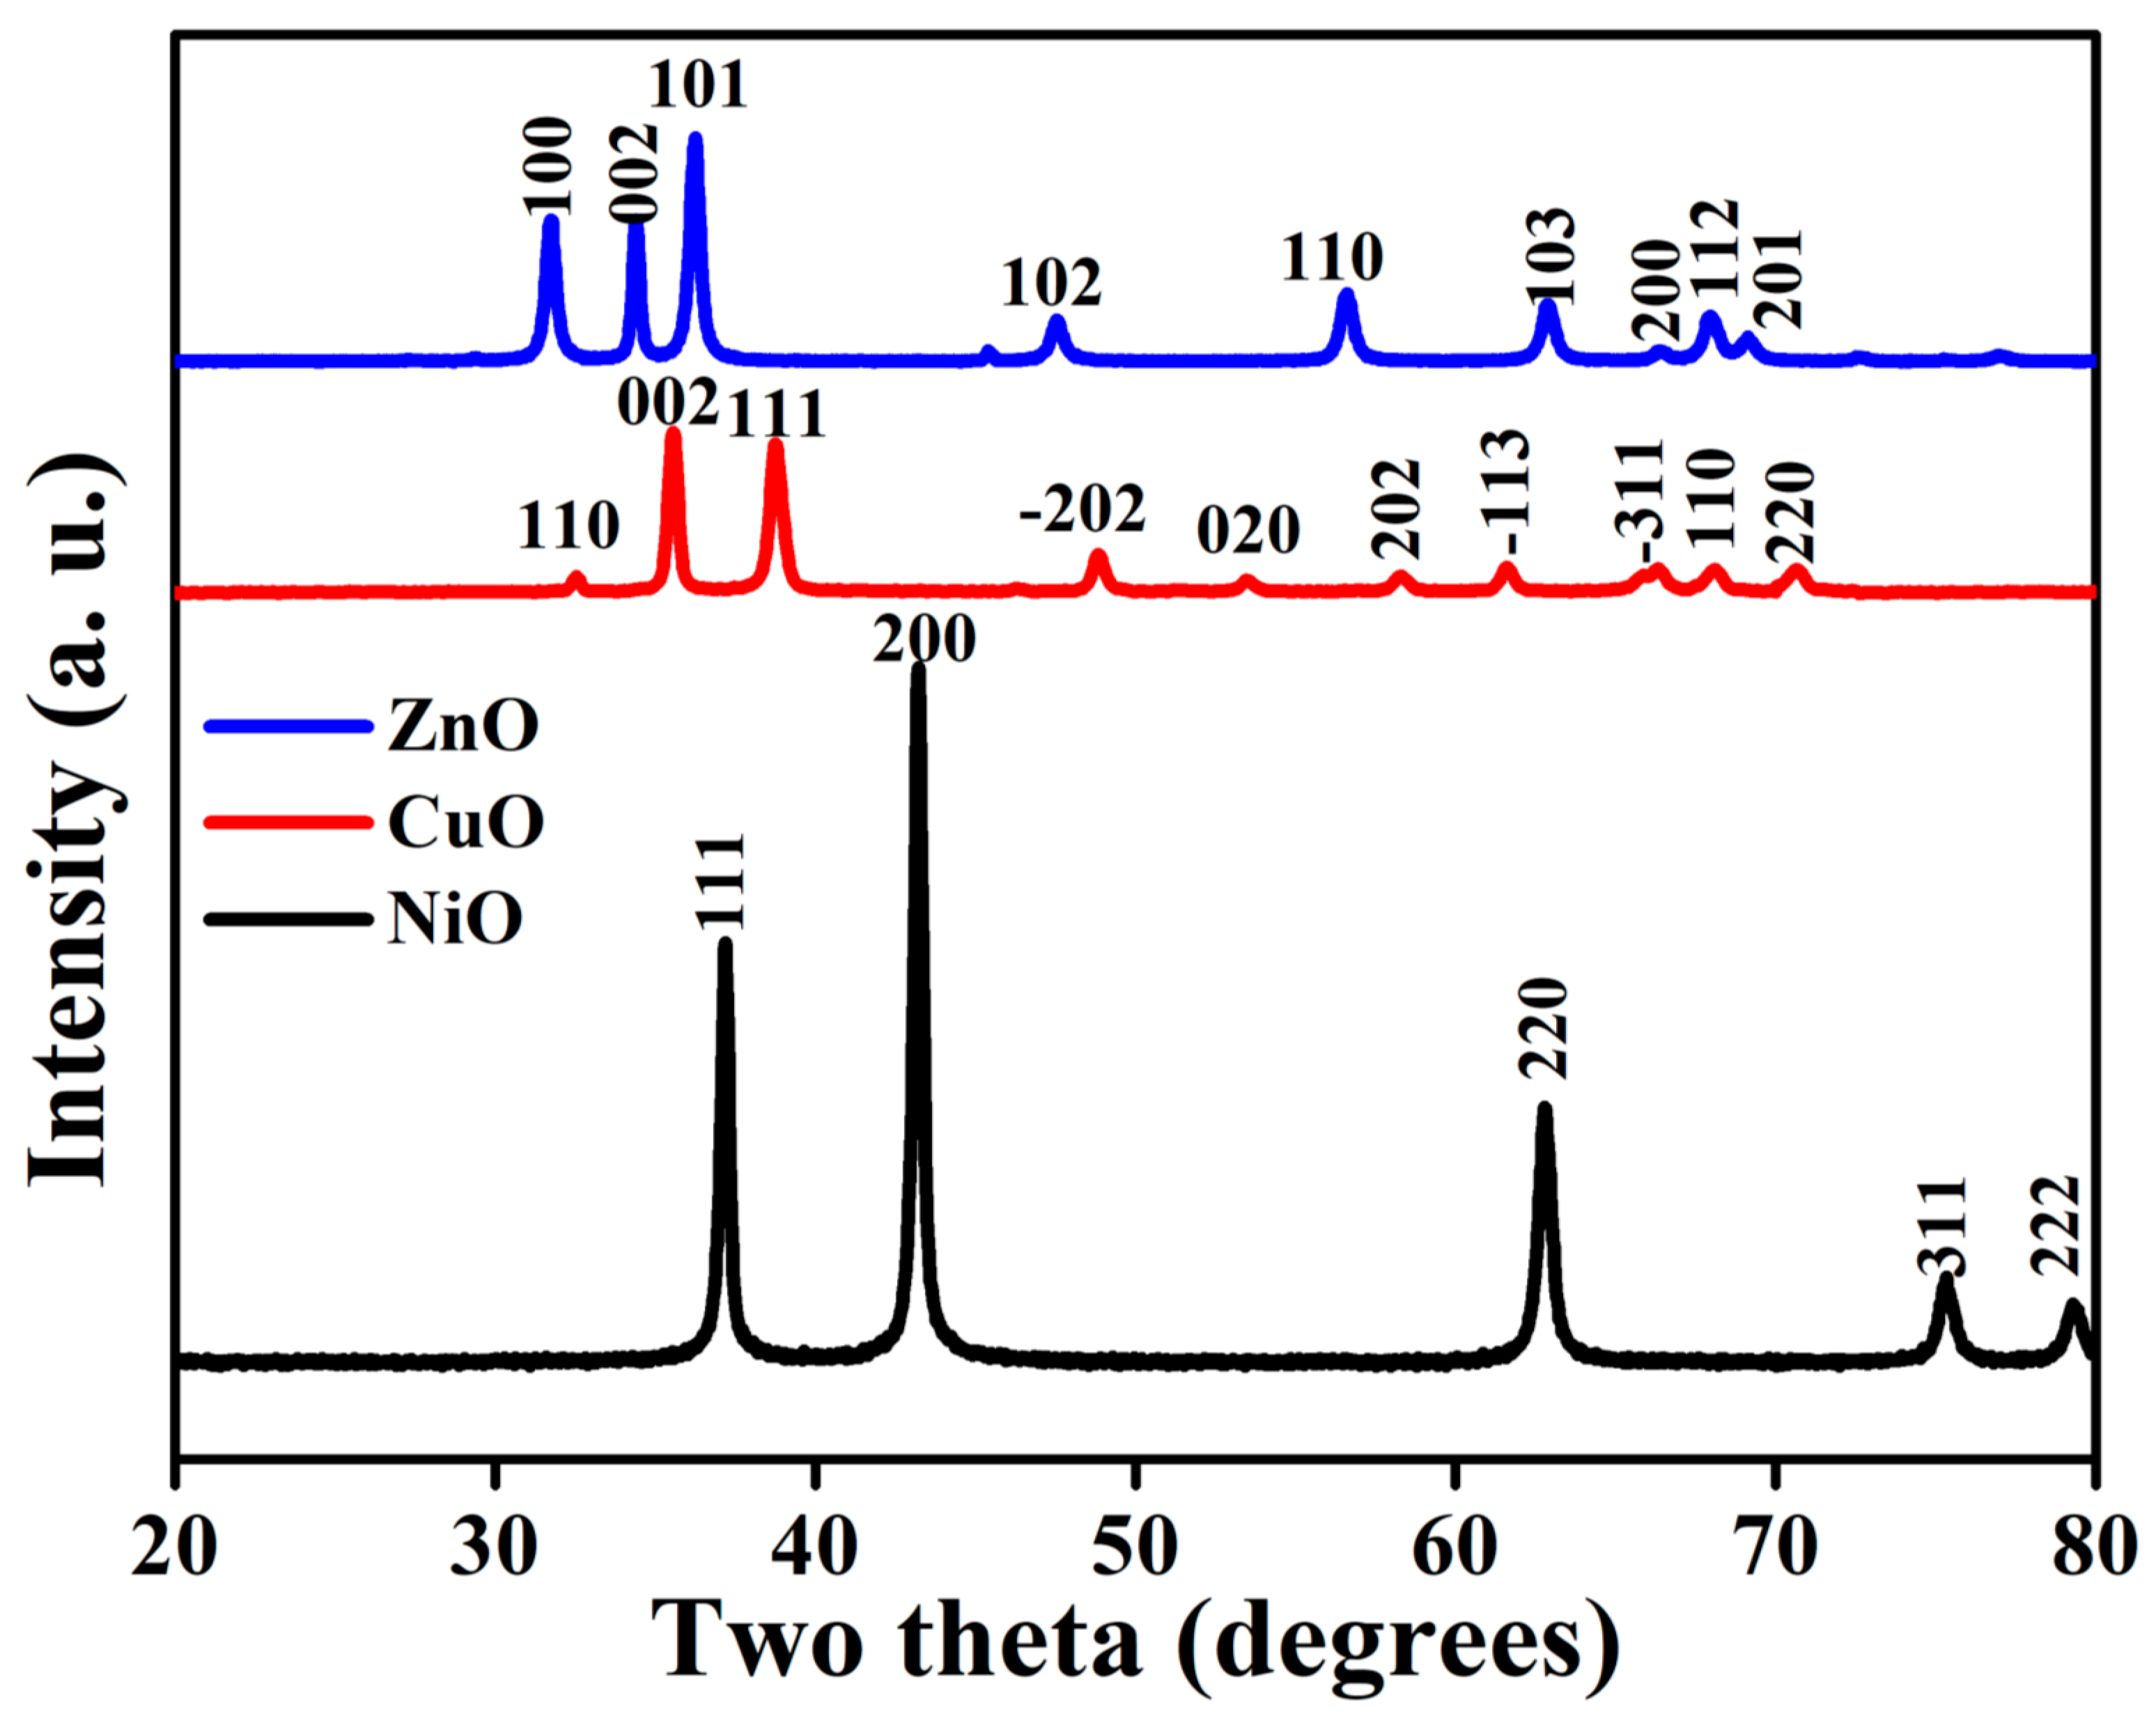
3.1. Structural Analysis

The characteristics of the synthesized metal oxide nanomaterials before conducting the real photocatalytic test were important for categorizing an effective catalyst. The PXRD pattern identified lattice parameters such as crystallinity of the material and structure of metal oxide nanomaterials. The XRD patterns of all the synthesized metal oxides are shown in Figure 2.
The monoclinic structure of CuO was confirmed by the diffraction pattern, and the planes that resembled the monoclinic structure (JCPDS: 80-1916) were (111), (202), (020), and (202), which corresponds to the 2θ values of 38.6°, 48.8°, 53.3°, and 58.2°, respectively [7]. The XRD pattern showed great purity, and no impurity peaks besides CuO were found. The XRD patterns of ZnO NPs are depicted in Figure 2. No impurity peaks were detected in the spectra, and no evidence of any other phase formation was found to be present, indicating that the ZnO was of high purity. In ZnO NPs, the hexagonal phase of zinc oxide with a wurtzite structure was revealed by the appearance of planes (100), (002), (101), (102), (110), and (103), which corresponds to the 2θ values of 31.8, 34.41, 36.27, 47.62, 56.63, 62.93, 66.51, 67.91, and 69.22, respectively [18]. The first, second, third, fourth, and fifth rings, measured from the center, corresponding to the (111), (200), (220), (311), and (222) planes of NiO NPs [7]. Due to the tropism of the particles at random and the small particles, the widening of diffraction rings composed of many diffraction spots is observed, indicating that the NPs have a polycrystalline structure. The polycrystalline structure and the face-centered cubic (FCC) structure were also confirmed by selected area electron diffraction. This is in good agreement with the X-ray results discussed above.
By employing the Debye–Scherrer equation, it was possible to determine the crystallite size of the synthesized metal oxides:
D = K λ β   cos   θ  
where K = 0.9, λ   = 1.54 × 10⁻¹⁰, D is the crystallite size, β is the full width half maximum (FWHM), and θ is the angle of diffraction. It can be noted that metal oxides existed as crystalline NPs with sizes in the range of 25–30 nm, which is consistent with the TEM images shown in Figure 4. The average crystallite size of the metal oxide NPs was computed using the Debye–Scherrer formula, as shown in Table 1.

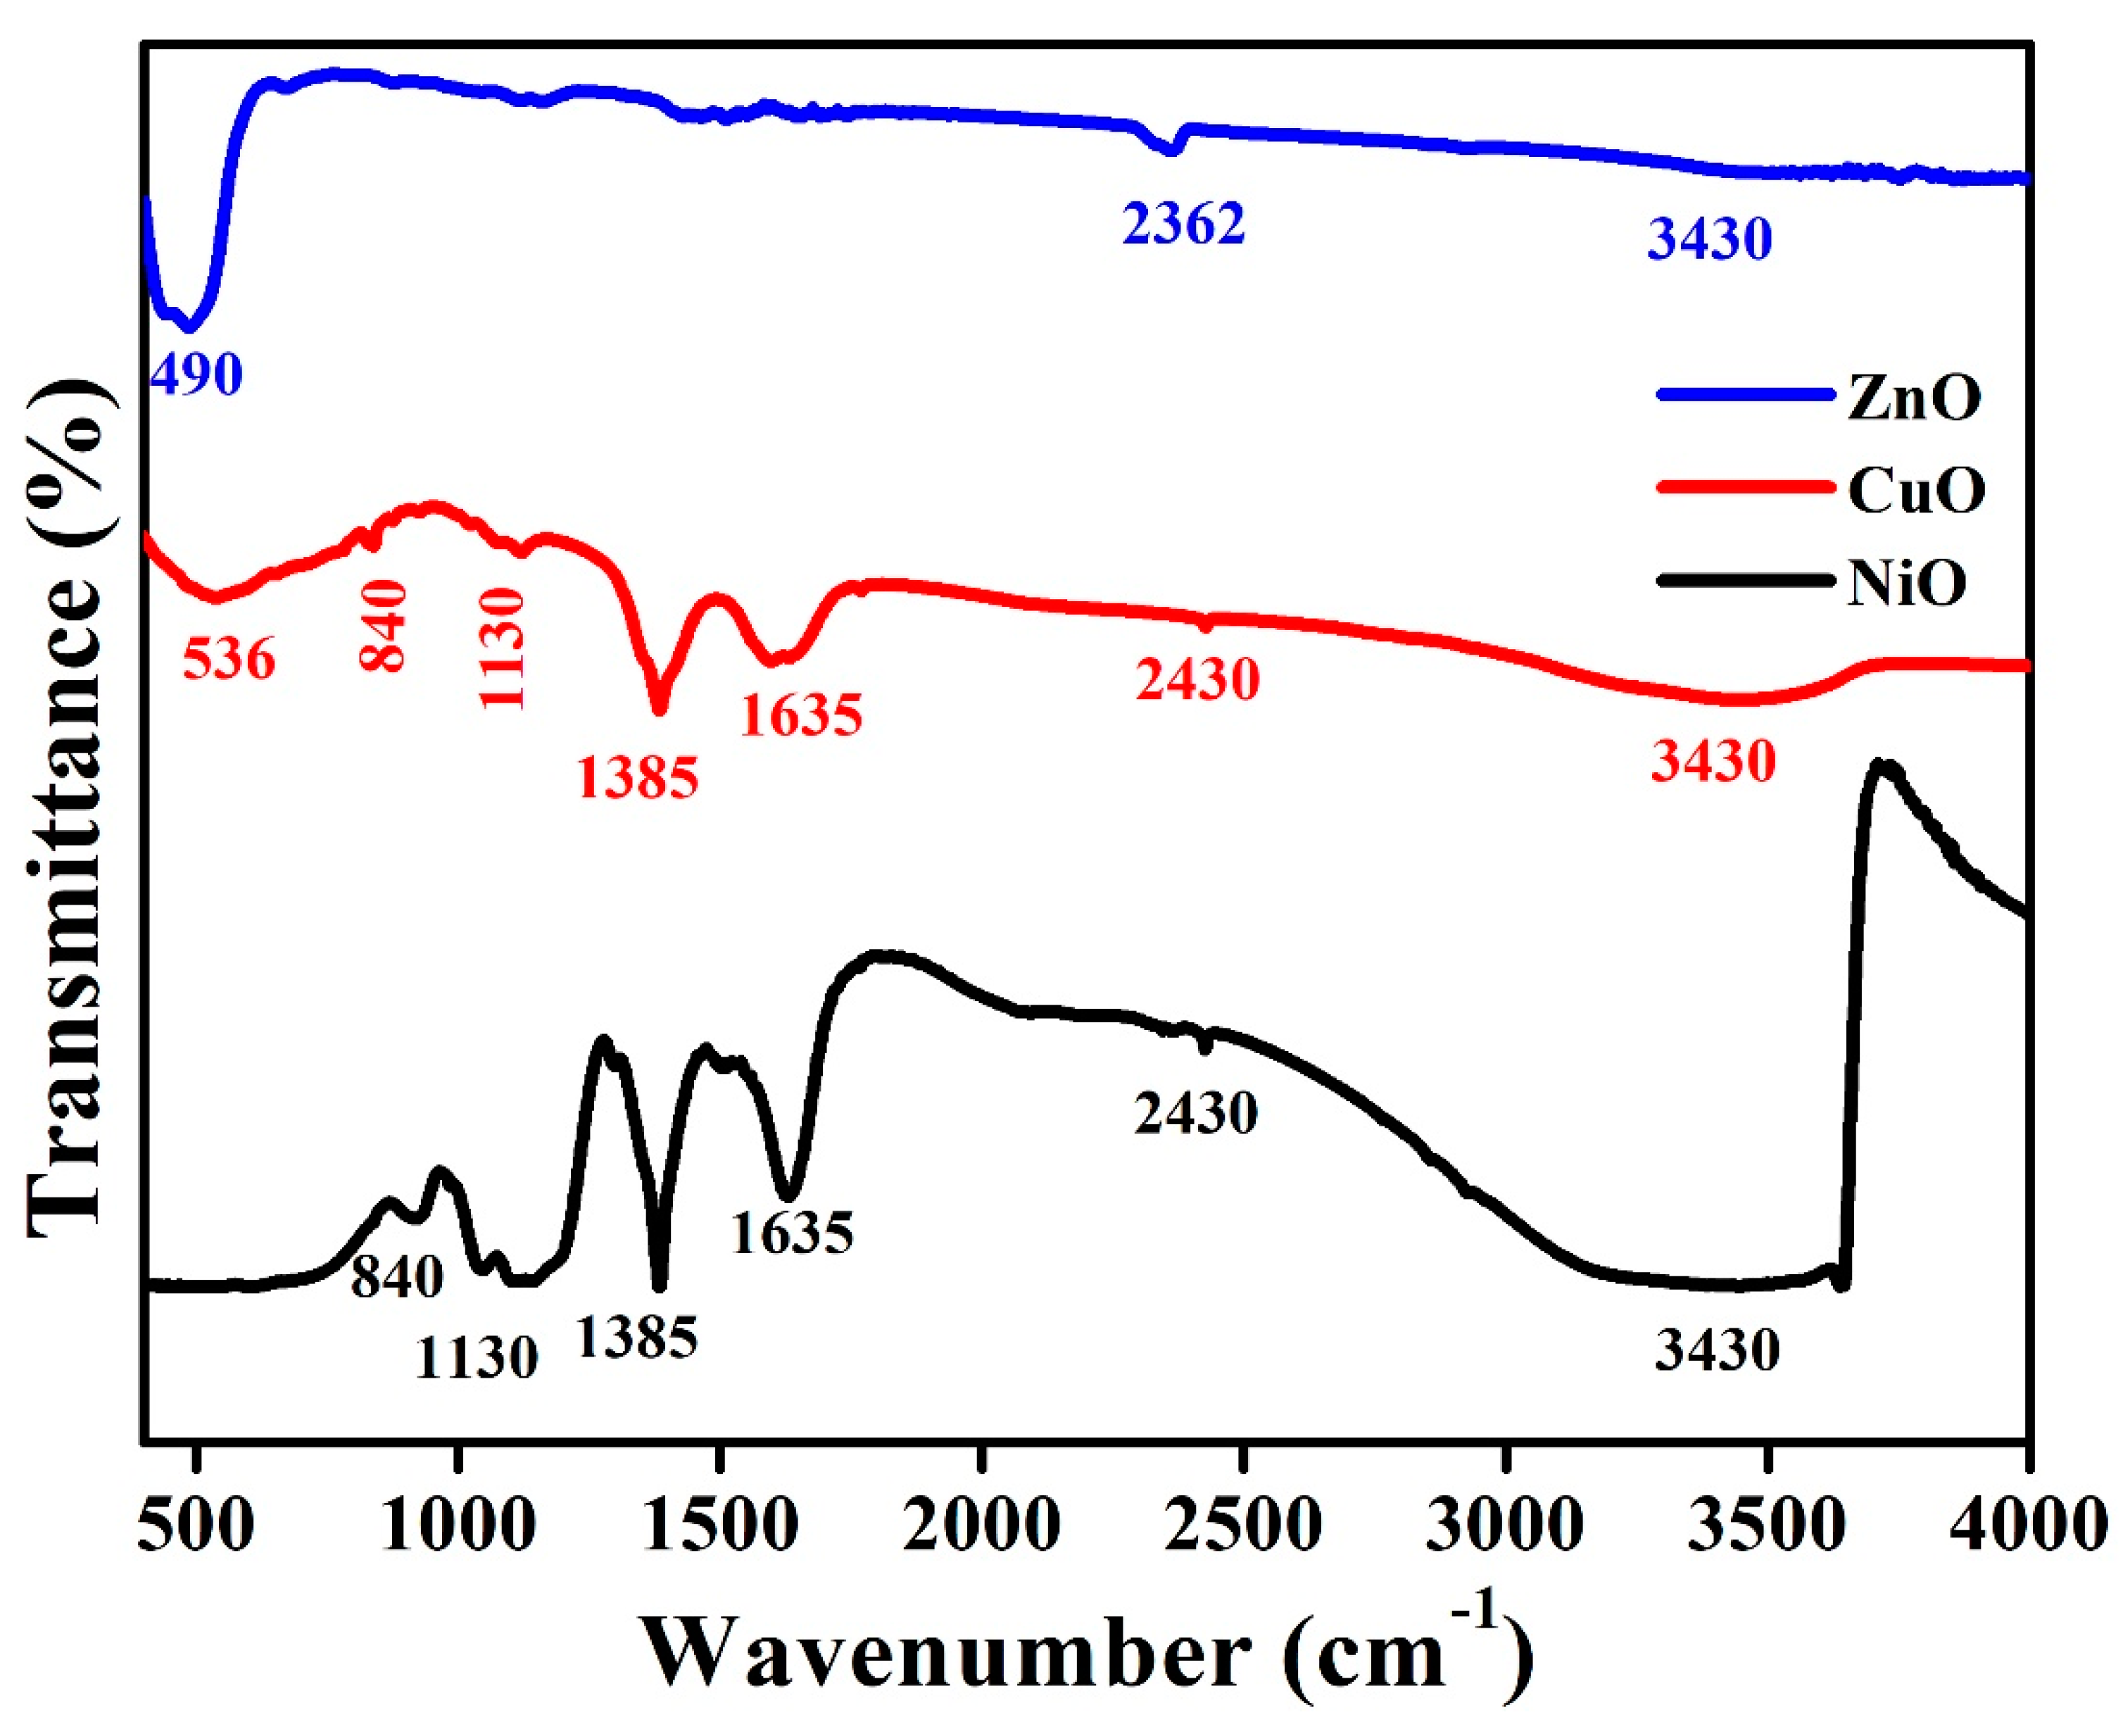
3.2. Functional Group Analysis

FTIR spectra help analyze the possibility of bonding between neighboring structures and the surface of metal oxides. Therefore, FTIR was used in this study to demonstrate the interactions at the surface that may occur as a result of possible adsorption of NPs, as well as to determine the structure of the adsorbate species. The FTIR spectra of synthesized NiO, CuO, and ZnO metal oxides are presented in Figure 3. The spectra exhibit a broad absorption band at 3430 cm−1, which refers to the stretching of the hydroxyl group due to the oscillation of the water molecule bound to the nanocomposite surface.
In this case, the absorption peak at 2926 cm−1 can be assigned to vibrational modes of Ni–O–C. The bending vibration of water molecules was found to be responsible for the peak present at 1635 cm−1. Symmetric and asymmetric stretching vibrations of the O–C=O bond, as well as the C–O stretching vibration resulting from the absorption of CO2 present in the atmosphere, are assigned to the peaks present at 1420, 1130, and 840 cm−1, respectively. A small peak at around 450 cm−1 is attributed to the vibration of the Ni–O bond [19]. Cu–O vibration can be assigned to a strong band at 536 cm−1, which indicates the formation of CuO NPs. The presence of an additional peak at approximately 1385 cm−1 can be assigned to Cu2+–O2− stretching [20]. In the case of ZnO, the peak at 484 cm−1 corresponds to a characteristic absorption of the ZnO bond. The deformation and elongation of the ZnO bond can be observed by the bands present at 440, 480, and 670 cm−1 [18]. The existence of these peaks indicates that ZnO has formed.

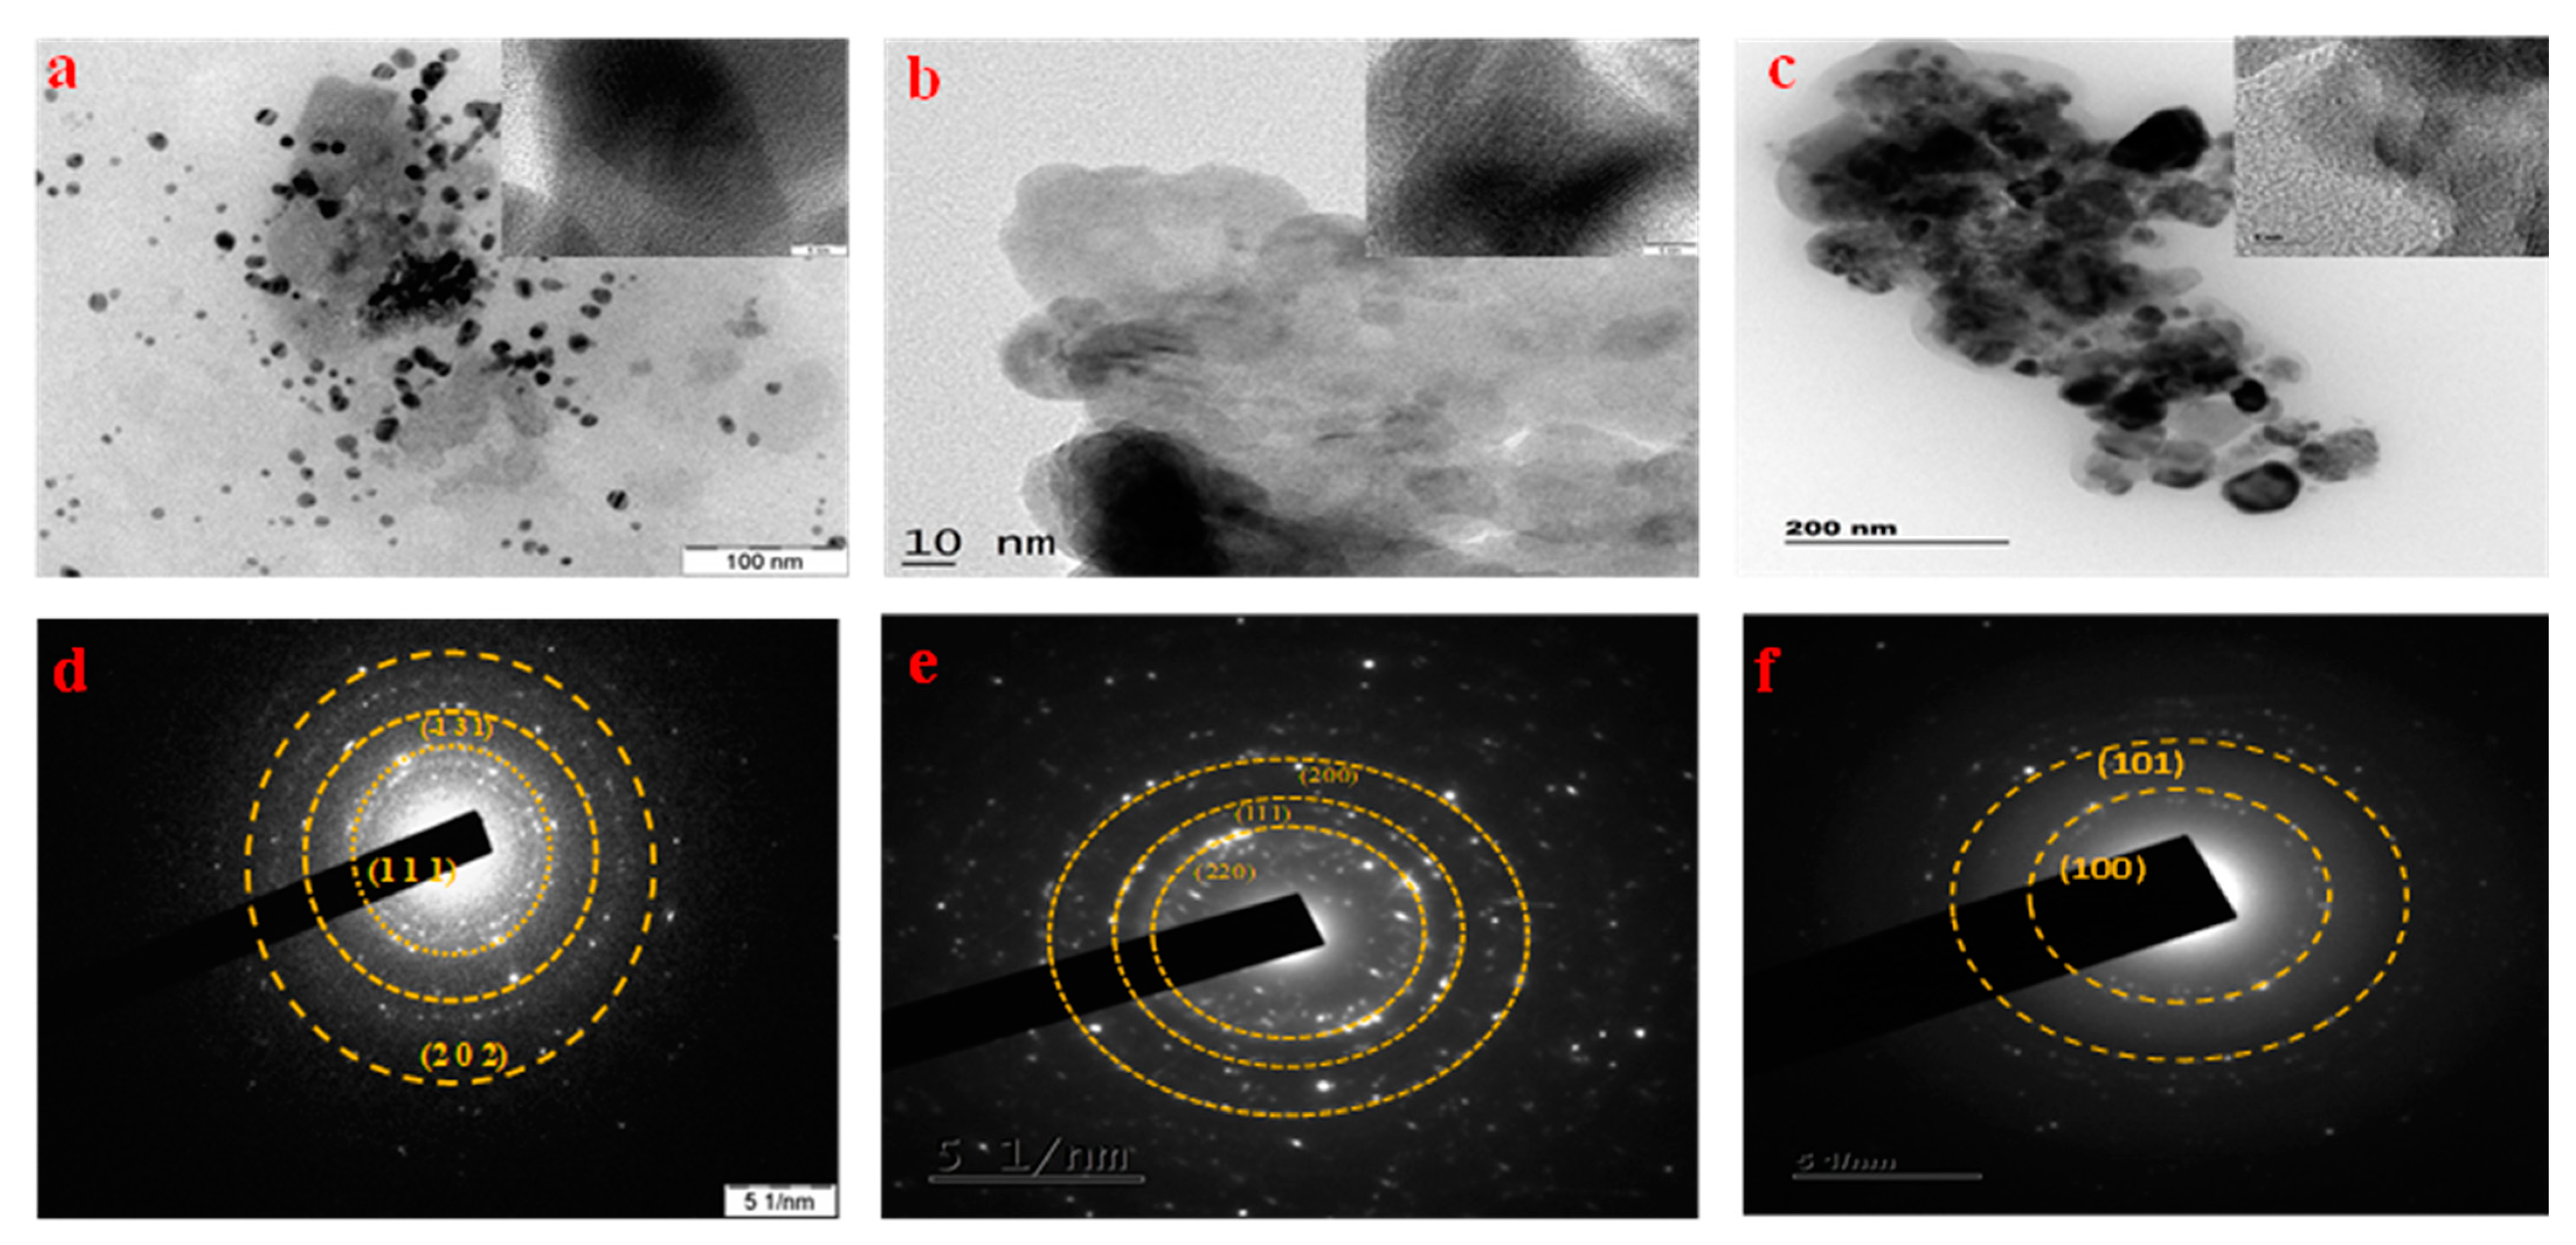
3.3. Morphological Analysis
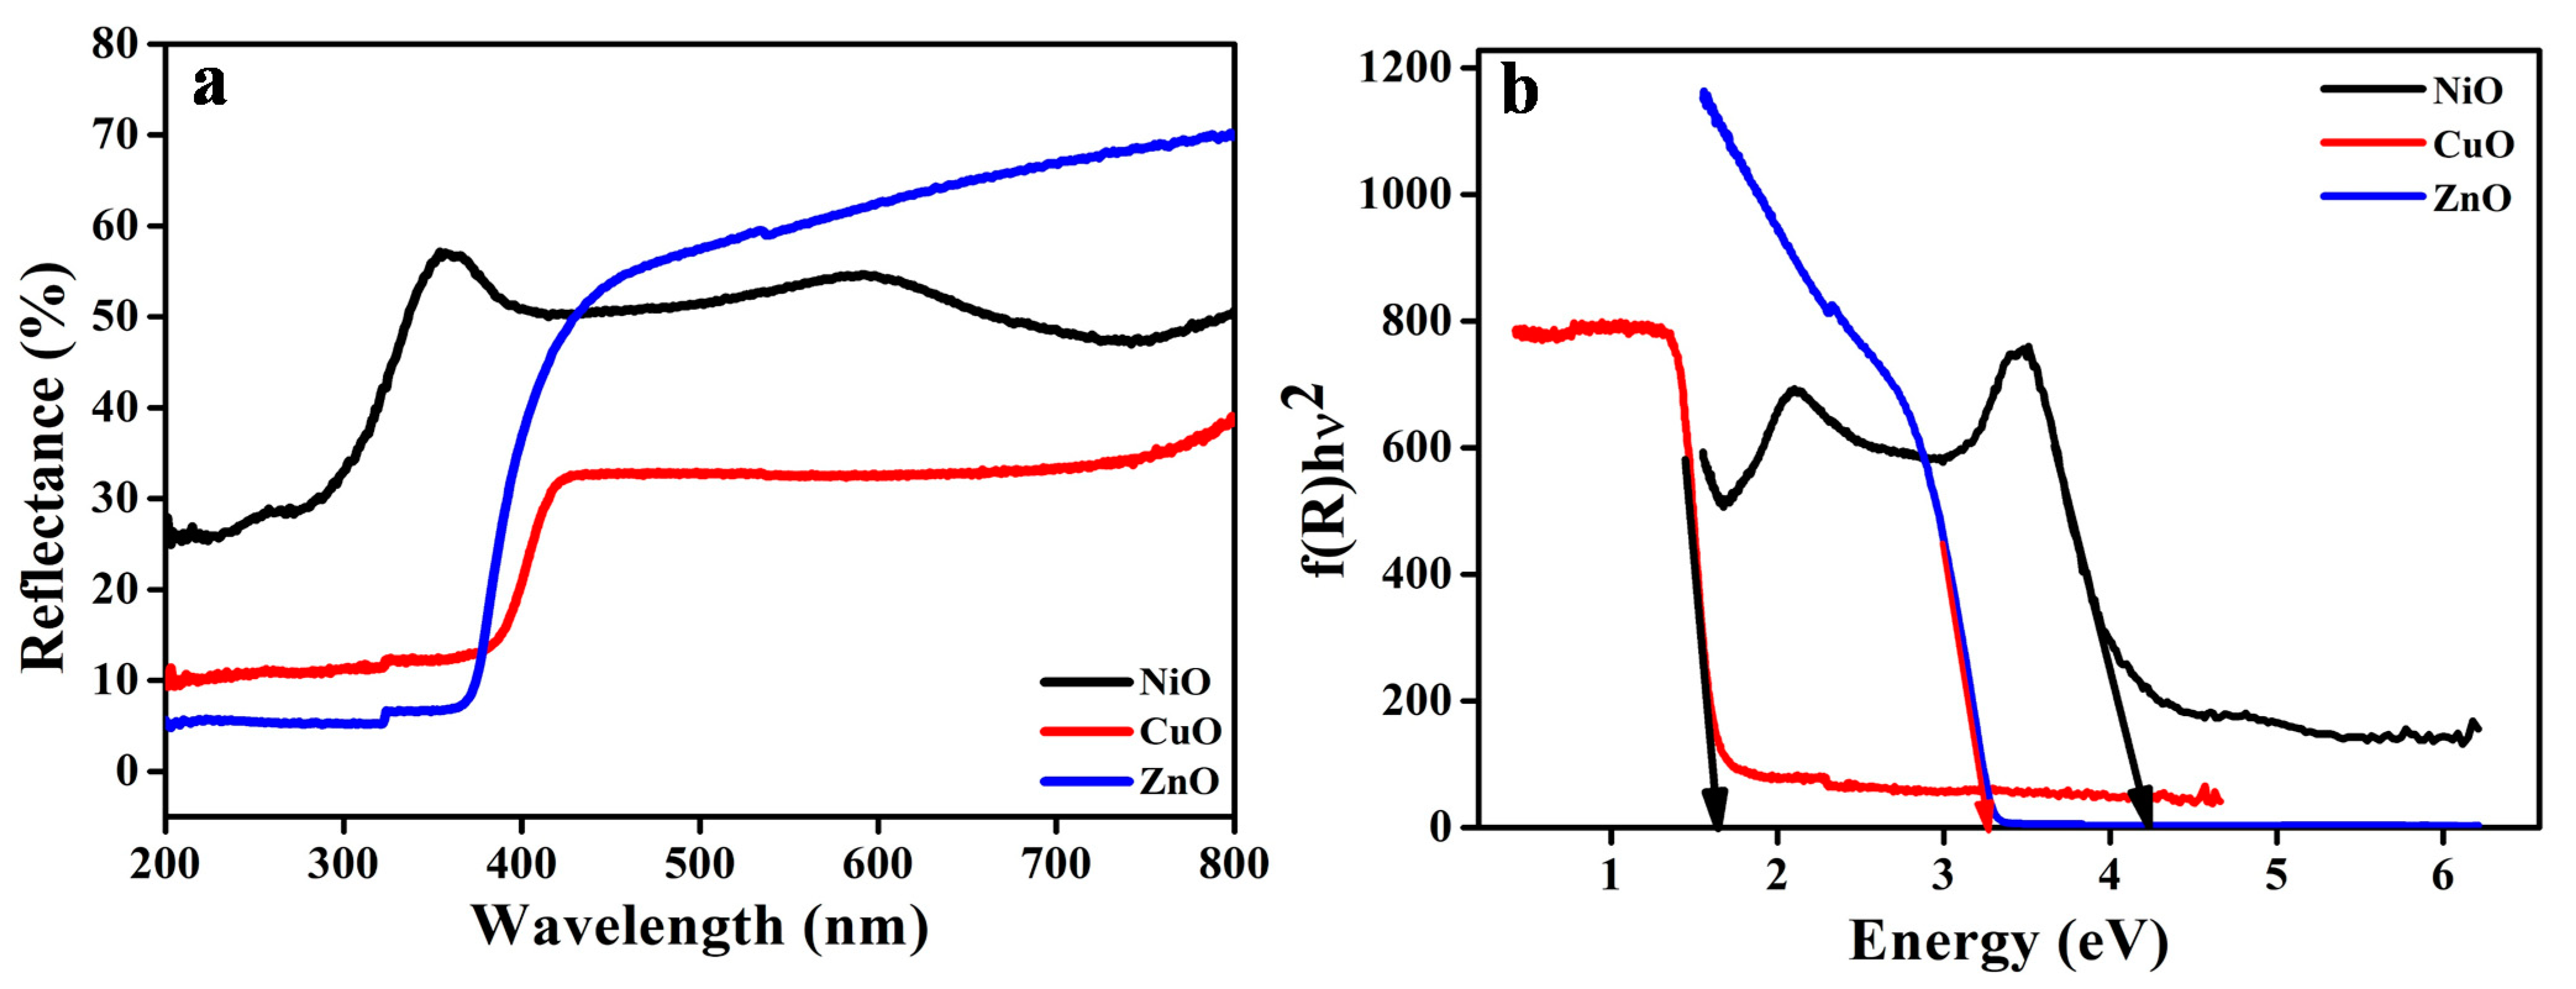
Using TEM micrographs, the morphological analysis of the prepared photocatalysts was performed. It was observed from the TEM images that each nanoparticle exhibited different morphologies such as sheets, while some of the particles are spherical. Overall, the particles are agglomerated which is clearly seen. In the micrographs, it was observed that the material contains NPs (Figure 4a–c) with sizes ranging from 25 to 50 nm. In the TEM analysis, the agglomeration is mainly due to the solvent which we have used solvent conditions, environmental factors, temperature, and the surface chemistry of the nanoparticles. Furthermore, the SAED pattern in Figure 4d exhibits 3 intense fringes which correspond to the planes (111) and (131), and (202) of CuO. Figure 4e also exhibits three fringes which are responsible by the planes (220), (111), and (200) of NiO. The SAED pattern of ZnO exhibits two intense fringes which are attributed to the planes of (100) and (101), which are given in Figure 4f.

3.4. DRS Analysis

One of the most effective tools available for analyzing the optical activity of nanoscale samples, providing insight into phenomena such as transitions from one state to another, as well as charge transfer investigation, is the diffuse reflectance spectrometer. A single broad absorption band at 360 nm is observed in the absorption spectra of the synthesized NiO samples, as depicted in Figure 5a. In addition to metallic nickel, there is no other band that corresponds to it. When divalent nickel ions with electronic configuration 3d [8] transition from one state to another, they form a band at 360 nm that is spin-allowed. The bandgap value (Figure 5b) for NiO was found to be 4.2 eV. The charge transfer transition band for the octahedrally coordinated Cu2+ species is shown to have a broad range of wavelengths between 350 and 750 nm, which is due to the d–d transition band. The CuO cluster formed in a highly dispersed state was confirmed, and the bandgap value was 1.63 eV. Surface absorption of radiation in the UV region at 366 nm was observed for ZnO nanostructure; based on this observation, its bandgap was found to be 3.4 eV. Therefore, the energy bandgap of the prepared samples is determined by applying the Schuster–Kubelka–Munk (SKM) function. It follows from this that any wavelength in the Schuster–Kubelka–Munk equation is equivalent to Equation (2) [6,18,21],
F ( R ) = ( 1 R ) 2 2 R
where R denotes the absolute reflectance of the sample and F(R) denotes the so-called reflectance factor, referred to as the Kubelka–Munk function.

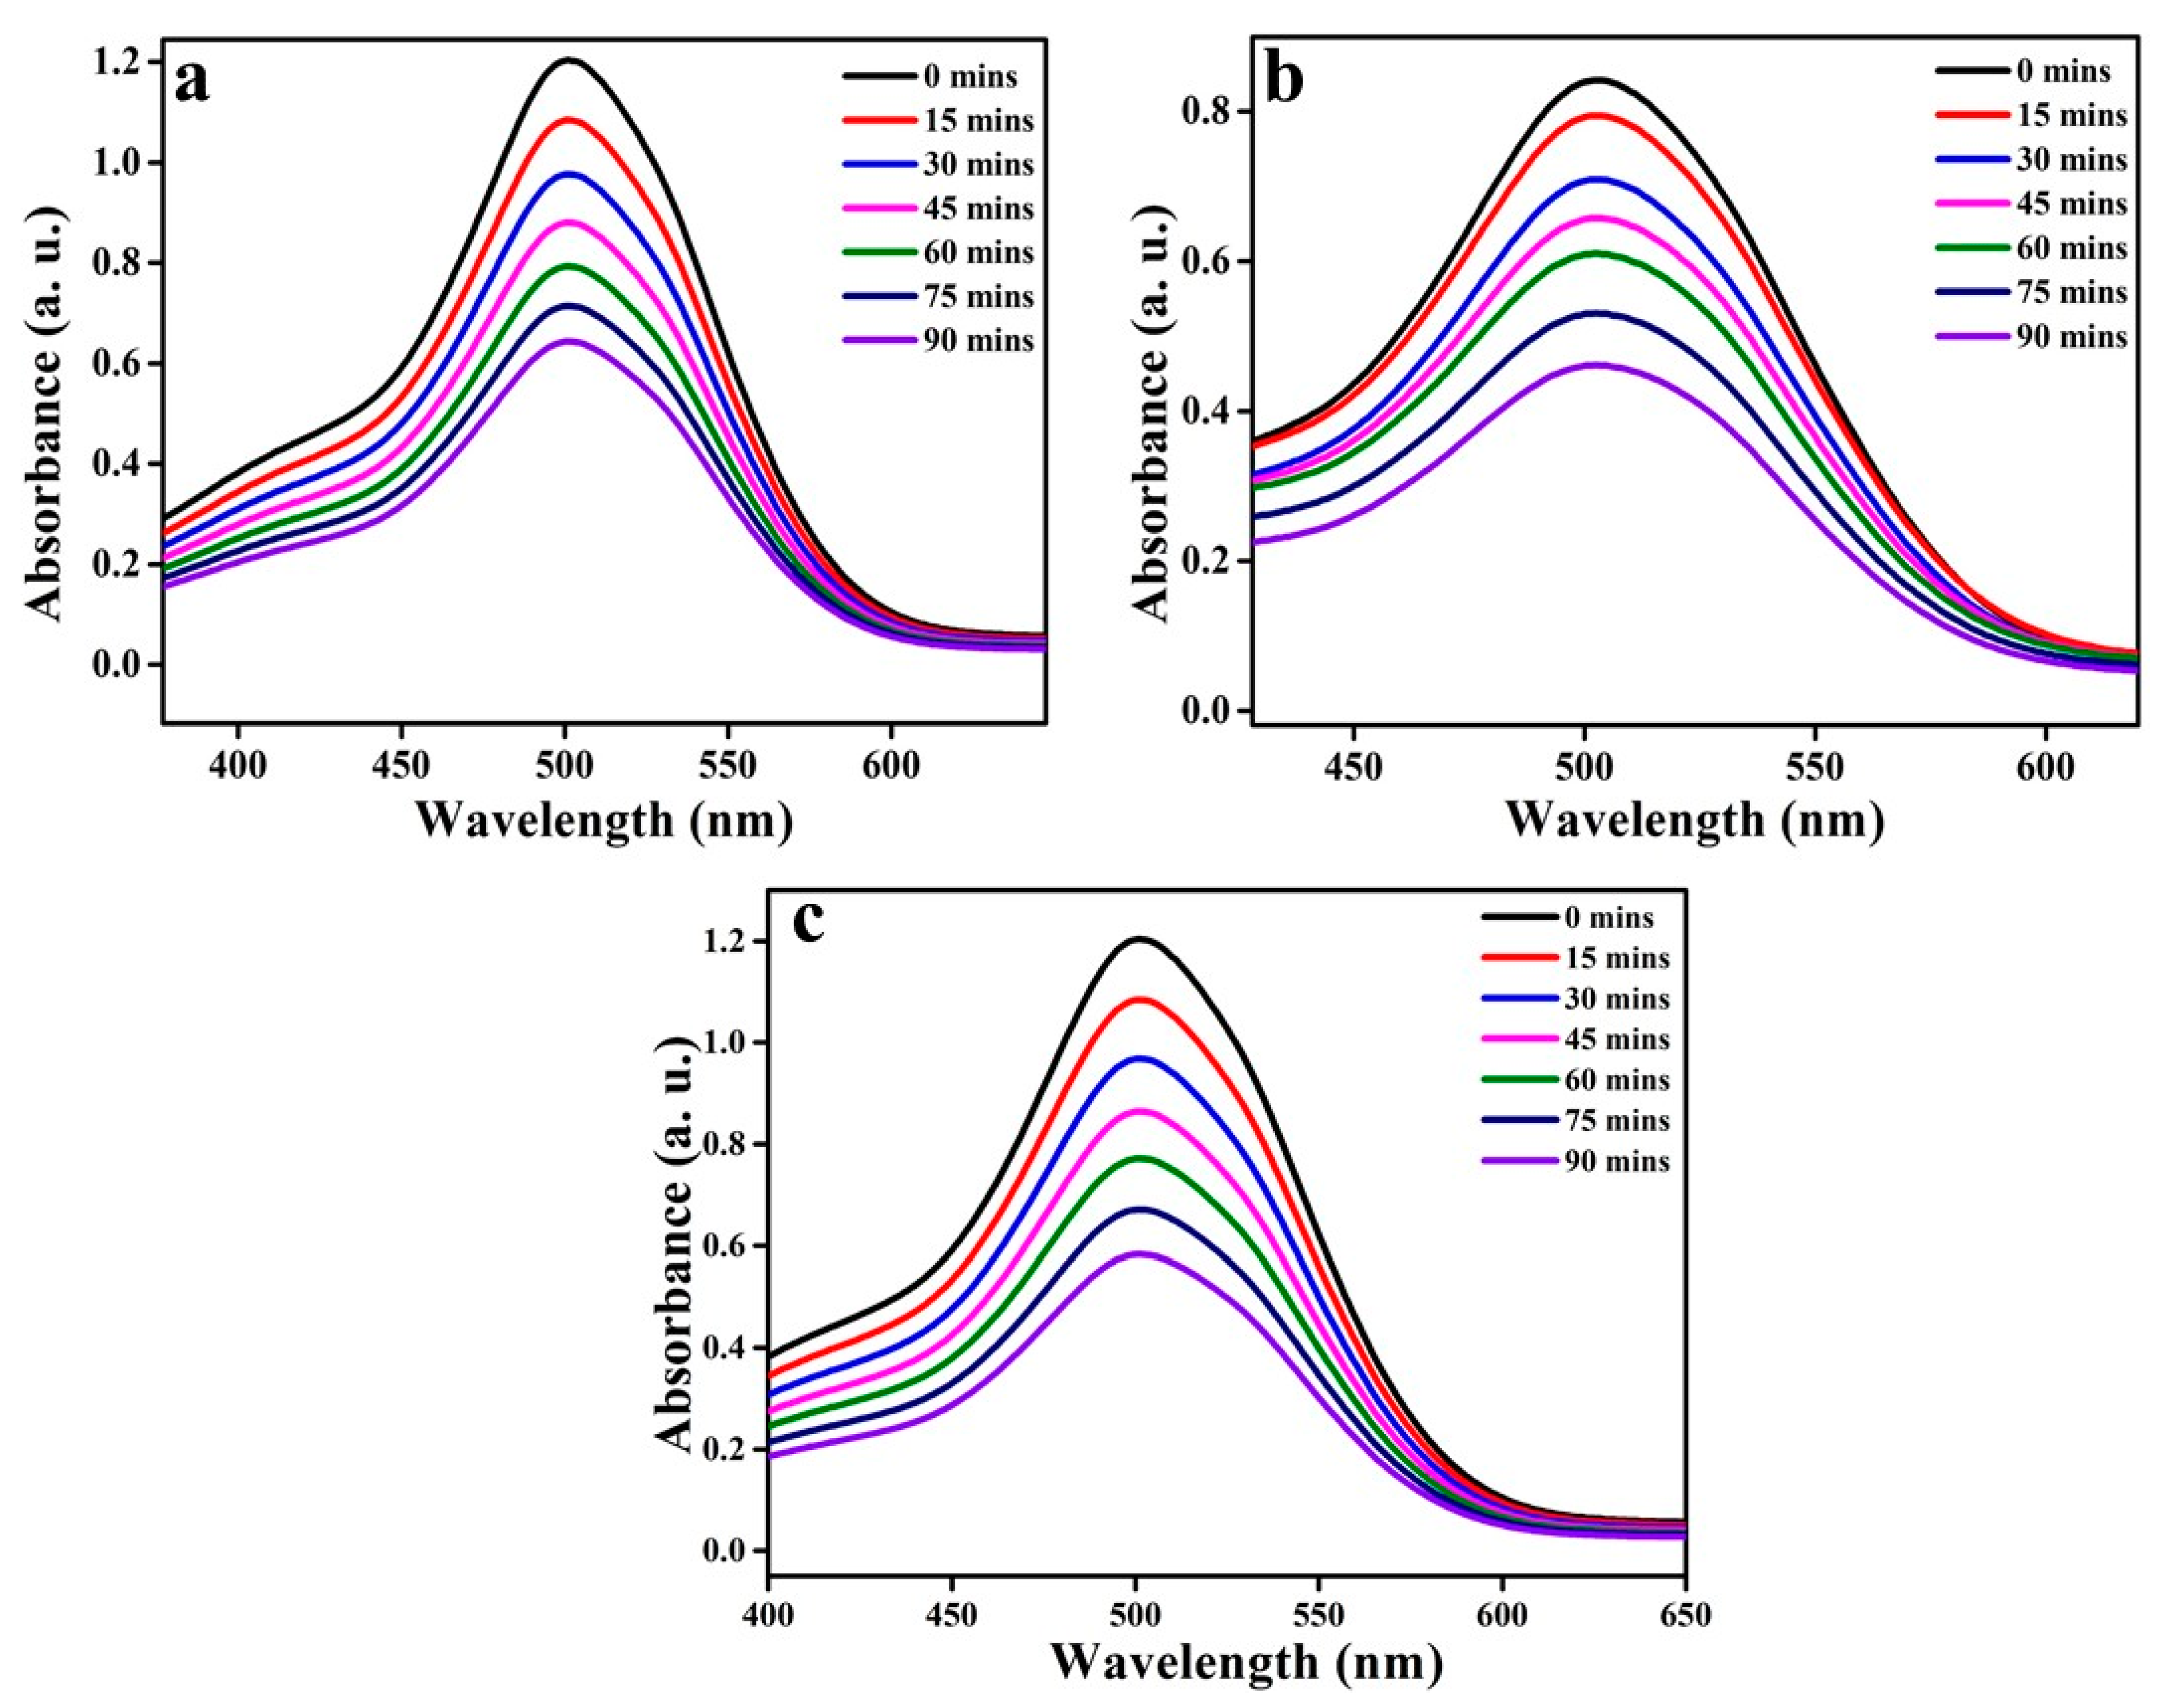
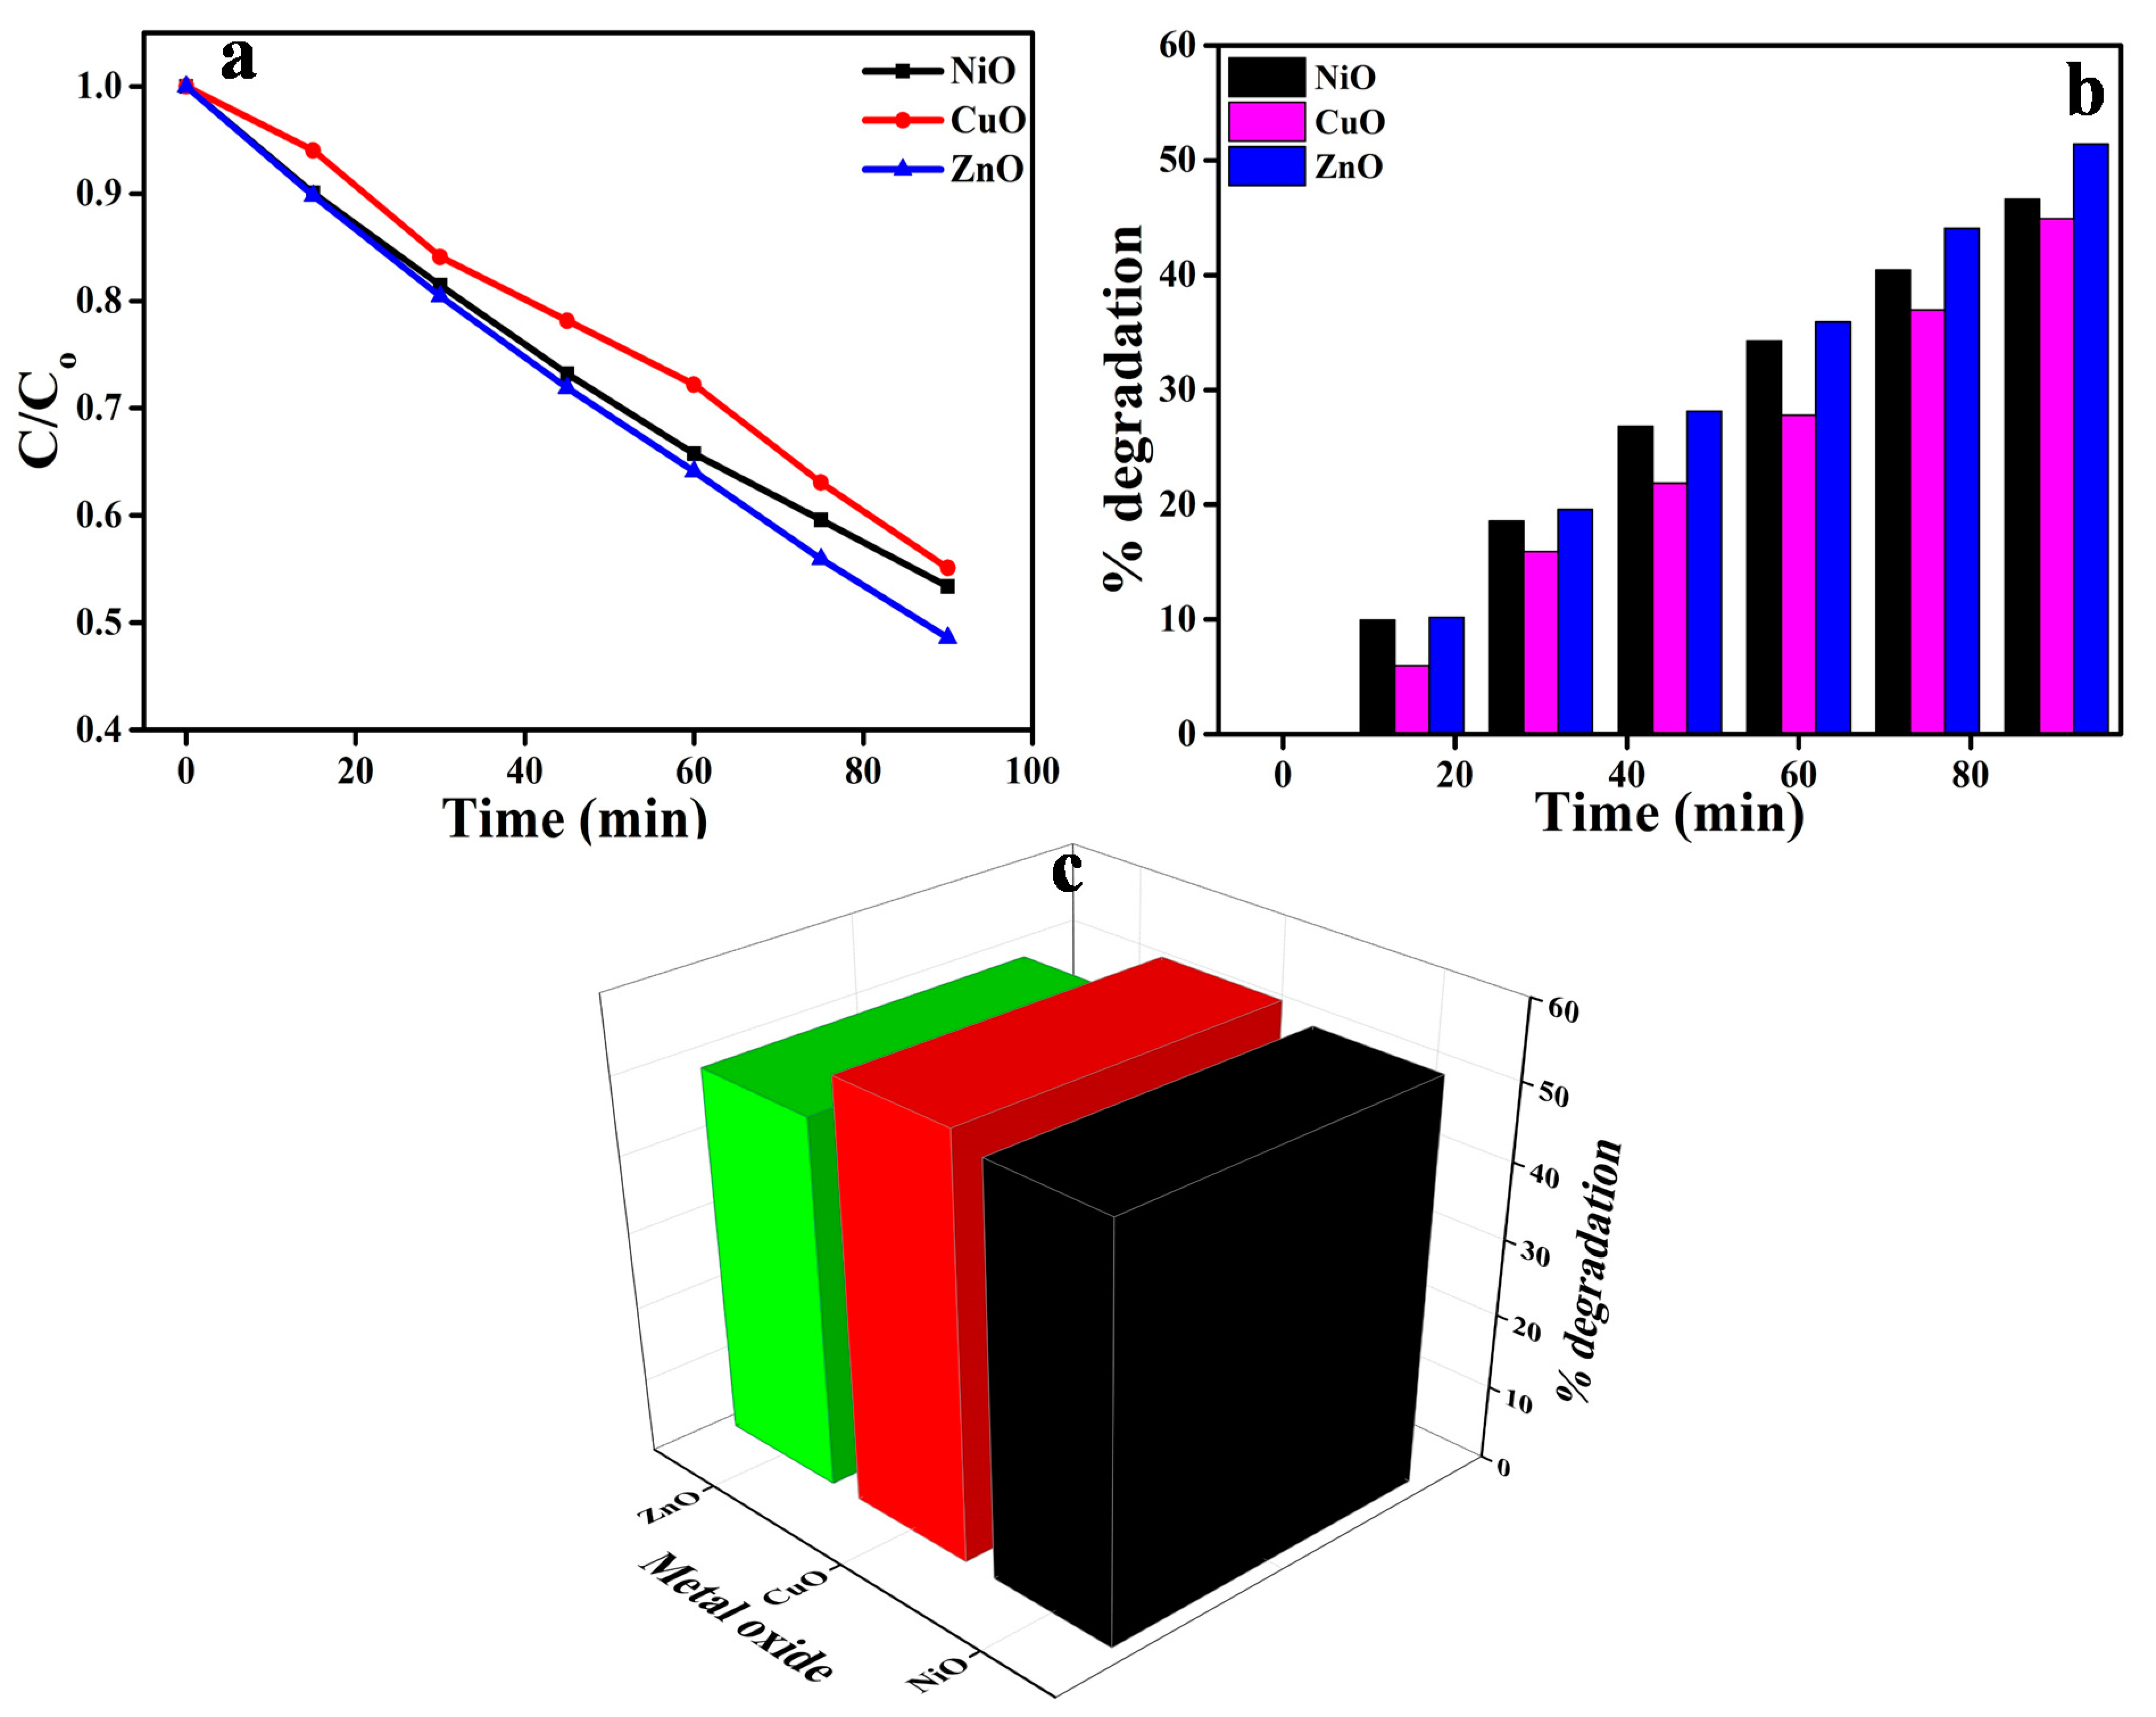
3.5. Photocatalytic Activity of NiO, CuO, and ZnO on AR88 Dye

To stud the effect of photocatalytic activity of the synthesized metal oxides, AR88 dye was chosen as the pollutant and the degradation of the dye was studied under UV irradiation. The graph plotted in Figure 6a depicts the degradation, which is dependent on time for all the metal oxides that have been prepared. Figure 6c shows the degradation percentages (90 min) of all metal oxides after being exposed to UV light. To evaluate the photocatalytic effect of the synthesized material on AR88 dye, preliminary tests were carried out under a variety of conditions to perform different experiments. Using the AR88 dye solution alone, it was found that the dye removal efficiency was insignificant, after 60 min in the dark. This explains why the dye molecules are excited by photons and the subsequent displacement of their energy in the excitation state, which does not affect the decolorization of the dye.
A stock solution of the dye (AR88) was first prepared, and then a 250-mL sample of 20 ppm of the dye was drawn for use in the experiment from that stock solution. The dye solution was taken in a glass circular vessel where 60 mg of the prepared photocatalyst was added. An investigation into the photocatalytic degradation efficiency of the synthesized catalysts on the AR88 dye was carried out under UV light irradiation at intervals of every 15 min for a total of 90 min. During the degradation process, the dye’s absorption band intensity decreased as the process progressed. To put it another way, the photodegradation efficiency increased with an increase in exposure time. The dye degradation absorbance is proportional to the amount of dye remaining in the dye solution, which is further evidence of this relationship. Figure 7a shows the absorbance spectra of metal oxide NPs when they are treated with AR88 dye extracts, and Figure 7b shows the percentage of dye degradation over time as a function of time interval in the same experiment. While it was initially discovered that the percentage of dye degradation was low, the dye degradation increased with an increase in exposure time, as evidenced by the results. With respect to photocatalytic activity, the graph illustrating the percentage degradation versus time intervals indicates that the CuO NPs synthesized using Centella asiatica plant extract have a photocatalytic activity of 44%, followed by NiO with a degradation of 46% and ZnO with the highest degradation of 51% among the prepared metal oxides in the absorbance range of 480–490 nm. Figure 7c shows that the dye degraded at a rate of 9.9%, 18.6%, 26.9%, 34.3%, 40.5%, and 46% at intervals of 15 min for NiO, 6%, 15.8%, 22%, 27.9%, 36.9%, and 44% for CuO, and 10.2%, 19.6%, 28.17%, 36%, 44%, and 51% for ZnO. Overall, it was observed that ZnO outperformed all other photocatalysts prepared with Centella asiatica plant extract in terms of photocatalytic decolorization after 90 min of UV irradiation.

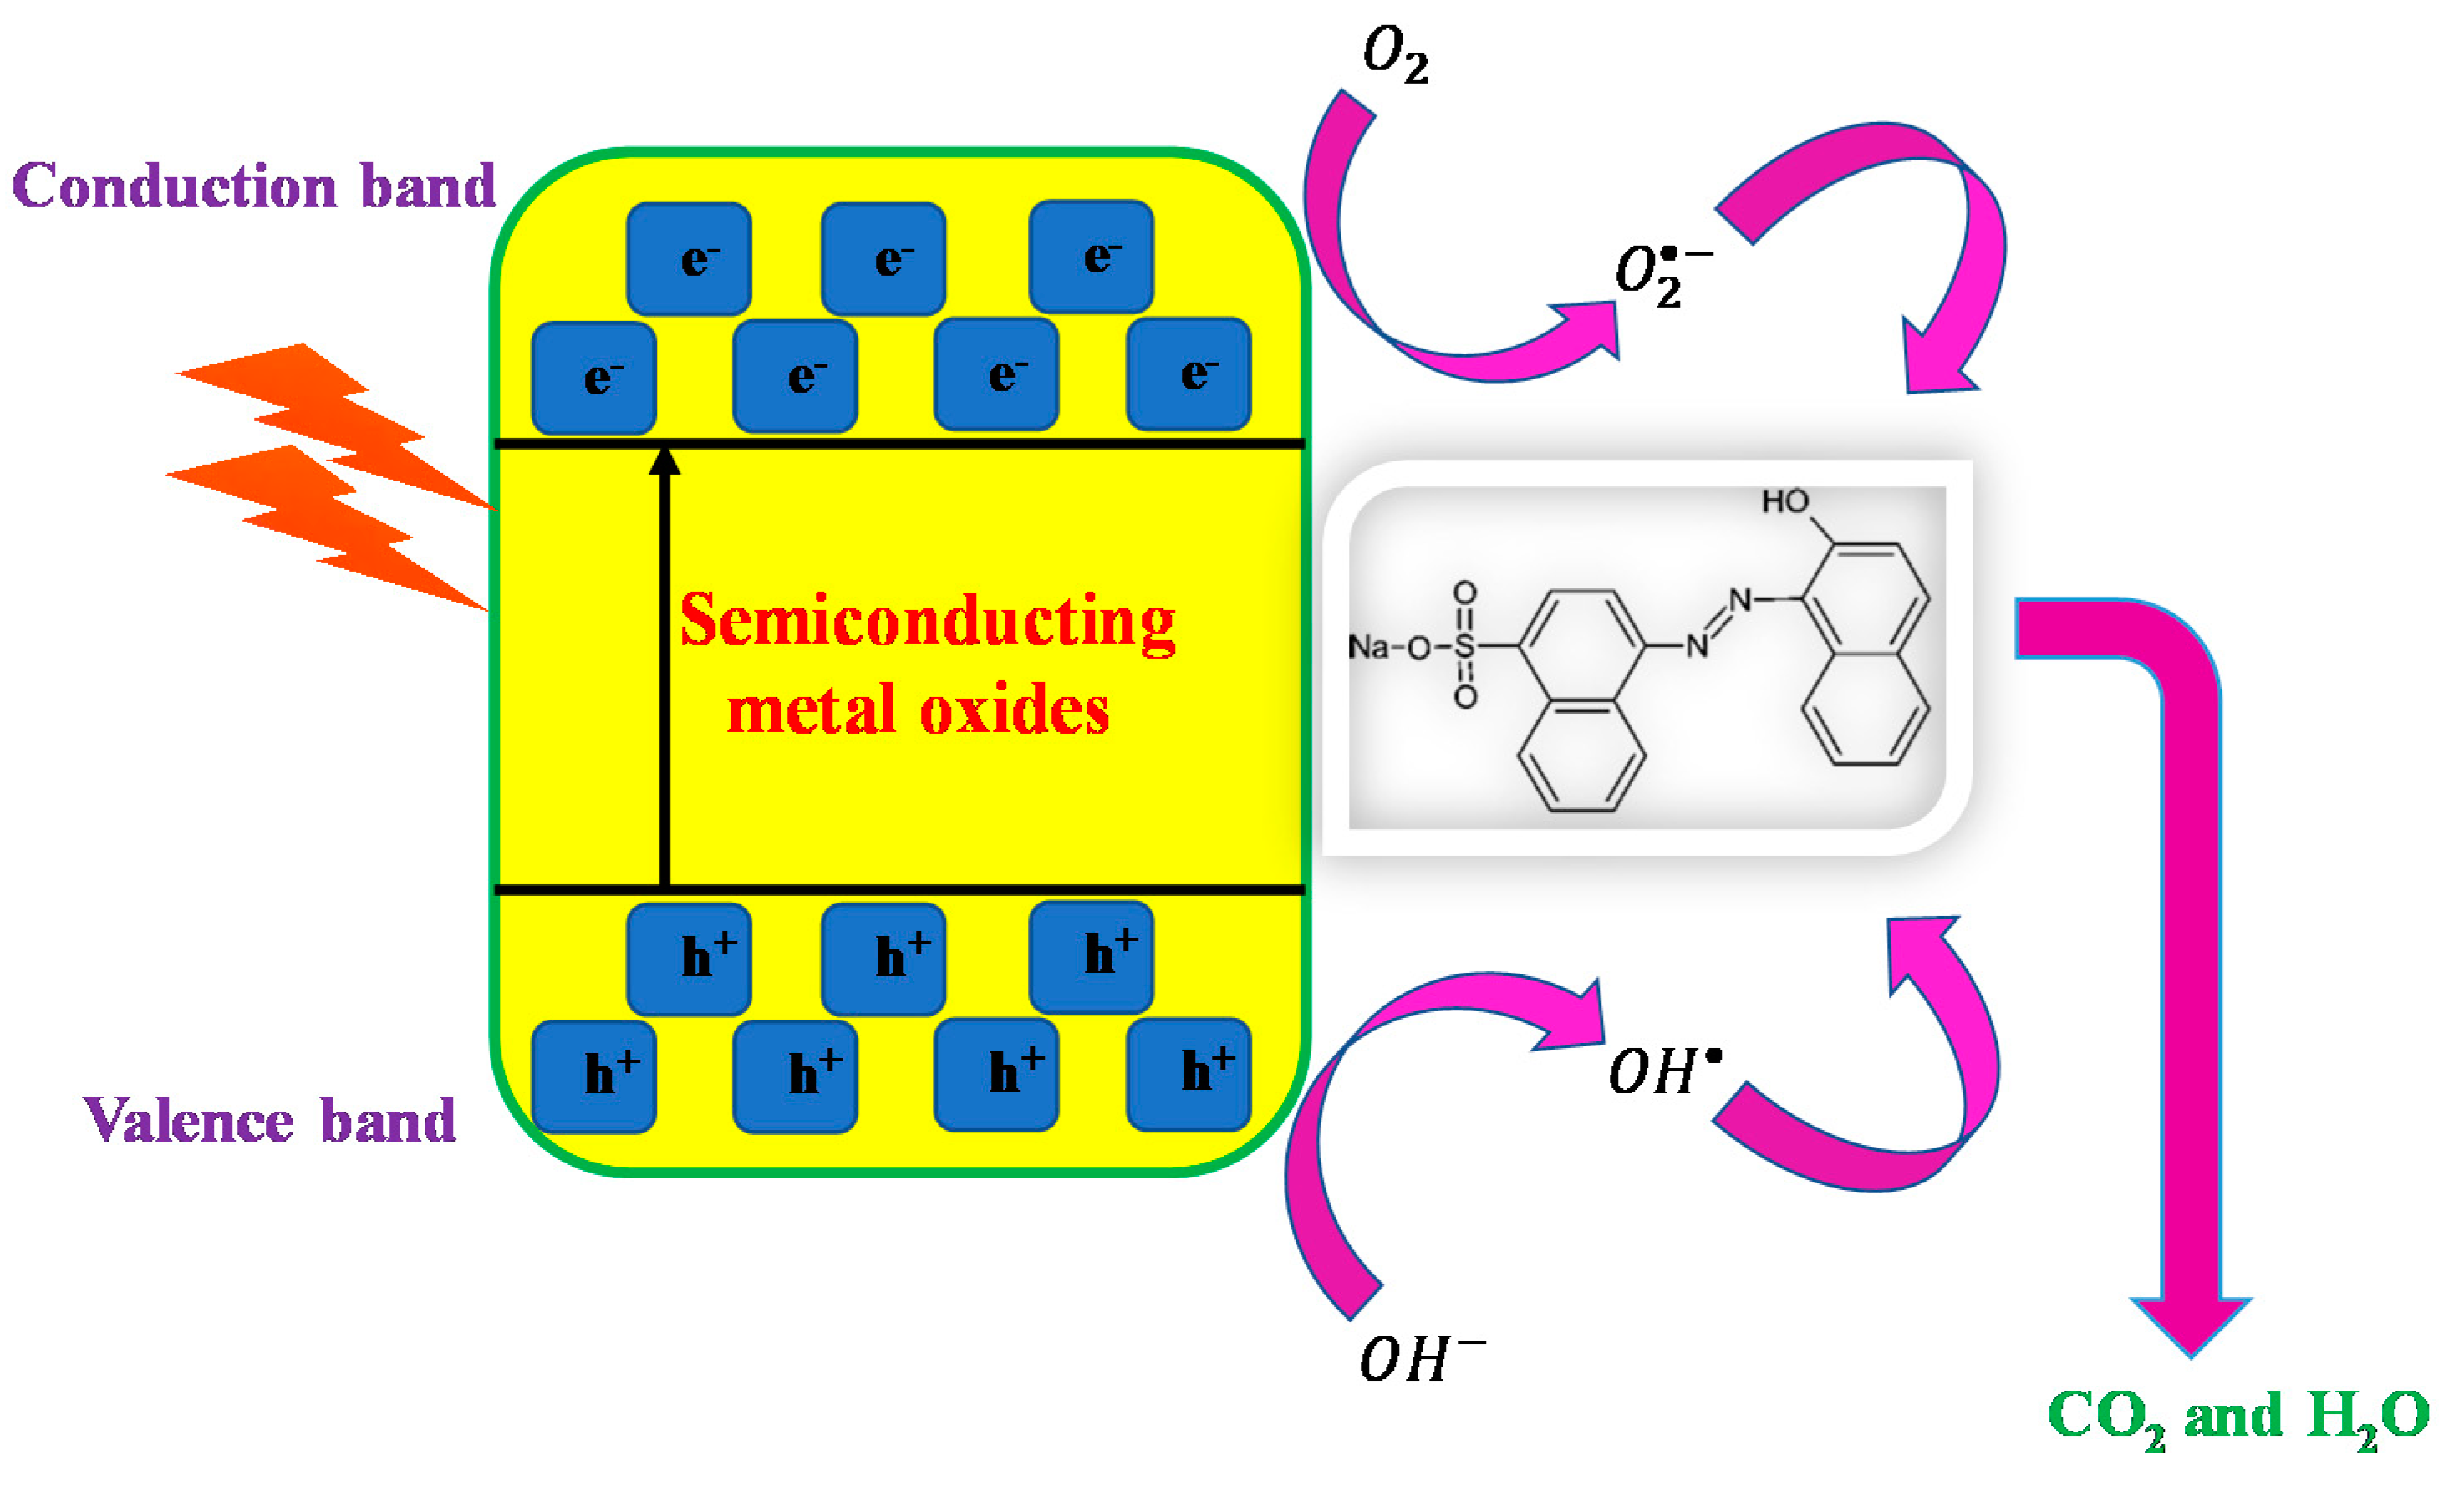
3.6. Mechanism of Photodegradation

The photoinduced process occurs when sunlight induces photonic energy (hv), which is equal to or greater than that of the excitation energy (Eg), resulting in the excitation of electrons to the empty conduction band from the filled valence band. As illustrated in Equation (3), this photoinduced process results in the formation of electron–hole (e/h+) pairs. Because of their migration, the electron–hole pairs can get involved in redox reactions, as demonstrated in Equations (4)–(6), in which the H+ combines with hydroxide ions and water to form hydroxyl radicals, and the hydrogen peroxide and superoxide radicals were produced by the reaction of e with oxygen [22,23]. Hydroxyl radicals are formed by the reaction between hydrogen peroxide and superoxide radicals [Equations (9)–(13)]. Finally, powerful oxidizing radicals that are generated will react with the pollutants that are adsorbed on metal oxides’ surfaces, resulting in the production of intermediate compounds in a relatively short period. As shown in Equation (13), in the end, the intermediate products will be converted to green compounds such as H2O, CO2, and some mineral acids. As a result, the redox reaction is the primary mechanism of photodegradation of organic compounds in the presence of UV light irradiation. The following is a summary of the mechanism:
MO   h ν   MO ( e   CB ) + ( h   VB + )
MO   ( h   VB + ) + H 2 O   MO +   H + + OH
MO   ( h   VB + ) + OH   MO +   OH
MO ( e   CB ) +   O 2   MO +   O 2
O 2 +   H +   HO 2
HO 2 +   HO 2     H 2 O 2 +   O 2
MO ( e   CB ) +   H 2 O 2   OH + OH
H 2 O 2 +   O 2     OH + OH +   O 2
H 2 O 2 + h ν 2 OH
Organic   pollutant +   OH   Intermediates
Intermediates CO 2 +   H 2 O
Because ZnO absorbs more light across a wider range of wavelengths than NiO and CuO (Figure 6), it has been demonstrated to have higher absorption efficiency across a wider range of wavelengths. A catalyst can generate photogenerated electron–hole pairs that determine the photocatalytic activity of the catalyst. Figure 8 shows a schematic representation of the photocatalytic mechanism.

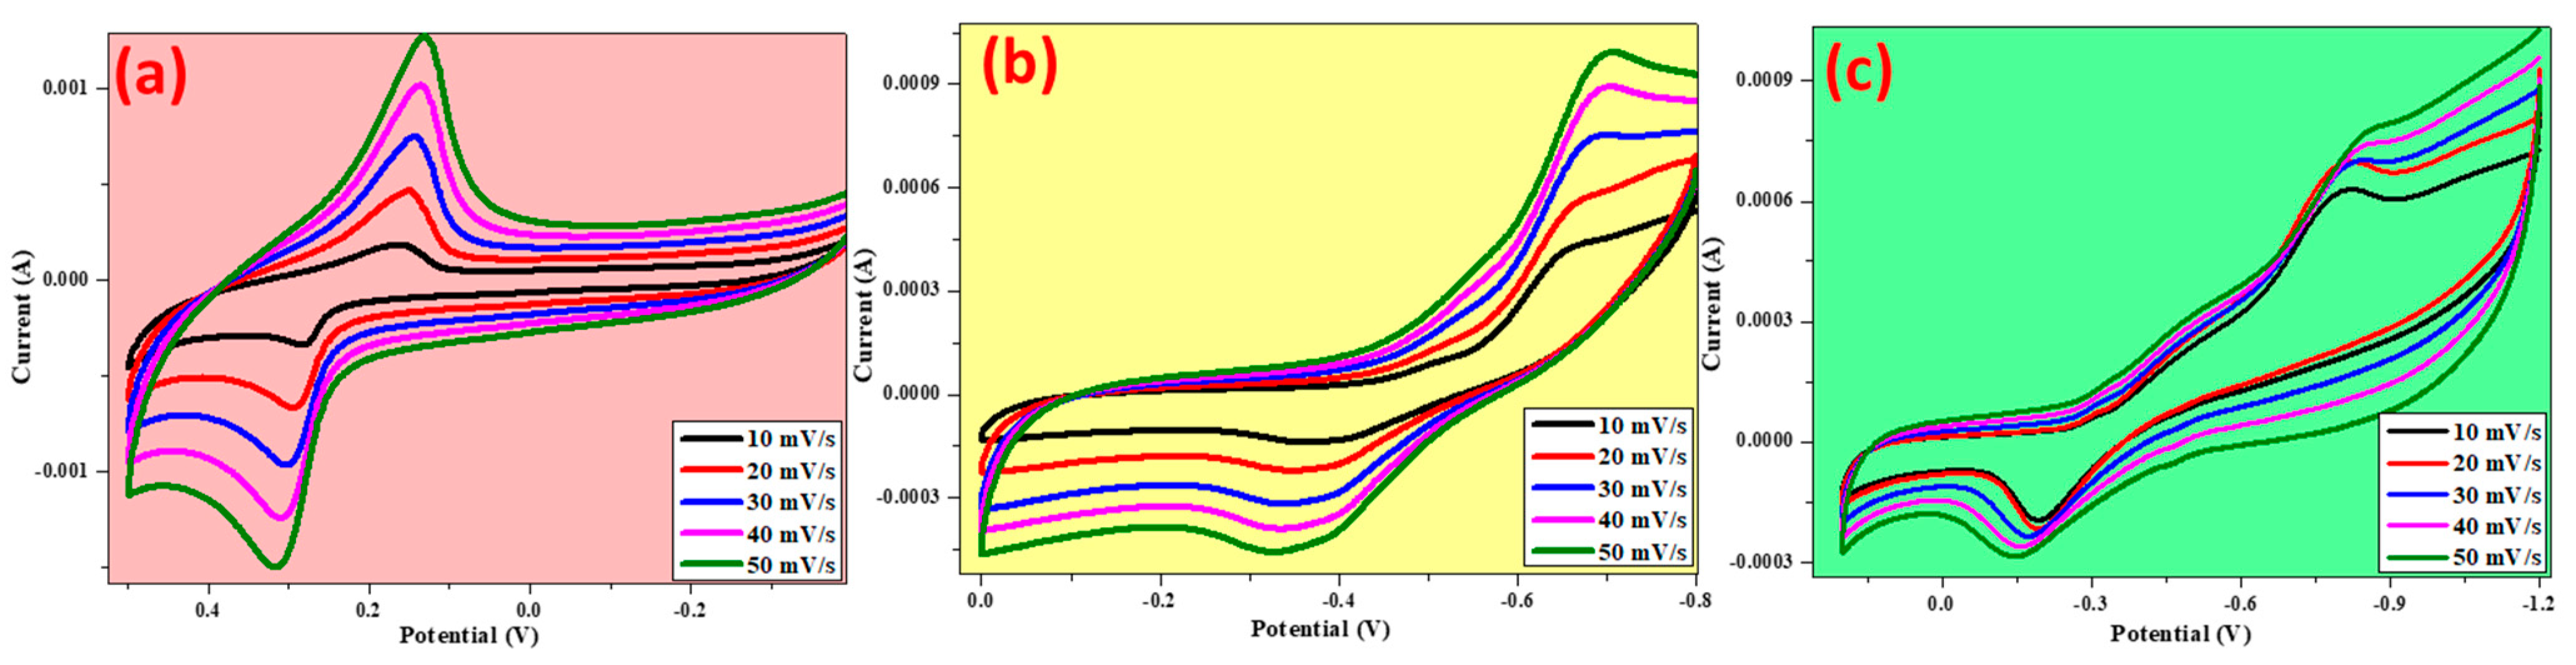
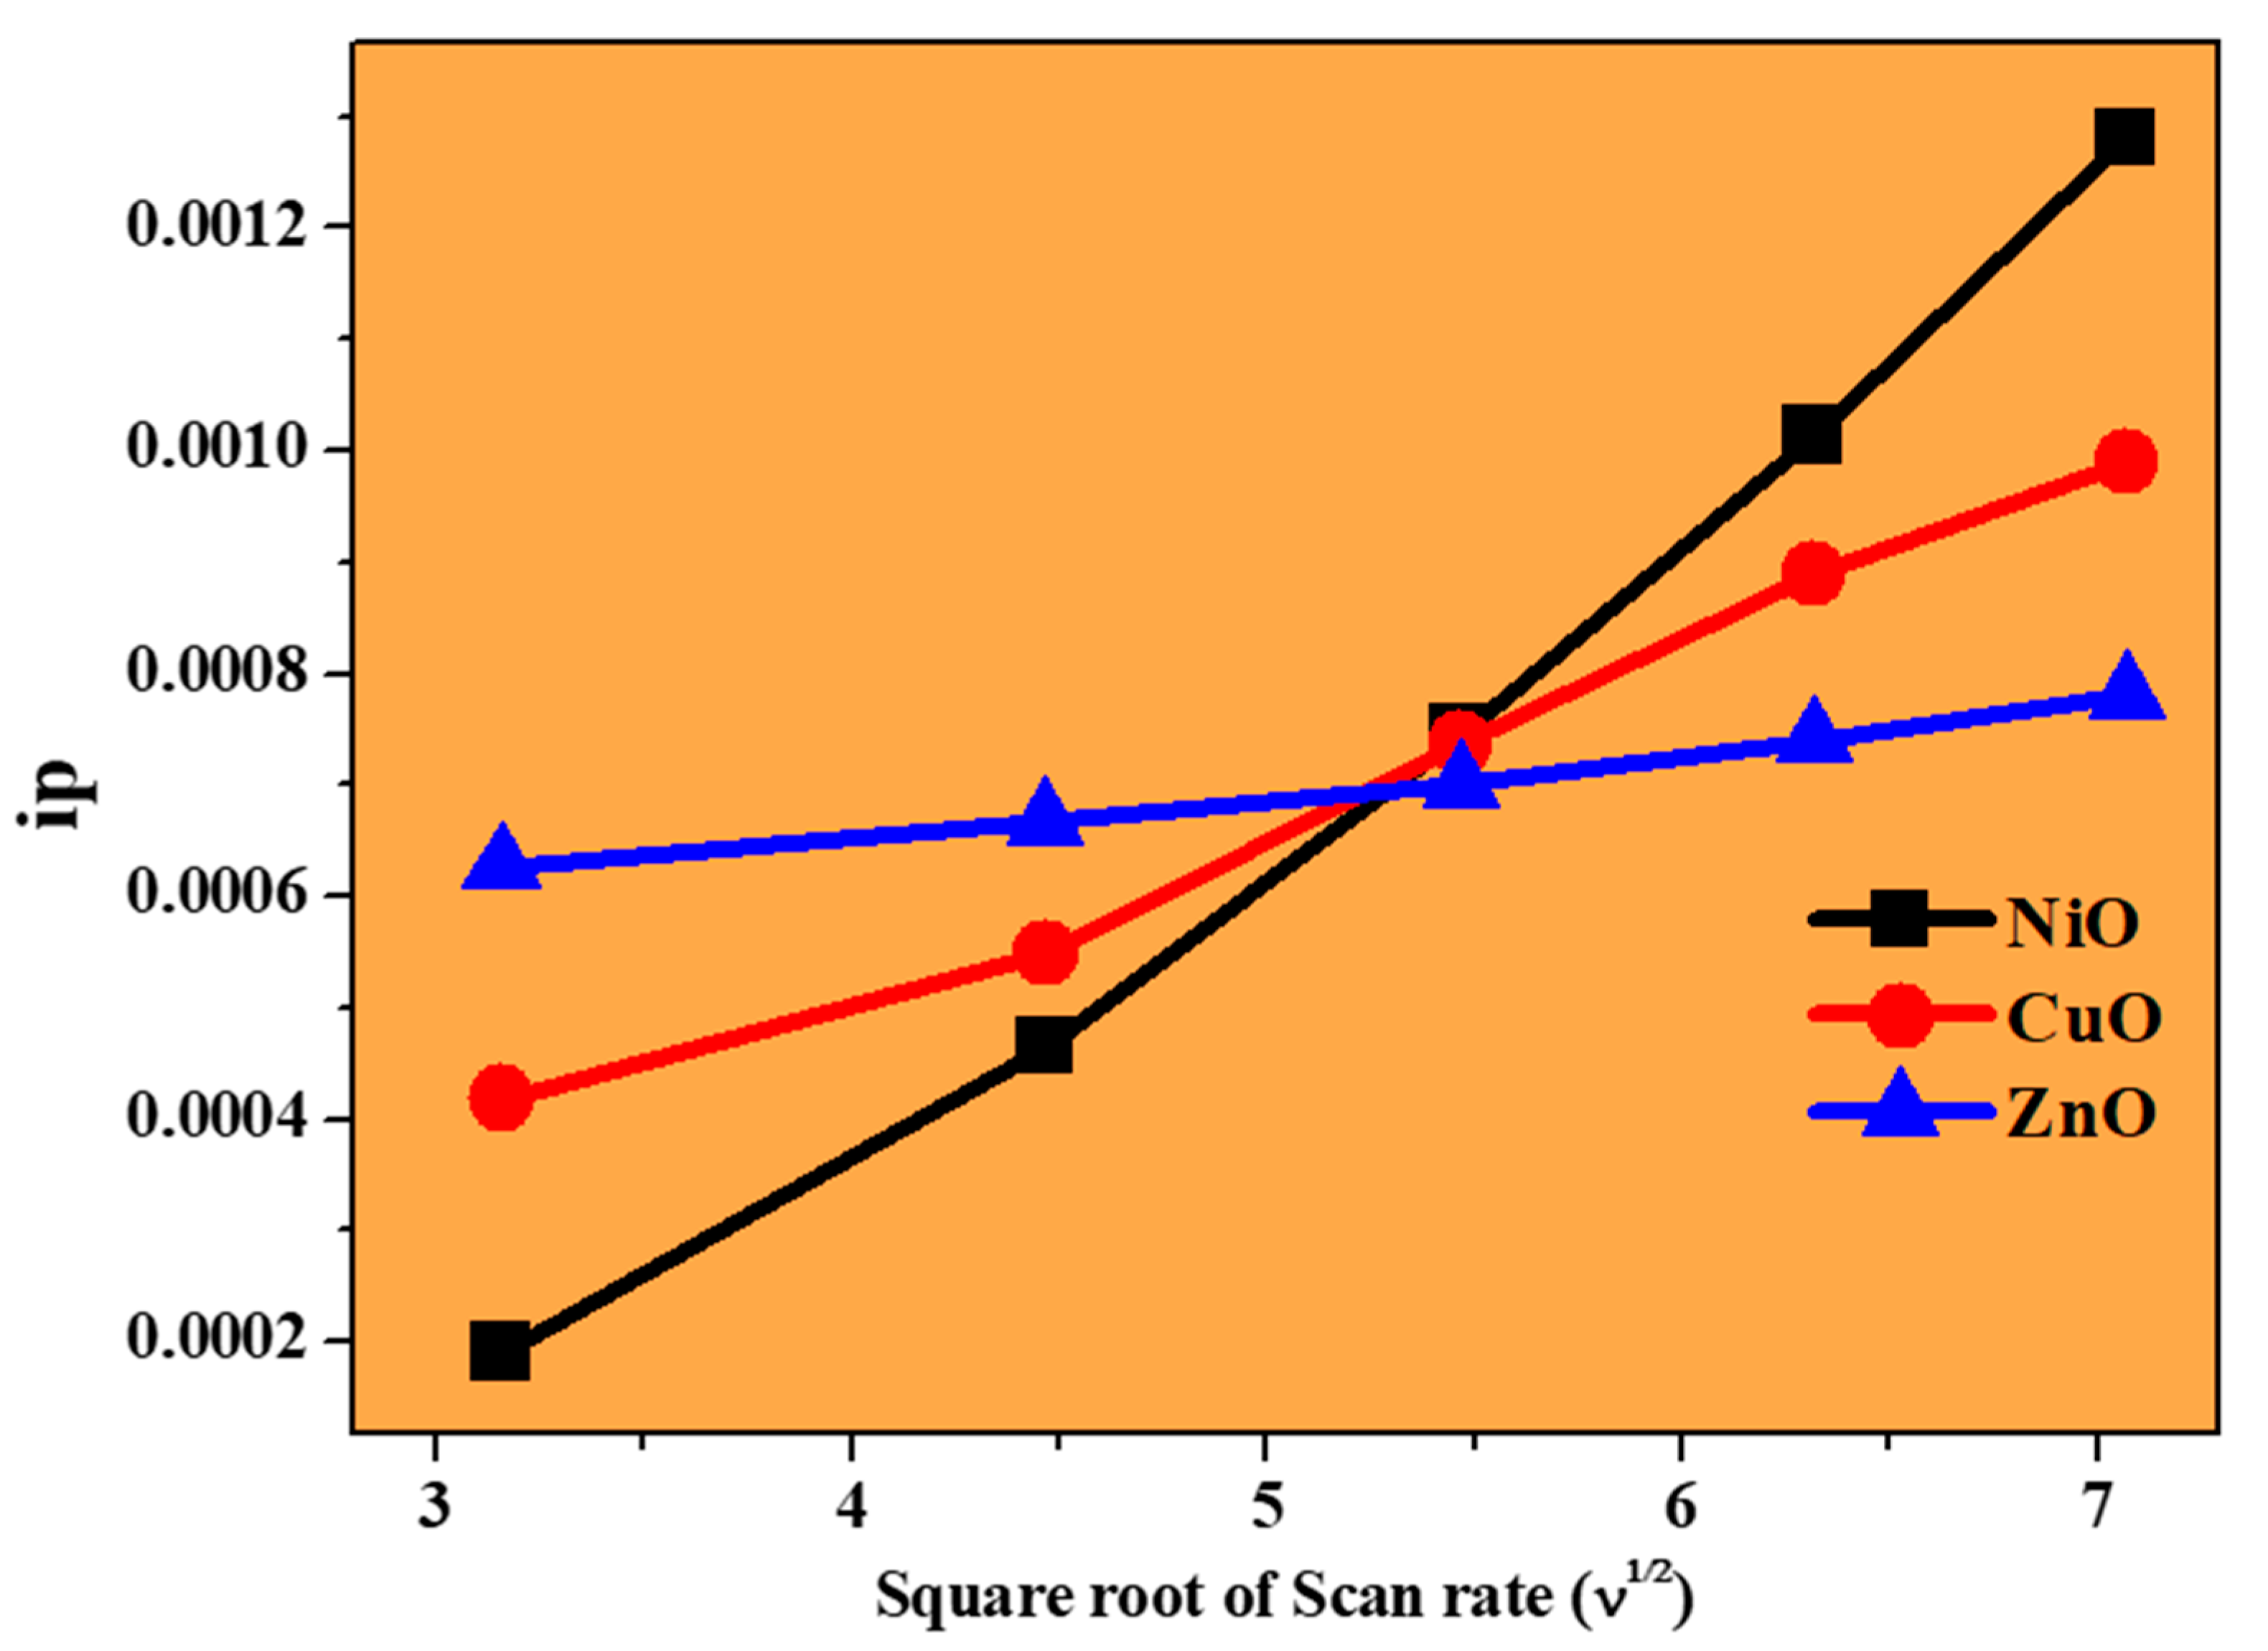
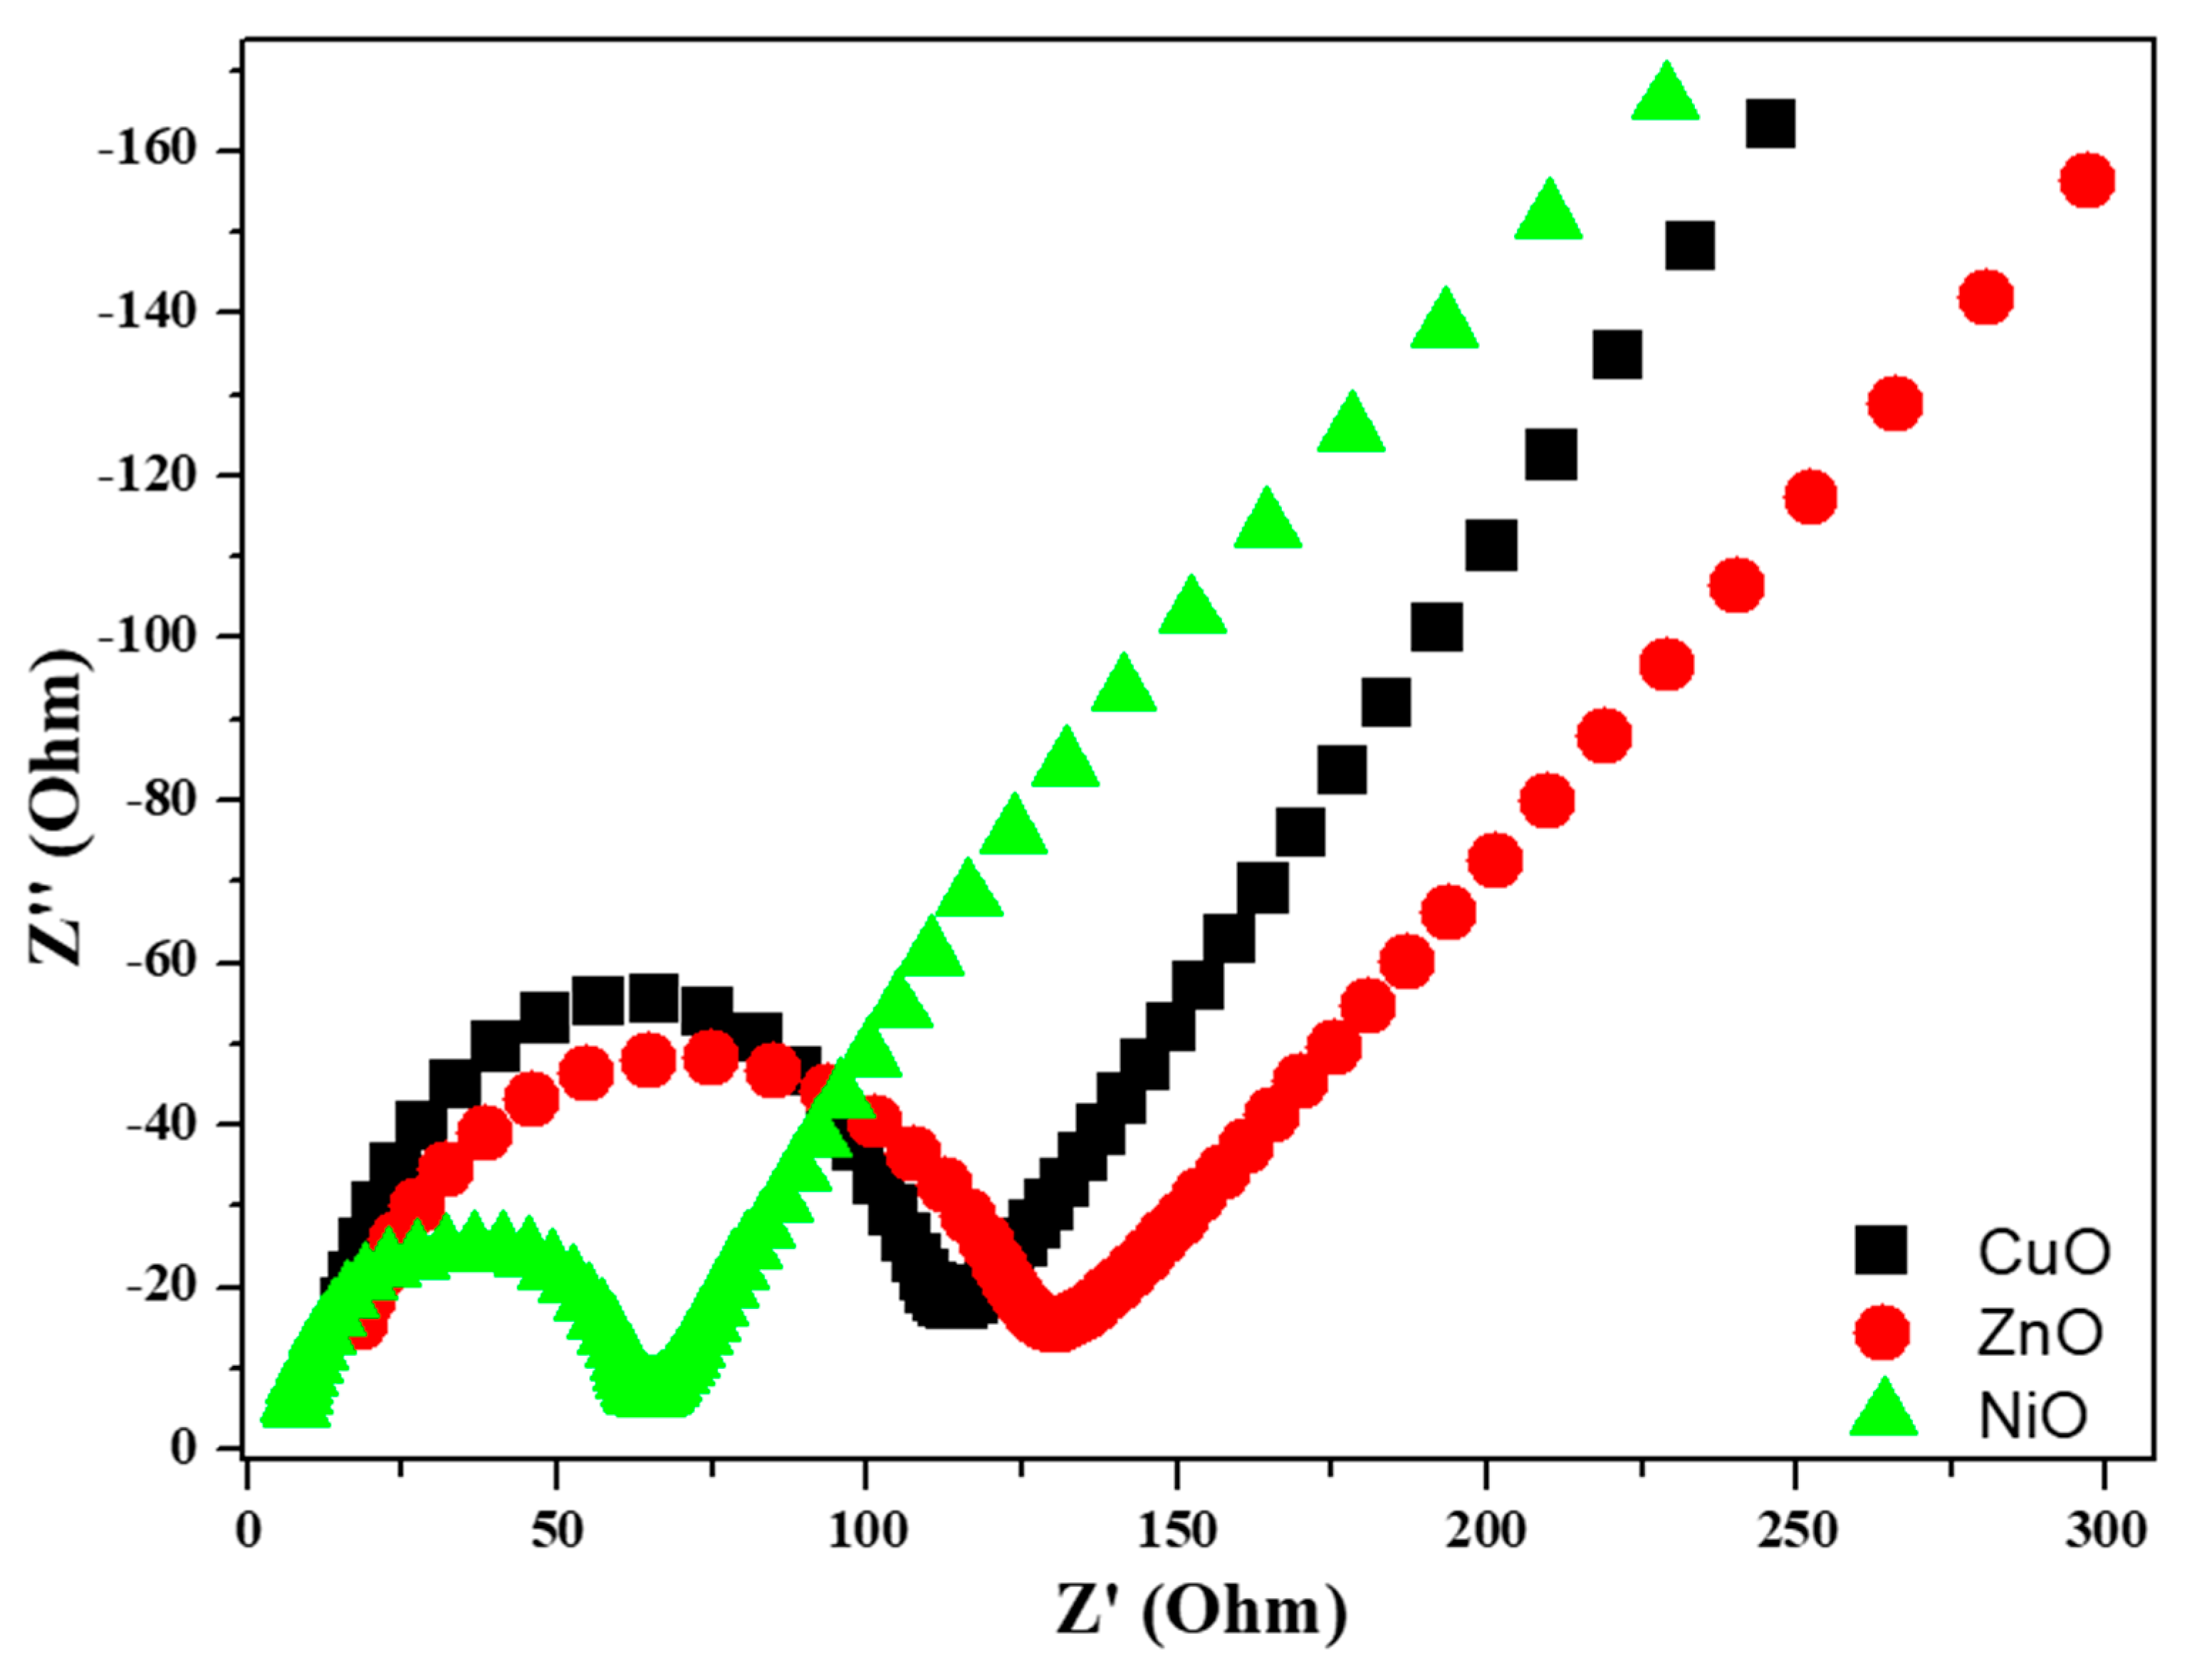
3.7. Electrochemical Studies

To determine the charge, transfer resistance, and conduction efficiency of the prepared metal oxides (NiO, ZnO and CuO) using a green method, electrochemical studies were carried out on the metal oxides. The electrochemical studies were performed using a three-electrode system, with 1 M KOH solution being used as an electrolyte and glucose being used to investigate the sensing capability of the prepared metal oxides. By calculating the charge transfer resistance, it is possible to determine the separation efficiency between the holes and the generated electrons. The CV studies were carried out with Ag/AgCl as a reference electrode and platinum as a counter electrode, and the results were used to determine the charge efficiency and reversibility of the reaction. To determine the material stability, various scan rate studies were carried out, and the results are depicted in Figure 8.
The CV technique was used to determine the electrochemical behavior (reduction–oxidation) of the electrodes. The shape of the CV curve was determined by the shape of the electric double-layer capacitance, where the capacitance was determined by the complete redox reaction of the electrodes [23,24]. In ZnO, an electron will be given out, resulting in Zn0 becoming Zn2+, in NiO Ni0 becoming Ni2+, and in CuO Cu0 becoming Cu2+; as a result, an anodic peak is formed and can be clearly seen in Figure 9. When the reduction occurs from Zn2+, Ni2+, and Cu2+ to Zn0, Ni0, and Cu0, respectively, a cathodic peak will be formed. It is clear from the CV graphs that both reduction and oxidation peaks can be found in all the synthesized materials. The reduction peak potentials for NiO, ZnO, and CuO were 0.16 V, −0.81 V, and −0.6 V, respectively. As a result, the reduction peak potential for NiO, ZnO, and CuO was 0.28 V, −0.19 V, and −0.37 V, respectively. As seen in Figure 9, as the scan rate is increased, the peak currents of both the oxidation and reduction peaks increase. At the same time, the oxidation peaks shift slightly to the positive side of the potential, whereas the reduction peaks shift slightly to the negative side of the potential [23].
To confirm the electrode process, a graph of peak current versus scan rate is plotted, as shown in Figure 10. A linear line can be observed for all the metal oxides, indicating that the reaction was diffusion controlled [25,26]. According to the graph, a particular linear line was observed, which corresponds to NiO, where an increase in peak currents was observed, and this could be due to the high reversibility of the electrode reaction and was also confirmed by the results of the CV experiments. For the prepared metal oxides, EIS studies were carried out to better understand the resistance provided by the metal oxides themselves, which is shown in Figure 11. Each of the three regions in the Nyquist plot can be distinguished as follows: (1) the semicircle region, which can be used to determine the resistance offered by different materials; (2) the Warburg element, and (3) slope, which represents ion transport [27,28]. It is clear from the results that the NiO electrode has a smaller semicircle than the CuO and ZnO electrodes. This may be attributed to the ohmic resistance offered by the NiO electrode in the basic medium.

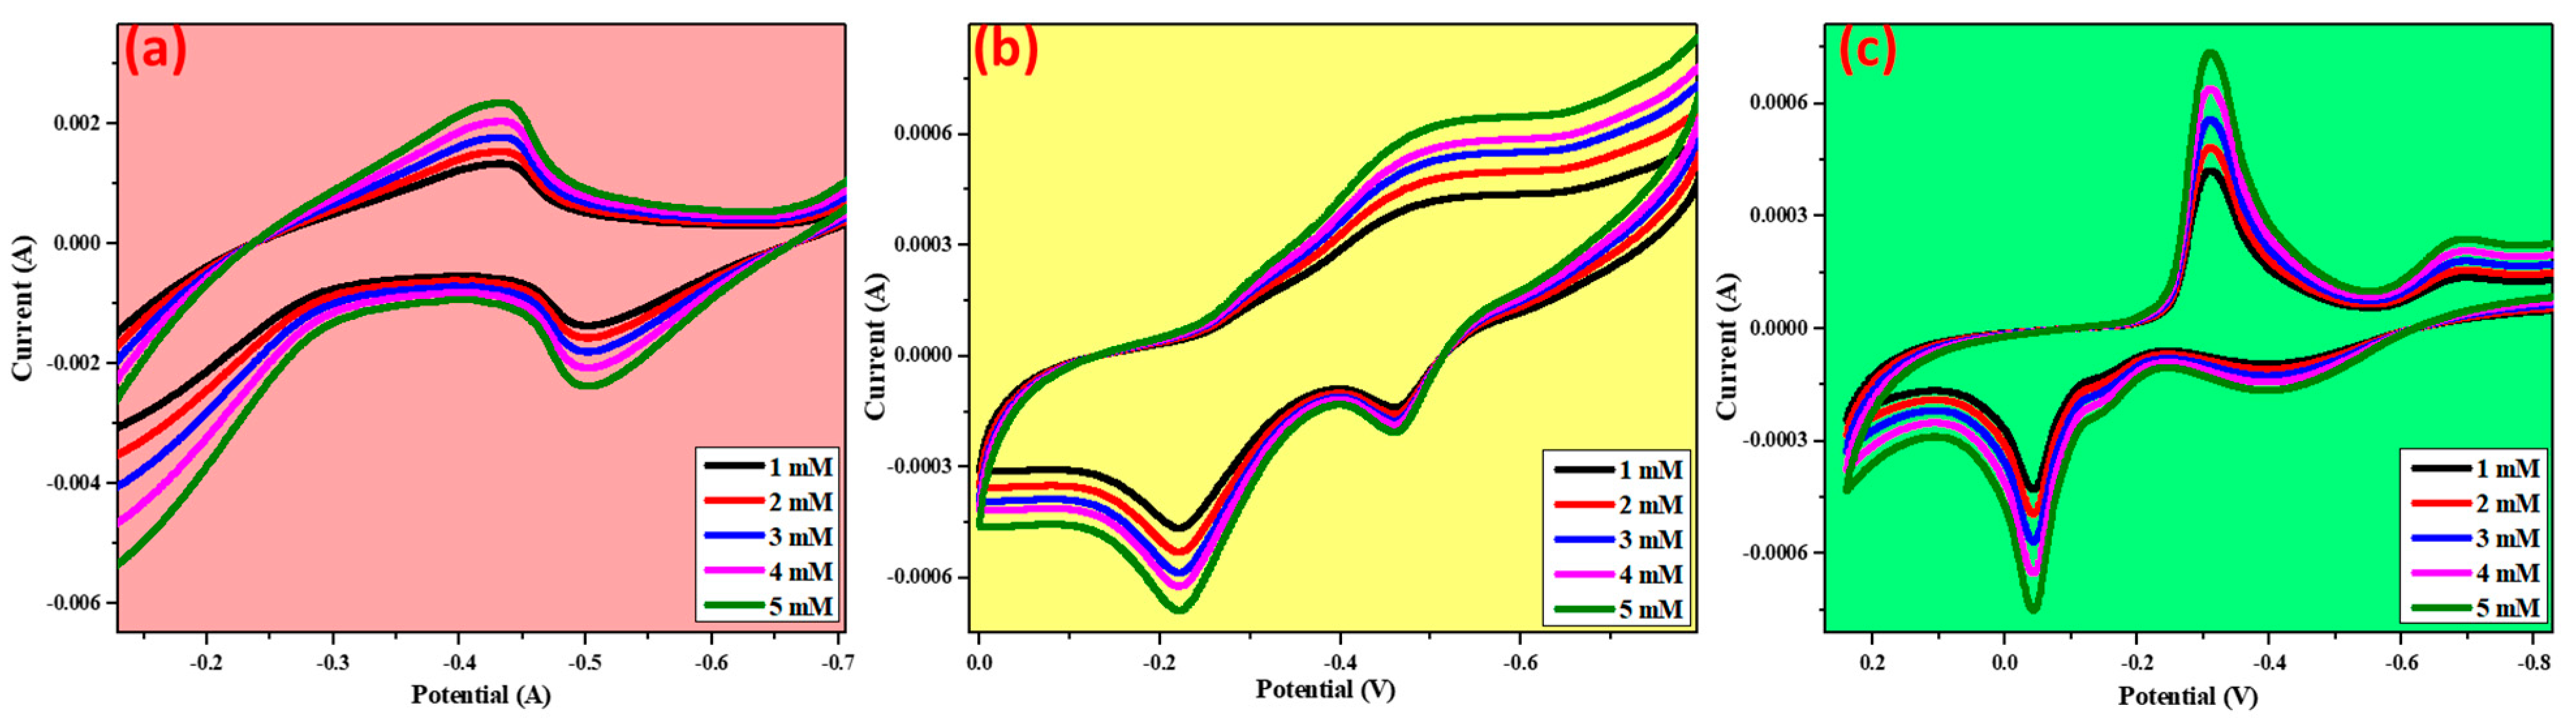
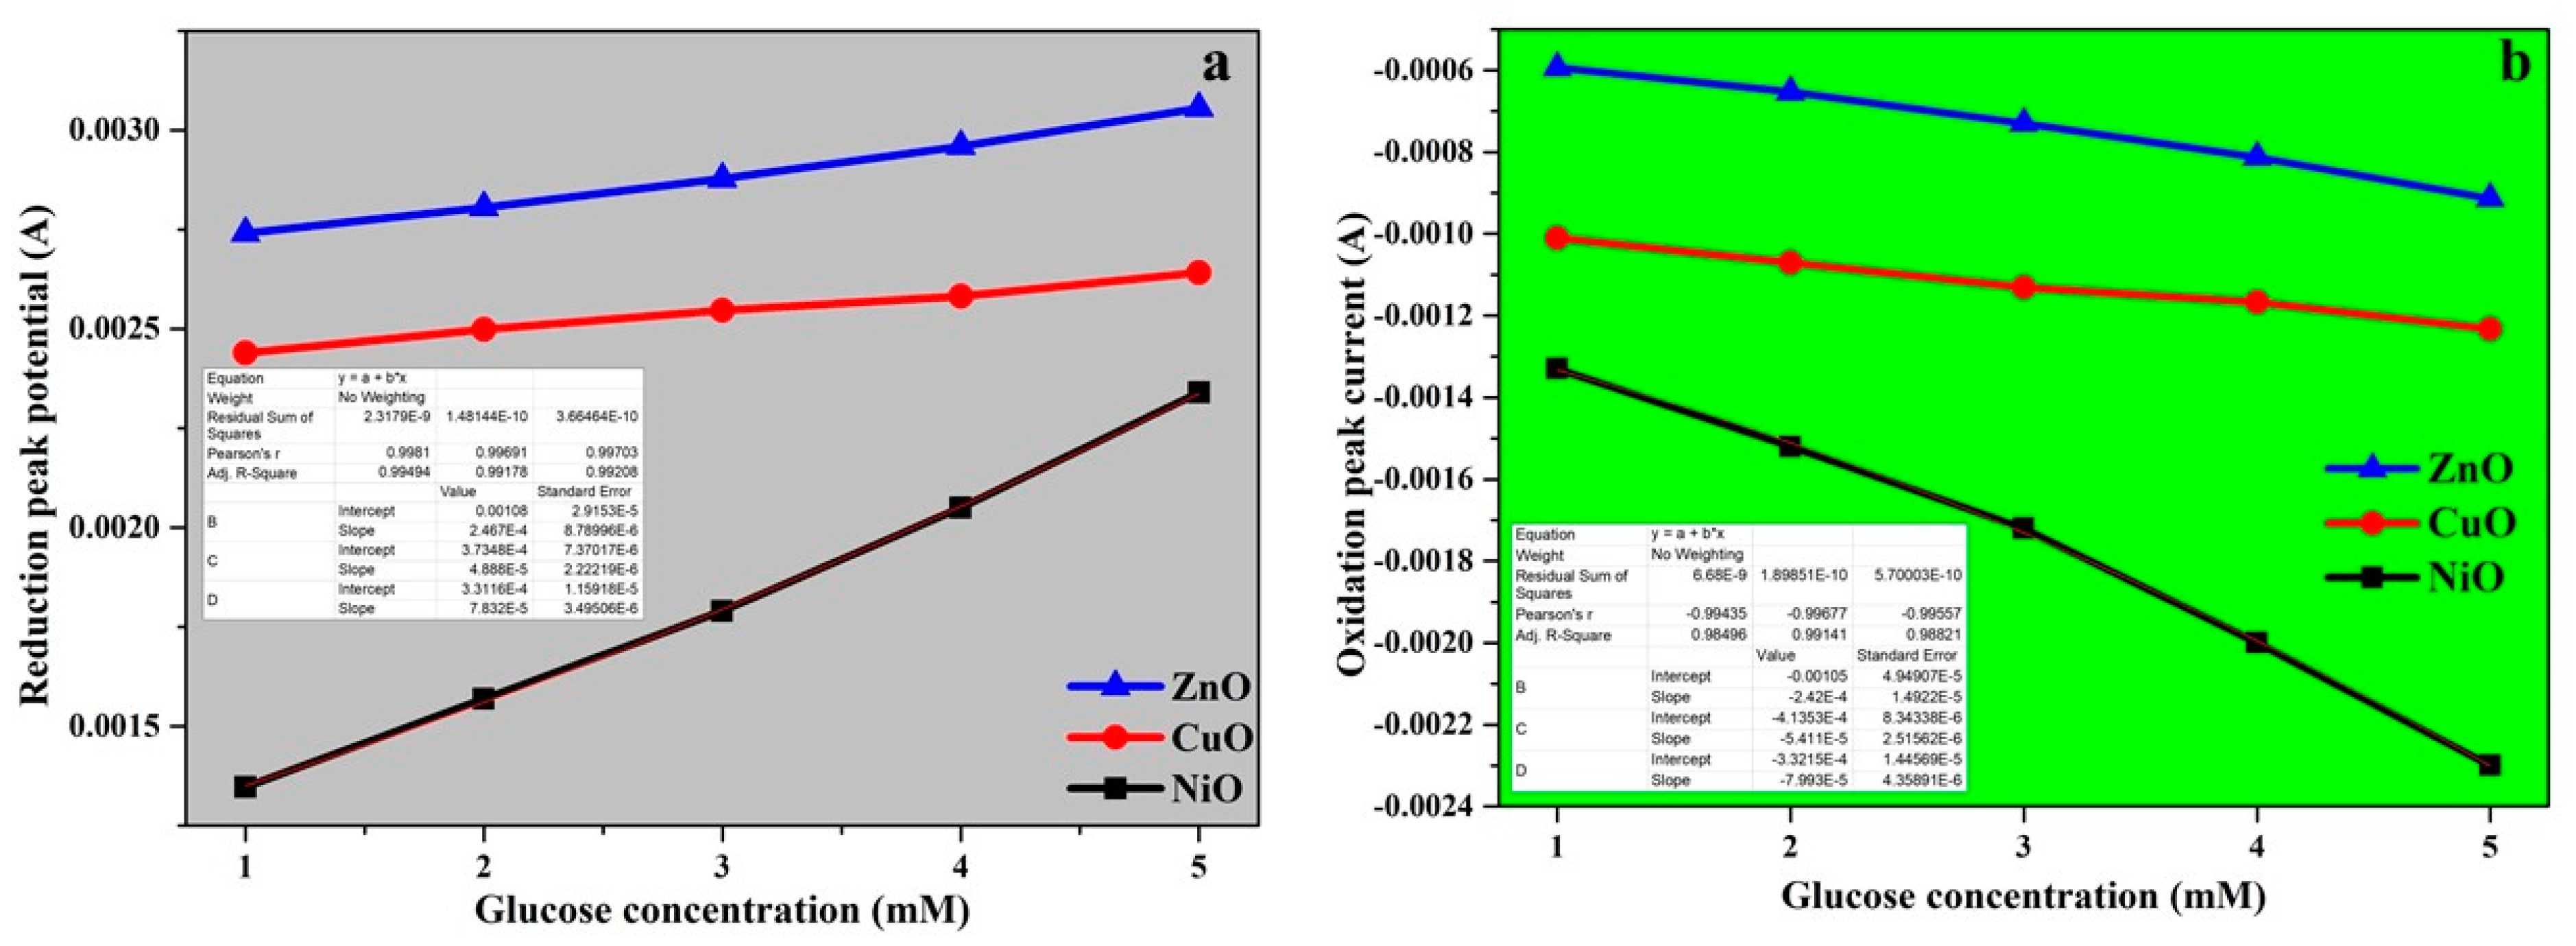
3.8. Glucose Sensing

By using glucose as the analyte, the prepared metal oxides were evaluated for their sensing applicability. Glucose was first dissolved in double-distilled water, and then a known concentration of the glucose solution was added to the electrolyte solution to determine its sensing ability. According to the data shown in Figure 12, there is a significant difference between the anodic and cathodic peak intensities, confirming that the synthesized metal oxides are appropriate for use in sensing applications. A peak at −0.2 V corresponds to the anodic oxidation peak, and a peak at −0.5 V corresponds to the cathodic reduction peak [29], as can be observed in Figure 12. As the concentration of the sensing analyte increases, there is no significant shift in the peak, and both the oxidation and reduction peaks are clearly visible, indicating that CuO is suitable for use as a glucose sensor [29,30,31]. NiO exhibits a significant shift in both the oxidation and reduction peaks, with the oxidation peak shifting completely to the negative potential (−0.5 V) and the reduction peak shifting completely to the positive potential (−0.43 V) [32,33]. In the case of ZnO, two oxidation peaks were observed at −0.04 and −0.4 V, as well as an appearance of a reduction peak near −0.3 V [34,35,36,37]. It has been observed that, with increasing concentration of the analyte, an increase in peak intensity is observed, with no shift in the peak observed to either side of the potential [22,38,39,40,41]. Based on the information presented above, we can conclude that the metal oxides prepared using a green approach are suitable for glucose sensing in a basic medium.
Figure 13a,b depicts the calibration curves for both the oxidation and reduction peak currents with respect to glucose concentration based on the fitted data. According to the results, the oxidation peak potential for NiO, CuO, and ZnO were −0.49, −0.21, and −0.04 V, whereas the reduction peak potential for NiO, CuO, and ZnO were −0.43, −0.48, and 0.30 V, respectively. The sensing activity is a diffusion-controlled process, and the calibration curve can be used to illustrate this.

4. Conclusions

Using a green combustion approach, we have successfully synthesized three metal oxides: nickel oxide, copper oxide, and zinc oxide. The PXRD analysis confirms the phase purity of the samples, and the planes obtained from the analysis are in good agreement with the SAED pattern obtained from the TEM analysis. The metal oxides that were prepared were tested for a variety of applications, including photocatalysis and sensors. To determine the photocatalytic ability of the metal oxides, AR88 dye was used as a test substrate and the obtained results were notably appreciable. It should be noted that ZnO exhibited a greater photocatalytic activity than NiO and CuO. The sensing ability of the metal oxides was investigated using glucose as a sensing analyte. Because of their abilities and the obtained results, it can be concluded that the synthesized metal oxides have the potential to be used in a variety of applications.

Author Contributions

M.W.A., M.A. (Muhammad Aamir), M.F., M.A. (Maryam Albuhulayqah), M.M.A. fabricated and measured the samples, wrote the main manuscript text, and prepared the figures. C.R.R., V.G.D.K., H.C.A.M. worked on XRD and TEM characterization. All the authors reviewed the manuscript. All authors have read and agreed to the published version of the manuscript.

Funding

The authors acknowledge the Deanship of Scientific Research at King Faisal University for financial support under the DSR Annual Project (Grant No. 180120).

Conflicts of Interest

The authors declare no competing interests.

References

  1. GLASS; WHO. Investing in Water and Sanitation: Increasing Access, Reducing Inequalities, UN-Water Global Analysis and Assessment of Sanitation and Drinking-Water, GLAAS 2014 Report (GLASS, 2014); WHO: Geneva, Switzerland, 2014. [Google Scholar]
  2. UNESCO. Water and Jobs: The UN World Water Development Report (UNESCO-WWAP, 2016); UNESCO: Paris, France, 2016. [Google Scholar]
  3. Schneider, J.; Matsuoka, M.; Takeuchi, M.; Zhang, J.; Horiuchi, Y.; Anpo, M.; Bahnemann, D.W. Understanding TiO2 Photocatalysis: Mechanisms and Materials. Chem. Rev. 2014, 114, 9919–9986. [Google Scholar] [CrossRef] [PubMed]
  4. Kumar, A.N.; Jnaneshwara, D.; Nagabhushana, H.; Prashantha, S.; Chandrasekhar, M.; Ravikumar, C.; Kumar, M.A.; Basavaraju, N.; Shekhar, T.S.; Premkumar, H. Enhanced photoluminescence, electrochemical and photocatalytic activity of combustion synthesized La10Si6O27:Dy3+ nanophosphors. J. Sci. Adv. Mater. Devices 2021, 6, 49–57. [Google Scholar] [CrossRef]
  5. Vasudha, M.; Khan, A.A.; Bhumika, K.; Gayathri, D.; Nagaswarupa, H.; Shekhar, T.S.; Raghavendra, N.; Ravikumar, C.; Murthy, H.A.; Vinutha, K.; et al. Facile chemical synthesis of Ca3MgAl10O17 nanomaterials for photocatalytic and non-enzymatic sensor applications. Sens. Int. 2021, 2, 100082. [Google Scholar] [CrossRef]
  6. Ranjitha, R.; Meghana, K.N.; Kumar, V.G.D.; Bhatt, A.S.; Jayanna, B.K.; Ravikumar, C.R.; Santosh, M.S.; Madhyastha, H.; Sakai, K. Rapid photocatalytic degradation of cationic organic dyes using Li-doped Ni/NiO nanocomposites and their electrochemical performance. New J. Chem. 2021, 45, 796–809. [Google Scholar] [CrossRef]
  7. Avinash, B.; Ravikumar, C.; Kumar, M.A.; Santosh, M.; Pratapkumar, C.; Nagaswarupa, H.; Murthy, H.A.; Deshmukh, V.; Bhatt, A.S.; Jahagirdar, A.; et al. NiO bio-composite materials: Photocatalytic, electrochemical and supercapacitor applications. Appl. Surf. Sci. Adv. 2021, 3, 100049. [Google Scholar] [CrossRef]
  8. Abebe, B.; Ravikumar, C.; Zereffa, E.A.; Kumar, A.N.; Murthy, H.A. Photocatalytic and superior ascorbic acid sensor activities of PVA/Zn-Fe-Mn ternary oxide nanocomposite. Inorg. Chem. Commun. 2021, 123, 108343. [Google Scholar] [CrossRef]
  9. Amulya, M.S.; Nagaswarupa, H.P.; Kumar, M.A.; Ravikumar, C.R.; Kusuma, K.B. Enhanced photocatalytic and elec-trochemical properties of Cu doped NiMnFe2O4 nanoparticles synthesized via probe sonication method. Appl. Surf. Sci. 2020, 2, 100038. [Google Scholar] [CrossRef]
  10. Waqas, A.M.; Khatoon, U.; Qurashi, A. Synthesis and characterization of Cu-SnO2 nanoparticles deposited on glass using ultrasonic spray pyrolysis and their H2S sensing properties. Curr. Nanosci. 2012, 8, 919–924. [Google Scholar] [CrossRef]
  11. Kumar, V.D.; Balaji, K.; Viswanatha, R.; Ambika, G.; Roopa, R.; Basavaraja, B.; Chennabasappa, M.; Kumar, C.R.; Chen, Z.; Bui, X.-T.; et al. Visible light photodegradation of 2,4-dichlorophenol using nanostructured NaBiS2: Kinetics, cytotoxicity, antimicrobial and electrochemical studies of the photocatalyst. Chemosphere 2021, 287, 132174. [Google Scholar] [CrossRef]
  12. Pratapkumar, C. Structural, photo catalytic and electrochemical studies on facile combustion synthesized low-cost nano chromium (III) doped polycrystalline magnesium aluminate spinels. J. Sci. Adv. Mater. Devices 2021, 6, 462–471. [Google Scholar] [CrossRef]
  13. Hoffmann, M.R.; Martin, S.T.; Choi, W.; Bahnemann, D.W. Environmental Applications of Semiconductor Photocatalysis. Chem. Rev. 1995, 95, 69–96. [Google Scholar] [CrossRef]
  14. Solanki, P.R.; Kaushik, A.; Agrawal, V.V.; Malhotra, B.D. Nanostructured metal oxide-based biosensors. NPG Asia Mater. 2011, 3, 17–24. [Google Scholar] [CrossRef]
  15. Guo, T.; Yao, M.-S.; Lin, Y.-H.; Nan, C.-W. A comprehensive review on synthesis methods for transition-metal oxide nanostructures. CrystEngComm 2015, 17, 3551–3585. [Google Scholar] [CrossRef]
  16. Devan, R.S.; Patil, R.A.; Lin, J.-H.; Ma, Y.-R. One-Dimensional Metal-Oxide Nanostructures: Recent Developments in Synthesis, Characterization, and Applications. Adv. Funct. Mater. 2012, 22, 3326–3370. [Google Scholar] [CrossRef]
  17. Navyashree, G.R.; Nagabhushana, H.; Sunitha, D.V.; Yeshodamma, S. Synthesis of TiO2 nanoparticles by solution com-bustion technique using different plant extracts. Int. J. Eng. Res. 2016, 50, 790–991. [Google Scholar]
  18. Raj, N.B.; PavithraGowda, N.; Pooja, O.; Purushotham, B.; Kumar, M.A.; Sukrutha, S.; Ravikumar, C.; Nagaswarupa, H.; Murthy, H.A.; Boppana, S.B. Harnessing ZnO nanoparticles for antimicrobial and photocatalytic activities. J. Photochem. Photobiol. 2021, 6, 100021. [Google Scholar] [CrossRef]
  19. Saravanakkumar, D. Synthesis of NiO doped ZnO/MWCNT nanocomposite and its characterization for photocatalytic & antimicrobial applications. J. Appl. Phys. 2018, 10, 73–83. [Google Scholar]
  20. Ethiraj, A.S.; Kang, D.J. Synthesis and characterization of CuO nanowires by a simple wet chemical method. Nanoscale Res. Lett. 2012, 7, 70. [Google Scholar] [CrossRef] [Green Version]
  21. Nayak, R.; Ali, F.A.; Mishra, D.K.; Ray, D.; Aswal, V.; Sahoo, S.K.; Nanda, B. Fabrication of CuO nanoparticle: An efficient catalyst utilized for sensing and degradation of phenol. J. Mater. Res. Technol. 2020, 9, 11045–11059. [Google Scholar] [CrossRef]
  22. Kumar, M.R.A.; Abebe, B.; Nagaswarupa, H.P.; Murthy, H.C.A.; Ravikumar, C.R.; Sabir, F.K. Enhanced photocatalytic and electrochemical performance of TiO2-Fe2O3 nanocomposite: Its applications in dye decolorization and as supercapacitors. Sci. Rep. 2020, 10, 1–15. [Google Scholar] [CrossRef] [Green Version]
  23. Kusuma, K.; Manju, M.; Ravikumar, C.; Nagaswarupa, H.; Amulya, M.S.; Anilkumar, M.; Avinash, B.; Gurushantha, K.; Ravikantha, N. Photocatalytic and electrochemical sensor for direct detection of paracetamol comprising γ-aluminium oxide nanoparticles synthesized via sonochemical route. Sens. Int. 2020, 1, 100039. [Google Scholar] [CrossRef]
  24. Ravikumar, C.; Kumar, M.A.; Nagaswarupa, H.; Prashantha, S.; Bhatt, A.S.; Santosh, M.; Kuznetsov, D. CuO embedded β-Ni(OH) 2 nanocomposite as advanced electrode materials for supercapacitors. J. Alloy. Compd. 2018, 736, 332–339. [Google Scholar] [CrossRef]
  25. Kumar, C.R. Synthesis and characterization of β-Ni(OH)2 embedded with MgO and ZnO nanoparticles as nanohybrids for energy storage devices. Mater. Res. Express 2017, 4, 065503. [Google Scholar] [CrossRef]
  26. He, Y.; Chen, W.; Li, X.; Zhang, Z.; Fu, J.; Zhao, C.; Xie, E. Freestanding Three-Dimensional Graphene/MnO2 Composite Networks as Ultralight and Flexible Supercapacitor Electrodes. ACS Nano 2013, 7, 174–182. [Google Scholar] [CrossRef]
  27. Bard, A.J.; Faulkner, L.R. Electrochemical Methods, Fundamentals and Applications, 2nd ed.; Wiley: New York, NY, USA, 2001. [Google Scholar]
  28. Viswanathan, V.V.; Salkind, A.J.; Kelley, J.J.; Ockerman, J.B. Effect of state of charge on impedance spectrum of sealed cells Part II: Lead acid batteries. J. Appl. Electrochem. 1995, 25, 729–739. [Google Scholar] [CrossRef]
  29. Ashwini, R.; Dileepkumar, V.; Balaji, K.; Viswanatha, R.; Ravikumar, C.; Srivastava, C.; Santosh, M.S. Ternary alkali metal chalcogenide engineered reduced graphene oxide (rGO) as a new class of composite (NaFeS2-rGO) and its electrochemical performance. Sens. Int. 2021, 2, 100125. [Google Scholar] [CrossRef]
  30. Wang, X.; Hu, C.; Liu, H.; Du, G.; He, X.; Xi, Y. Synthesis of CuO nanostructures and their application for nonenzymatic glucose sensing. Sens. Actuators B Chem. 2010, 144, 220–225. [Google Scholar] [CrossRef]
  31. Ibupoto, Z.H.; Khun, K.; Lu, J.; Willander, M. The synthesis of CuO nanoleaves, structural characterization, and their glucose sensing application. Appl. Phys. Lett. 2013, 102, 103701. [Google Scholar] [CrossRef]
  32. Li, R.; Liu, X.; Wang, H.; Wu, Y.; Chan, K.; Lu, Z. Sandwich nanoporous framework decorated with vertical CuO nanowire arrays for electrochemical glucose sensing. Electrochim. Acta 2019, 299, 470–478. [Google Scholar] [CrossRef]
  33. Mishra, S.; Yogi, P.; Sagdeo, P.R.; Kumar, R. Mesoporous Nickel Oxide (NiO) Nanopetals for Ultrasensitive Glucose Sensing. Nanoscale Res. Lett. 2018, 13, 16. [Google Scholar] [CrossRef] [Green Version]
  34. Wang, L.; Xie, Y.; Wei, C.; Lu, X.; Li, X.; Song, Y. Hierarchical NiO Superstructures/Foam Ni Electrode Derived from Ni Metal-Organic Framework Flakes on Foam Ni for Glucose Sensing. Electrochim. Acta 2015, 174, 846–852. [Google Scholar] [CrossRef]
  35. Kavitha, T.; Gopalan, A.I.; Lee, K.-P.; Park, S.-Y. Glucose sensing, photocatalytic and antibacterial properties of graphene–ZnO nanoparticle hybrids. Carbon 2012, 50, 2994–3000. [Google Scholar] [CrossRef]
  36. Kim, J.Y.; Jo, S.-Y.; Sun, G.-J.; Katoch, A.; Choi, S.-W.; Kim, S.S. Tailoring the surface area of ZnO nanorods for improved performance in glucose sensors. Sens. Actuators B Chem. 2014, 192, 216–220. [Google Scholar] [CrossRef]
  37. Ahmad, R.; Tripathy, N.; Khan, M.Y.; Bhat, K.S.; Ahn, M.-S.; Khang, G.; Hahn, Y.-B. Hierarchically assembled ZnO nanosheets microspheres for enhanced glucose sensing performances. Ceram. Int. 2016, 42, 13464–13469. [Google Scholar] [CrossRef]
  38. Dhananjaya, N.; Ambujakshi, N.; Raveesha, H.; Pratibha, S.; Ravikumar, C. Electrochemical Sensor and luminescence applications of Chonemorpha fragrans leaf extract mediated ZnO/Ag nanostructures. Appl. Surf. Sci. Adv. 2021, 4, 100075. [Google Scholar] [CrossRef]
  39. Avinash, B.; Ravikumar, C.; Kumar, M.A.; Nagaswarupa, H.; Santosh, M.; Bhatt, A.S.; Kuznetsov, D. Nano CuO: Electrochemical sensor for the determination of paracetamol and d-glucose. J. Phys. Chem. Solids 2019, 134, 193–200. [Google Scholar] [CrossRef]
  40. Girish, K.; Prashantha, S.; Nagabhushana, H.; Ravikumar, C.; Nagaswarupa, H.; Naik, R.; Premakumar, H.; Umesh, B. Multi-functional Zn2TiO4: Sm3+ nanopowders: Excellent performance as an electrochemical sensor and an UV photocatalyst. J. Sci. Adv. Mater. Devices 2018, 3, 151–160. [Google Scholar] [CrossRef]
  41. Manjunatha, A.; Pavithra, N.; Shivanna, M.; Nagaraju, G.; Ravikumar, C. Synthesis of Citrus Limon mediated SnO2-WO3 nanocomposite: Applications to photocatalytic activity and electrochemical sensor. J. Environ. Chem. Eng. 2020, 8, 104500. [Google Scholar] [CrossRef]
Figure 1. Schematic representation of NCZ NPs.
Crystals 11 01467 g001
Figure 2. X-ray diffractogram of all the synthesized metal oxides (NiO, CuO, and ZnO).
Crystals 11 01467 g002
Figure 3. Functional group analysis of all the synthesized metal oxides by FT-IR spectroscopy.
Crystals 11 01467 g003
Figure 4. TEM analysis and SAED pattern of synthesized photocatalyst: (a,d) CuO; (b,e) NiO; (c,f) ZnO.
Crystals 11 01467 g004
Figure 5. (a) DRS spectra and (b) Energy bandgap of all the MO samples.
Crystals 11 01467 g005
Figure 6. AR88 dye adsorption spectra with respect to time for the synthesized metal oxides (a) NiO, (b) CuO, (c) ZnO.
Crystals 11 01467 g006
Figure 7. (a) Effect of metal oxides on the degradation of AR88 dye. (b) Percentage degradation with a time interval of 15 min. (c) Degradation percentage of metal oxides on AR88 dye.
Crystals 11 01467 g007
Figure 8. Pictorial representation of possible photocatalytic mechanism.
Crystals 11 01467 g008
Figure 9. Cyclic voltametric studies of prepared metal oxides (a) NiO, (b) CuO, (c) ZnO in 0.1M KOH.
Crystals 11 01467 g009
Figure 10. Plot of peak current versus square root of scan rate.
Crystals 11 01467 g010
Figure 11. Nyquist plots of the prepared metal oxides.
Crystals 11 01467 g011
Figure 12. Glucose sensing for the prepared metal oxides by cyclic voltametric studies, (a) NiO, (b) CuO, (c) ZnO.
Crystals 11 01467 g012
Figure 13. (a) Oxidation peak current response vs. Glucose concentration with fitted data, (b) Reduction peak current response vs. Glucose concentration with fitted data.
Crystals 11 01467 g013
Table 1. Average crystallite size of the metal oxides synthesized via the green method.
Metal OxidesAverage Crystallite Size (nm)
NiO30–50
CuO30–60
ZnO25–40
Publisher’s Note: MDPI stays neutral with regard to jurisdictional claims in published maps and institutional affiliations.

