Abstract
In recent years, time of flight-secondary ion mass spectrometer (ToF-SIMS) has been widely employed to acquire surface information of materials. Here, we investigated the alloy surface by combining the mass spectra and 2D mapping images of ToF-SIMS. We found by surprise that these two results seem to be inconsistent with each other. Therefore, other surface characteristic tools such as SEM-EDS were further used to provide additional supports. The results indicated that such differences may originate from the variance of secondary ion yields, which might be affected by crystal orientation.
1. Introduction
The rapid development of advanced experimental methods has made surface analysis a popular research topic. Obtaining the surface/interface information of materials/devices is extremely important, as the quality of surface/interface could directly determine the material/device performance. Solar cells based on hybrid perovskite have been considered as one of the most promising candidates for next generation of photovoltaics [1,2,3]. However, perovskite solar cells exhibited instability problems even under encapsulation [4,5,6,7], i.e., the surface of function layer began to degrade within only hundreds of hours, which limited their practical applications. To resolve this, understanding the degradation mechanism at the surface and improving its stability become imperative and important [8,9]. Moreover, in the battery research, investigating the surface components of cathodes or electrodes could provide kinetic information about the charging/discharging process [10,11], which may help with improving the cell efficiency and developing new materials for batteries. Surface analysis has also been applied into other fields including bioelectronics [12], polymers [13], catalysts [14,15,16], etc.
Nowadays, X-ray photoelectron spectroscopy (XPS) and ToF-SIMS have been considered as the two most powerful tools to probe surface characteristics of different materials. The working principle of XPS is quite straightforward, where the sample is bombarded by X-rays to emit photoelectrons. The binding energy of the photoelectron could then be determined by subtracting its kinetic energy from the total energy [17]. The working principle of ToF-SIMS is also complicated. Typically, a pulsed primary ion beam is employed to bombard the sample surface, which leads to the yields of positive and negative second ions. These secondary ions are then collected into the analyzer by applying high voltage potential and their mass is determined by measuring their time of flight from the sample to the detector [17,18]. The ion mass and 2D imaging could thus be obtained to probe the component and its distribution at the surface of the sample [19,20]. In addition, the excellent sensitivity [17], variable depth probing [21], high spatial resolution and mass range [22] further make ToF-SIMS a popular technique to acquire surface information of materials. In recent years, ToF-SIMS has been widely employed in nano- and bio-materials to investigate their surface and bulk properties [20,22,23,24,25,26,27,28]. In contrast, employing the mass spectra and 2D mapping to analyze the alloy surface has been rarely reported [19,29], which needs to be investigated.
It is, therefore, the purpose of the current report, to investigate the alloy surface characteristics by combining the mass spectra and 2D mapping functions of ToF-SIMS. Both surface components and their spatial distribution could be evaluated. In addition, various regions of interest (ROI) were selected and extracted to compare their compositional difference. However, the results obtained from the mass spectrum, which suggested there is no obvious difference of composition among ROIs, seems to be contradictory with the mapping images. To reveal its reason, SEM-EDS was further conducted, and the results indicated an even distribution of all elements, corresponding well with the mass spectrum. Such phenomenon could be ascribed to their various crystal orientations, which might induce different ion yields of secondary ions, thereby appearing color differences in mapping of various crystals. This work may expand the application of ToF-SIMS to other fields such as probing the sample crystal orientation.
2. Materials and Methods
2.1. Materials
254. SMO austenitic stainless steel (batch: 00Cr20Ni18Mo6CuN) (Jiangsu Haixin steel Inc., Taizhou, China). The specimen was polished with 2000 grit mesh and then electrically polished by the twin-jet electropolishing method in a solution of 5% perchloric acid. Before EDS and ToF-SIMS measurements, sputtering was performed to clean the sample surface. The cleaning was conducted using a 3 kV 100 nA Argon gas beam (area: 600 μm × 600 μm; time: 2 min).
2.2. Characterizations
The scanning electron microscopy (SEM) measurements were carried out on a Regulus 8230 instrument (Hitachi Inc., Naka, Ibaraki, Japan) with EDS function. X-ray diffraction (XRD) patterns were obtained using a Rigaku Smartlab diffractometer with Cu Kα as the X-ray source. ToF-SIMS measurements were conducted with a PHI nano ToF II (ULVAC-PHI Inc., Chigasaki, Kanagawa, Japan), where a 30 kV Bi+ pulsed primary ion beam was used for analysis.
3. Results
3.1. XRD
The crystal structure of the alloy sample was investigated by XRD measurements. As shown in Figure 1, the alloy crystallized into a face-centered cubic (FCC) structure. The diffraction peaks could be assigned to (111), (200), (220) and (311) planes of austenite, respectively, as confirmed by its corresponding Joint Committee on Powder Diffraction Standards (JCPDS) card.
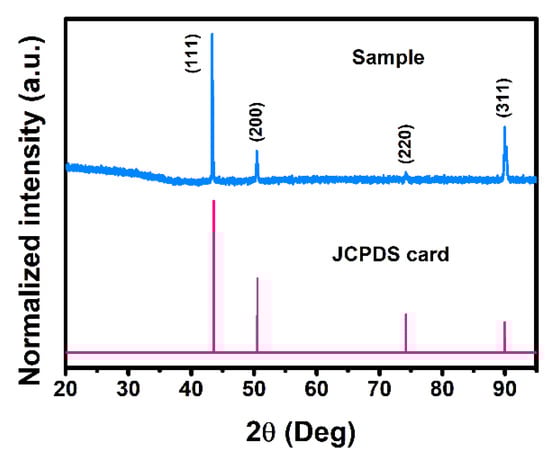
Figure 1.
XRD results of the steel sample.
3.2. Mass Spectra
Next, TOF-SIMS was employed to investigate the components of the sample. It is worth mentioning here that selecting proper ion-beam parameters to conduct the measurements is necessary and important. Both the primary and sputtering ion beams could influence the acquired data [30,31,32] by varying their damage depth, cluster sizes, sputtering rate, etc. For instance, C60+ and Ar+ ion beams could reveal the component distribution of perovskite solar cells more accurately than O2+ beam and Ar-gas cluster ion beam [31] (Ar-GCIB). In the current work, Bi+ was employed as the primary ion source due to its higher monatomic ion yields and better mapping spatial resolution than Bi3+. The sample was sputtered employing an Ar+ ion beam to remove oxides and contaminants on the surface.
The sample surface was etched before ToF-SIMS measurements to remove any oxide/contaminant at the sample surface. Since the probing depth of ToF-SIMS is only within 2 nm, the existence of oxides and contaminants may affect the results. Both positive and negative ions were collected, and the mass spectrum was presented in Figure 2. To calibrate the ToF-SIMS spectra, m/z peaks at 15.0235 (CH3), 27.0235 (C2H3) and 41.0391 (C3H5) were used for the calibration of positive ions spectra, while m/z peaks at 13.0078 (CH), 17.0027 (OH) and 25.0078 (C2H) were selected for the calibration of negative ions spectra. In general, the spectra of both positive ions and negative ions should be measured to acquire complete/full compositional information. From the negative spectral data of the sample, elements including F/N/Cl/S and oxides such as Cr-O/Fe-O/Mo-O were detected, while for positive spectral data, Fe/Ni/Cr, etc., were probed. The spectrum collected from positive ions shows more information about metallic elements, while non-metallic elements were observed from the negative ion mass spectrum. The alloy mainly contained metallic elements including iron (Fe), nickel (Ni), chromium (Cr), molybdenum (Mo), sodium (Na) and calcium (Ca), as well as fluorine (F) and chlorine (Cl) as non-metallic elements. Moreover, the compound information may also be revealed, which is another advantage of ToF-SIMS. As can be observed, chemical compounds such as CrO, FeO and HSiO3 were also formed at the surface of the sample. The formation of oxides could be attributed to the adsorption of carbon and oxygen atoms on the sample surface when it was placed in air. It should be mentioned here that the intensity of each ion in the spectra can reveal their contents qualitatively.
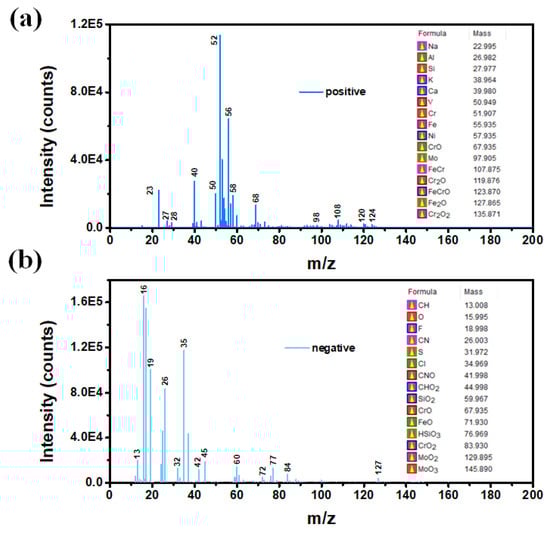
Figure 2.
The mass spectra of the sample measured by (a) positive and (b) negative ion modes.
3.3. 2D Mapping Image
To acquire the surface composition distribution, the 2D mapping images of the sample were further analyzed. To investigate the distribution of each ion, individual color scale bars were employed for both positive and negative modes. Figure 3 illustrates the mapping results collected from positive ions, where grains with different colors could be observed. This color difference might be originated from the variation of surface components, as reported by previous literature [19,23]. In this work, a brighter color of same ion indicates a higher content of the component. In addition, impurities such as Na was found to be concentrated at certain spots, while other components (Fe, Cr, Ni, Mo) were uniformly distributed in the grain. Such distribution difference may vary their properties, which need to be investigated in future.
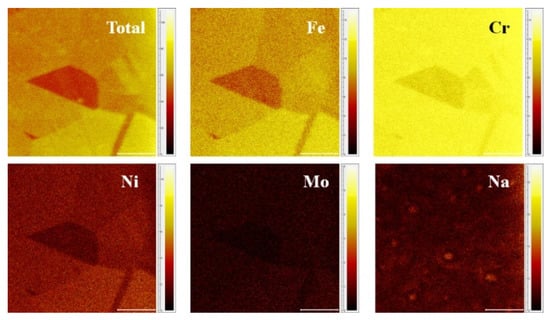
Figure 3.
ToF-SIMS positive ions 2D-mapping of the sample (Scale bar: 100 μm).
ToF-SIMS negative ion maps of the sample were also presented (Figure 4) to reveal more component distribution information. As can be observed, negative ion components (F, O, Cl) exhibited high ion intensity (bright color), while positive ion such as Fe was barely detected when employing negative ion collectors. To investigate the component variation of grains with different colors, ROI measurements were conducted and discussed in the next section.
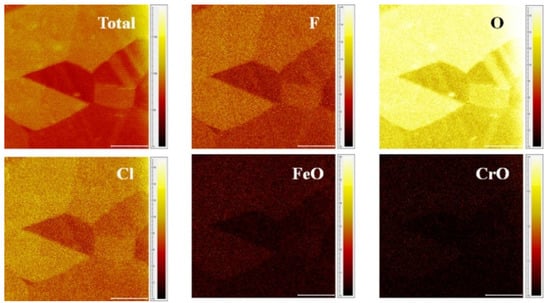
Figure 4.
ToF-SIMS negative ions 2D-mapping of the sample (Scale bar: 100 μm).
3.4. Region of Interest (ROI)
One of the advantages of ToF-SIMS technique is that it can extract ROIs from the mapping images to compare their component variations. Three ROIs derived from positive ion mapping were first demonstrated in Figure 5a. Although the ion intensity (color) is different in three regions, no obvious differences of substrate elemental composition (Cr, Fe, Ni, Mo, etc.) among ROI-1/2/3 were detected, as revealed by their mass spectrum (Figure 5b–d). The above contradiction between mapping images and the mass spectrum was also found in negative ion results (Figure 6). We therefore resolved to other surface characteristic techniques to obtain its element distribution maps.
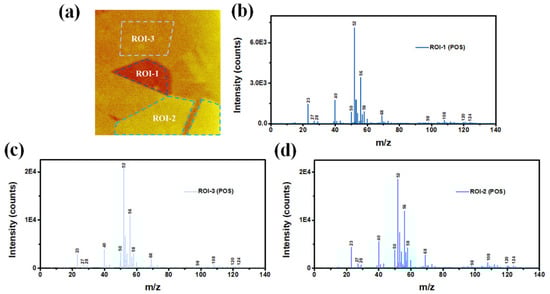
Figure 5.
(a) Three ROIs of ToF-SIMS positive ion map, and (b–d) their corresponding mass spectra.
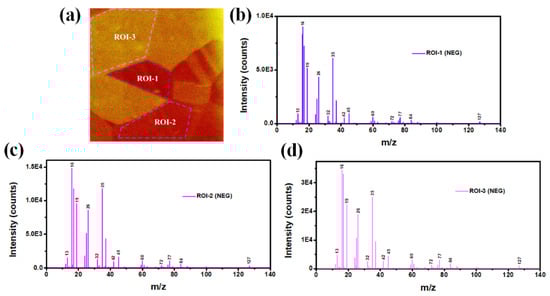
Figure 6.
(a) Three ROIs of ToF-SIMS negative ion map, and (b–d) their corresponding mass spectra.
3.5. SEM-EDS
To make a comparison, the morphology and element distribution of the sample were measured via SEM-EDS. As shown in Figure 7, no grain was observed from planar SEM image. The EDS results (Figure 8) indicated that the sample is mainly composed of Fe, Ni, Mo and Cr, which is consistent with the mass spectrum results. In addition, the existence of Na was not detected in EDS results, which indicated the excellent detective sensitivity of ToF-SIMS (Figure 3). The distribution of elements was demonstrated in Figure 7. All elements were distributed evenly, which is inconsistent with 2D mapping results. To verify, 2D mapping images of positive ions normalized to total ion density were measured and presented in Figure S1, which showed the same distribution as Figure 3 results. To investigate the possible topographical effects of the sample, AFM measurements were further conducted. As shown in Figure S2, the sample exhibited a smooth surface with an average roughness of ~2.23 nm, which could exclude the topographic effect of the sample.
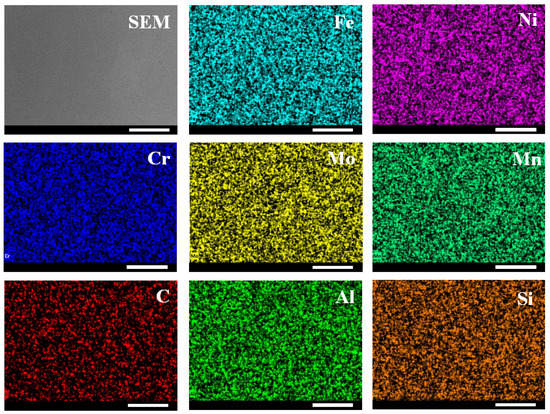
Figure 7.
SEM image of the sample and the corresponding EDS images (Scale bar: 100 μm).
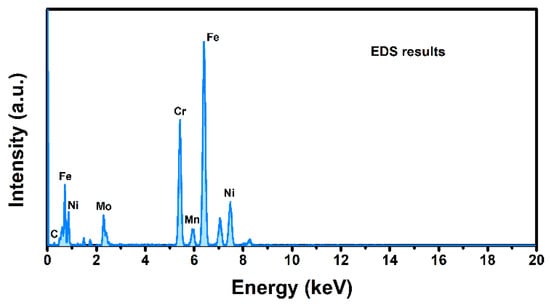
Figure 8.
EDS results of the sample.
Since the SIMS intensity could be described by the following equation [23]:
where is the intensity of primary ion, Y is the ion sputter yield, is the ionization probability, is the transmission efficiency of the detection system, and refer to the species isotopic abundance and its fractional concentration in the material, respectively. During the measurements, and should remain unchanged since the experimental conditions were not altered. Previous literature [23,30] suggested that the sputtering yield and ionization probability could be affected by the matrix, i.e., different matrixes may lead to various secondary ion intensities even though they possess the same composition. As mentioned earlier, topographical effects of 2D images could be excluded, as confirmed by SEM and AFM results. Meanwhile, ROI and EDS results indicated that there is no compositional difference, which indicated the same and . In addition, normalized data of Fe and Ni were also analyzed to exclude topographic effects. Similar mapping results were obtained. We thus hypothesized that such a difference of 2D imaging and EDS results might be ascribed to various crystal orientations of the polycrystalline sample, which would affect bonding strengths and the arrangement of surface atoms, resulting in different secondary ion intensities. Figure 9 schematically illustrate such process. Future investigation on its specific mechanism needs to be conducted.
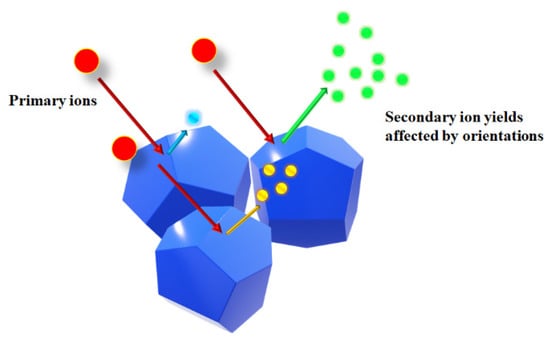
Figure 9.
The possible influence of crystal orientation on the amounts of secondary ions.
4. Discussion
In conclusion, ToF-SIMS was employed to investigate the surface characteristics of an alloy sample. By acquiring its mass spectra and 2D mapping images, the surface components and their inhomogeneous distribution were revealed. To make comparison, three ROIs with different chromatic aberrations were selected. However, contradictory results of component distribution were obtained from their mass spectrum and mapping images. To resolve it, SEM-EDS was further performed, and the results suggested a homogeneous distribution of all elements at the surface, which is consistent with the mass spectrum results. We hypothesized that other possible factors such as crystal orientation may cause any influence on the mapping image appearance by affecting the ion yields of secondary ions. Our findings provide deeper insights into the working principle of ToF-SIMS, and may expand its application in other fields such as crystal orientation.
Supplementary Materials
The following are available online at https://www.mdpi.com/article/10.3390/cryst11121465/s1, Figure S1: Normalized ToF-SIMS positive ions 2D-mapping of the sample (Scale bar: 100 μm), Figure S2: AFM image of the alloy sample.
Author Contributions
Conceptualization, T.S. and F.X.; methodology, T.S., H.C. and B.W.; formal analysis, T.S. and D.L.; writing—original draft preparation, T.S.; writing—review and editing, F.X.; supervision, M.Z. and F.X.; project administration and funding acquisition, M.Z. and S.W. All authors have read and agreed to the published version of the manuscript.
Funding
This research was funded by the Postdoctoral Research Foundation of China, grant number 2019M660483.
Institutional Review Board Statement
Not applicable.
Informed Consent Statement
Not applicable.
Data Availability Statement
Data is contained within the article or supplementary material.
Acknowledgments
The authors acknowledge Shumeng Chi from Beijing Institute of Technology for AFM support.
Conflicts of Interest
The authors declare no conflict of interest.
References
- Xu, A.F.; Wang, R.T.; Yang, L.W.; Jarvis, V.; Britten, J.F.; Xu, G.; Yang, W. Pyrrolidinium lead iodide from crystallography: A new perovskite with low bandgap and good water resistance. Chem. Commun. 2019, 55, 3251–3253. [Google Scholar] [CrossRef]
- Xu, F.; Li, Y.; Liu, N.; Han, Y.; Zou, M.; Song, T. 1D Perovskitoid as Absorbing Material for Stable Solar Cells. Crystals 2021, 11, 241. [Google Scholar] [CrossRef]
- Xu, A.F.; Wang, R.T.; Yang, L.W.; Liu, E.E.; Xu, G. An Environmentally Stable Organic–Inorganic Hybrid Perovskite Containing Py Cation with Low Trap-State Density. Crystals 2020, 10, 272. [Google Scholar] [CrossRef] [Green Version]
- Han, Y.; Meyer, S.; Dkhissi, Y.; Weber, K.; Pringle, J.M.; Bach, U.; Spiccia, L.; Cheng, Y.-B. Degradation observations of encapsulated planar CH3NH3PbI3 perovskite solar cells at high temperatures and humidity. J. Mater. Chem. A 2015, 3, 8139–8147. [Google Scholar] [CrossRef]
- Wang, R.T.; Xu, A.F.; Li, W.; Li, Y.; Xu, G. Moisture-Stable FAPbI3 Perovskite Achieved by Atomic Structure Negotiation. J. Phys. Chem. Lett. 2021, 12, 5332–5338. [Google Scholar] [CrossRef]
- Xu, A.F.; Wang, R.T.; Yang, L.W.; Liu, N.; Chen, Q.; LaPierre, R.; Goktas, N.I.; Xu, G. Pyrrolidinium containing perovskites with thermal stability and water resistance for photovoltaics. J. Mater. Chem. C 2019, 7, 11104–11108. [Google Scholar] [CrossRef]
- Xu, K.J.; Wang, R.T.; Xu, A.F.; Chen, J.Y.; Xu, G. Hysteresis and Instability Predicted in Moisture Degradation of Perovskite Solar Cells. ACS Appl. Mater. Interfaces 2020, 12, 48882–48889. [Google Scholar] [CrossRef]
- Guerrero, A.; You, J.; Aranda, C.; Kang, Y.S.; Garcia-Belmonte, G.; Zhou, H.; Bisquert, J.; Yang, Y. Interfacial Degradation of Planar Lead Halide Perovskite Solar Cells. ACS Nano 2015, 10, 218–224. [Google Scholar] [CrossRef] [PubMed]
- Xu, A.F.; Liu, N.; Xie, F.; Song, T.; Ma, Y.; Zhang, P.; Bai, Y.; Li, Y.; Chen, Q.; Xu, G. Promoting Thermodynamic and Kinetic Stabilities of FA-based Perovskite by an in Situ Bilayer Structure. Nano Lett. 2020, 20, 3864–3871. [Google Scholar] [CrossRef]
- Li, J.T.; Swiatowska, J.; Seyeux, A.; Huang, L.; Maurice, V.; Sun, S.G.; Marcus, P. XPS and ToF-SIMS study of Sn–Co alloy thin films as anode for lithium ion battery. J. Power Sources 2010, 195, 8251–8257. [Google Scholar] [CrossRef]
- Pfenninger, R.; Struzik, M.; Garbayo, I.; Stilp, E.; Rupp, J.L.M. A low ride on processing temperature for fast lithium conduction in garnet solid-state battery films. Nat. Energy 2019, 4, 475–483. [Google Scholar] [CrossRef]
- Choi, S.; Han, S.I.; Jung, D.; Hwang, H.J.; Lim, C.; Bae, S.; Park, O.K.; Tschabrunn, C.M.; Lee, M.; Bae, S.Y.; et al. Highly conductive, stretchable and biocompatible Ag–Au core–sheath nanowire composite for wearable and implantable bioelectronics. Nat. Nanotechnol. 2018, 13, 1048–1056. [Google Scholar] [CrossRef]
- Médard, N.; Poleunis, C.; Eynde, X.V.; Bertrand, P. Characterization of additives at polymer surfaces by ToF-SIMS. Surf. Interface Anal. Int. J. Devoted Dev. Appl. Tech. Anal. Surf. Interfaces Thin Film. 2002, 34, 565–569. [Google Scholar] [CrossRef]
- Han, G.-F.; Li, F.; Zou, W.; Karamad, M.; Jeon, J.-P.; Kim, S.-W.; Kim, S.-J.; Bu, Y.; Fu, Z.; Lu, Y.; et al. Building and identifying highly active oxygenated groups in carbon materials for oxygen reduction to H2O2. Nat. Commun. 2020, 11, 1–9. [Google Scholar] [CrossRef]
- Song, T.; Xu, F.; Yang, R.; Guo, X.; Zou, M.; Liu, Y.; Li, X. Silver iodide free aerosol catalyst with high deicing efficiency for weather modifications. AIP Adv. 2021, 11, 025045. [Google Scholar] [CrossRef]
- Song, T.; Xu, F.; Li, X.; Guo, X.; Zou, M.; Yang, R. AgI–KI aerosol catalysts with excellent combustion and nucleation performance for weather modification. Environ. Sci. Atmos. 2021, 1, 518–523. [Google Scholar] [CrossRef]
- Sodhi, R.N.S. Time-of-flight secondary ion mass spectrometry (TOF-SIMS):—versatility in chemical and imaging surface analysis. Analyst 2004, 129, 483–487. [Google Scholar] [CrossRef]
- Wucher, A. Molecular secondary ion formation under cluster bombardment: A fundamental review. Appl. Surf. Sci. 2006, 252, 6482–6489. [Google Scholar] [CrossRef]
- Stowe, K.; Chryssoulis, S.; Kim, J. Mapping of composition of mineral surfaces by TOF-SIMS. Miner. Eng. 1995, 8, 421–430. [Google Scholar] [CrossRef]
- Dong, Y.; Xu, F.; Li, Y.; Song, T.; Tan, G. Component distribution of nano-carbon materials assisted by Time of Flight-Secondary Ion Mass Spectrometer. J. Phys. Conf. Ser. 2021, 2011, 012071. [Google Scholar] [CrossRef]
- Yang, L.; Seah, M.P.; Gilmore, I.S.; Morris, R.J.H.; Dowsett, M.G.; Boarino, L.; Sparnacci, K.; Laus, M. Depth Profiling and Melting of Nanoparticles in Secondary Ion Mass Spectrometry (SIMS). J. Phys. Chem. C 2013, 117, 16042–16052. [Google Scholar] [CrossRef]
- Dubey, M.; Brison, J.; Grainger, D.W.; Castner, D.G. Comparison of Bi1+, Bi3+ and C60+ primary ion sources for ToF-SIMS imaging of patterned protein samples. Surf. Interface Anal. 2011, 43, 261–264. [Google Scholar] [CrossRef] [PubMed] [Green Version]
- Harvey, S.P.; Li, Z.; Christians, J.A.; Zhu, K.; Luther, J.M.; Berry, J.J. Probing Perovskite Inhomogeneity beyond the Surface: TOF-SIMS Analysis of Halide Perovskite Photovoltaic Devices. ACS Appl. Mater. Interfaces 2018, 10, 28541–28552. [Google Scholar] [CrossRef]
- Harvey, S.P.; Messinger, J.; Zhu, K.; Luther, J.M.; Berry, J.J. Investigating the Effects of Chemical Gradients on Performance and Reliability within Perovskite Solar Cells with TOF-SIMS. Adv. Energy Mater. 2020, 10, 1903674. [Google Scholar] [CrossRef] [Green Version]
- Touboul, D.; Kollmer, F.; Niehuis, E.; Brunelle, A.; Laprévote, O. Improvement of biological time-of-flight-secondary ion mass spectrometry imaging with a bismuth cluster ion source. J. Am. Soc. Mass Spectrom. 2005, 16, 1608–1618. [Google Scholar] [CrossRef] [Green Version]
- Jones, E.A.; Lockyer, N.P.; Vickerman, J.C. Mass spectral analysis and imaging of tissue by ToF-SIMS—The role of buckminsterfullerene, C60+, primary ions. Int. J. Mass Spectrom. 2007, 260, 146–157. [Google Scholar] [CrossRef]
- Harvey, S.P.; Teeter, G.; Moutinho, H.; Al-Jassim, M.M. Direct evidence of enhanced chlorine segregation at grain boundaries in polycrystalline CdTe thin films via three-dimensional TOF-SIMS imaging. Prog. Photovolt. Res. Appl. 2014, 23, 838–846. [Google Scholar] [CrossRef]
- Baer, D.R.; Gaspar, D.J.; Nachimuthu, P.; Techane, S.D.; Castner, D.G. Application of surface chemical analysis tools for characterization of nanoparticles. Anal. Bioanal. Chem. 2010, 396, 983–1002. [Google Scholar] [CrossRef] [PubMed] [Green Version]
- Cornette, P.; Zanna, S.; Seyeux, A.; Costa, D.; Marcus, P. The native oxide film on a model aluminium-copper alloy studied by XPS and ToF-SIMS. Corros. Sci. 2020, 174, 108837. [Google Scholar] [CrossRef]
- Harvey, S.P.; Zhang, F.; Palmstrom, A.; Luther, J.M.; Zhu, K.; Berry, J.J. Mitigating Measurement Artifacts in TOF-SIMS Analysis of Perovskite Solar Cells. ACS Appl. Mater. Interfaces 2019, 11, 30911–30918. [Google Scholar] [CrossRef]
- Hou, C.-H.; Hung, S.-H.; Jhang, L.-J.; Chou, K.-J.; Hu, Y.-K.; Chou, P.-T.; Su, W.-F.; Tsai, F.-Y.; Shieh, J.; Shyue, J.-J. Validated Analysis of Component Distribution Inside Perovskite Solar Cells and Its Utility in Unveiling Factors of Device Performance and Degradation. ACS Appl. Mater. Interfaces 2020, 12, 22730–22740. [Google Scholar] [CrossRef] [PubMed]
- Noël, C.; Pescetelli, S.; Agresti, A.; Franquet, A.; Spampinato, V.; Felten, A.; Di Carlo, A.; Houssiau, L.; Busby, Y. Hybrid Perovskites Depth Profiling with Variable-Size Argon Clusters and Monatomic Ions Beams. Materials 2019, 12, 726. [Google Scholar] [CrossRef] [PubMed] [Green Version]
Publisher’s Note: MDPI stays neutral with regard to jurisdictional claims in published maps and institutional affiliations. |
© 2021 by the authors. Licensee MDPI, Basel, Switzerland. This article is an open access article distributed under the terms and conditions of the Creative Commons Attribution (CC BY) license (https://creativecommons.org/licenses/by/4.0/).