Article

Synthesis of Heterostructure of ZnO@MOF-46(Zn) to Improve the Photocatalytic Performance in Methylene Blue Degradation

by
Jiraporn Buasakun
1,2,
Phakinee Srilaoong
1,2,
Ramida Rattanakam
2 and
Tanwawan Duangthongyou
1,2,*
1
The Center of Excellence for Innovation in Chemistry (PERCH-CIC), Department of Chemistry, Faculty of Science, Kasetsart University, Bangkok 10900, Thailand
2
Department of Chemistry, Faculty of Science, Kasetsart University, Bangkok 10900, Thailand
*
Author to whom correspondence should be addressed.
Crystals 2021, 11(11), 1379; https://doi.org/10.3390/cryst11111379
Submission received: 15 October 2021 / Revised: 5 November 2021 / Accepted: 9 November 2021 / Published: 12 November 2021

Abstract

:
The heterostructure of ZnO and MOF-46(Zn) was synthesized to improve the photocatalytic performance of ZnO and prove the synergistic theory that presented the coexistence of ZnO and MOF-46(Zn), providing better efficiency than pure ZnO. The heterostructure material was synthesized by using prepared ZnO as a Zn2+ source, which was reacted with 2-aminoterephthalic acid (2-ATP) as a ligand to cover the surface of ZnO with MOF-46(Zn). The ZnO reactant materials were modified by pyrolysis of various morphologies of IRMOF-3 (Zn-MOF) prepared by using CTAB as a morphology controller. The octahedral ZnO obtained at 150 mg of CTAB shows better efficiency for photodegradation, with 85.79% within 3 h and a band gap energy of 3.11 eV. It acts as a starting material for synthesis of ZnO@MOF-46(Zn). The ZnO/MOF-46(Zn) composite was further used as a photocatalyst material in the dye (methylene blue: MB) degradation process, and the performance was compared with that of pure prepared ZnO. The results show that the photocatalytic efficiency with 61.20% in the MB degradation of the heterostructure is higher than that of pure ZnO within 60 min (90.09% within 180 min). The reason for this result may be that the coexistence of ZnO and MOF-46(Zn) can absorb a larger range of energy and reduce the possibility of the electron–hole recombination process.

Graphical Abstract

1. Introduction

Photocatalytic processes with metal-oxide-based photocatalysts have been employed in several applications, especially the degradation of various pollutants [1,2,3]. Zinc oxide (ZnO) has been widely used in numerous potential applications, including biosensors [4], light-emitting diodes (LEDs) [5], solar cells [6], gas sensors [7], and photocatalysis [8] due to its attractive properties, such as nontoxicity, chemical/thermal stability, low cost, and high mobility of electrons in the conduction band.
ZnO is an N-type semiconductor that possesses a wide energy band gap, as 3.37 eV is emitted in the near-UV region of the spectrum. Several methods have been used for ZnO synthesis, including precipitation [9], electrochemical [10], sol-gel [11], microwave [12], mechano-chemical [13], and hydro/solvothermal [14] methods, and the pyrolysis of metal-organic frameworks based on Zn(II) ions (Zn-MOFs) [15]. Different syntheses can provide different properties that affect the efficient performance. Not only does the synthesis method affect the performance, but the different morphologies also affect the efficiency of ZnO. Elamin and Elsanousi [16] synthesized different morphologies of ZnO by hydrothermal methods with different treatment durations. The obtained products comprising nanosheets and nanotubes were used as photocatalysts in the methyl orange degradation process. The results showed that the photocatalytic efficiency depended on the morphology, and ZnO nanosheets were more effective than nanotubes due to their larger surface area. Although ZnO is used in extensive work, its wide band gap restriction leads to its use in high- energy and low harvesting of light. Many previous studies have focused on ZnO modification, such as morphology and size modification by adding other materials to reduce the operating energy and increase the light harvesting ability [17] for material performance improvement. In previous reports, ZnO nanostructures were codoped with Al/Ni by Reddy’s group [18]. This work presented that the coexistence of Al/Ni in the ZnO site provided great photocatalytic performance in dye removal activity. In another work, Nguyen’s [19] group improved the photocatalytic efficiency of ZnO by synthesizing a composite of ZnO nanorods/CuO. The performance of the composite exhibited excellent photodegradation efficiency. Recently, biomimetics and bioinspiration concepts [20] were adopted as an idea for shape modification. Serra and a collaborator [21] synthesized a novel photocatalyst material based on using helical microalgae as a biotemplate; namely, Ni@ZnO@ZnS-Spirulina. The photocatalyst presented higher efficiency, minimal photocorrosion, excellent reusability, and ecofriendliness. ZnO nanorod arrays were synthesized hydrothermally with various amounts of CTAB (cetyltrimethylammonium bromide) to control exposure of the {0001} facet [22]. The photocatalytic activities measured by photodegradation of RhB reveal that they depended on the morphology of the prepared ZnO. From the reviews of ZnO modification, one interesting material is the metal-organic framework (MOFs), which is a good choice for ZnO to obtain a ZnO/MOF heterostructure.
MOF, a kind of porous material, is a functional material that comprises metal ions/clusters and organic ligands with functionality that are linked together by strong bonds to form one, two, or three dimensionalities. MOFs possess extraordinary properties, such as a large surface area and thermal stability, a particular porosity, a tunable topology and functionality, light absorption ability in the UV-Vis range, rich host–guest chemistry, well-developed pores to make high accessibility of active sites, and Lewis acid sites that they can be tuned by the formation of missing ligand defects. These attractive properties have led to numerous fields of work in recent decades in luminescence sensors [23], adsorption/desorption [23], gas storage [24], molecular separation [25], drug delivery [26], and catalysis from the last two properties [27,28,29].
To date, many studies on the photodegradation of methylene blue using ZnO-based photocatalysts have been reported. For this research, we adopted the outstanding properties of MOFs (large surface area, light absorption ability, specific pore site) with the semiconductor property of ZnO to improve the photocatalytic performance. First, ZnO was modified on the outer surface by covering the MOF. MOF-46(Zn), as a Zn-MOF type, was chosen by Yagki’s group for the first time to cover ZnO surfaces synthesized from Zn(II) ions and 2-aminoteraphalic acid (2-ATP) [30]. In this work, not only was the MOF covered on the surface of ZnO to obtain a core-shell heterostructure, but it was also used as a starting precursor to prepare ZnO by the pyrolysis of Zn-MOF to easily control the shape and obtain a high yield. Since we hypothesized that the ZnO morphologies affected the photocatalytic performance, three different morphologies of ZnO were produced by controlling the starting material morphology (IRMOF-3). IRMOF-3, a kind of Zn-MOF with three different shapes, was synthesized in the first step by Zn(II) ions, 2-ATP, and various amounts of CTAB surfactant as a shape controller. IRMOF-3 was transformed by calcination. The prepared ZnO was used as a Zn(II) ion source instead of zinc salts, which are environmentally unfriendly. The partial Zn(II) ions dissolving from ZnO interact with 2-ATP ligands to form a core-shell ZnO@MOF-46(Zn) composite. To prove the synergistic properties of the ZnO and MOF-46(Zn) composite and prove that it exhibits better performance than pure ZnO, ZnO@MOF-46(Zn) was used as a photocatalyst for the degradation of dye (methylene blue: MB), and the performance was compared with that of pure ZnO in the aqueous phase with UV irradiation.

2. Experiment

2.1. Materials

Zinc nitrate hexahydrate (Zn(NO3)2·6H2O) (99.0%, Merck), 2-aminoterephthalic acid (2-ATP) (99.0%, Sigma–Aldrich), commercial ZnO (analytical grade, QRëC, New Zealand), cetyltrimethylammonium bromide (CTAB), methylene blue, N,N-dimethylformamide (DMF) (99.8%, Qrec), and ethanol (EtOH) (Merck) were of analytical reagent grade and used without further purification. Distilled water was obtained from our laboratory.

2.2. Synthesis of Sample

2.2.1. Synthesis of ZnO from Zn-MOFs

IRMOF-3 was used as the starting material and prepared by a modified procedure [31]. First, 0.3 mmol of Zn(NO3)2 6H2O and 0.15 mmol of 2-ATP were dissolved in a mixed solvent (30 mL) of DMF and C2H5OH(7:3). Various amounts of CTAB (0, 80, and 150 mg) were then added to a mixture solution. The mixture was further transferred into an autoclave and heated at 115 °C for 4 h. Subsequently, the reactor was cooled to room temperature, then the products were washed with DMF and C2H5OH. The three different morphologies of the products of IRMOF-3 from each addition of CTAB were dried at 60 °C for 4 h.
To prepare ZnO, the obtained IRMOF-3 was placed in a muffle furnace and heated in air at a rate of 5 °C/min in a stepwise manner from room temperature to 500 °C and kept at this temperature for 2 h.

2.2.2. Synthesis of ZnO@MOF-46(Zn)

To synthesize the composite material, MOF-46(Zn) was chosen to cover the ZnO surface. MOF-46(Zn) can be synthesized by the reaction of Zn2+ ions with 2-ATP as the ligand. In this work, ZnO was prepared by the pyrolysis of IRMOF3 with different morphologies from the previous step. The prepared ZnO was used as a Zn2+ source by dissolving ZnO in a solvent. ZnO@MOF-46(Zn) was prepared by adding 1 mmol of obtained ZnO and 1 mmol of 2-ATP into a flask containing 48 mL of a mixed solvent of DMF/H2O (3:1 v/v). The mixture was sonicated for 30 min and then left at room temperature for 48 h. The product was filtered and washed several times with DMF and EtOH to obtain ZnO@MOF-46(Zn). To investigate the effect of sonication and treatment times, the mixture solution was sonicated for 10 and 20 min under the same conditions for a treatment time of 48 h. The treatment was also carried out for 6 and 24 h with the same synthetic procedure.

2.2.3. Synthesis of MOF-46(Zn) as a Reference Material

To synthesize pure MOF-46(Zn) for use as a reference material, commercial-grade ZnO was used as the starting precursor for the Zn2+ source to prepare pure MOF-46(Zn) with 2-ATP. In this experiment, MOF-46(Zn) was synthesized via the slow diffusion method at room temperature. First, 1 mmol of both ZnO and 2-ATP were added to the flask comprising a mixed solvent of DMF/H2O (48 mL; 3/1 v/v). The mixture was continuously stirred for 24 h, and afterward, the cream product was filtered and washed with DMF and ethanol several times. To study the synthesis factor, the reactants were added in different solvent ratios (1/2 v/v, only H2O, and only DMF) with the same procedure for 24 h or 48 h.

2.3. Characterization of Samples

All products were characterized by powder X-ray diffraction (XRD) (D8 Advance Bruker X-ray diffractometer, Billerica, MA, USA) using Cu-Kα radiation (λ = 1.54060 Å) and Fourier-transformed infrared (FT-IR) spectrophotometry (Bruker Model Vertex70) with a KBr pellet sampler in the 400–4000 cm−1 region. Thermogravimetric analysis (TGA) was performed by a Perkin Elmer TGA7 system (Waltham, MA, USA) with a heating rate of 10 °C per min under N2. The morphologies of the samples were monitored by scanning electron microscopy (SEM) on a Quanta 450 FEI (Graz, Austria) instrument with a tungsten filament electron source operated at 25 kV and transmission electron microscopy (TEM) on a TEM-Hitachi HT7700 system (Tokyo, Japan). The BET surface area of the obtained ZnO was calculated by N2 adsorption. UV/Vis spectra were obtained by UV-Vis spectrophotometry on a Shimadzu UV-1800 (Kyoto, Japan) model in solid-state mode. Fluorescence spectra were examined on a Perkin-Elmer LS55 (Waltham, MA, USA) luminescence spectrometer in solid-state mode to investigate the photoelectron transfer of the samples. The amount of MOF-46(Zn) sample was equal to the quantity of MOF-46(Zn) in the ZnO/MOF-46(Zn) heterostructure sample, which was calculated to be 47.22% w/w (from the TGA result).

2.4. Photocatalytic Activity

The obtained samples (ZnO and ZnO@MOF-46(Zn)) were used as photocatalysts for the MB degradation process with UV irradiation. First, 70 mg of photocatalyst was suspended in 5 ppm MB aqueous solution (150 mL) and was then consistently stirred in the dark for 60 min to reach adsorption/desorption equilibrium. Afterward, the mixture was exposed to UV irradiation with continuous stirring. An amount of 3 mL of the solution was collected from the mixture every 30 min for 3 h to determine the absorption intensity of MB by UV-visible spectroscopy (Perkin-Elmer Lambda 35) at a maximum wavelength of 664 nm. The absorbance was calculated and reported for the photocatalytic performance of the samples. To ensure adsorption/desorption equilibrium, the mixture was treated in the dark for 30, 45, 60, and 75 min before examining the photocatalytic process. Furthermore, the inorganic products from the photocatalytic degradation of MB were determined by using ion chromatography (Metrohm 940 Professional IC Vario with a 5 μm particle size and 150 × 4 mm column dimension). Eluents NaHCO3/Na2CO3 and HNO3/dipicolinic acid were introduced at 0.7 and 0.9 mL/min, respectively, for anions and cations, respectively.

3. Results and Discussion

Overall synthesized materials can be seen in Scheme 1. IRMOF-3 starting material for synthesis of ZnO can be prepared by various amounts of surfactant CTAB to control morphology. To synthesize ZnO, IRMOF3 was calcined. Prepared ZnO was used as the Zn2+ source, which reacted with 2ATP by the sonication method to obtain ZnO@MOF-46(Zn).

3.1. Synthesis of the ZnO Photocatalyst by the Thermal Decomposition of the Metal-Organic Framework

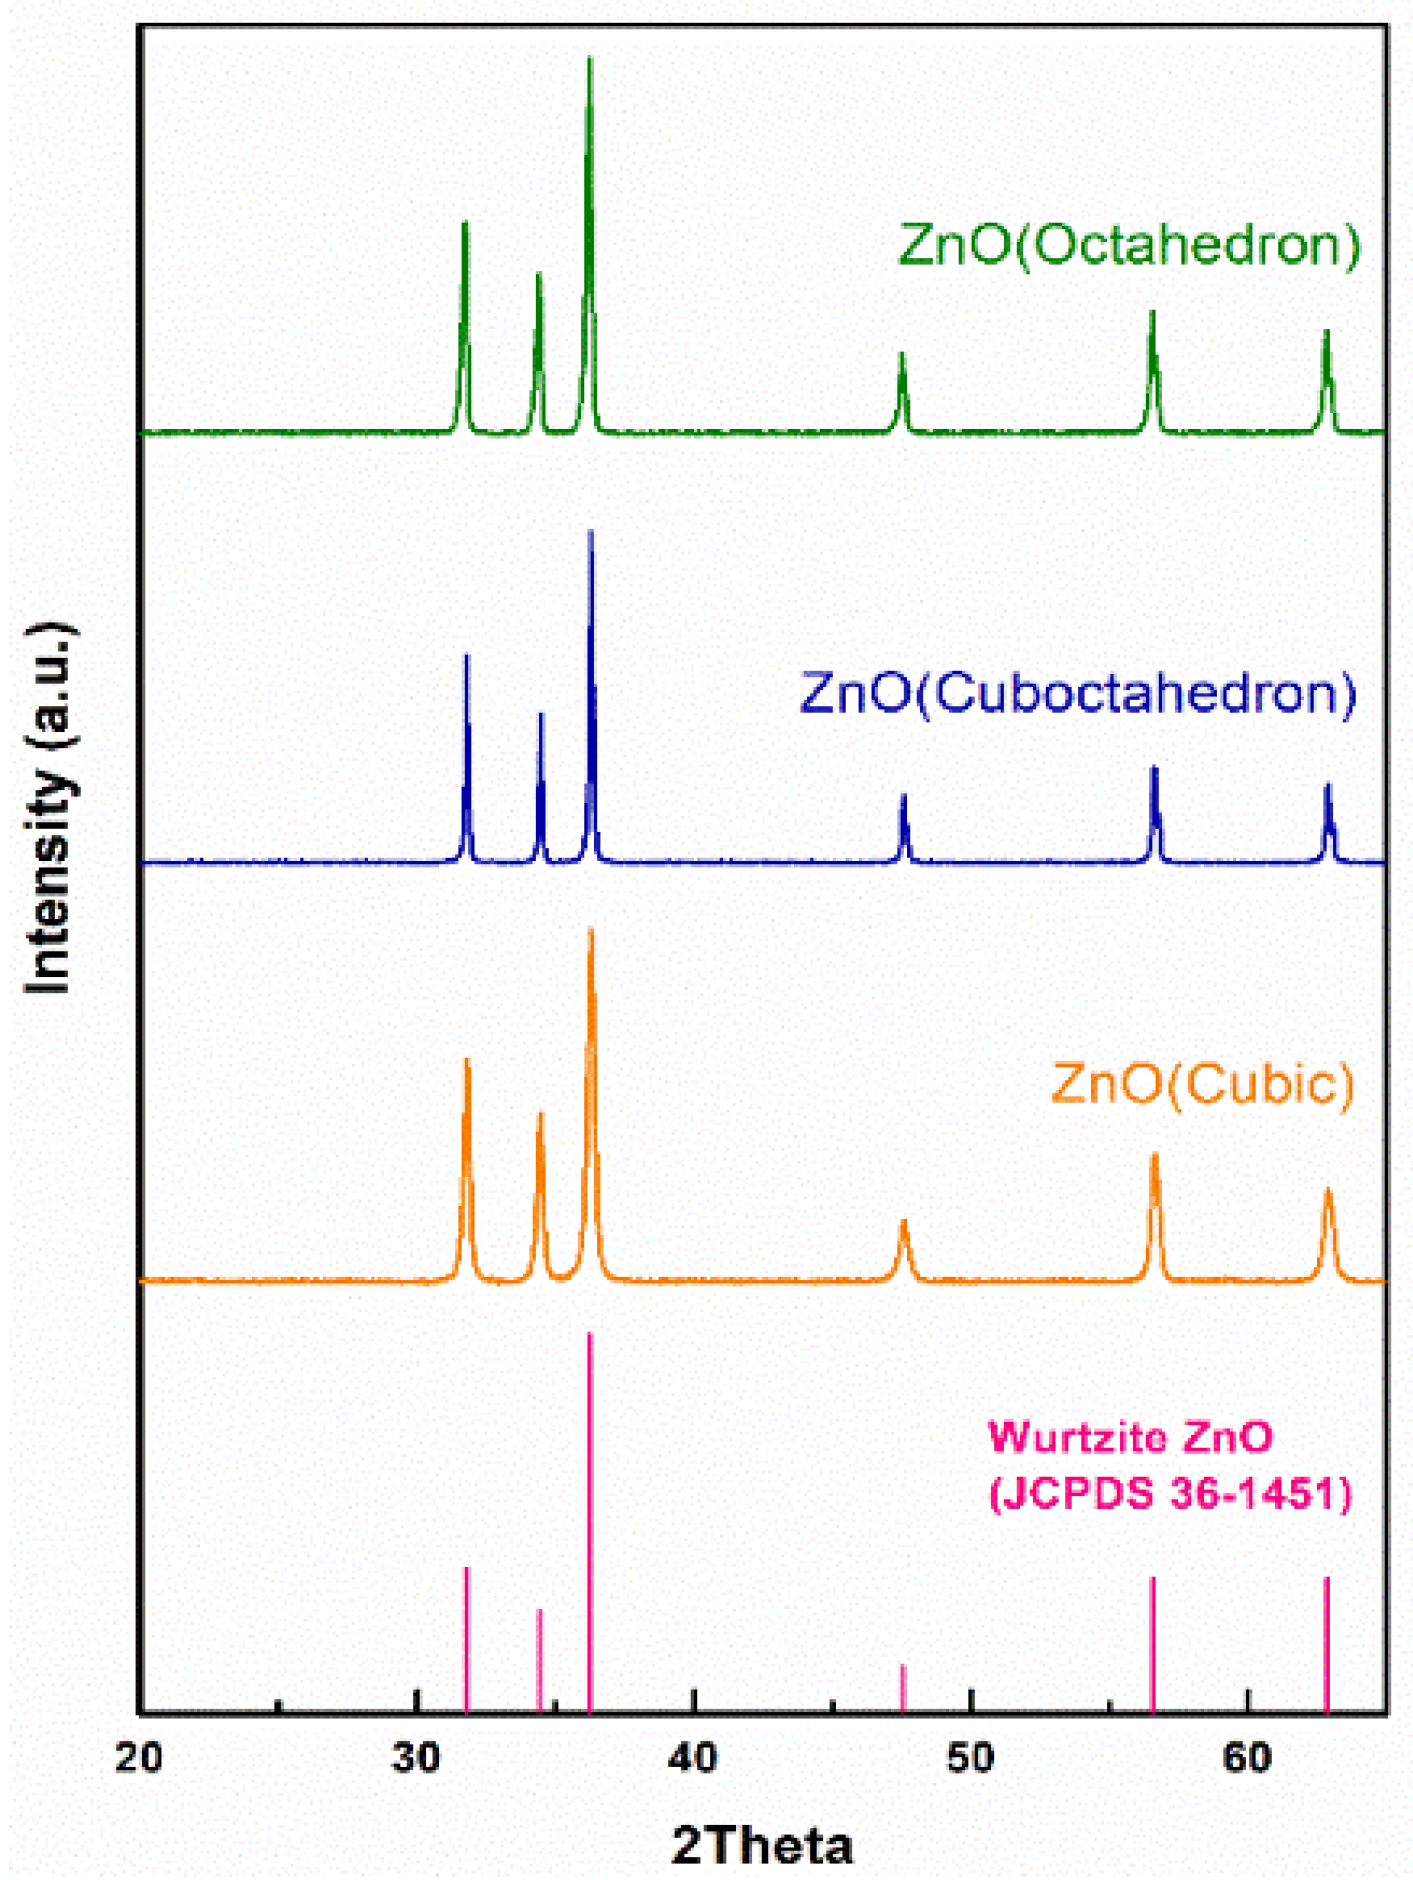
3.1.1. Phase of Samples

IRMOF-3 was chosen as the precursor for the preparation of the ZnO photocatalyst, and it was synthesized in three morphologies by adding different amounts of CTAB: no adding (0 mg), 80, and 150 mg. To confirm the product phase, synthesized IRMOF-3 was investigated by powder X-ray diffraction (XRD), and the results are shown in Figure 1. The XRD patterns of synthesized IRMOF-3 are in good agreement with the simulated phase of IRMOF-3. After heating at 500 °C for 2 h, the ZnO phase was obtained. The complete preparation and highly crystalline phase corresponding to wurtzite ZnO can be confirmed with JCPDS number 36–1451, as revealed in Figure 2.

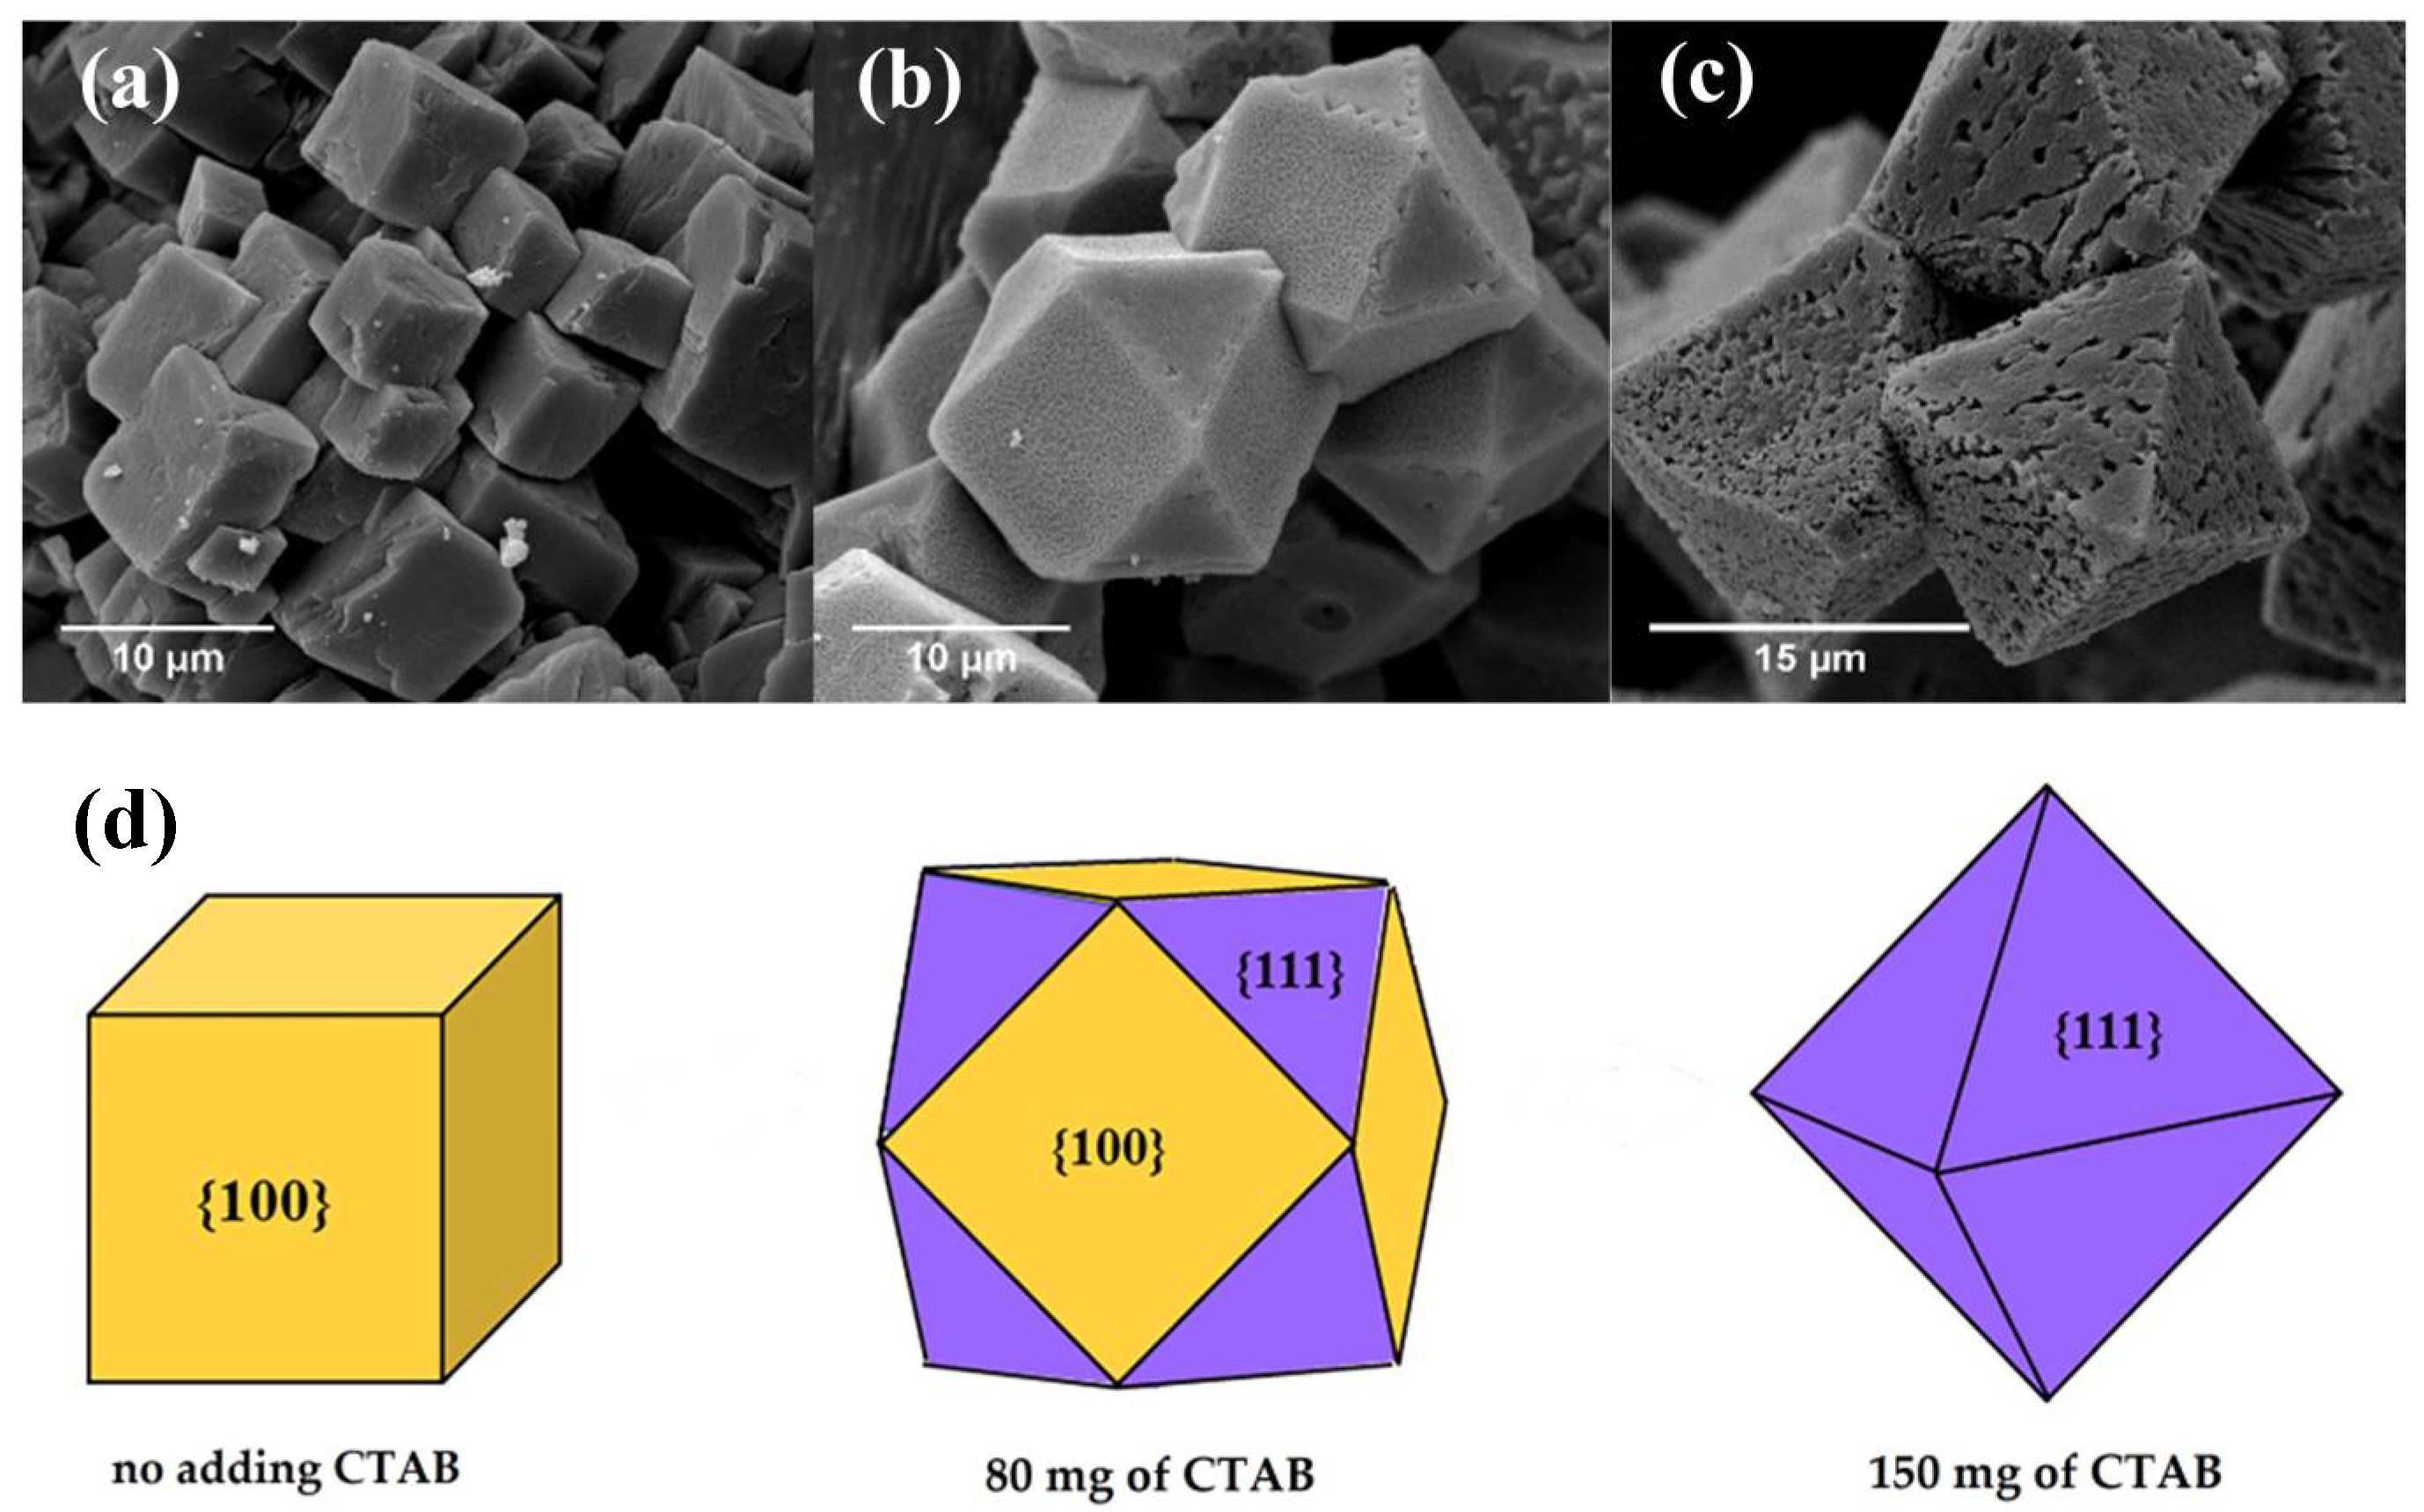
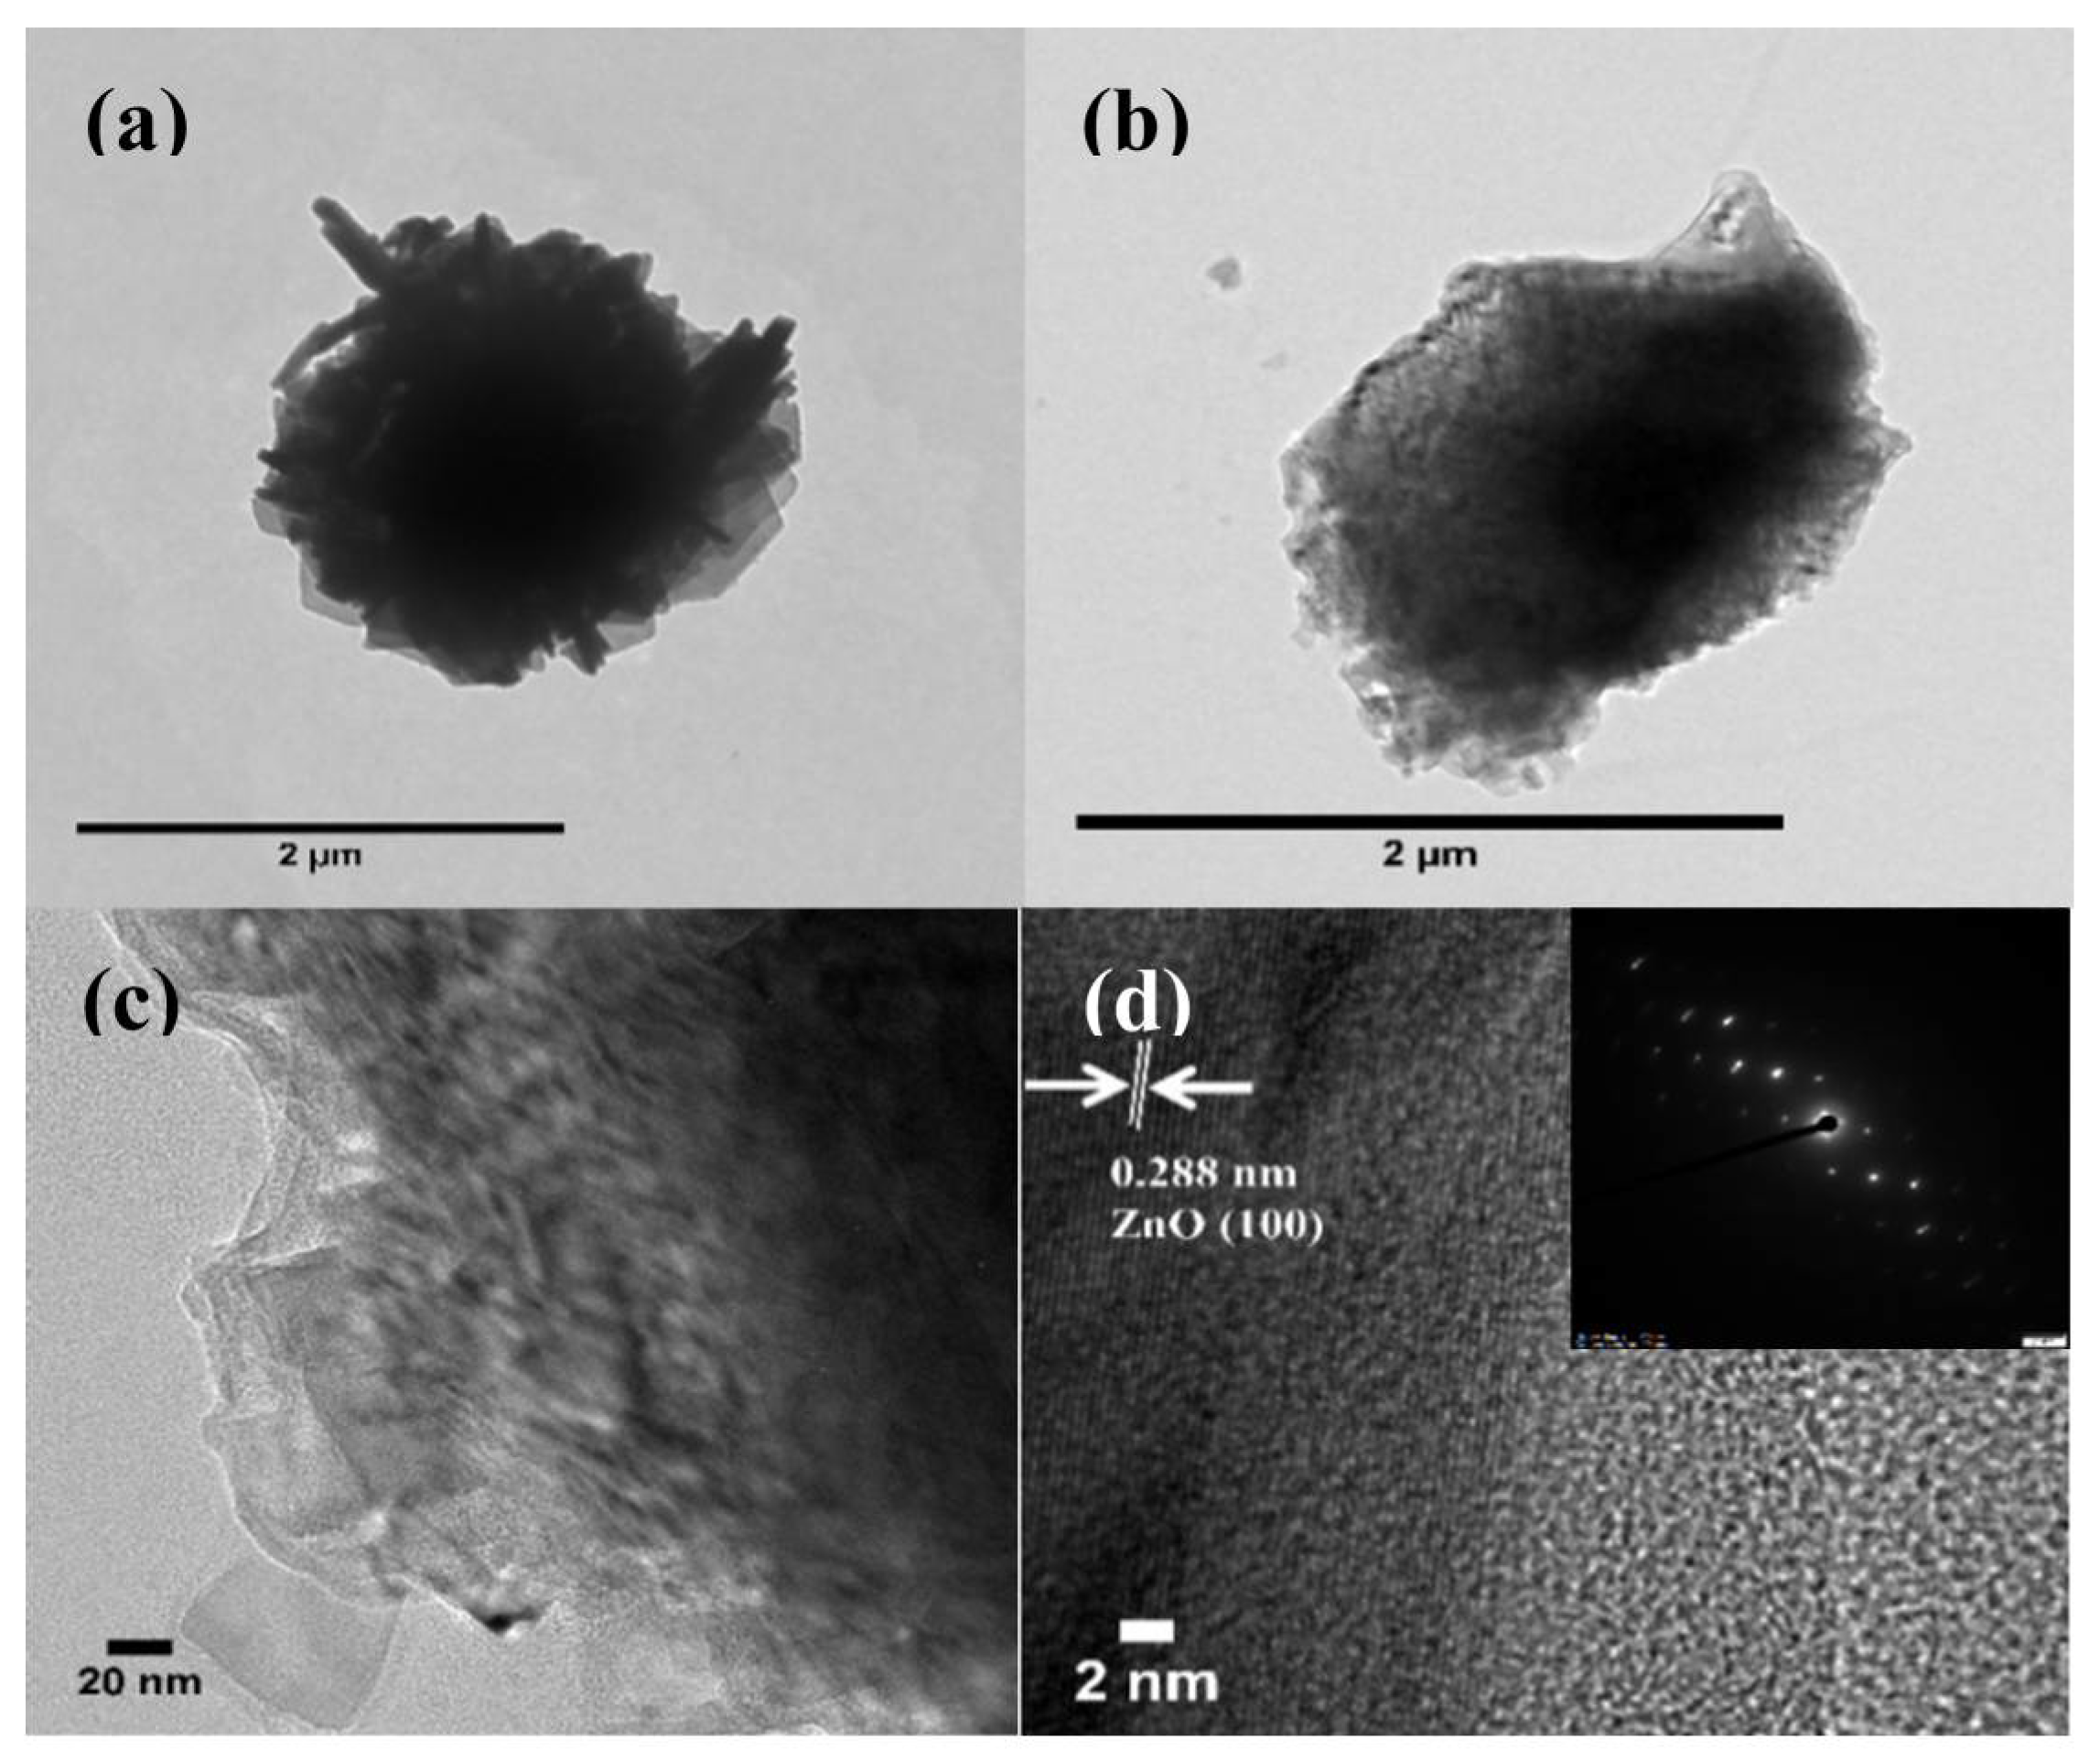
3.1.2. Morphologies of Samples

The morphologies of prepared IRMOF-3 were determined by scanning electron microscopy (SEM), and the SEM image in Figure 3 presents the different morphologies of IRMOF-3. In the absence of CTAB, the synthesized IRMOF-3 showed a typical cubic shape, became cuboctahedral, and finally became octahedral when the amount of CTAB was increased, as shown in Figure 3a–c, respectively. The BFDH (Bravais, Friedel, Donnay, and Harker) law reported that the crystal growth process depends on the relative growth rate of each facet. The facet with the slowest rate becomes the final shape. The initial shape of the obtained IRMOF-3 without CTAB is a cubic shape with six {100} facets. When the amount of CTAB in the reaction is increased, triangular facets of {111} appear in the eight corners of the cubic shape. CTAB extremely affects the {111} facet, resulting in the slow growth rate of the facet. A suitable amount of CTAB (80 mg) affects the rate of {100} and {111} growth, presenting a cuboctahedral shape as an intermediate shape. Increasing the amount of CTAB in the reaction system enhances the growth rate ratio of {100} to {111} and finally reveals an octahedral shape (150 mg of CTAB).
The calcined products of IRMOF-3 were monitored by SEM, as shown in Figure 4. The SEM images reveal the morphologies of ZnO (ZnO(1), ZnO(2), and ZnO(3)), which maintained the original morphologies of the precursor IRMOF-3 (cube, cuboctahedron, and octahedron, respectively). However, the size of the synthesized ZnO was reduced, and increasing the ratio of surface area to volume led to a large surface area. In addition, the surfaces of cuboctahedral and octahedral ZnO were rough and contained a large amount of defects.

3.2. Synthesis of ZnO@MOF-46(Zn) Composite Materials for Use as Photocatalysts

ZnO(1) (cube), ZnO(2) (cuboctahedron), and ZnO(3) (octahedron) were used as Zn2+ sources for the formation of MOF-46(Zn). By mixing ZnO and 2-ATP in the presence of a mixing solvent under ultrasonication and by allowing the reaction to proceed, MOF-46(Zn) production was expected. Under the same synthetic conditions, including the same sonication time, reaction time, and solvent system, ZnO(1), ZnO(2) and ZnO(3) yielded products whose XRD patterns are shown in Figure 5. The product obtained from ZnO(1) consists of ZnO and an unknown phase, while the materials produced from ZnO(2) and ZnO(3) show the presence of ZnO, MOF-46(Zn), and a small amount of the same unknown material.
The cuboctahedral and octahedral ZnO morphologies comprise several {111} facets. These planes drag through an array of Zn and O atoms, resulting in increased exposure of ZnO on the surface (Figure S1). It is possible that Zn2+ ions can be dissolved easily in the solution. Therefore, cuboctahedral and octahedral ZnO can be efficient starting materials for the synthesis of MOF-46(Zn) because the concentration of Zn2+ is high enough. In particular, the octahedral ZnO that occupied only the facet of {111} can produce more MOF-46(Zn) phases. SEM images of ZnO@MOF-46(Zn) synthesized by each ZnO morphology are shown in Figure 6. They reveal different morphologies. ZnO(2)@MOF-46(Zn) and ZnO(3)@MOF-46(Zn) are spherical due to the aggregation of thin plates, while ZnO(1)@MOF-46(Zn) is random.

3.2.1. Sonication Time

MOF-46(Zn) was found in a significant amount when ZnO(3) was used. Therefore, the synthetic factors that might affect the formation of MOF-46(Zn) were studied by using ZnO(3) as a precursor. Considering that ZnO can be dissolved during sonication to give zinc ions, different sonication times of 10, 20, and 30 min could result in a different number of zinc ions for MOF-46(Zn) formation. The effects of ultrasonication times are shown in Figure 7 and Figure 8. The XRD patterns in Figure 7 show that after 10 min of sonication, the main phase belongs to the unknown compound found in Figure 5, and the MOF-46(Zn) phase is barely observed. When the sonication time increases to 20 and 30 min, the MOF-46(Zn) phase can be assigned easily but with a small amount of the same unknown material present. Since the sonication time contributed to the degree of the dissolution of zinc ions from the zinc oxide surface, it is possible that at sonication times less than 20 min, the concentration of zinc ions was too low for MOF-46(Zn) formation. Instead, the low zinc ion content might favor the formation of the unknown phase. As a result, an unknown phase was still obtained with increasing sonication time, and the content of dissolved Zn2+ ions in the solution increased. Although certain zinc ions were used to form the unknown phase, once the concentration ratio between zinc ions and 2-ATP was sufficient, MOF-46(Zn) could form.

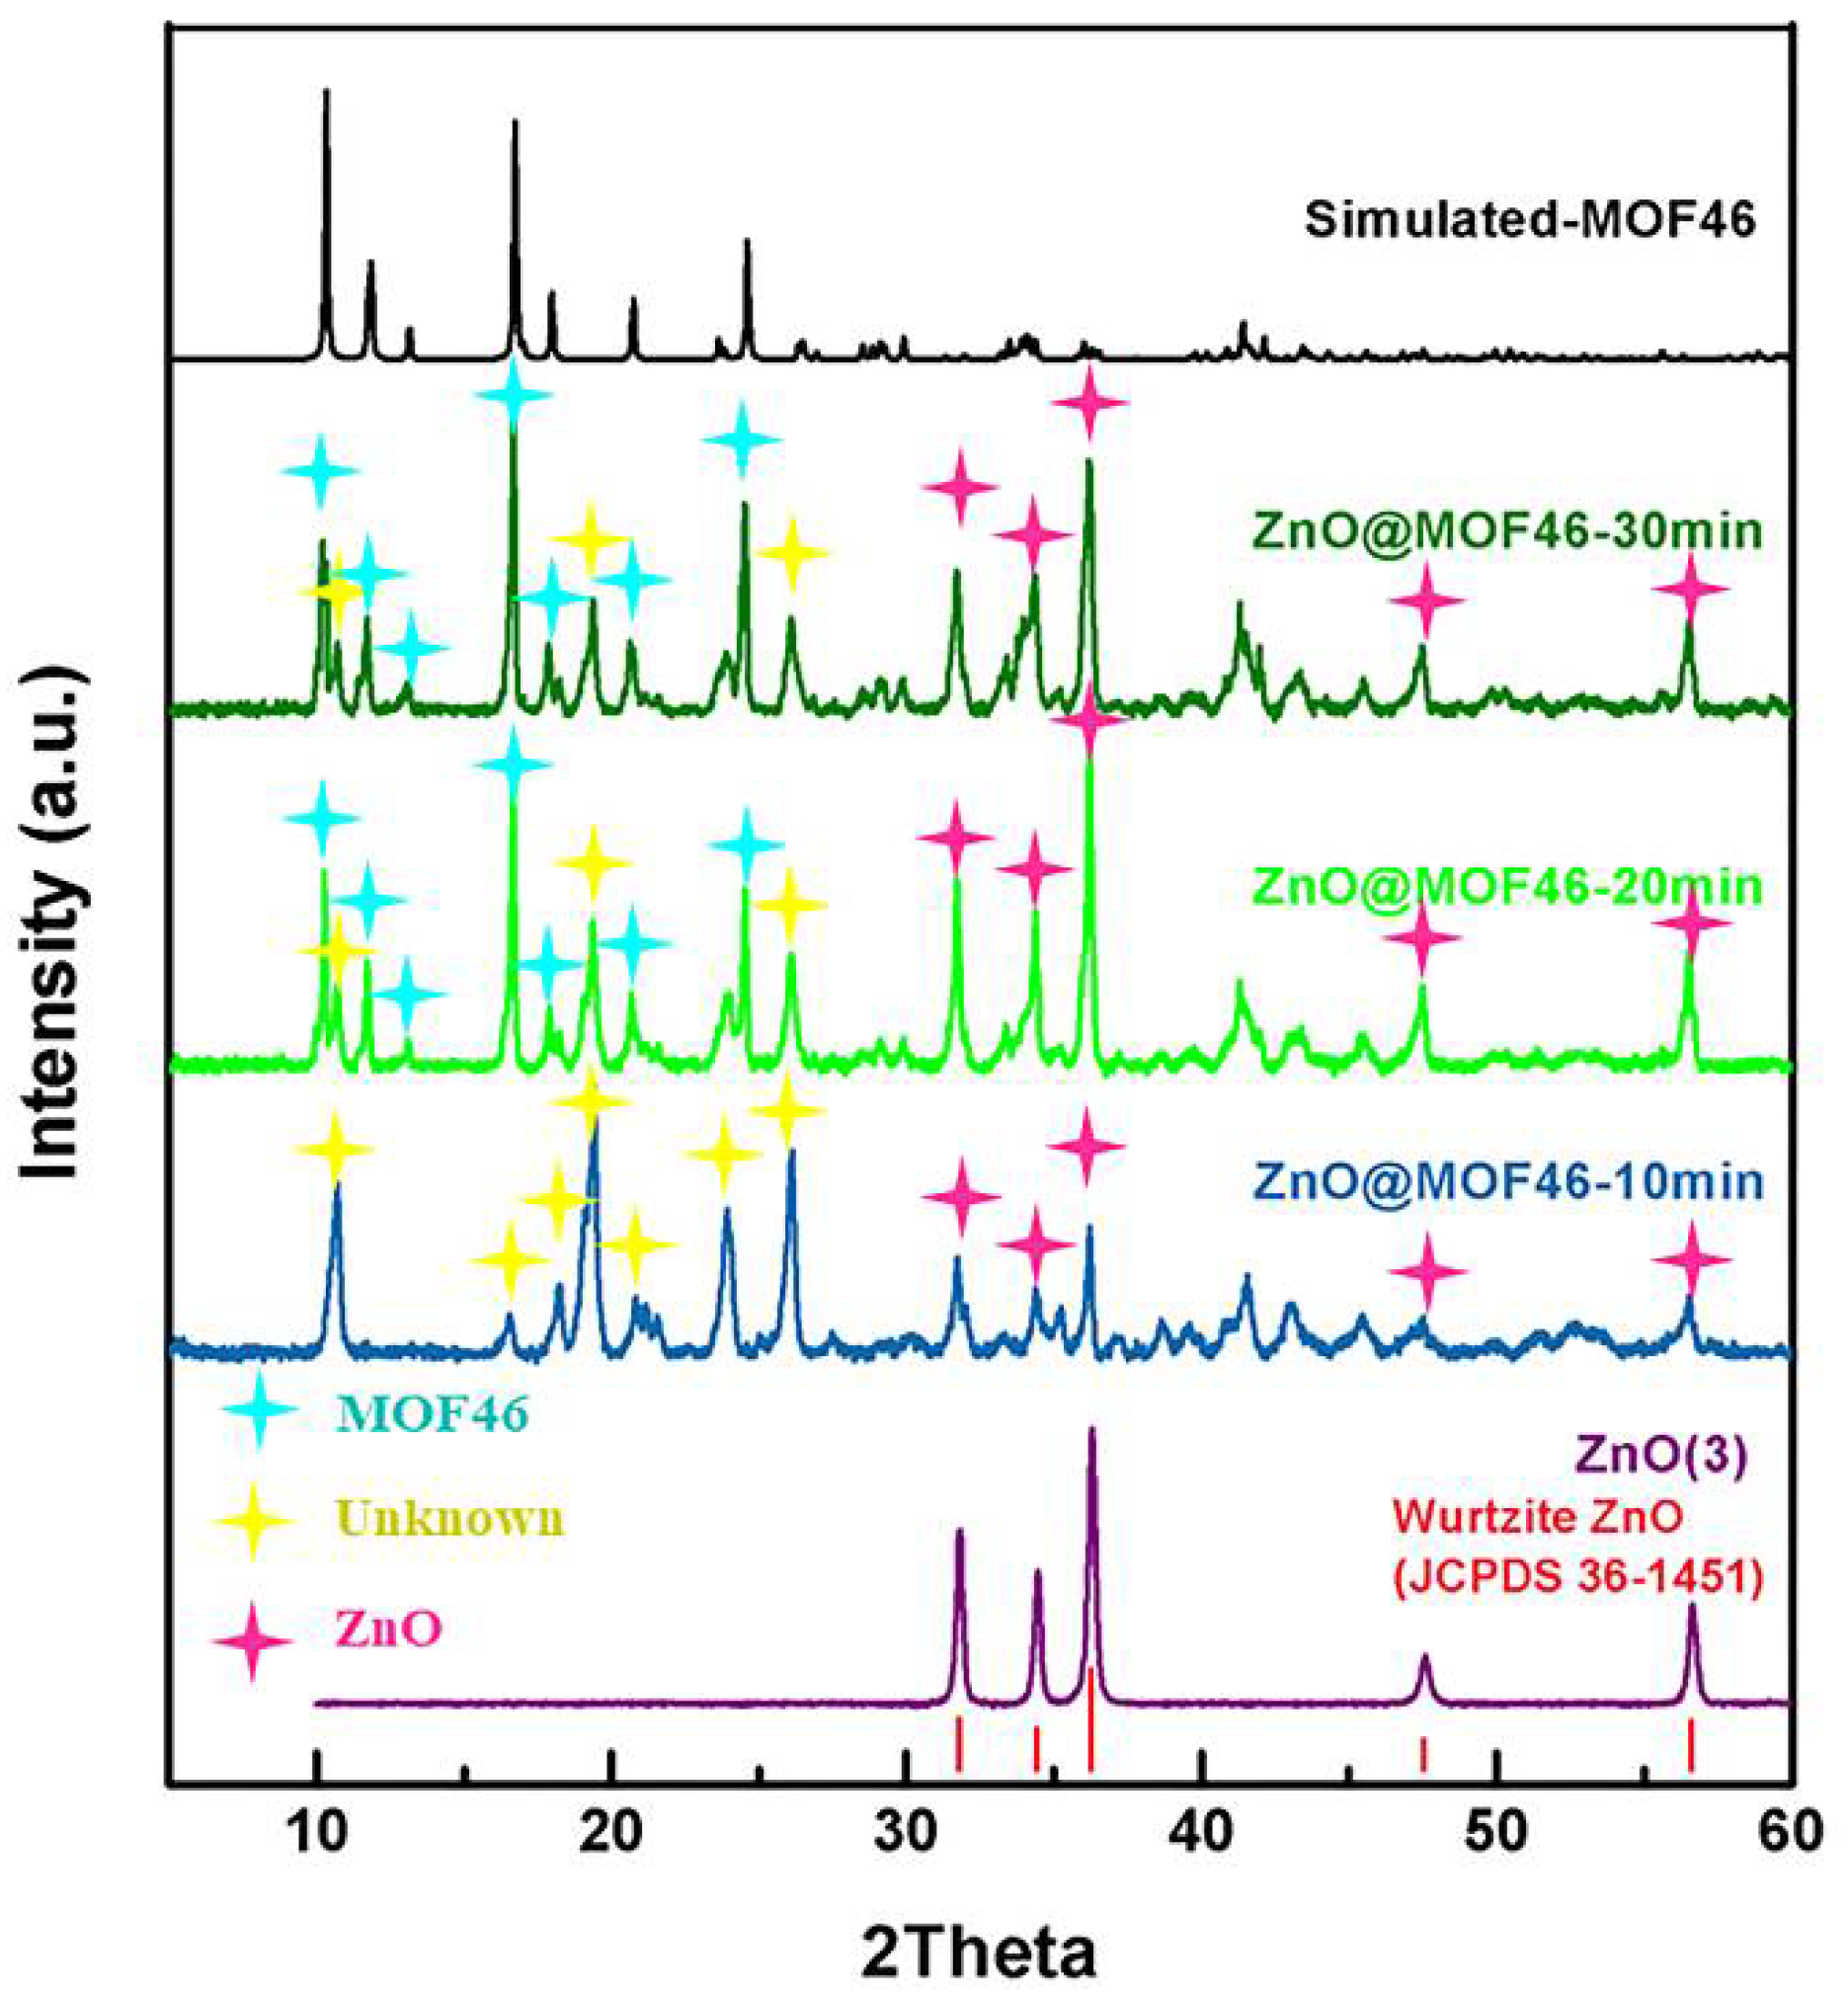
3.2.2. Treatment Time

The effect of reaction time on the formation of MOF-46(Zn) was also studied. After 30 min of sonication, the reactions were allowed to proceed for 6, 24, and 48 h. As seen in the XRD patterns (Figure 9) of the composites reacted for 6 and 24 h, only an unknown phase was presented as a product, while for the composite reacted for 48 h, both MOF-46(Zn) and the unknown phase coexisted. This indicates that the reaction time also plays a significant role in governing the nucleation and growth of MOF-46(Zn) on the surface of ZnO. It is possible that to form MOF-46(Zn), the concentration of zinc ions in the solution needs to be high enough. This can be achieved by allowing the reaction to proceed for as long as 48 h so that the amount of Zn2+ ions can reach the required value. Based on the results presented here, the proper sonication and reaction times were 30 min and 48 h, respectively.
The nanosheets assembled into spherical agglomerated particles regardless of sonication time. XRD analysis indicates that both the unknown phase and MOF-46(Zn) were produced in nanosheet form. The effect of reaction time as studied by SEM is displayed in Figure 10. The results reveal that for the composites reacted for 6 h, small nanosheets of the unknown phase with a size of approximately 0.37 nm assembled to form agglomerated particles with sizes varying from 1.9 to 3.5 nm. As the reaction time increased to 24 h, the agglomerated particles became larger in size than those produced in 6 h.
After 48 h of reaction, spherically agglomerated particles formed by the assembly of MOF-46(Zn) nanosheets. The sizes of the spheres are quite uniform, indicating that the nucleation and growth of MOF-46(Zn) on the surface of ZnO were homogeneous throughout the solution. From the results, we conclude that MOF-46(Zn) can be synthesized when the sonication time is 20–30 min and that the appropriate time for the synthesis of MOF-46(Zn) on the ZnO surface is 48 h.
The morphology of the products was investigated by SEM, and the results are exhibited in Figure 6, Figure 8 and Figure 10. After 48 h of the reaction, we observed the loss of the initial shape of ZnO precursors. Cubic ZnO(1) yielded aggregated rhombus shapes of the unknown phase and ZnO. The use of cuboctahedralZnO(2) and octahedral ZnO(3) led to the formation of microspheres assembled by MOF-46(Zn) rhombus shapes. TEM and HRTEM, as shown in Figure 11, reveal a spherical morphology, with ZnO in the core shell and MOF-46(Zn) covering the outer shell, which can be confirmed by SAED. The core shell shows the diffraction of electrons, with a d-spacing of 0.288 nm, which corresponds to the (100) plane of ZnO.

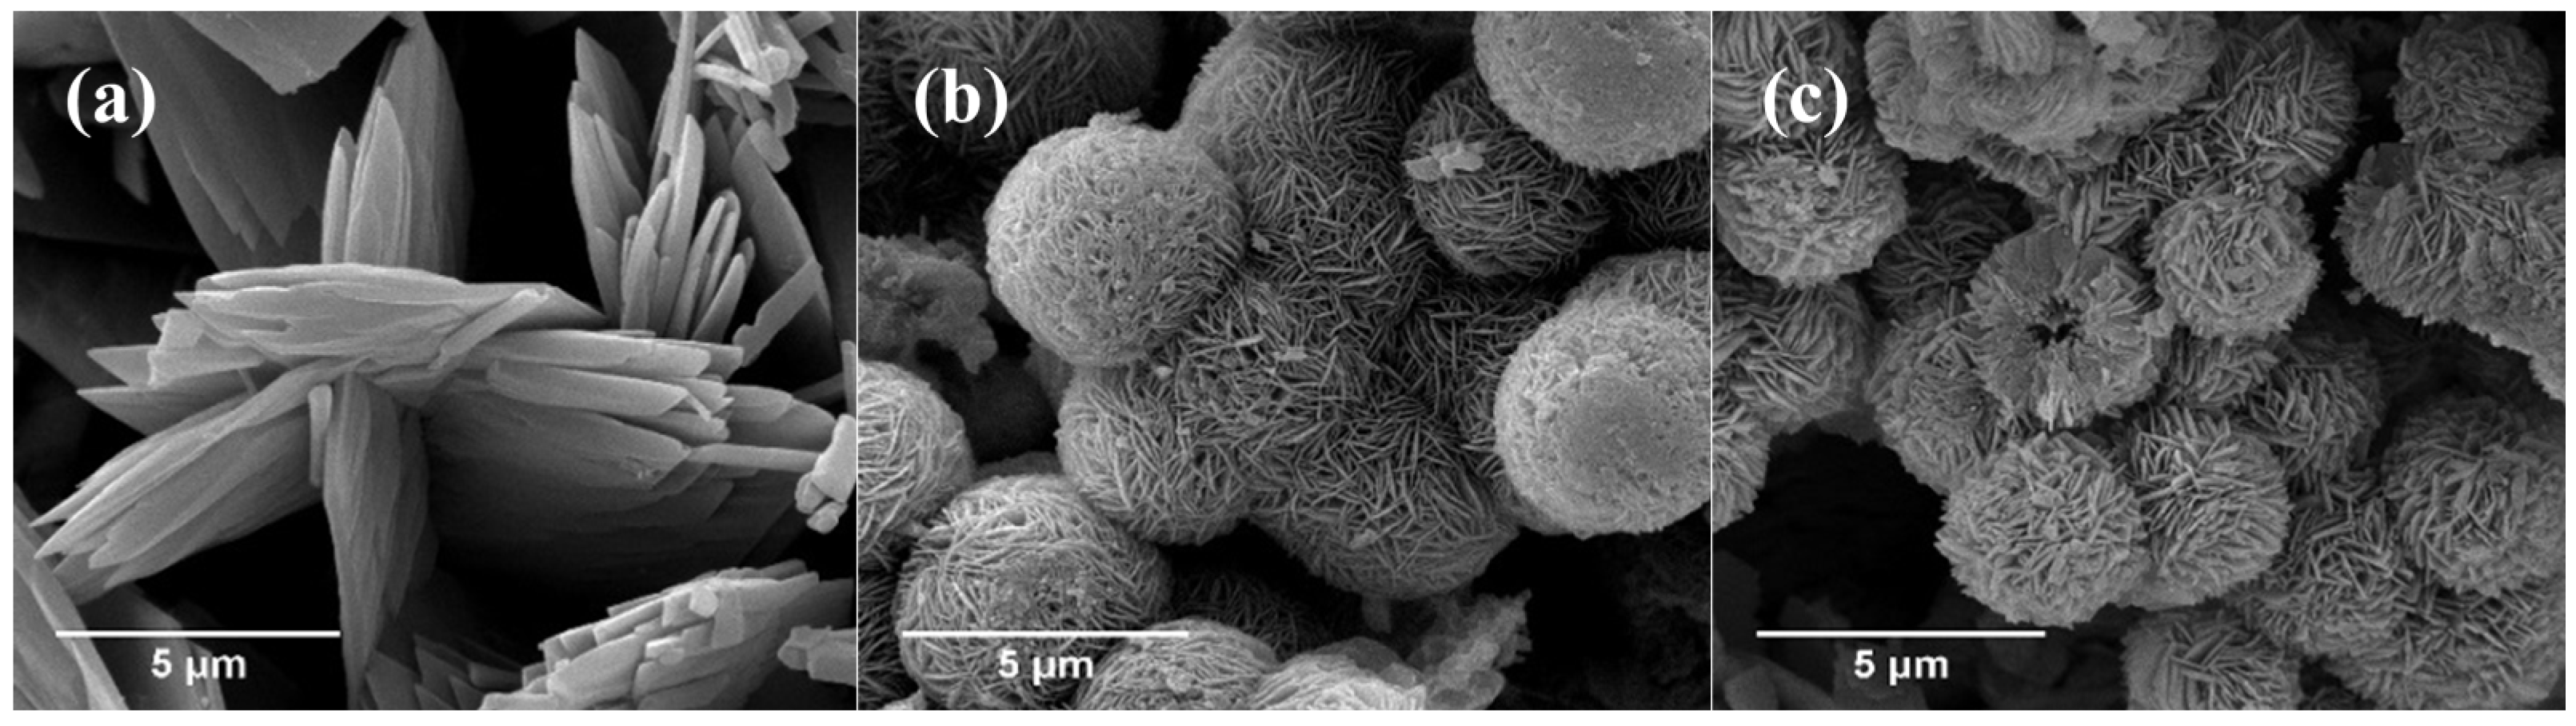
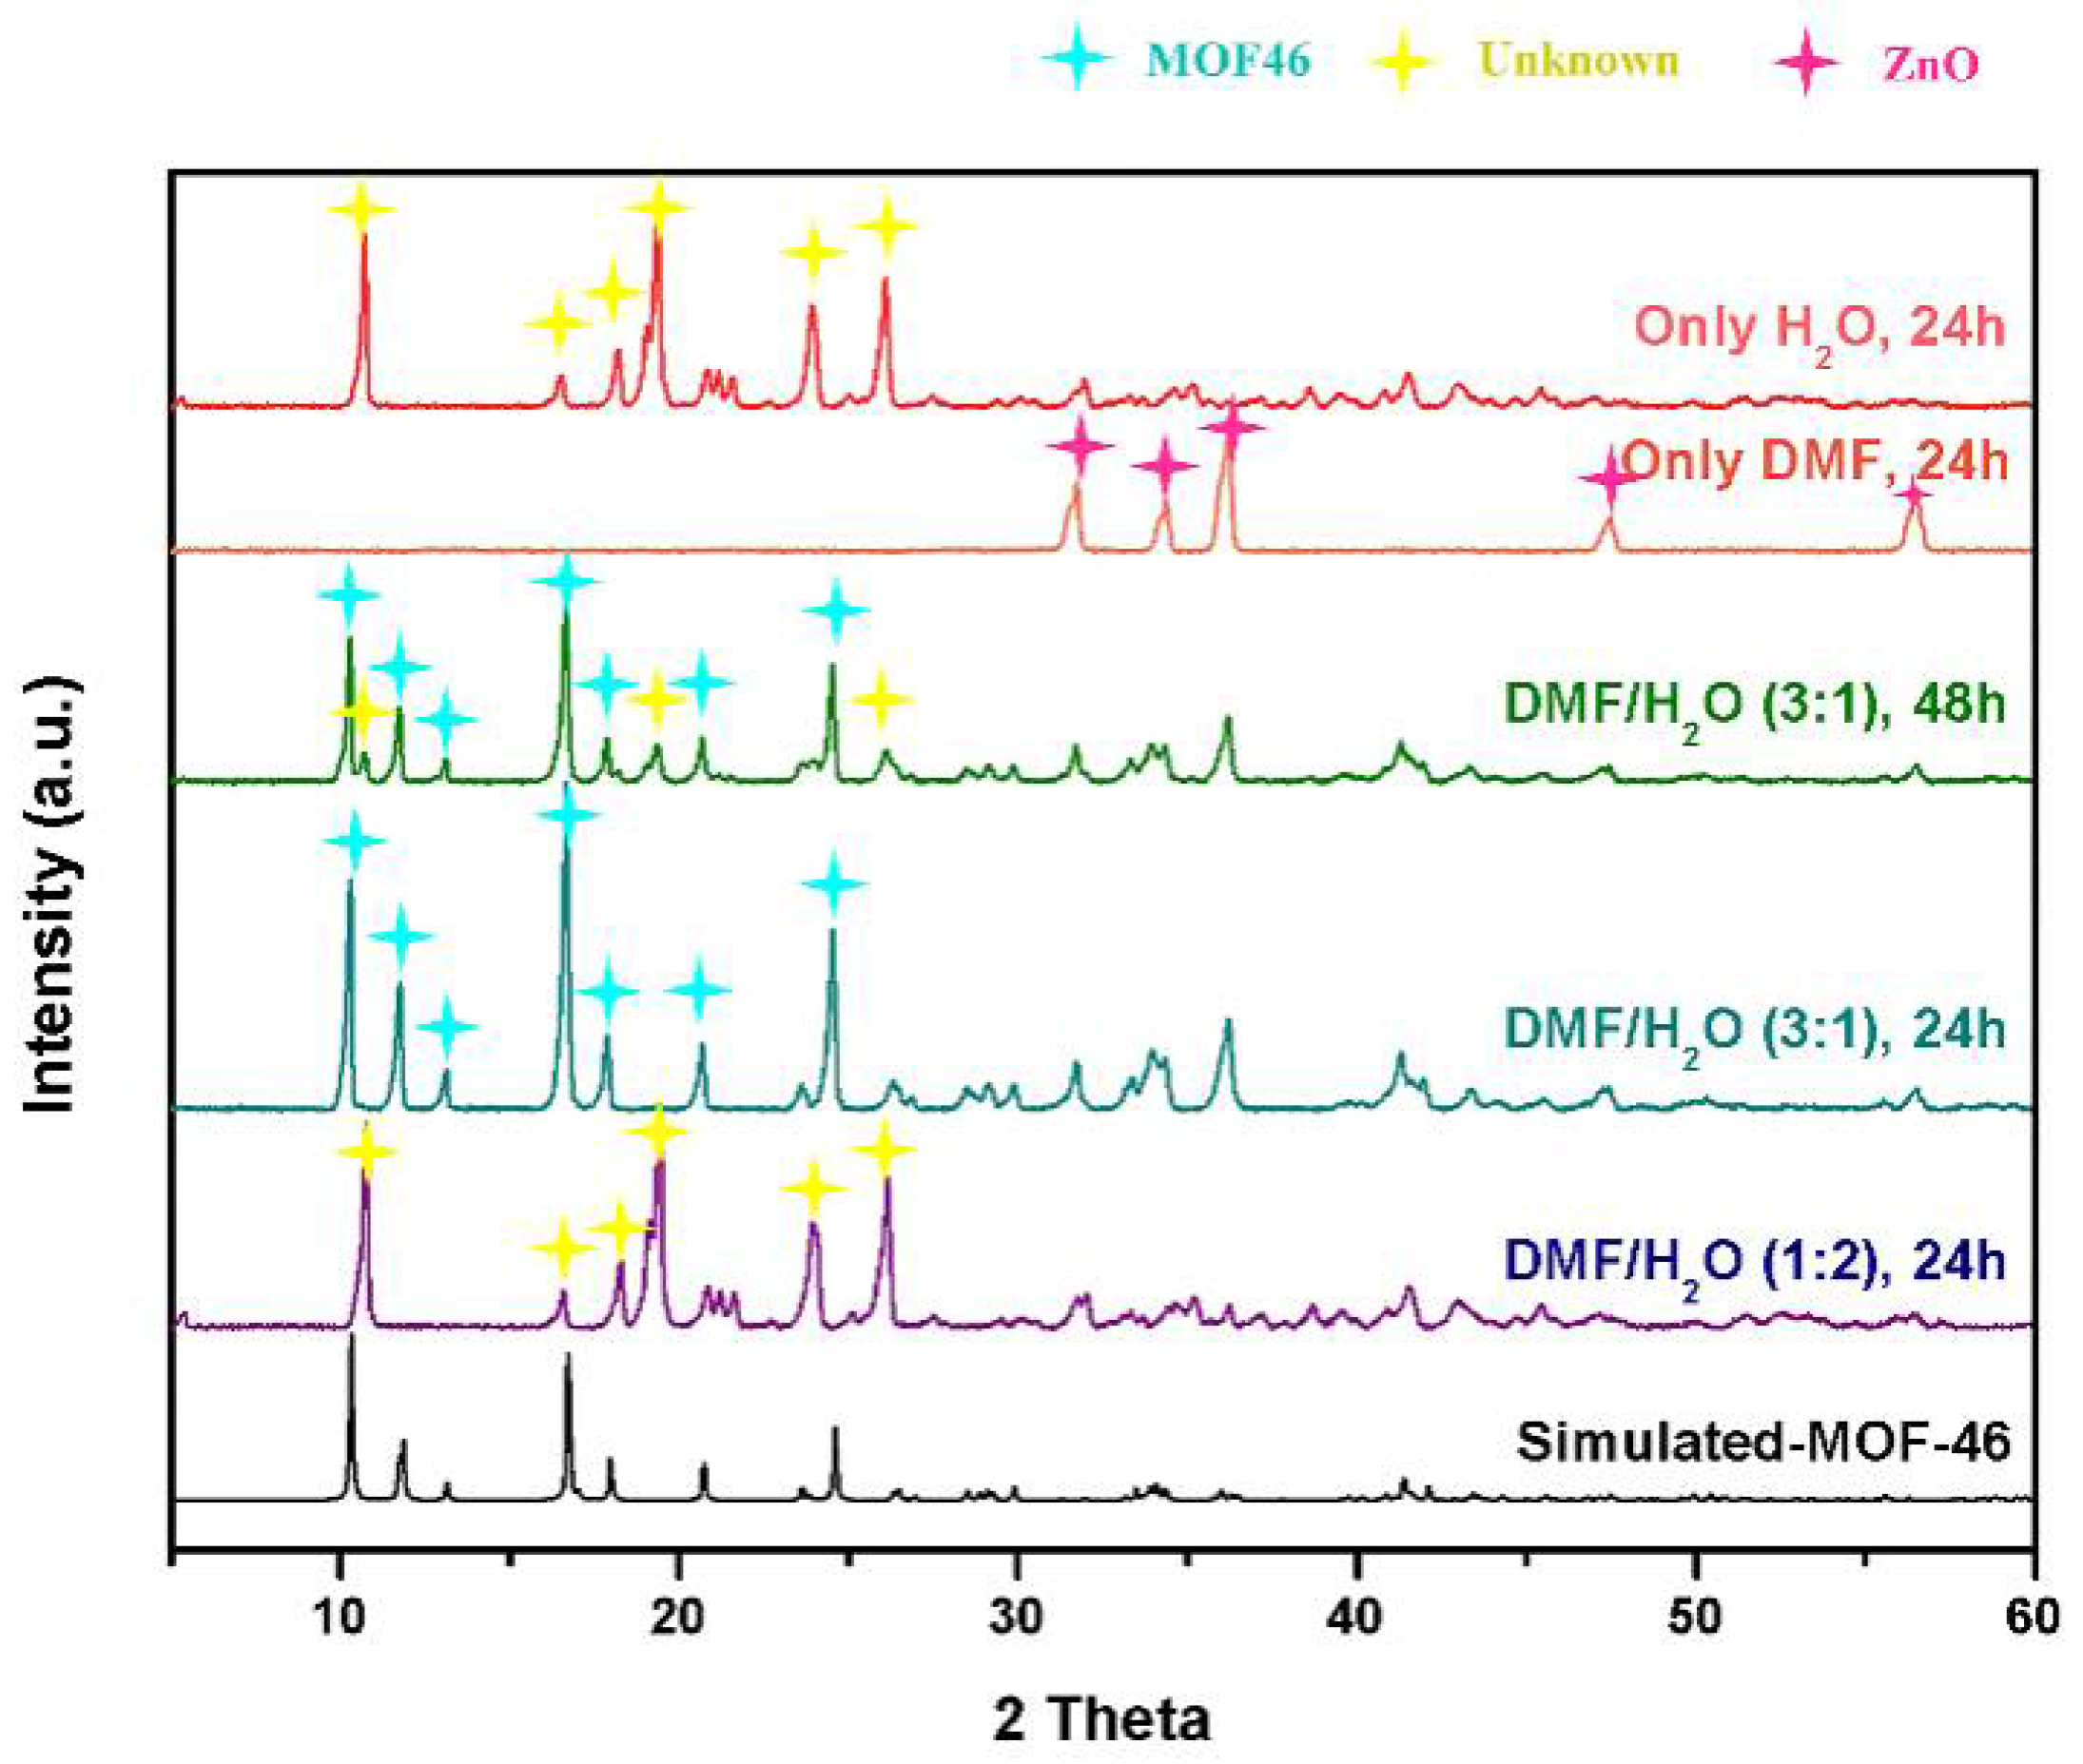
3.2.3. Preparation of MOF-46(Zn) as a Reference Material

The samples were also prepared with different ratios of solvent and DMF, with DMF/H2O = 1:2 and 3:1. The XRD patterns of the samples are shown in Figure 12. After stirring ZnO in DMF for 24 h, the original ZnO phase was observed in the XRD pattern. This suggests that no reaction takes place because ZnO cannot dissolve in pure DMF, while when using H2O instead, only the unknown phase appears. After stirring the mixture in the solvent with DMF/H2O of 3:1 for 24 h, MOF-46(Zn) was obtained. When the reaction time was extended to 48 h, diffraction peaks due to the unknown phase became apparent, while other peaks still existed, which suggested the existence of MOF-46(Zn). However, the use of a 1:2 ratio of DMF/H2O with stirring for 24 h is just obtained the unknown phase. These phenomena imply that the formation of MOF-46 requires using mixed DMF and H2O as a solvent and that the quantity of DMF is crucial to successfully prepare MOF-46(Zn).
Thermal gravimetric analysis was conducted to obtain information on the thermal stability of the unknown phase and MOF-46(Zn) prepared by DMF/H2O ratios of 1:2 and 3:1, respectively (Figure 13). MOF-46(Zn) shows significant weight loss from 200 to 300 °C, corresponding to the decomposition of DMF ligands. This loss is not found in the unknown phase, implying that the unknown phase does not contain DMF. This can be correlated to the small amount of DMF present in the synthetic system when 1:2 DMF/H2O is used. In contrast, the DMF/H2O 3:1 solvent system provides enough DMF, and a large quantity of DMF favors MOF-46(Zn) synthesis. Therefore, the unknown phase could be called MOF-46(Zn)-H2O.
To study the relationship between MOF-46(Zn) and MOF-46(Zn)-H2O (unknown), the obtained MOF-46(Zn)-H2O was dehydrated at 220 °C for 30 min and then immersed in DMF with consistent stirring for 24 h to produce MOF-46(Zn). The XRD pattern in Figure S2 shows that the obtained product cannot transform to MOF-46(Zn) because of the strong coordination of aqua ligands with Zn(II) ions, resulting in aqua ligands that could not be removed from the structure. The obtained MOF-46(Zn) from a previous experiment was also immersed in aqueous solution and continuously stirred for 24 h to produce an unknown phase. The XRD pattern in Figure S3 exhibits the obtained product in an unknown phase without the MOF-46(Zn) phase. These results confirm that MOF-46(Zn)-H2O can be more easily formed than MOF-46(Zn), leading to the mixture phase of products MOF-46(Zn) and MOF-46(Zn)-H2O, which we call MOF-46(Zn)-DW.

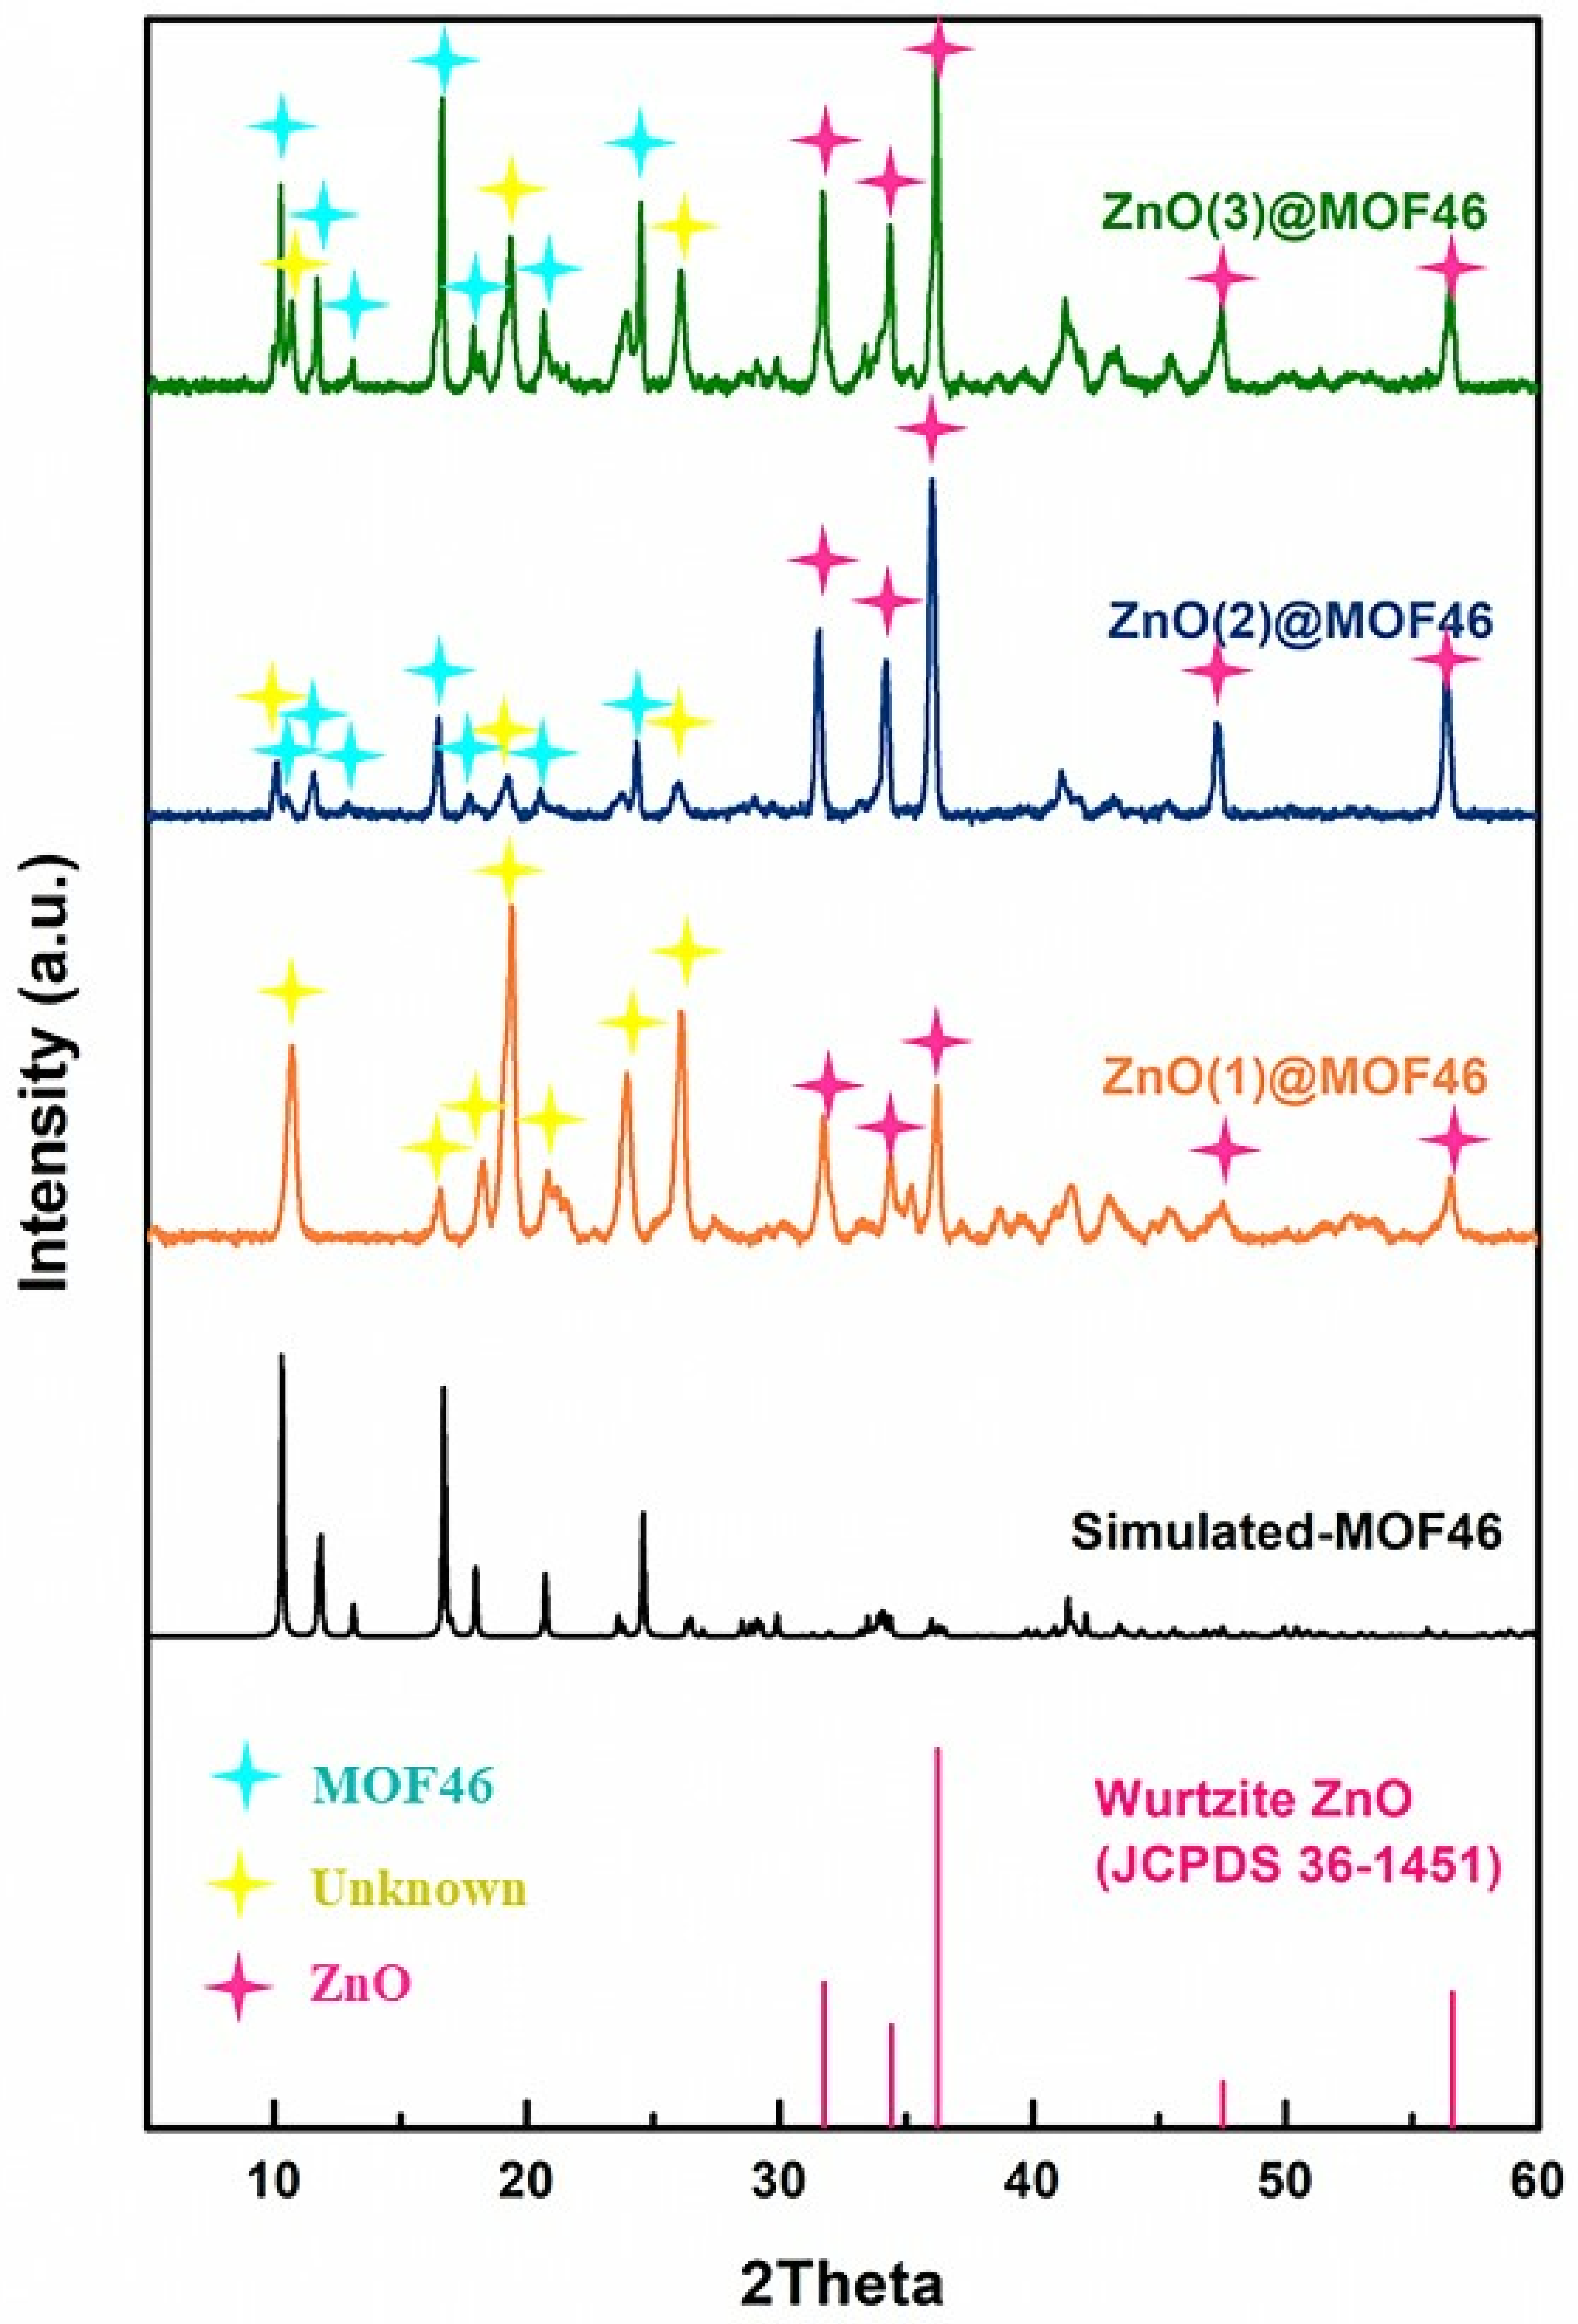
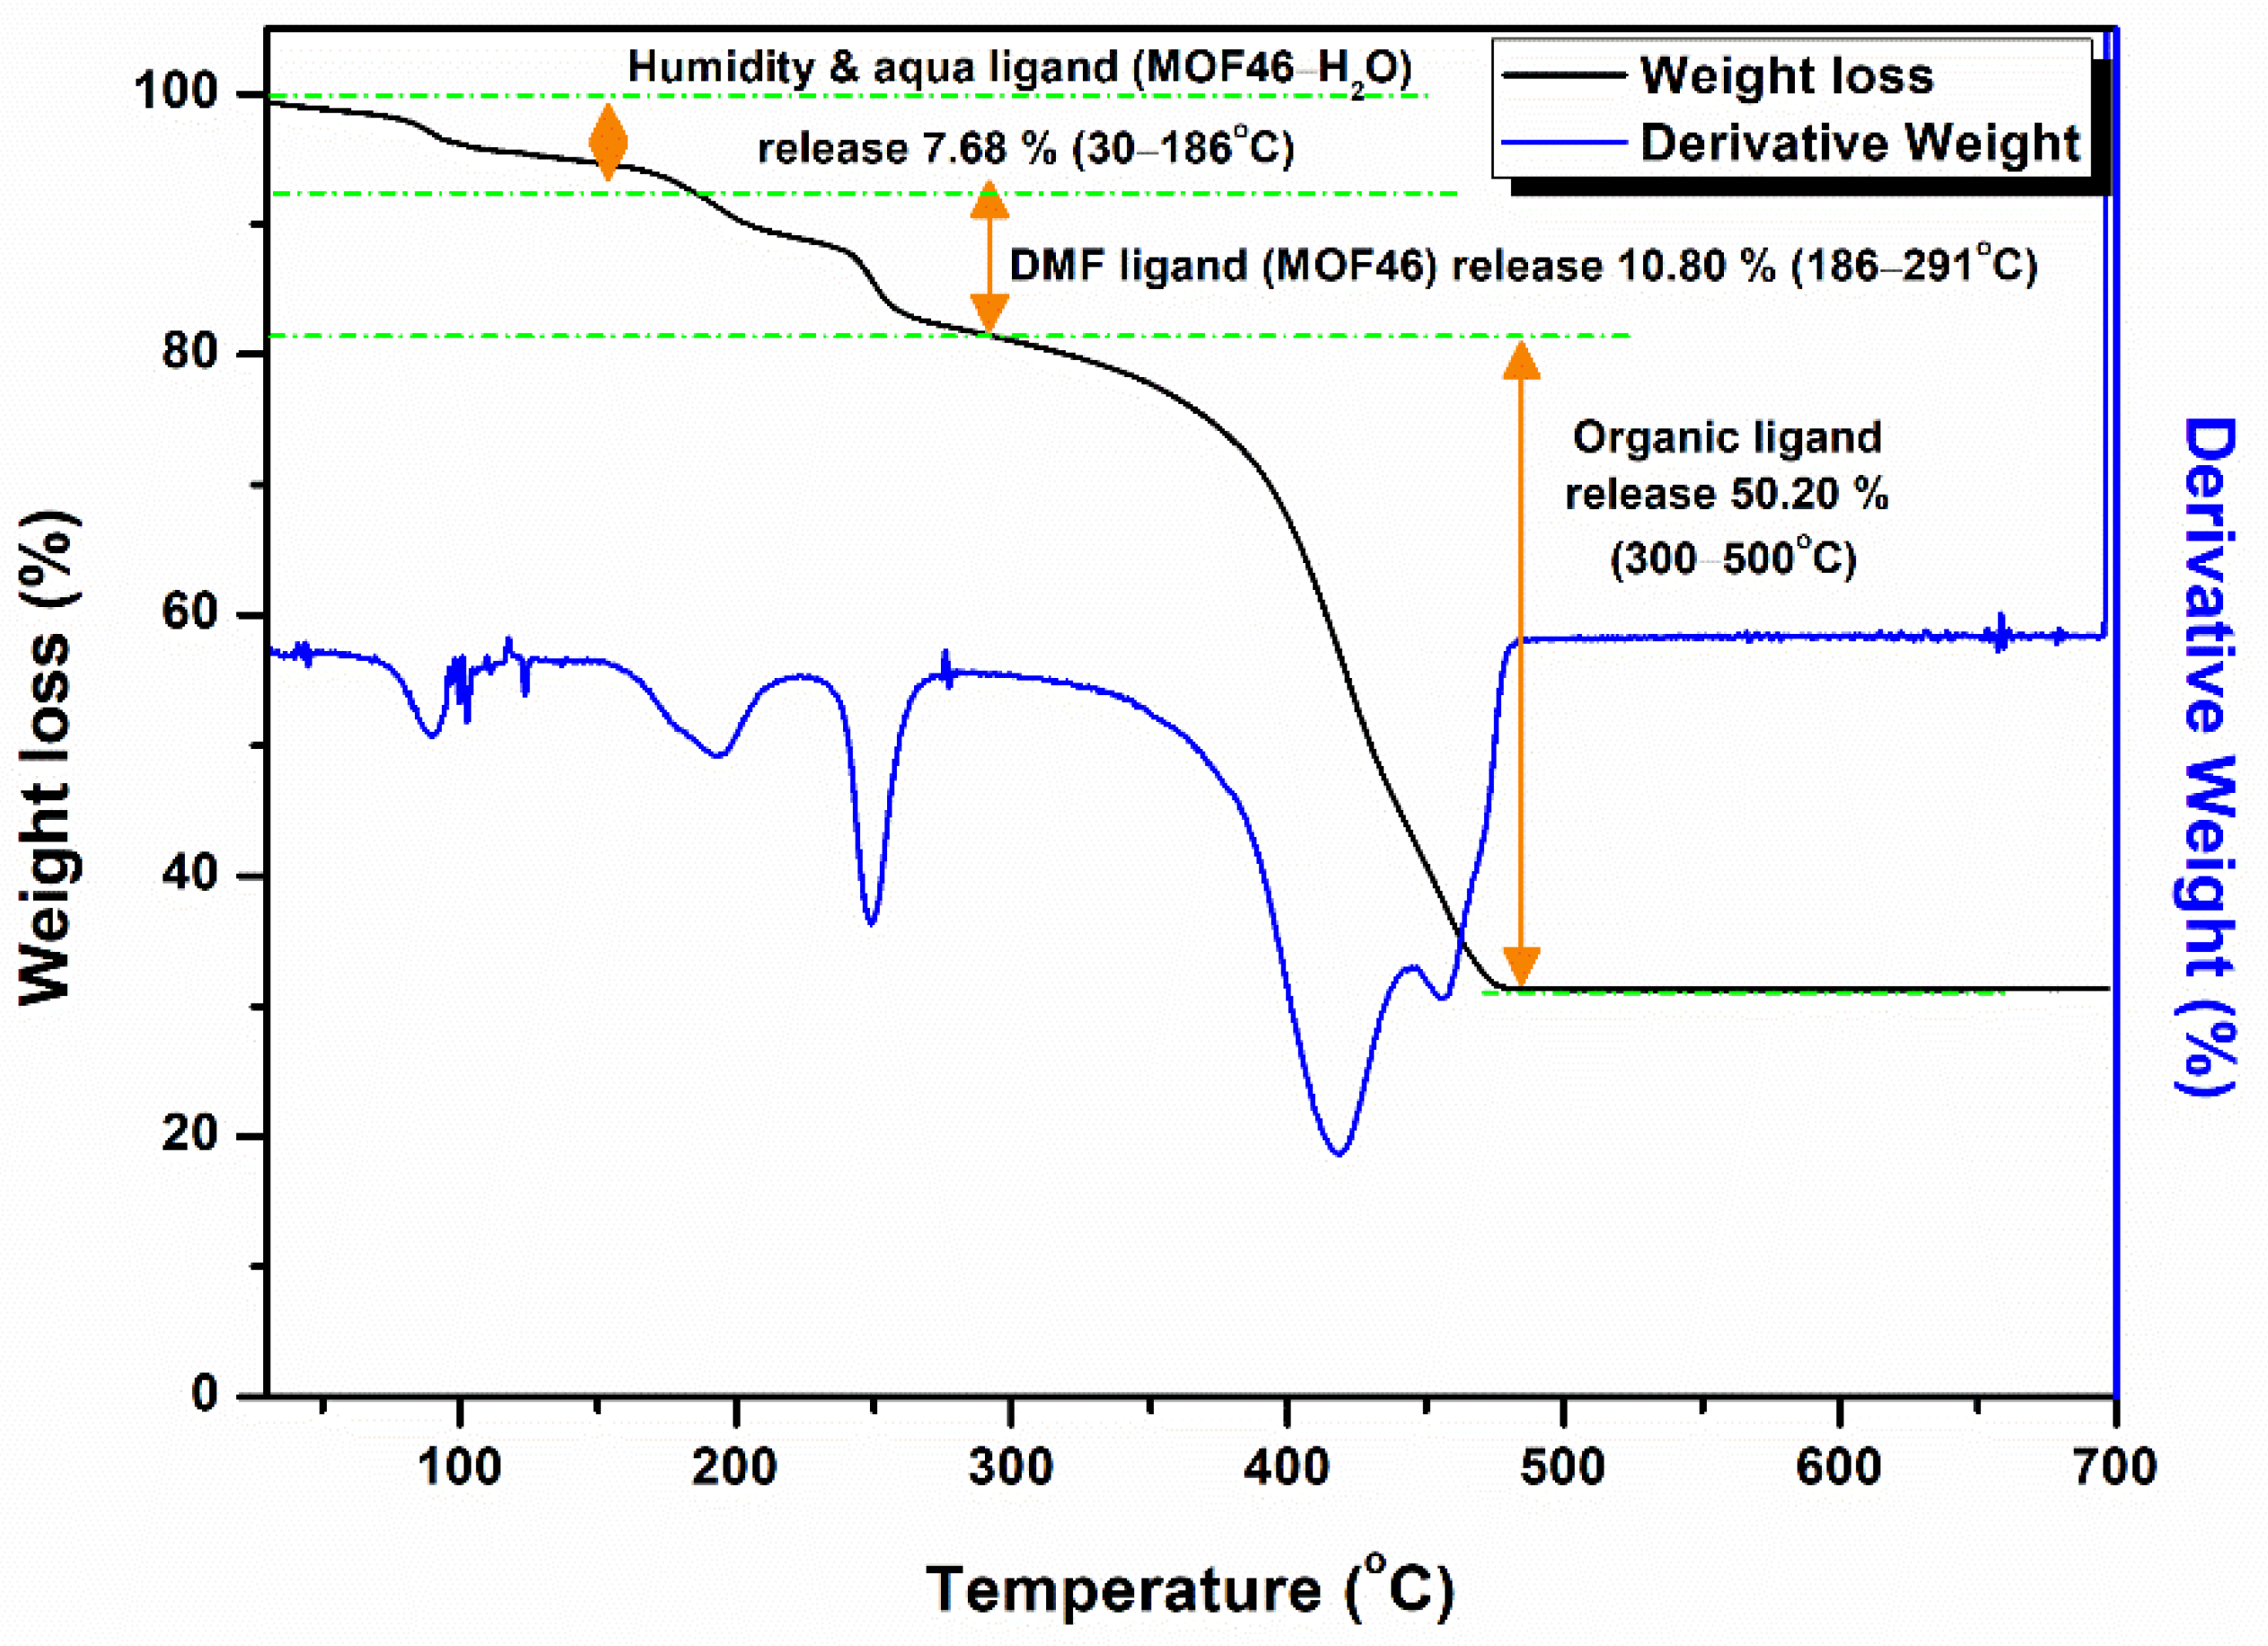
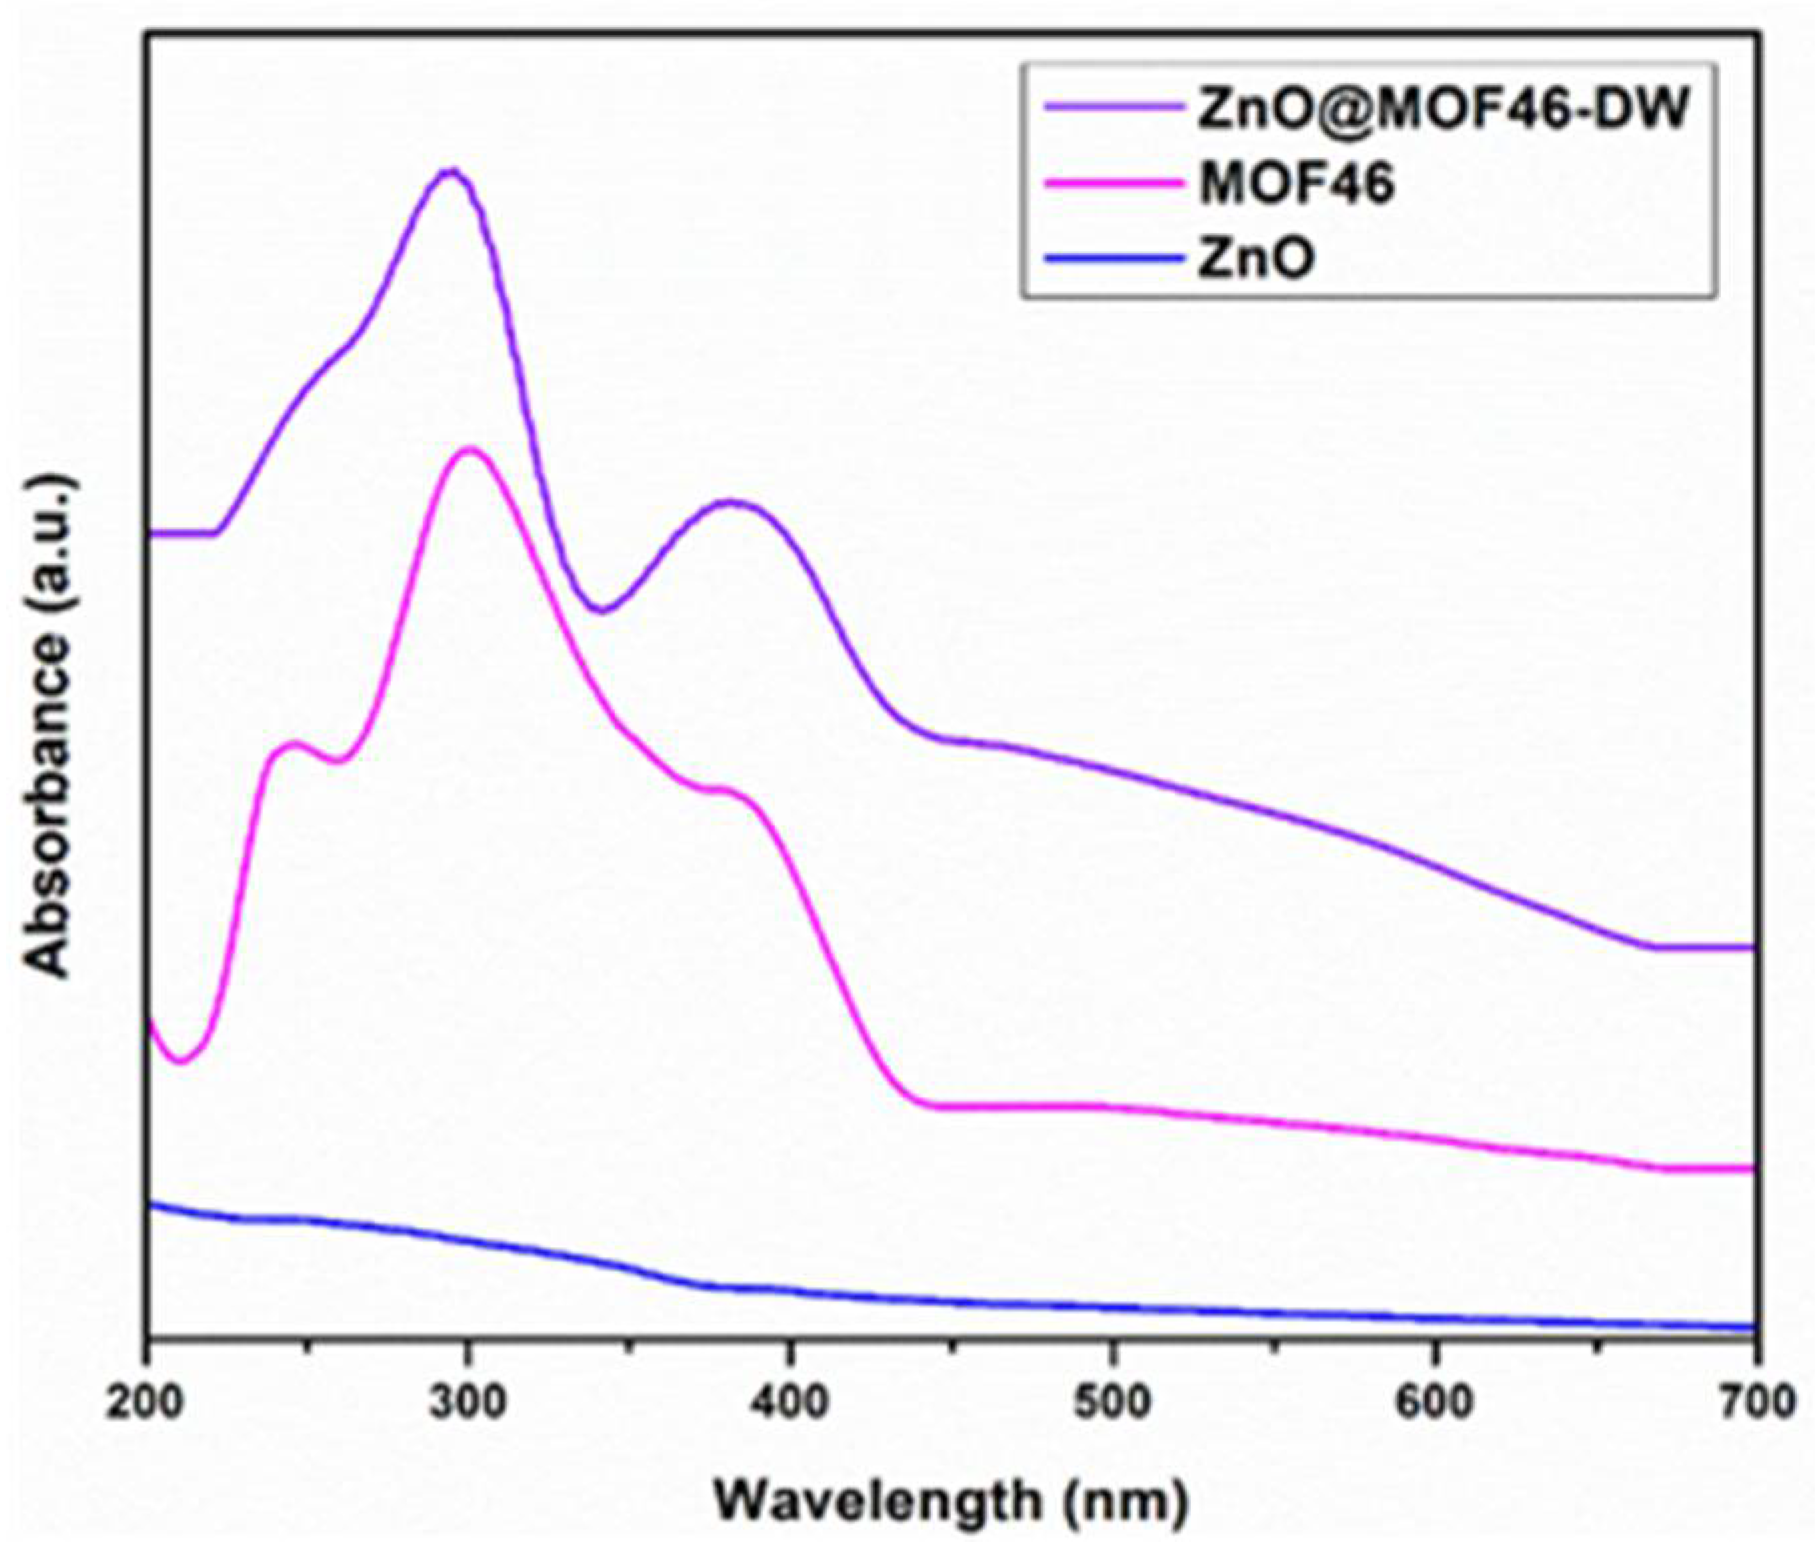
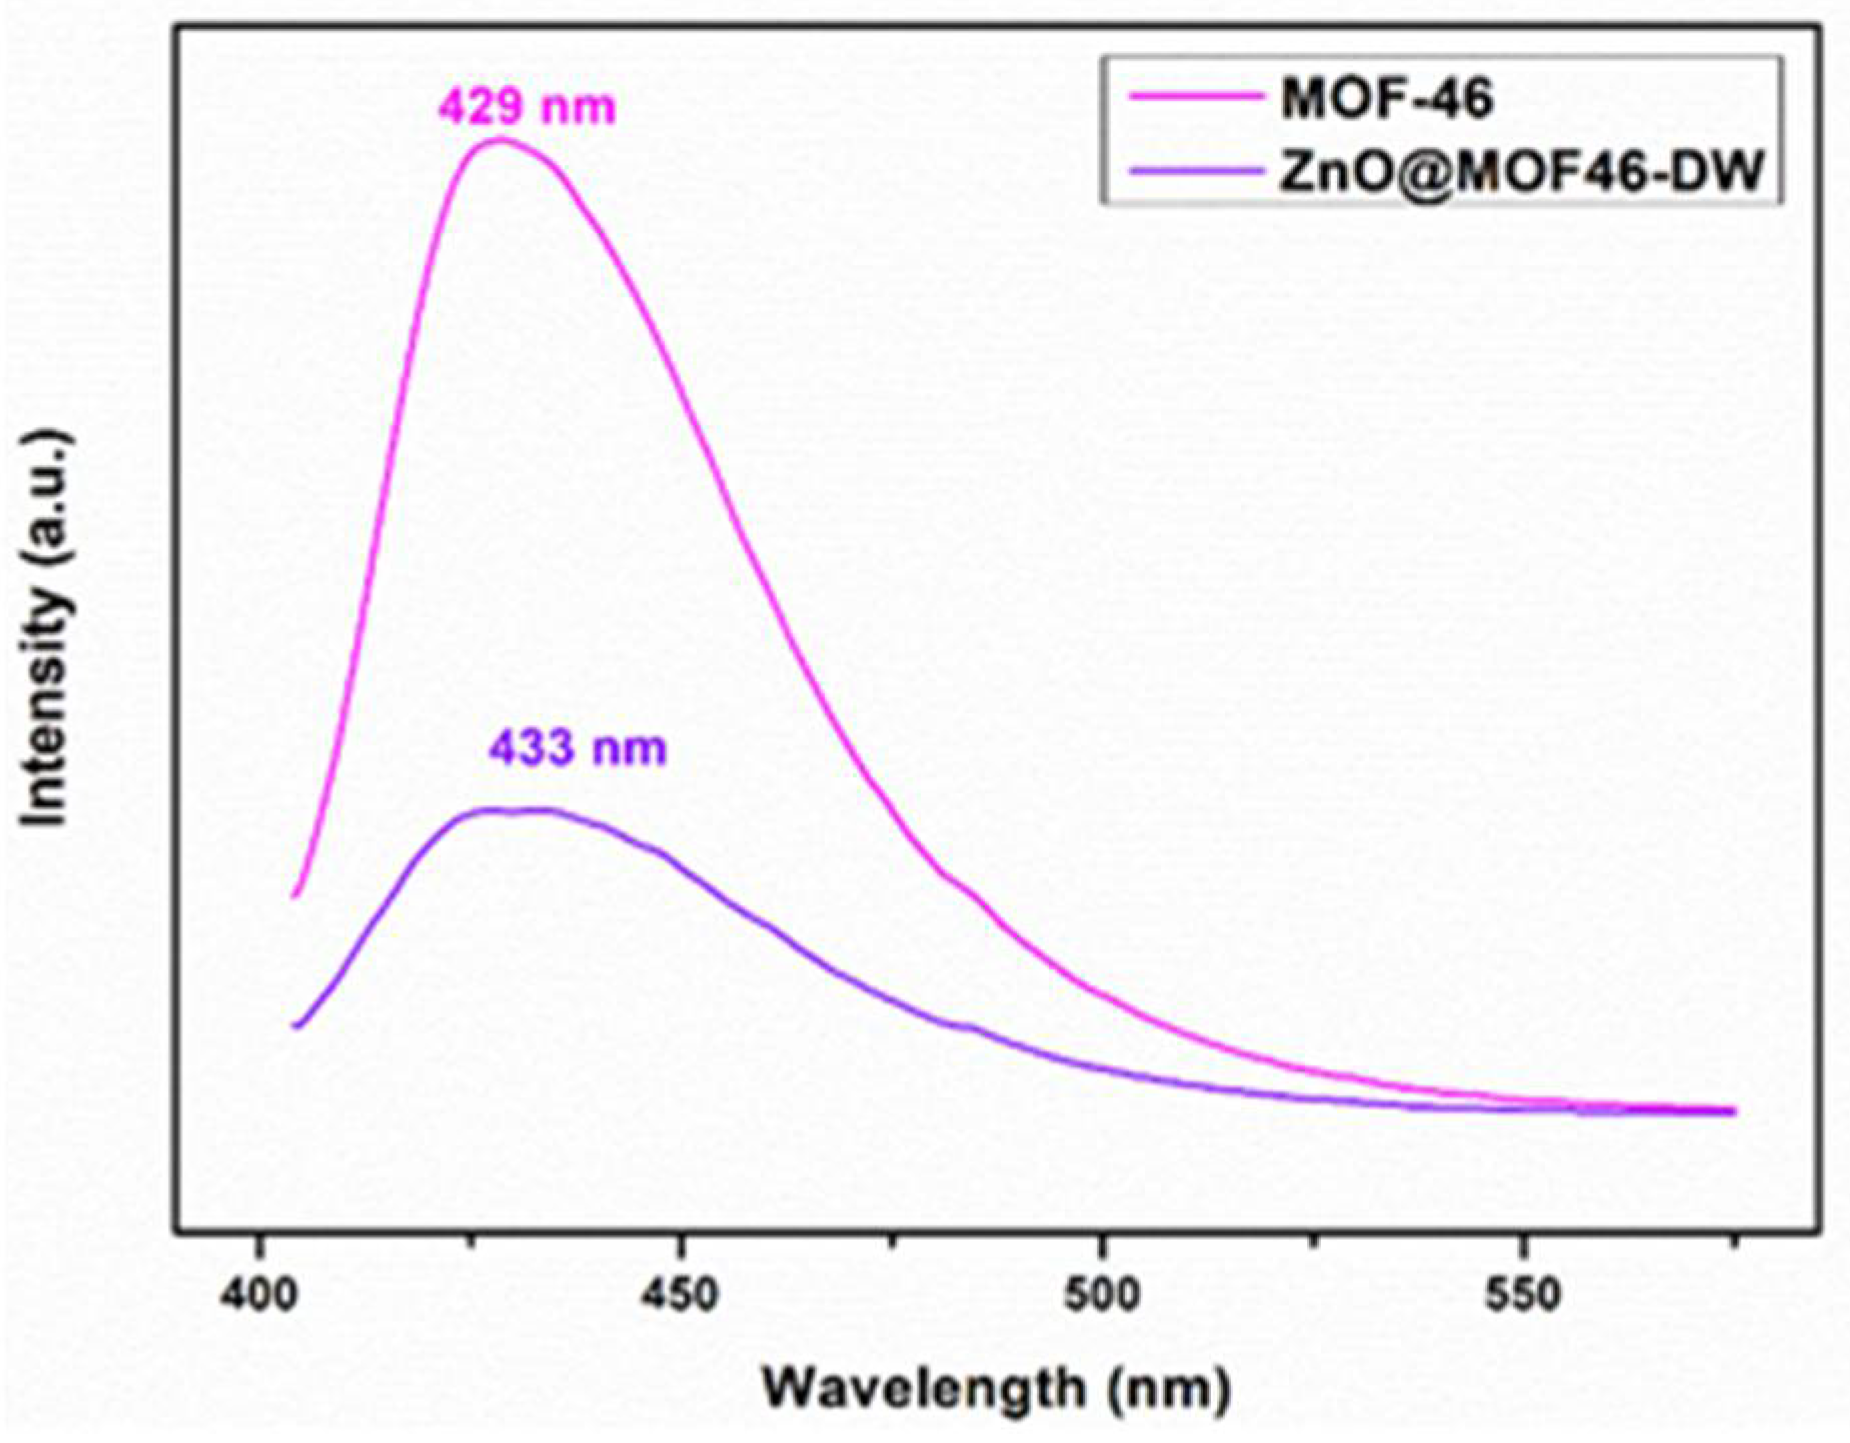
3.3. Structural Confirmation of Samples

To confirm the presence of ZnO and MOF-46(Zn) in the obtained products, the samples were investigated by FT-IR spectroscopy and thermal analysis. Because the product obtained from 30 min of sonication consists of both MOF-46(Zn) and MOF-46(Zn)-H2O, it could be called ZnO@MOF-46(Zn)-DW. The FT-IR spectrum in Figure 14 reveals the vibration band of ZnO at 441 cm−1, but it is not obvious in the obtained products.
The FT-IR spectra of the obtained products compared with the FT-IR spectrum of MOF-46(Zn) are presented in Figure 14. The vibration peaks at 1395 and 1558 cm−1 were symmetric, and the asymmetric vibration energy of the carboxylate group (-COO-) in the products shifted from 1381 and 1576 cm−1 in MOF-46(Zn). The vibration peak at approximately 1430–1630 cm−1 is displayed in MOF-46(Zn), MOF-46(Zn)-H2O (10 min of sonication), and ZnO@MOF-46(Zn)-DW (sonicated for 20 and 30 min), contributing to the (C=C and C=N) aromatic vibration band. The vibration peak at 1668 cm−1 was also found in the ZnO@MOF-46(Zn)-DW spectra, which was expected to be the carbonyl vibration (-CO) of the DMF ligand, but it was not clear in MOF-46(Zn)-H2O sonicated for 10 min.
Figure 15 shows the TGA spectrum of ZnO@MOF-46(Zn)-DW sonicated for 30 min and left to stand for 48 h under a nitrogen atmosphere. Slight degradation was observed at 70–180 °C due to the decomposition of humidity and aqua ligands of 7.68%. The temperature range of 180–300 °C presents a % weight loss of the DMF ligand of 10.80%, indicating that the content of MOF-46(Zn) in the structure was approximately 47.22% (MOF-46(Zn) contains 22.87% of DMF in the structure). The next decomposition range of 300–460 °C is attributed to the cleavage of coordination linkages in the MOF-46(Zn) and MOF-46(Zn)-H2O phases. At 500 °C and upwards, no decomposition is found. The final product was ZnO(30%), which was thermally stable at temperatures over 500 °C. The difference between the MOF-46(Zn) and MOF-46(Zn)-H2O phases is the DMF ligand. From a previous study, the structure of MOF-46(Zn)-H2O includes none of the DMF ligands. However, the TGA curve indicated that MOF-46(Zn) was truly formed at ZnO@MOF-46(Zn)-DW.

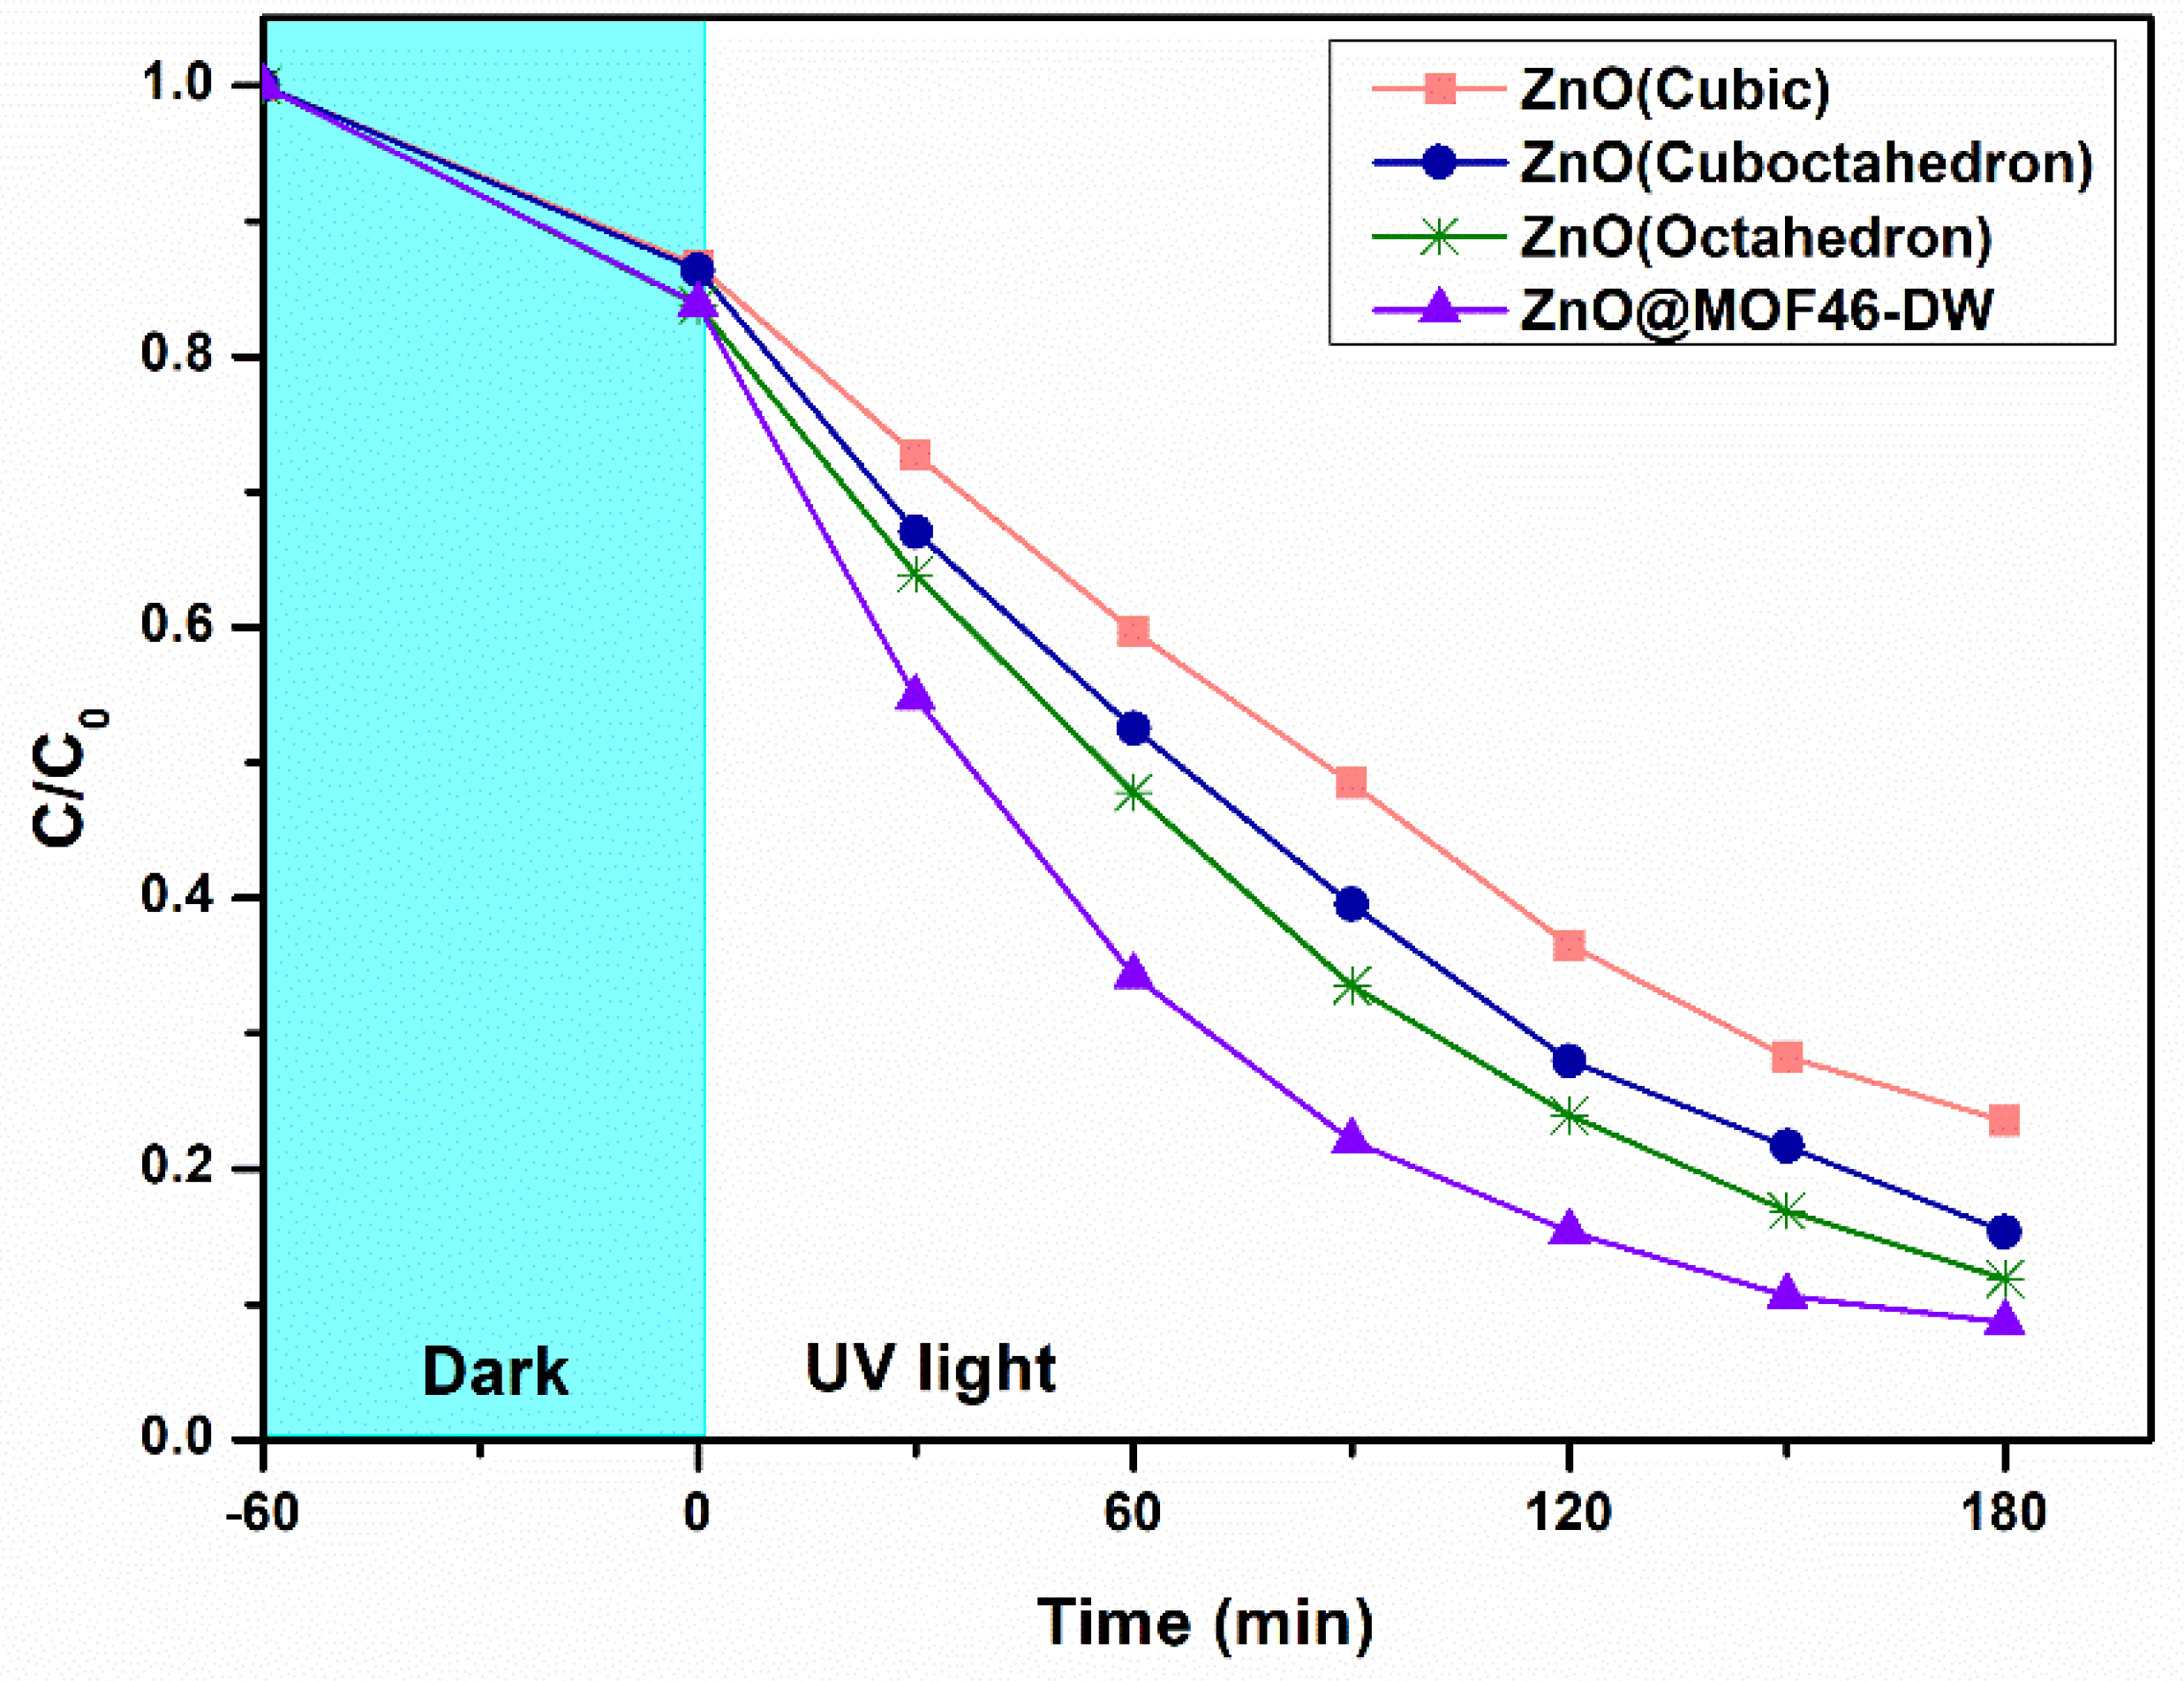
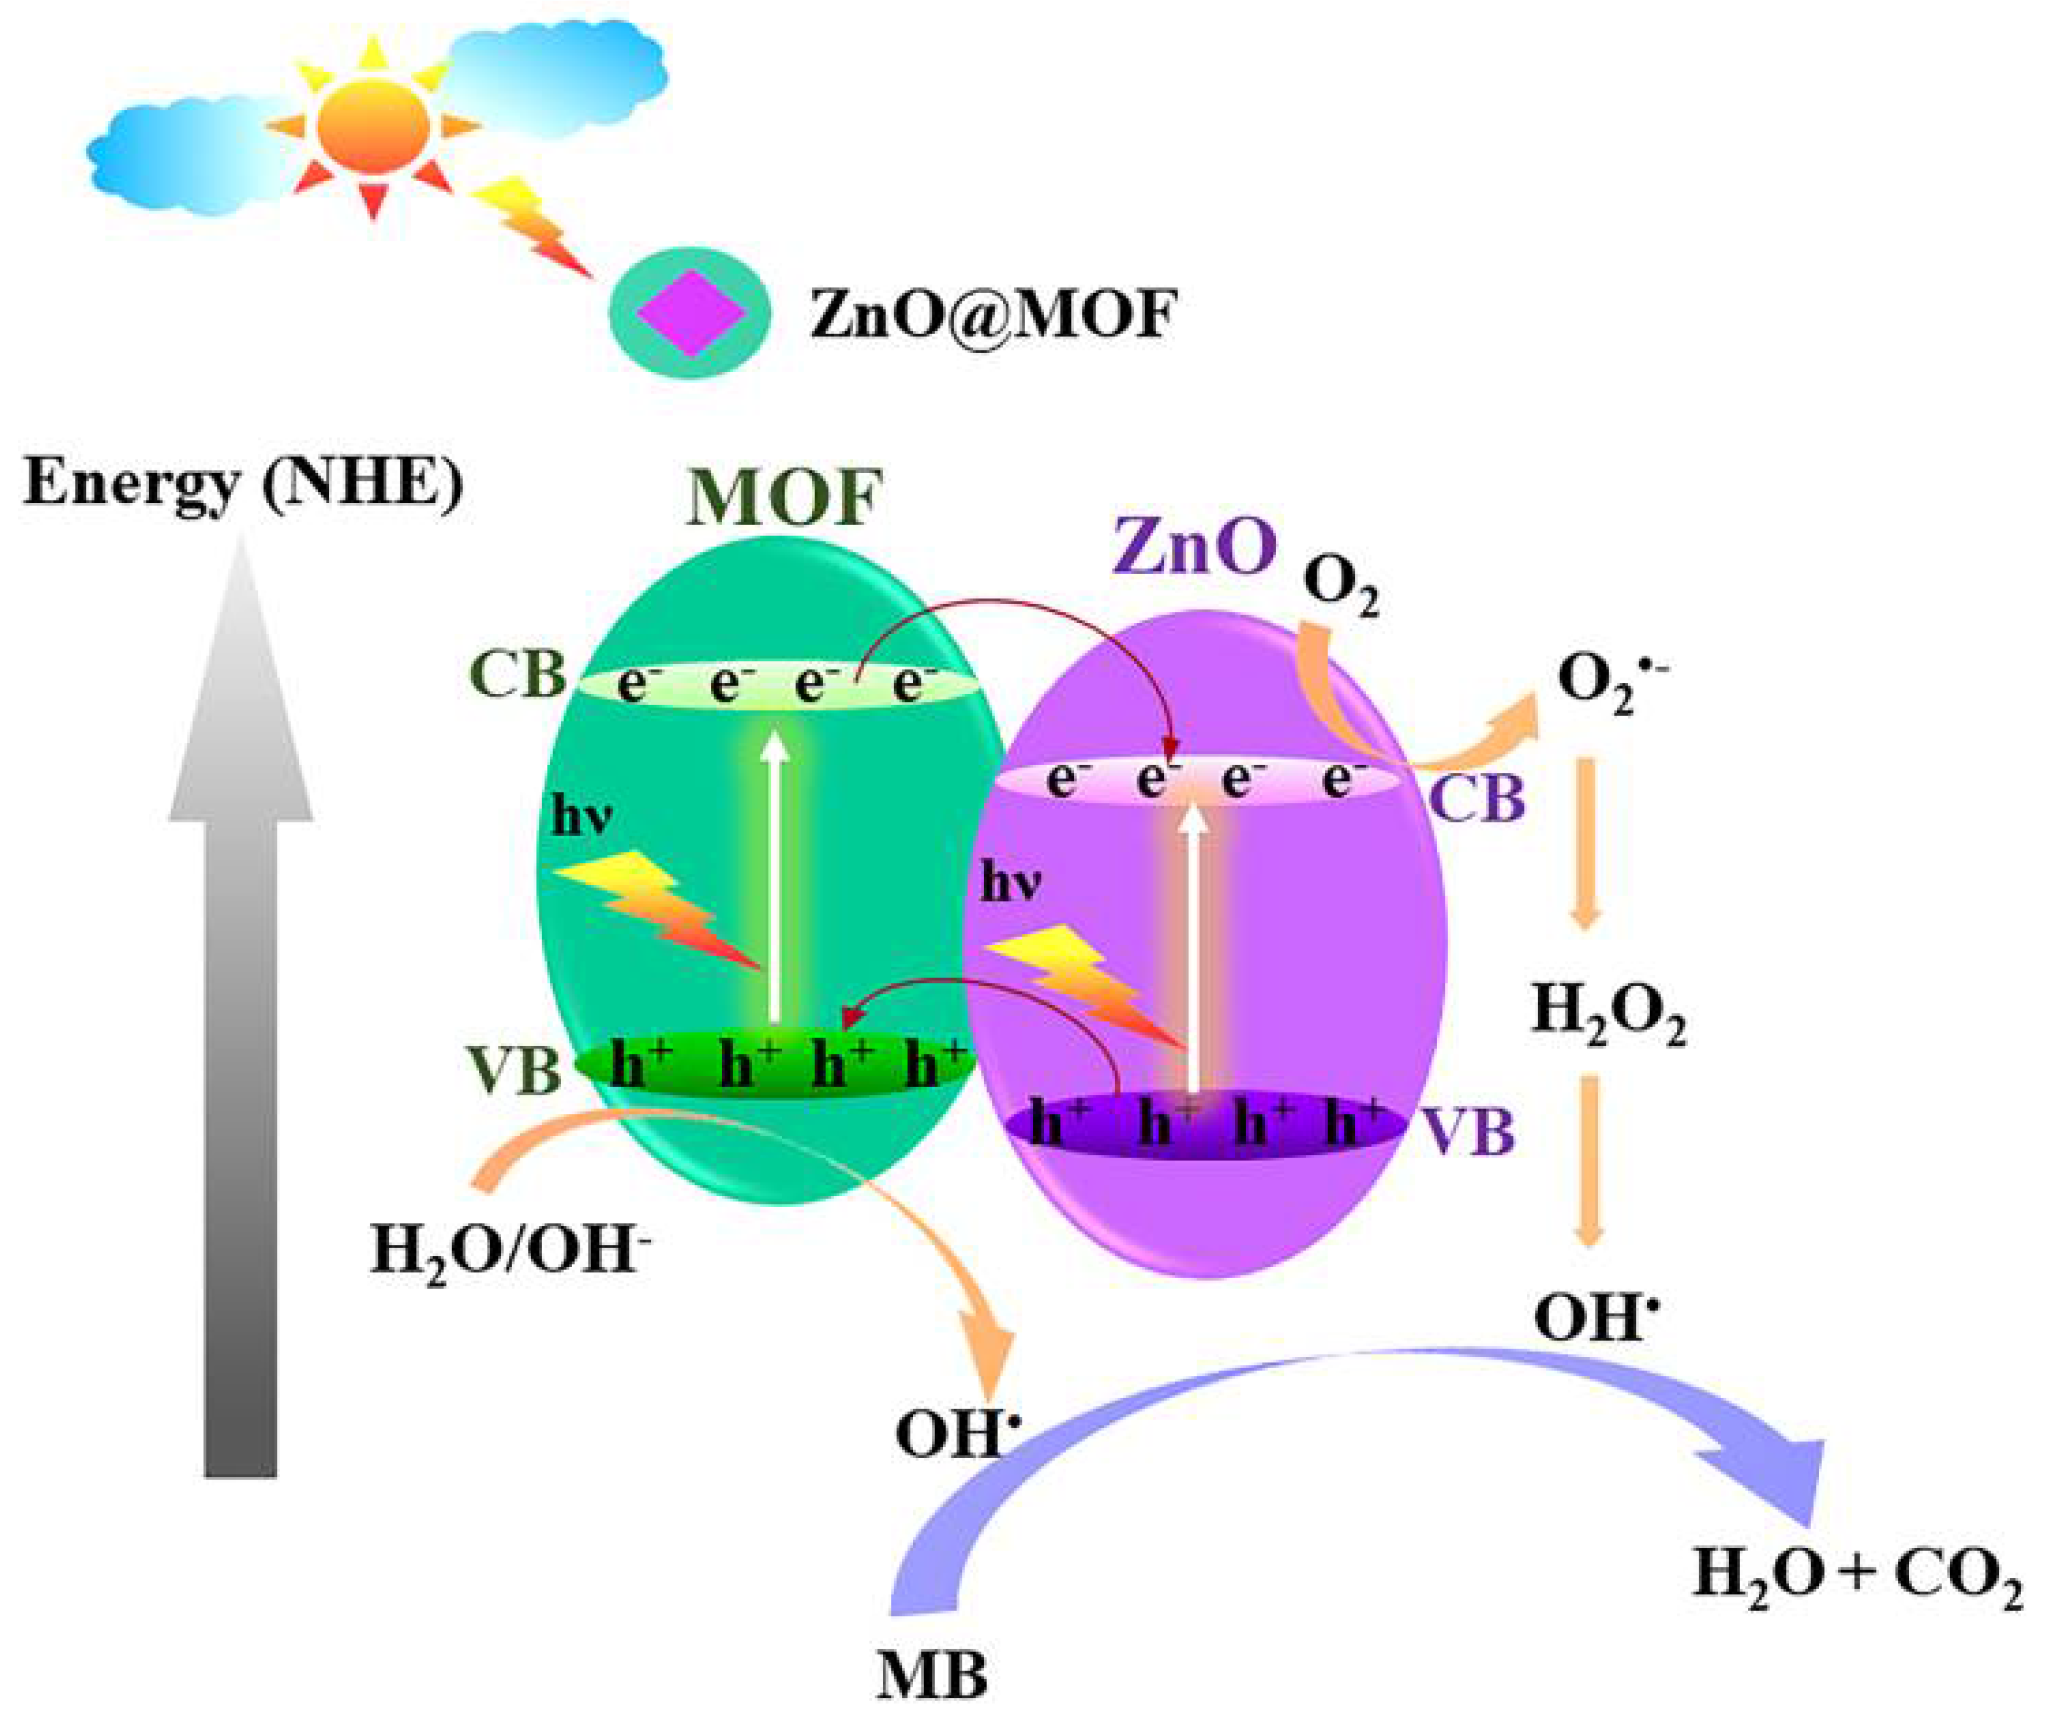
3.4. Photocatalytic Activity of Prepared ZnO and ZnO@MOF-46(Zn)-DW

The photocatalytic activities of the three morphologies of ZnO were studied by monitoring the photodegradation of methylene blue via UV-Vis spectroscopy. To investigate the proper time for reaching adsorption-desorption equilibrium, ZnO(3) was used as a substitute for all prepared ZnO to treat MB aqueous solutions (5 ppm) in the dark for 30, 45, 60, and 75 min. The result in Figure S4 shows that adsorption-desorption equilibrium was reached after 30 min. To verify the equilibrium of the system, the photocatalysts were treated without UV irradiation for 60 min before measuring the photodegradation process. As shown in Figure 16 and Table 1, the photodegradation efficiency of three ZnO samples was examined after UV light irradiation every 30 min for 3 h in three trials. The results show that the efficiency of ZnO photocatalysts with different ZnO cube, cuboctahedron, and octahedron morphologies are 72.70%, 82.38%, and 85.79%, respectively. The octahedral shape of ZnO presents the highest efficiency in dye photodegradation. The BET surface areas and pore volume of the synthesized ZnO were measured, as shown in Table 2.
Cubic ZnO presents a larger BET surface area and pore volume than cuboctahedral and octahedral ZnO. The photocatalytic efficiency is not related to the surface area but depends on the morphology. The different morphologies could affect the exposed surfaces. From the result of synthesized ZnO, cubic ZnO(1) consists of only the exposed {100} facet, cuboctahedral ZnO(2) presents both the exposed facets {100} and {111}, and octahedral ZnO(3) reveals only the exposed {100} facet. From Figure S1, the {111} plane drags through an array of Zn and O atoms, resulting in increased exposure of ZnO on its surface. This {111} plane can be called the active site. It is possible that the octahedral ZnO(3) that occupied only {111} facets could be exposed more to the reaction medium. Therefore, octahedral ZnO(3) exhibits a higher photocatalytic efficiency than the other ZnO morphologies.
Another explanation that describes the photodegradation efficiency is the optical properties. All the synthesized ZnO show UV-visible spectra in the UV region (Figure 17a), which are related to the energy for the transition of electrons. Octahedral ZnO shows the largest absorption intensity, but it is slightly more intense than that of cubic ZnO. In addition, UV-visible spectra measurements were used to determine the band gap energy of ZnO (Figure 17b) by the Kubelka–Munk method [32] as follows.
(αhν)2 = K (hν − Eg)
where hν is the photon energy (eV), K is a constant related to the material, α is the absorption coefficient, and Eg is the band gap energy (eV). The band gaps of cubic ZnO(1), cuboctahedral ZnO(2), and octahedral ZnO(3) are 3.28, 3.15, and 3.11 eV, respectively. Therefore, the morphologies of synthesized ZnO affect the absorption range and band gap energy [22]. Octahedral ZnO reveals the lowest band gap energy, which is related to the highest photocatalytic efficiency.
After completely preparing the ZnO@MOF-46(Zn)-DW composite, it was tested as a photocatalyst in the photodegradation of MB, and its efficiency was compared to that of the prepared ZnO by using the same weight (70 mg). Figure 16 and Figure S5 reveal dye photodegradation at various times. In the results, the photodegradation of ZnO@MOF-46(Zn)-DW shows better efficiency than that of prepared ZnO. A photograph of degraded MB solutions with the elapsed time of the ZnO@MOF-46(Zn)-DW photocatalysis also shown in Figure S5.
The evidence shows that ZnO@MOF-46(Zn)-DW exhibits better photocatalytic efficiency than ZnO within 60 min, and the optical and fluorescent properties were determined. Solid-state UV-vis spectroscopy was used to analyze the absorption properties of the samples. Figure 18 displays the absorption spectra of ZnO@MOF-46(Zn)-DW compared with those of ZnO and MOF-46(Zn), which resulted in a wider UV-visible range and enhanced intensity in the composite. In this study, not only does the coexistence of ZnO and MOF-46(Zn) provide extensive absorption regions, but it also leads to more absorption ability.
Furthermore, the photoluminescence (PL) property of the synthesized ZnO@MOF-46(Zn)-DW was examined and related to that of MOF-46(Zn) in solid-state mode. The emission spectra in Figure 19 show the emissive position (λem) at 429 nm for MOF-46(Zn), which is near that of ZnO@MOF-46(Zn)-DW at 433 nm when excited at 385 nm. The heterostructured material exhibits a hypochromic shift and quenching intensity compared with bare MOF-46(Zn). It could be indirectly consumed by the photoelectron transfer (PET) process between ZnO and MOF-46(Zn). When ZnO@MOF-46(Zn)-DW was excited at 385 nm, electrons (e) in MOF-46 were also excited and jumped to the LUMO of MOF-46(Zn). Subsequently, e can transfer to the conduction band (CB) of ZnO, resulting in a lower intensity in ZnO@MOF-46(Zn)-DW than in bare MOF-46(Zn).
The result from the photoluminescence (PL) studies mimicked the diagram shown in Figure 20, which could explain why the ZnO@MOF-46(Zn)-DW heterostructure exhibited higher photocatalytic efficiency. Usually, MOFs can absorb energy in visible light, resulting in a larger absorption energy range. Moreover, covering the ZnO surface with the MOF may reduce the recombination process between e and holes (h+), providing a more efficient photocatalytic process than pure ZnO. In the diagram, during UV irradiation, both the electrons of ZnO and MOF are excited from the valence band (VB) to their conduction band (CB) to obtain h+ at the VB. The e of the MOF in the CB can evacuate to the CB of ZnO and react with O2 in the atmosphere to create oxygen superoxide species and further convert to hydroxyl radicals (OH) entering the degradation process. Meanwhile, h+ also appeared in the VB of the MOF and reacted with water (H2O) or hydroxide anions (OH) on the surface of the MOF to introduce OH into the degradation process.
To determine the role of specific active species in the photocatalytic process, a control experiment was performed by adding 0.1 M isopropanol, which acted as a chemical selective radical scavenger for hydroxyl radicals in the MB solution. The result is shown in Figure S6, which shows that the photocatalytic activity of ZnO@MOF-46(Zn)-DW is significantly decreased in the control experiment. This indicated that OH is the key specific active radical for the photocatalytic degradation of MB.
Ion chromatography analysis was used to determine the concentrations of inorganic products, ammonium, sulfate, and nitrate ions ( NH 4 + , SO 4 2 , and NO 3 , respectively) obtained during MB photodegradation for a radiation time of 600 min (10 h). NH 4 + and SO 4 2 ions are obtained in the first hour of the process, while NO 3 ions are detected after more than six hours of photodegradation. This reveals the evolution of MB photodegradation because the concentration of these ions increases with increasing time [33] as shown in Figure S7.
To investigate the stability of the ZnO@MOF-46(Zn)-DW photocatalyst, the recycling procedure was performed five times by performing the photodegradation of MB and regenerating the photocatalyst with ethanol through centrifugation and drying at 75 °C before the next cycle under the same conditions (Figure S8a). The results show that the photocatalyst can be readily regenerated with a negligible intensity change after recycling five times. After the final test, ZnO@MOF-46(Zn)-DW was subjected to XRD and SEM analysis for structural and shape evaluations (Figure S8b,c). The XRD pattern of ZnO@MOF-46(Zn) after the degradation process exhibited both the MOF-46(Zn)-H2O and ZnO phases but not the MOF-46(Zn) phase. MOF-46(Zn) can easily transform to MOF-46(Zn)-H2O in aqueous systems. These results demonstrate that ZnO@MOF-46(Zn)-DW can serve as the greatest photocatalyst in the photodegradation of MB and possesses recyclable properties.

4. Conclusions

To date, many new ZnO-based photocatalysts have been synthesized. This work has demonstrated that the morphology of ZnO affects the photocatalytic efficiency performance. The octahedral ZnO shows better efficiency than the others, with 85.79% within 180 min, because it possesses more active sites and low band gap energy. The synergistic effect on the MB photodegradation of the ZnO@MOF-46(Zn) composite was determined. A simple low-cost method was shown for preparing ZnO@MOF-46(Zn). Octahedral ZnO (higher provided phase of MOF-46(Zn) than the others) acts as a Zn2+ source combined with 2-ATP as a ligand. The effects of sonication and reaction times were found to be essential factors for the complete synthesis of ZnO@MOF-46(Zn)-DW. Meanwhile, the appearance of an unknown phase in the products was also investigated and identified as MOF-46(Zn)-H2O. MOF-46(Zn) is an aqua ligand instead of a DMF ligand. ZnO@MOF-46(Zn)-DW was further used as a photocatalyst to degrade MB and compared with pure ZnO. Photocatalysis of the heterostructure exhibits higher efficiency within 60 min with 61.20% (90.09% within 180 min). The coexistence of ZnO and MOF can reduce the energy band gap, prevent the recombination process of electrons and holes, enhance the light absorption capacity from UV to visible regions, and increase the adsorption of dye due to the outstanding properties of both components, resulting in better photocatalytic efficiency. These results confirm that the synergistic effect of ZnO and MOF-46(Zn) that make ZnO@MOF-46(Zn)-DW a good photocatalyst in MB degradation.

Supplementary Materials

The following are available online at https://www.mdpi.com/article/10.3390/cryst11111379/s1: Figure S1: View of {111} plane of hexagonal ZnO; Figures S2 and S3: XRD pattern of related MOF-46(Zn); Figure S4: Adsorption-desorption equilibrium experiment; Figure S5: Photograph of degraded MB solutions; Figure S6: Photocatalytic degradation of MB during present and absent isopropanol as OH scavenger; Figure S7: Concentration of anions during the photocatalytic degradation of MB; Figure S8: Photodegradation efficiency after recycling five times, comparison of the XRD patterns before and after five recycling tests and SEM image of the photocatalyst after five cycles.

Author Contributions

Project design, validation, resources, supervision, writing—review and editing, project administration, T.D.; formal analysis, data curation, investigation, visualization, writing—original draft, J.B.; formal analysis, P.S.; validation, writing—review and editing, R.R. All authors have read and agreed to the published version of the manuscript.

Funding

The authors would like to thank Kasetsart University Research and Development Institute (KURDI) and the Center of Excellence for Innovation in Chemistry (PERCH-CIC), the Ministry of Higher Education, Science, Research and Innovation.

Institutional Review Board Statement

Not applicable.

Informed Consent Statement

Not applicable.

Data Availability Statement

Not applicable.

Acknowledgments

This work was supported by the Science Achievement Scholarship of Thailand (SAST), Center of Excellence for Innovation in Chemistry (PERCH-CIC), Kasetsart University Research and Development Institute (KURDI) and Department of Chemistry, Faculty of Science, Kasetsart University. Moreover, we would also like to thank Nichakorn Gajajiva, an application chemist, and Atiti Liawwongputorn, a product specialist from Metrohm Siam Co., Ltd., for their support with ion chromatography (IC).

Conflicts of Interest

The authors declare no conflict of interest.

References

  1. Nunes, D.; Pimentel, A.; Branquinho, R.; Fortunato, E.; Martins, R. Metal oxide-based photocatalytic paper: A green alternative for environmental remediation. Catalysts 2021, 11, 504. [Google Scholar] [CrossRef]
  2. Danish, M.S.S.; Estrella, L.L.; Alemaida, I.M.A.; Lisin, A.; Moiseev, N.; Ahmadi, M.; Nazari, M.; Wali, M.; Zaheb, H.; Senjyu, T. Photocatalytic applications of metal oxides for sustainable environmental remediation. Metals 2020, 11, 80. [Google Scholar] [CrossRef]
  3. Ahuja, P.; Ujjain, S.K.; Kanojia, R.; Attri, P. Transition metal oxides and their composites for photocatalytic dye degradation. J. Compos. Sci. 2021, 5, 82. [Google Scholar] [CrossRef]
  4. Dong, S.; Cui, L.; Tian, Y.; Xia, L.; Wu, Y.; Yu, J.; Bagley, D.M.; Sun, J.; Fan, M. A novel and high-performance double Z-scheme photocatalyst ZnO-SnO2-Zn2SnO4 for effective removal of the biological toxicity of antibiotics. J. Hazard. Mater. 2020, 399, 123017. [Google Scholar] [CrossRef]
  5. Alexandrov, A.; Zvaigzne, M.; Lypenko, D.; Nabiev, I.; Samokhvalov, P. Al-, Ga-, Mg-, or Li-doped zinc oxide nanoparticles as electron transport layers for quantum dot light-emitting diodes. Sci. Rep. 2020, 10, 7496. [Google Scholar] [CrossRef] [PubMed]
  6. Otieno, F.; Airo, M.; Erasmus, R.M.; Quandt, A.; Billing, D.G.; Wamwangi, D. Annealing effect on the structural and optical behavior of ZnO:Eu3+ thin film grown using RF magnetron sputtering technique and application to dye sensitized solar cells. Sci. Rep. 2020, 10, 8557. [Google Scholar] [CrossRef]
  7. Dey, S.; Nag, S.; Santra, S.; Ray, S.K.; Guha, P.K. Voltage-controlled NiO/ZnO p–n heterojunction diode: A new approach towards selective VOC sensing. Microsyst. Nanoeng. 2020, 6, 35. [Google Scholar] [CrossRef] [PubMed]
  8. Shen, X.; Shi, Y.; Shao, H.; Liu, Y.; Zhai, Y. Synthesis and photocatalytic degradation ability evaluation for rhodamine B of ZnO@SiO2 composite with flower-like structure. Water Sci. Technol. 2020, 80, 1986–1995. [Google Scholar] [CrossRef] [PubMed]
  9. Cerrato, E.; Paganini, M.C.; Giamello, E. Photoactivity under visible light of defective ZnO investigated by EPR spectroscopy and photoluminescence. J. Photochem. Photobiol. 2020, A397, 112531. [Google Scholar] [CrossRef]
  10. Zhang, L.; Jiang, Y.; Ding, Y.; Povey, M.; York, D. Investigation into the antibacterial behaviour of suspensions of ZnO nanoparticles (ZnO nanofluids). J. Nanopart. Res. 2007, 9, 479–489. [Google Scholar] [CrossRef]
  11. Sun, Y.; Seo, J.H.; Takacs, C.J.; Seifter, J.; Heeger, A.J. Inverted Polymer Solar Cells Integrated with a Low-Temperature-Annealed Sol-Gel-Derived ZnO Film as an Electron Transport Layer. Adv. Mater. 2011, 23, 1679–1683. [Google Scholar] [CrossRef] [PubMed]
  12. Al-Gaashani, R.; Radiman, S.; Daud, A.R.; Tabet, N.; Al-Douri, Y. XPS and optical studies of different morphologies of ZnO nanostructures prepared by microwave methods. Ceram. Int. 2013, 39, 2283–2292. [Google Scholar] [CrossRef]
  13. Manzoor, U.; Siddique, S.; Ahmed, R.; Noreen, Z.; Bokhari, H.; Ahmad, I. Antibacterial, Structural and Optical Characterization of Mechano-Chemically Prepared ZnO Nanoparticles. PLoS ONE 2016, 11, e0154704. [Google Scholar] [CrossRef] [Green Version]
  14. Chang, T.-H.; Lu, Y.-C.; Yang, M.-J.; Huang, J.-W.; Linda Chang, P.-F.; Hsueh, H.-Y. Multibranched flower-like ZnO particles from eco-friendly hydrothermal synthesis as green antimicrobials in agriculture. J. Clean. Prod. 2020, 262, 121342. [Google Scholar] [CrossRef]
  15. Buasakun, J.; Srilaoong, P.; Chaloeipote, G.; Rattanakram, R.; Wongchoosuk, C.; Duangthongyou, T. Synergistic effect of ZnO/ZIF8 heterostructure material in photodegradation of methylene blue and volatile organic compounds with sensor operating at room temperature. J. Solid State Chem. 2020, 289, 121494. [Google Scholar] [CrossRef]
  16. Jais, J. Synthesis of ZnO Nanostructures and their Photocatalytic Activity. J. Appl. Ind. Math. 2013, 1, 32–35. [Google Scholar]
  17. Brillas, E.; Serrà, A.; Garcia-Segura, S. Biomimicry designs for photoelectrochemical systems: Strategies to improve light delivery efficiency. Curr. Opin. Electrochem. 2021, 26, 100660. [Google Scholar] [CrossRef]
  18. Reddy, I.N.; Reddy, C.V.; Shim, J.; Akkinepally, B.; Cho, M.; Yoo, K.; Kim, D. Excellent visible-light driven photocatalyst of (Al, Ni) co-doped ZnO structures for organic dye degradation. Catal. Today 2020, 340, 277–285. [Google Scholar] [CrossRef]
  19. Nguyen, D.T.; Tran, M.D.; Van Hoang, T.; Trinh, D.T.; Pham, D.T.; Nguyen, D.L. Experimental and numerical study on photocatalytic activity of the ZnO nanorods/CuO composite film. Sci. Rep. 2020, 10, 7792. [Google Scholar] [CrossRef]
  20. Sanchez, C.; Arribart, H.; Giraud Guille, M.M. Biomimetism and bioinspiration as tools for the design of innovative materials and systems. Nat. Mater. 2005, 4, 277–288. [Google Scholar] [CrossRef]
  21. Serrà, A.; Artal, R.; García-Amorós, J.; Sepúlveda, B.; Gómez, E.; Nogués, J.; Philippe, L. Hybrid Ni@ZnO@ZnS-Microalgae for Circular Economy: A Smart Route to the Efficient Integration of Solar Photocatalytic Water Decontamination and Bioethanol Production. Adv. Sci. 2020, 7, 1902447. [Google Scholar] [CrossRef] [PubMed]
  22. Yang, X.; Yian, J.; Guo, Y.; Teng, M.; Liu, H.; Li, T.; Lv, P.; Wang, X. ZnO nano-rod arrays synthesized with exposed {0001} facets and the investigation of photocatalytic activity. Crystals 2021, 11, 522. [Google Scholar] [CrossRef]
  23. Buasakun, J.; Srilaoong, P.; Chainok, K.; Raksakoon, C.; Rattanakram, R.; Duangthongyou, T. Novel zinc(II) coordination polymers (CPs) based on flexible aliphatic carboxylic acids and an N-donor ligand for fluorescence sensors. Inorg. Chim. Acta 2020, 511, 119839. [Google Scholar] [CrossRef]
  24. Li, Y.; Wen, G. Advances in Metal-Organic Frameworks for Acetylene Storage. Eur. J. Inorg. Chem. 2020, 2020, 2303–2311. [Google Scholar] [CrossRef]
  25. Chen, S.; Li, Y.; Mi, L. Porous carbon derived from metal organic framework for gas storage and separation: The size effect. Inorg. Chem. Commun. 2020, 118, 107999. [Google Scholar] [CrossRef]
  26. Uthappa, U.T.; Sriram, G.; Arvind, O.R.; Kumar, S.; Ho Young, J.; Neelgund, G.M.; Losic, D.; Kurkuri, M.D. Engineering MIL-100(Fe) on 3D porous natural diatoms as a versatile high performing platform for controlled isoniazid drug release, Fenton’s catalysis for malachite green dye degradation and environmental adsorbents for Pb2+ removal and dyes. Appl. Surf. Sci. 2020, 528, 146974. [Google Scholar] [CrossRef]
  27. Zhang, Z.; Xiao, Y.; Lei, Y.; Tang, J.; Qiao, X. Catalytic hydrolysis of β-lactam antibiotics via MOF-derived MgO nanoparticles embedded on nanocast silica. Sci. Total Environ. 2020, 738, 139742. [Google Scholar] [CrossRef]
  28. Yang, T.; Yu, D.; Wang, D.; Yang, T.; Li, Z.; Wu, M.; Petru, M.; Crittenden, J. Accelerating Fe(III)/Fe(II) cycle via Fe(II) substitution for enhancing Fenton-like performance of Fe-MOFs. Appl. Catal. B Environ. 2021, 286, 119859. [Google Scholar] [CrossRef]
  29. Yu, D.; Wang, L.; Yang, T.; Yang, G.; Wang, D.; Ni, H.; Wu, M. Tuning Lewis acidity of iron-based metal-organic frameworks for enhanced catalytic ozonation. Chem. Eng. J. 2021, 404, 127075. [Google Scholar] [CrossRef]
  30. Braun, M.E.; Steffek, C.D.; Kim, J.; Rasmussen, P.G.; Yaghi, O.M. 1,4-Benzenedicarboxylate derivatives as links in the design of paddle-wheel units and metal–organic frameworks. Chem. Commun. 2001, 2532–2533. [Google Scholar] [CrossRef]
  31. Yang, J.-M.; Liu, Q.; Kang, Y.-S.; Sun, W.-Y. Controlled growth and gas sorption properties of IRMOF-3 nano/microcrystals. Dalton Trans. 2014, 43, 16707–16712. [Google Scholar] [CrossRef] [PubMed]
  32. Da Trinda, L.G.; Borba, K.M.N.; Trench, A.B.; Zanchet, L.; Teodoro, V.; Pontes, F.M.L.; Longo, E.; Mazzo, T.M. Effective strategy to coupling Zr-MOF/ZnO: Synthesis, morphology and photoelectrochemical properties evaluation. J. Solid State Chem. 2021, 293, 121794. [Google Scholar] [CrossRef]
  33. Tibodee, A.; Pannak, P.; Akkarachaneeyakorn, K.; Thaweechai, T.; Sirisaksoontorn, W. Use of the graphite intercalation compound to produce low-defect graphene sheets for the photocatalytic enhancement of graphene/TiO2 composites. Mater. Chem. Phys. 2019, 235, 121755. [Google Scholar] [CrossRef]
Scheme 1. Overall reactions to prepare ZnO and ZnO@MOF-46(Zn).
Crystals 11 01379 sch001
Figure 1. XRD patterns of all the synthesized IRMOF-3 samples and the simulated pattern for comparison.
Crystals 11 01379 g001
Figure 2. XRD patterns of the prepared ZnO that transformed from IRMOF-3 (cube, cuboctahedron, and octahedron shapes) compared with that of wurtzite ZnO (JCPDS 36-1451).
Crystals 11 01379 g002
Figure 3. SEM images of IRMOF-3 with various amounts of CTAB at 0 mg (a), 80 mg (b), and 150 mg (c) and illustration of the shape evolution of the crystals: the yellow facets represent {100}, while the violet facets represent {111} (d).
Crystals 11 01379 g003
Figure 4. SEM images of prepared ZnO obtained from the various morphologies of IRMOF-3: cube (a), cuboctahedron (b), and octahedron (c).
Crystals 11 01379 g004
Figure 5. XRD patterns of ZnO@MOF-46(Zn) products from all prepared ZnO.
Crystals 11 01379 g005
Figure 6. SEM images of ZnO@MOF-46(Zn) using ZnO(1) (cube) (a), ZnO(2) (cuboctahedron) (b), and ZnO(3) (octahedron) (c) as the precursor.
Crystals 11 01379 g006
Figure 7. XRD patterns of ZnO@MOF-46(Zn) sonicated for 10, 20, and 30 min.
Crystals 11 01379 g007
Figure 8. SEM images of ZnO@MOF-46(Zn) sonicated for 10 (a), 20 (b), and 30 min (c).
Crystals 11 01379 g008
Figure 9. XRD patterns of ZnO@MOF-46(Zn) left at room temperature for 6, 24, and 48 h.
Crystals 11 01379 g009
Figure 10. SEM images of ZnO@MOF-46(Zn) products after incubation at room temperature for 6 (a), 24 (b), and 48 h (c).
Crystals 11 01379 g010
Figure 11. TEM image (a), HR-TEM images (bd), and SAED image (inset) of ZnO@MOF-46(Zn) sonicated for 30 min and left at room temperature for 48 h.
Crystals 11 01379 g011
Figure 12. XRD patterns of synthesized MOF-46(Zn) and simulated MOF-46(Zn).
Crystals 11 01379 g012
Figure 13. TGA curves of MOF-46(Zn) and MOF-46(Zn)-H2O.
Crystals 11 01379 g013
Figure 14. FTIR spectra of synthesized ZnO@MOF-46(Zn)-DW relative to the FT-IR spectrum of pure MOF-46(Zn) and ZnO.
Crystals 11 01379 g014
Figure 15. TGA curve of synthesized ZnO@MOF-46(Zn)-DW sonicated for 30 min and left at room temperature for 48 h.
Crystals 11 01379 g015
Figure 16. Relative methylene blue concentration change at various time intervals with prepared ZnO as the photocatalyst.
Crystals 11 01379 g016
Figure 17. Spectra and estimated optical absorption band gap of the synthesized ZnO. (a) UV-visible absorption spectra of synthesized ZnO and (b) Kubelka–Munk-transformed reflectance.
Crystals 11 01379 g017
Figure 18. UV-vis absorption spectra of ZnO, MOF-46(Zn), and ZnO@MOF-46(Zn)-DW.
Crystals 11 01379 g018
Figure 19. PL spectra of ZnO@MOF-46(Zn)-DW and bare MOF-46(Zn) excited at 385 nm.
Crystals 11 01379 g019
Figure 20. Photocatalytic mechanism of ZnO@MOF-46(Zn). Proposed reaction mechanism over ZnO@MOF-46(Zn) for photodegradation.
Crystals 11 01379 g020
Table 1. Photocatalytic efficiency of all prepared ZnO and ZnO@MOF-46(Zn)-DW.
@ 3 hMean @ 1 h
Trial 1Trial 2Trial 3MeanSD
ZnO (Cube)66.6474.7076.7872.705.3630.98
ZnO (Cuboctahedron)74.2583.3689.5282.387.6939.35
ZnO (Octahedron)81.8385.3890.1685.794.1842.92
ZnO@MOF-46(Zn)-DW89.5390.2490.5190.090.5161.20
Table 2. BET surface area and pore volume of all samples.
SampleBET Surface Area (m2/g)Pore Volume (cm3/g)
ZnO(1)15.760.114
ZnO(2)19.650.023
ZnO(3)7.110.009
Publisher’s Note: MDPI stays neutral with regard to jurisdictional claims in published maps and institutional affiliations.

