Article

Beading Mechanism and Performance of Porous Steel Slag Microbead Abrasive

College of Metallurgy and Energy, North China University of Science and Technology, Tangshan 063210, China
*
Authors to whom correspondence should be addressed.
Crystals 2021, 11(11), 1377; https://doi.org/10.3390/cryst11111377
Submission received: 5 October 2021 / Revised: 4 November 2021 / Accepted: 8 November 2021 / Published: 12 November 2021
(This article belongs to the Special Issue Metallurgical Slag)

Abstract

:
The use of the gas-quenching process for preparing porous bead slag abrasive was investigated in this paper. An X-ray diffractometer, field emission scanning electron microscope, mercury intrusion porosimetry, and stereo microscope were used to analyze the microbead forming mechanism, pore structure, acid–alkali resistance, and polishing properties of porous steel slag microbead abrasives. Results show that the porous steel slag abrasives present a mono-disperse spherical shape with a hard shell and the porosity is 42.36%. The thermodynamic fractal model indicates that the fractal dimension of the abrasive is 2.226, which shows its simple pore structure. The sample has better chemical stability in the polishing fluid than in water, acid, and alkali solution. Therefore, aluminum and copper alloys are used as substrates for polishing tests. The results indicate that the abrasives could effectively improve the quality of the workpiece surface and the polishing efficiency for aluminum alloy was higher than that for copper alloy.

1. Introduction

Abrasives are divided into natural and artificial abrasives, with generally high hardness, strength, certain toughness and self-sharpening, good high-temperature stability, chemical stability, and uniform particle size. However, natural abrasives must be secondarily processed to achieve the desired performance and artificial abrasives are refined or synthesized by industrial methods, which require high raw material and preparation costs. Therefore, a new generation of composite artificial abrasives with high performance, low cost, and environmentally friendly characteristics have become the development direction and goal.
The annual discharge of steel slags, which are the main solid wastes, is generated by the steel-making process and the utilization rate is only approximately 30% [1,2,3]. Steel slag is mainly comprised of CaO, FeO, SiO2, Al2O3, MgO, and P2O5 [4,5,6]. The existing steel slag treatment processes mainly include the hot splashing method, water quenching method, wind quenching method, rolling cylinder method, and hot disintegration [7,8,9]. Domestic (Chinese) and foreign research findings indicate that steel slags can be used in construction, environmental protection, agriculture, energy, and other fields [10,11,12]. However, steel slags contain 10–35% of Fe and its oxides, which considerably reduces their activity and also restricts their application in cement and concrete [13,14,15,16]. Fine-graining steel slags with a Mohs hardness of 5–7 is difficult due to their large unit weight, high strength, and corrosion resistance [17,18]. Tang O J et al. [19] proposed a processing method of steel slags into abrasives and analyzed their chemical components, hardness, crushing value, and particle distribution. Rao L and Zhong P et al. [20,21,22] studied the physical properties and feasibility of steel slag abrasives and found that the surface smoothness and roughness of the workpiece treated with the steel slag abrasives could satisfy the related requirements.
Reports on steel slag abrasives are available. However, steel slag abrasives have not been widely used because of their uneven particle size and limited quantity. Such limitations are also due to the lack of breakthrough, deep-rooted technical theory, thus restricting the effective adaptation of the structure and performance of steel slag abrasives to the field of grinding and polishing.
Based on the research status of steel slag abrasives, this paper proposes to use gas-quenching technology to break high-temperature liquid steel slag into fine particles. The gas-quenching steel slag abrasives have good chemical stability and particle size uniformity, and we have chosen aluminum alloy and copper alloy as the base materials to study their grinding properties. We expect to provide a theoretical basis for the gas-quenching steel slag abrasives for application to the grinding field.

2. Sample and Experimental Method

2.1. Sample and Experimental Method

The self-made slag gas-quenching experimental device, which mainly included heating, gas-quenching, and cooling processes, was used in this experiment. The steel slag was heated into a high-temperature liquid molten state by the DC electric arc furnace (effective volume: 0.12 m3; Xirui Automation Equipment Company, Tangshan, China). The high-temperature liquid molten slags flowed vertically downward from the outlet of the slag groove (D = 20 mm) and were then crushed into fine particles by the high-pressure nitrogen gas jet with 0.5 MPa. The fine particles reached the hopper after the water-cooling system (GTL8C, Bairun, Cangzhou, China). The technological process is shown in Figure 1.
Polishing experiment: The steel slag abrasives were blended with the polishing fluid (pH = 8) and the abrasive particle was 75~150 µm. Aluminum and copper alloys were taken as the base materials to perform the experiment using the PG-2D polishing machine, which has a disc diameter of 230 mm and a rotation speed of 700 r/min.
Chemical stability: A total of 2 g of the gas-quenching steel slag abrasives with the same particle size were taken and fully mixed with both HCl (pH = 3) and NaOH (pH = 13) solutions according to the volume ratio of 1:5. The mixture was then sealed in a 15 mL glass test tube and taken out after 24, 48, and 72 h of corrosion at an indoor temperature (27 °C).

2.2. Thermodynamics Fractal Model

Zhang B [23] first proposed the thermodynamic model of porous media based on the mercury intrusion method. Researchers found that the mercury inlet of porous substances in the mercury compression experiment is correlated with pore surface energy and introduced a thermodynamics fractal model. The mercury inlets into pores of the porous media, with the increase of pressure during the mercury compression process, resulted in a continuous rise in pore surface energy. The relationship between the mercury inlet and pore surface energy is expressed as follows:
d W = P d V = γ cos θ d S
where W (J) is the work made by the external environment to mercury liquid; P is the mercury inlet pressure (Pa); V is the mercury inlet volume (or the pore volume); γ is the mercury surface tension (J m2); θ is the contact angle of mercury on the pores’ wall (°); and S is the surface area of pores (m2).
The integral of the entire mercury inlet process is calculated as follows:
0 V P d V = 0 S γ cos θ d S
The relationship between the surface area and pore volume of the fractal body given by Mandelbrot [24] is:
S 1 / D ~ V 1 / 3
The fractal scale of the pore surface area in the porous media and the mercury inlet volume are connected, and Equation (2) is rewritten in the following discrete form:
i = 1 n P i Δ V i = K r n 2 ( V n 1 / 3 / r n ) D T
where Pi is the average pressure at the ith mercury inlet (kPa); ΔVi is the mercury inlet at the ith mercury inlet process (cm3 g1); n is the times of pressure intervals in the mercury inlet; rn is the pore radius corresponding to the nth mercury inlet (nm); Vn is the cumulative mercury inlet during n times of pressure intervals (cm3 g1); DT is the number of fractal dimensions on the pore surface; and K is the parameter related to the homogeneity of the porous media, surface tension of the mercury liquid, and contact angle.
W n = i = 1 n P i Δ V i    Q n = V n 1 / 3 / r n
In bringing Equation (5) into Equation (4), the logarithms of the two sides were calculated as follows:
lg ( W n / r n 2 ) = D T lg Q n + C
where C is a constant. The obtained data from the mercury compression experiment revealed that if the pore system of the samples conforms to the thermodynamic pore fractal model, then linear fitting was performed by using lg Qn as the x-axis and lg (Wn rn2) as the longitudinal coordinates. The slope of the corresponding straight line is the fractal dimension (DT).

2.3. Sample Analysis

The phase structures of the sample before and after corrosion were analyzed using an X-ray diffractometer (Brucker D8 Advance, Brucker Corporation, Berlin, Germany, Cu Kα; λ = 0.154178 nm; step size = 0.013°) and both its surface topographies and element distribution before and after the corrosion were observed and analyzed with a field emission scanning electron microscope (SU8020, Hitachi, Tokyo, Japan); samples were metallized before FESEM observations. The pore distribution of the samples was examined by mercury intrusion porosimetry (AutoPore IV 9500, Micromeritics, Norcross, GA, USA). The microtopography of the workpiece was measured using a stereo microscope (Stemi 305, Zeiss Company, Jena, Germany). The microtopography of the workpiece was measured using a 3D profilometer (Contour GT-X, Brooke Company, Werther, Germany).

3. Results and Discussion

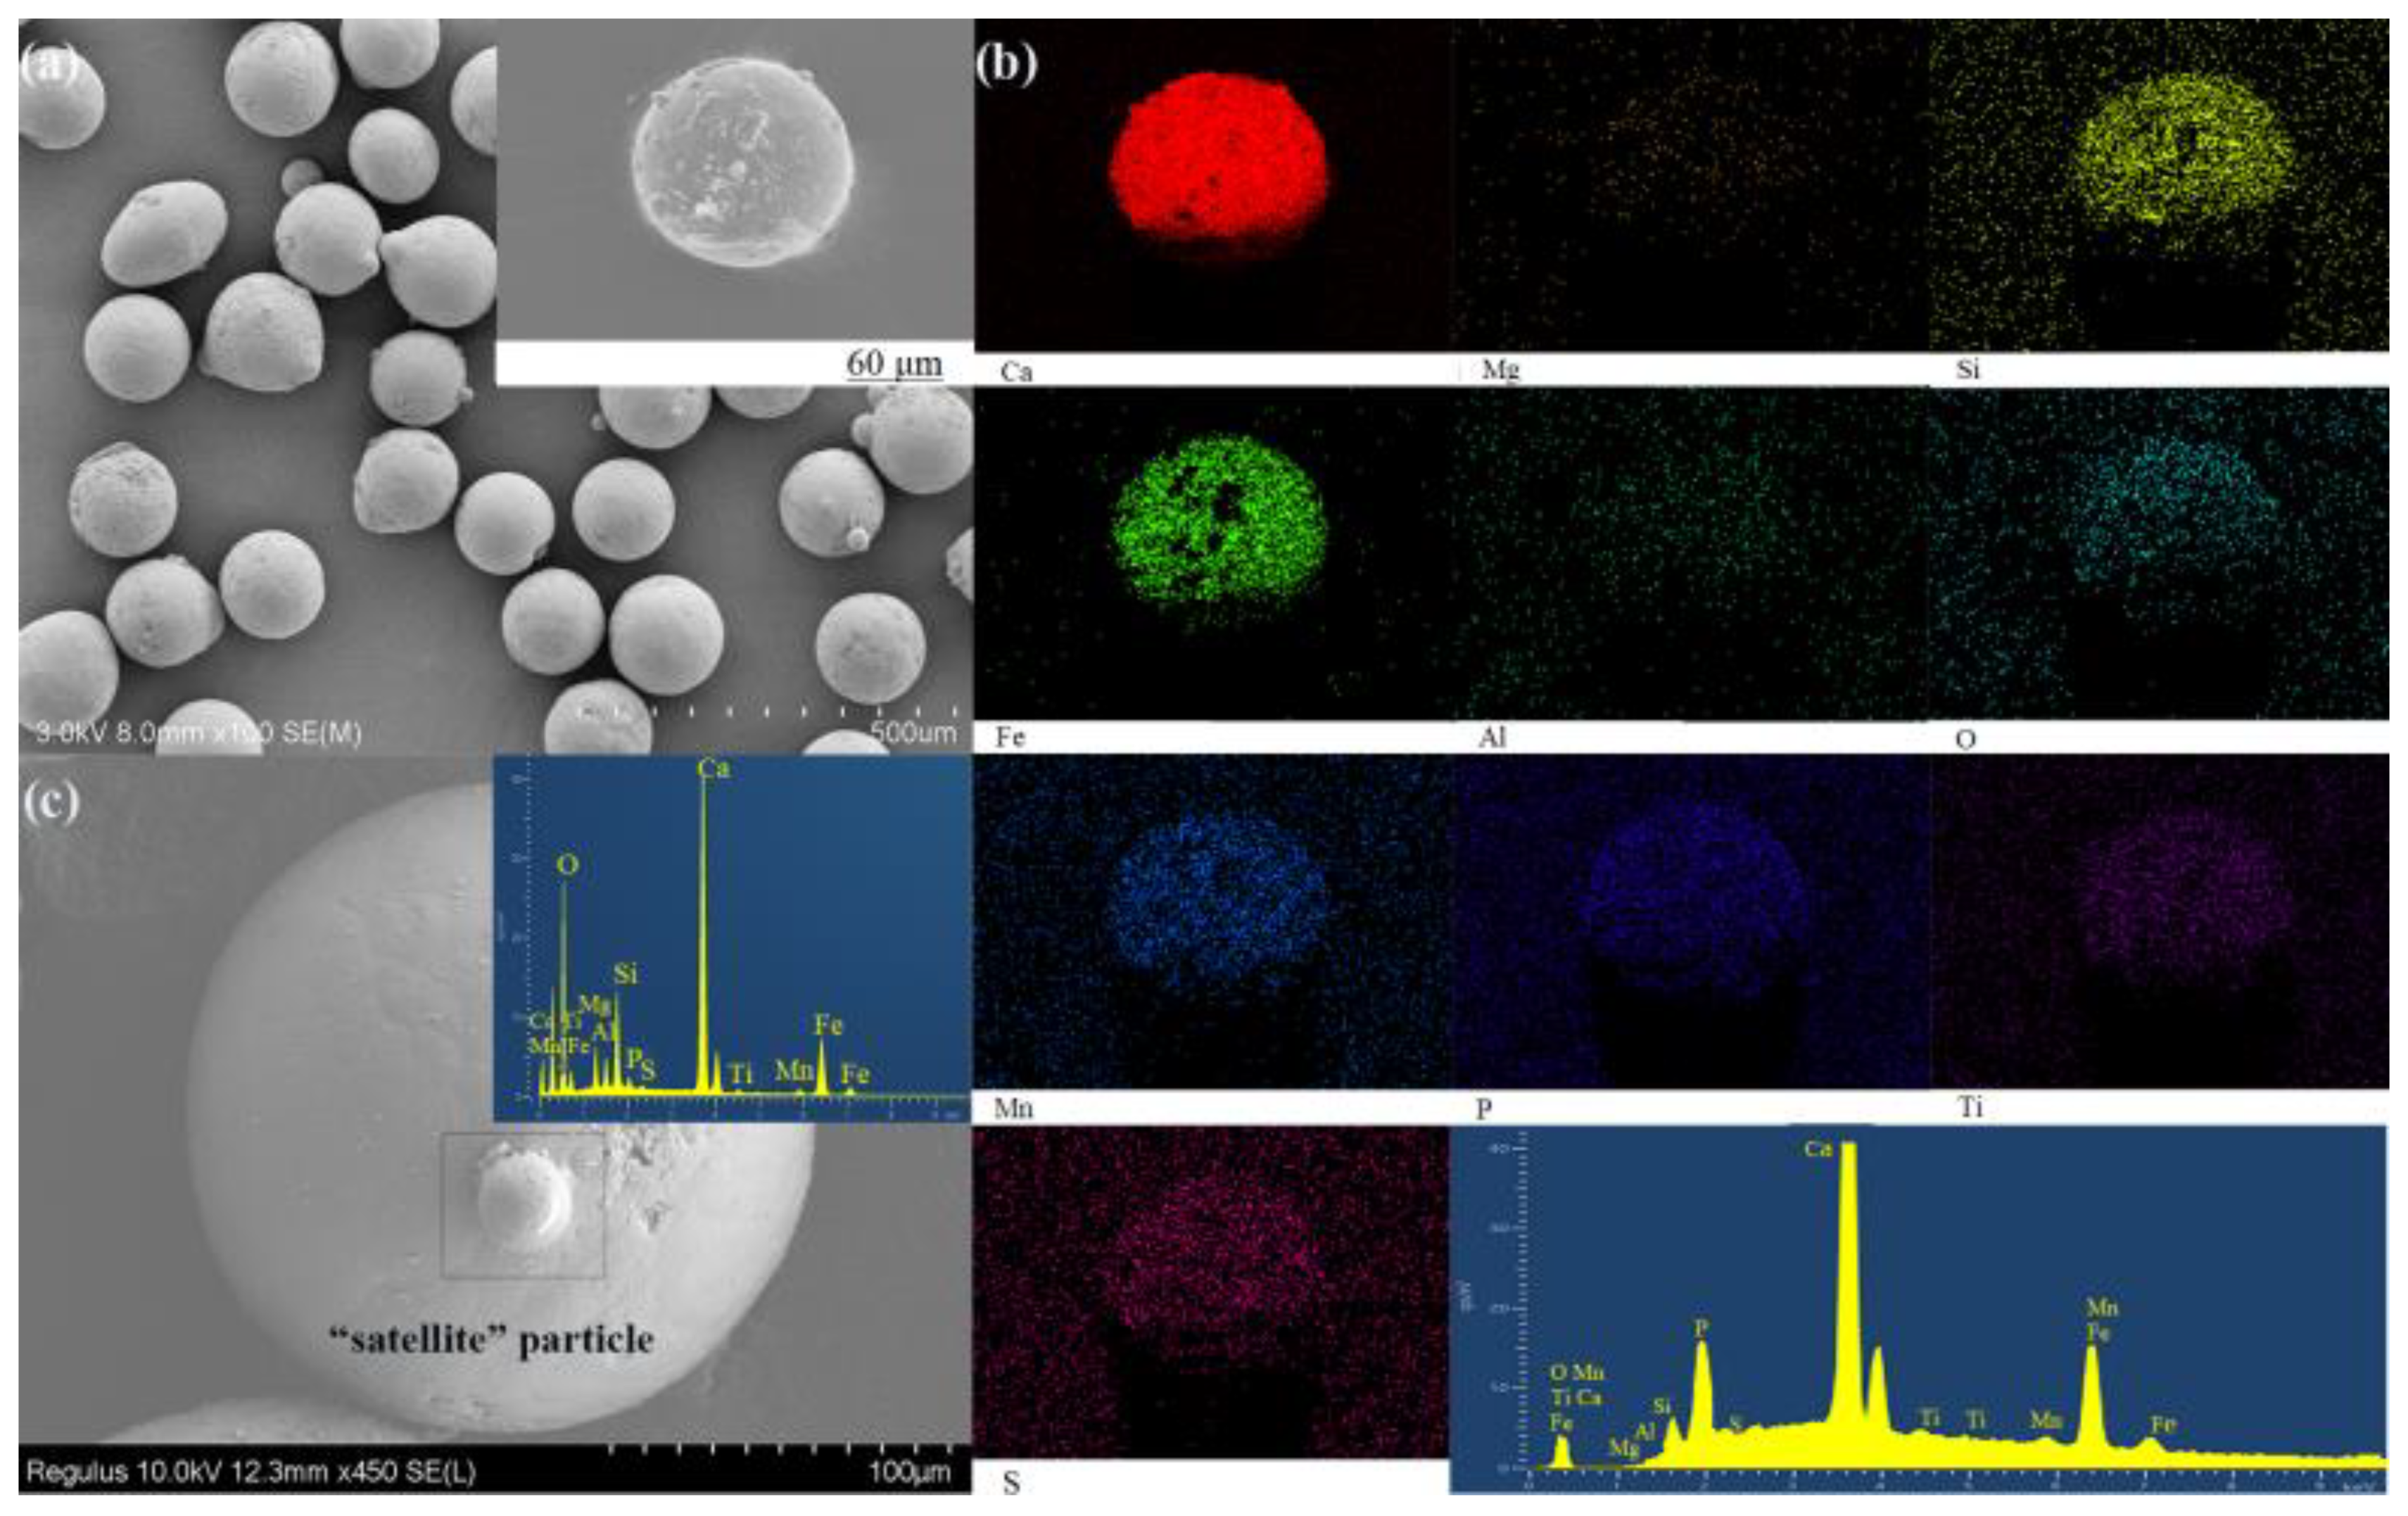
3.1. Microstructure and EDS

Figure 2 shows the SEM images and EDS of gas-quenched steel slags. Figure 2a,b reveal that sample particles are regular spheres and include multiple calcium (Ca), iron (Fe), silicon (Si), aluminium (Al), and oxygen (O) elements in quenched steel slags. Figure 2c shows that some large particles are surrounded by small particles and are connected into “satellite” particles. Moreover, the EDS results demonstrate that the element composition of “satellite” particles is consistent with that of the base, indicating the absence of impurities in the samples. Particles of different sizes and states mutually impact the flying process under the driving force of airflow, gravity, and flying speed during the gas-quenching process. Satellite particles have a small size and a high freezing speed. Thus, these particles will be splashed under the effect of high-pressure airflows, while large particles are only partially solidified. Therefore, the splashed satellite particles will impact large-sized powder to bond the “satellite” and large particles. All abrasives have a similar composition and maintain uniform spheres [25,26].

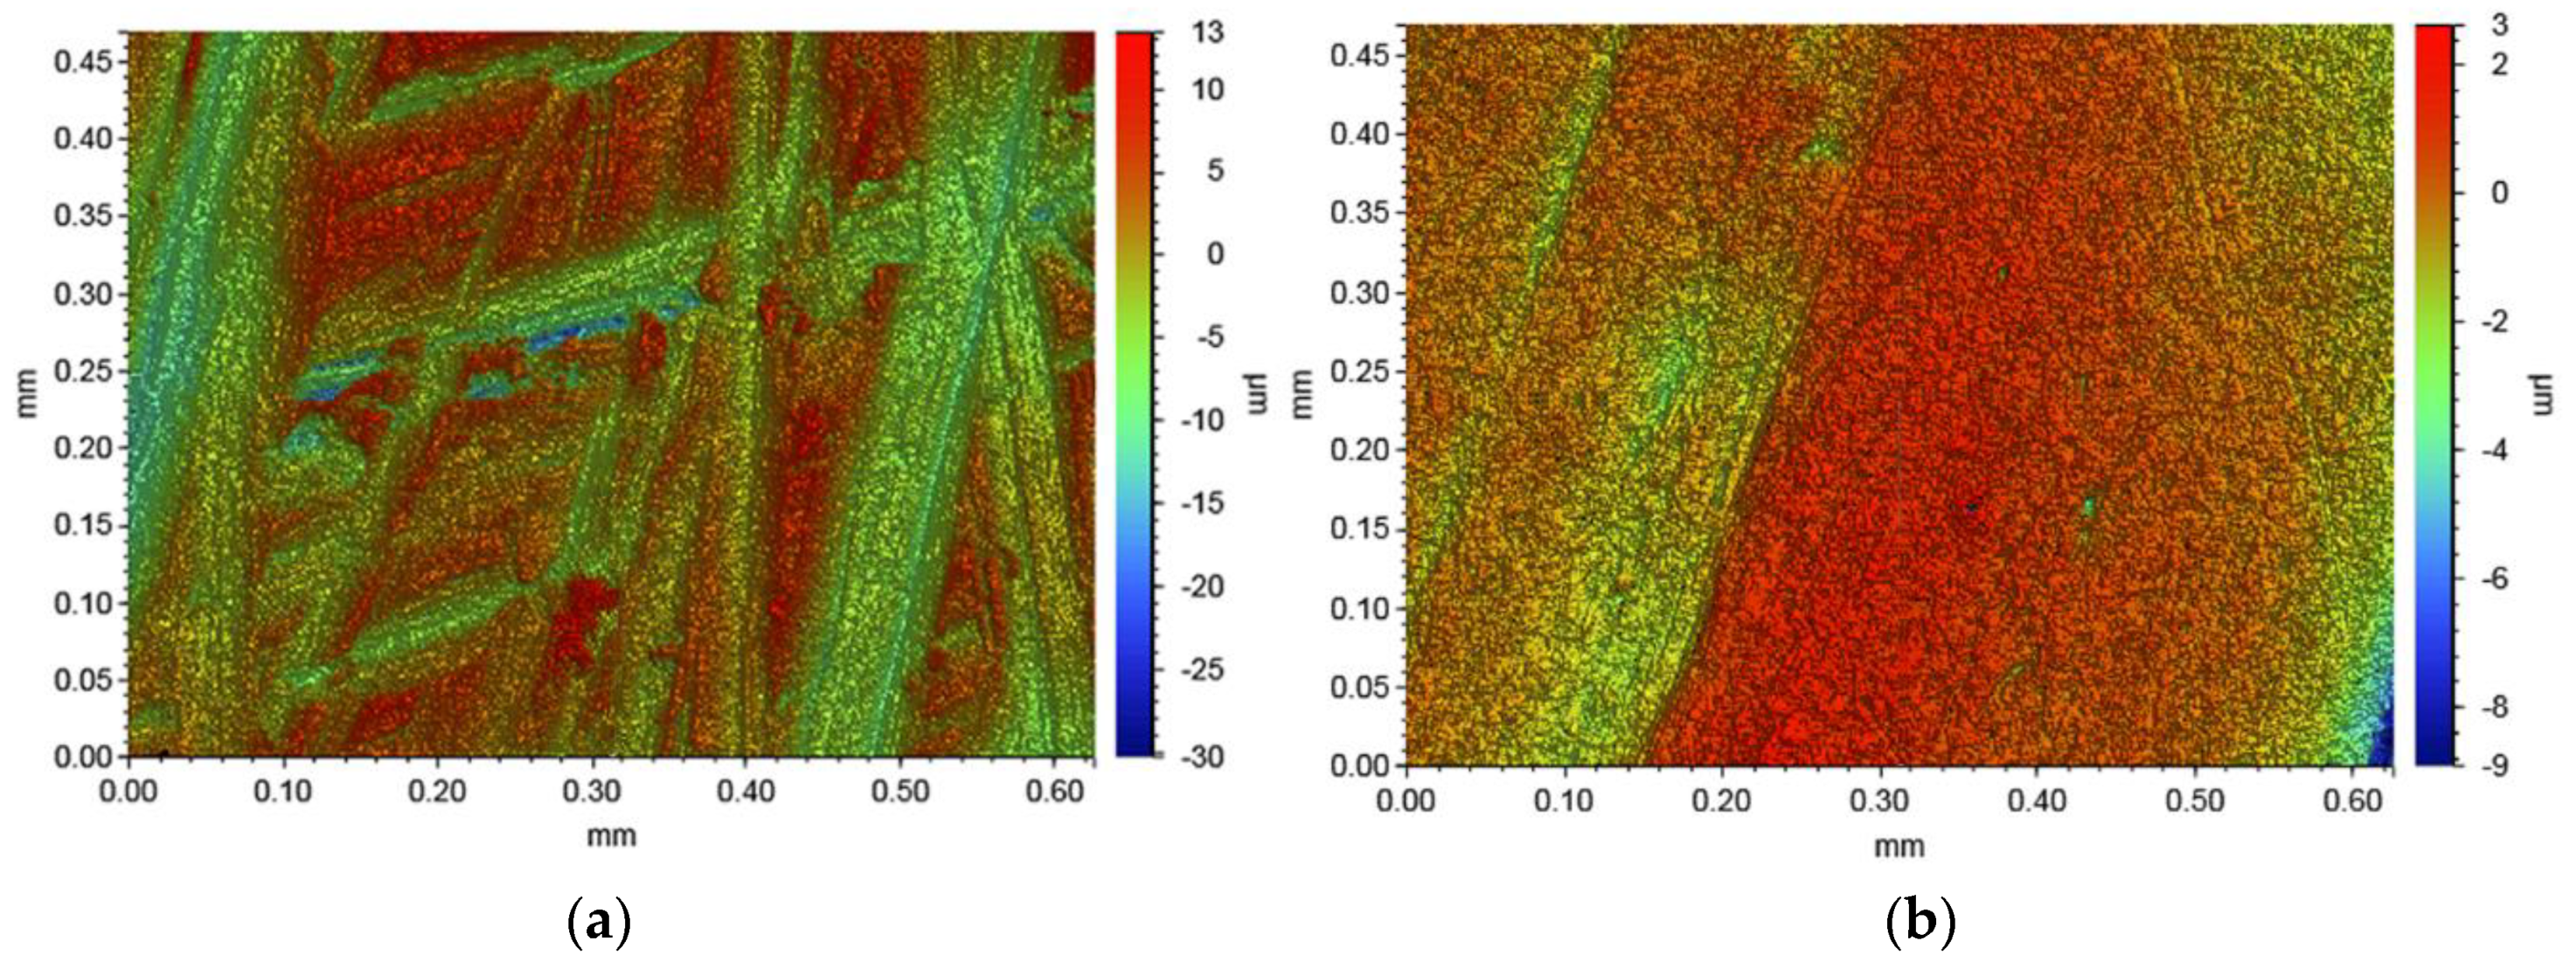
3.1.1. Cross-Section Analysis
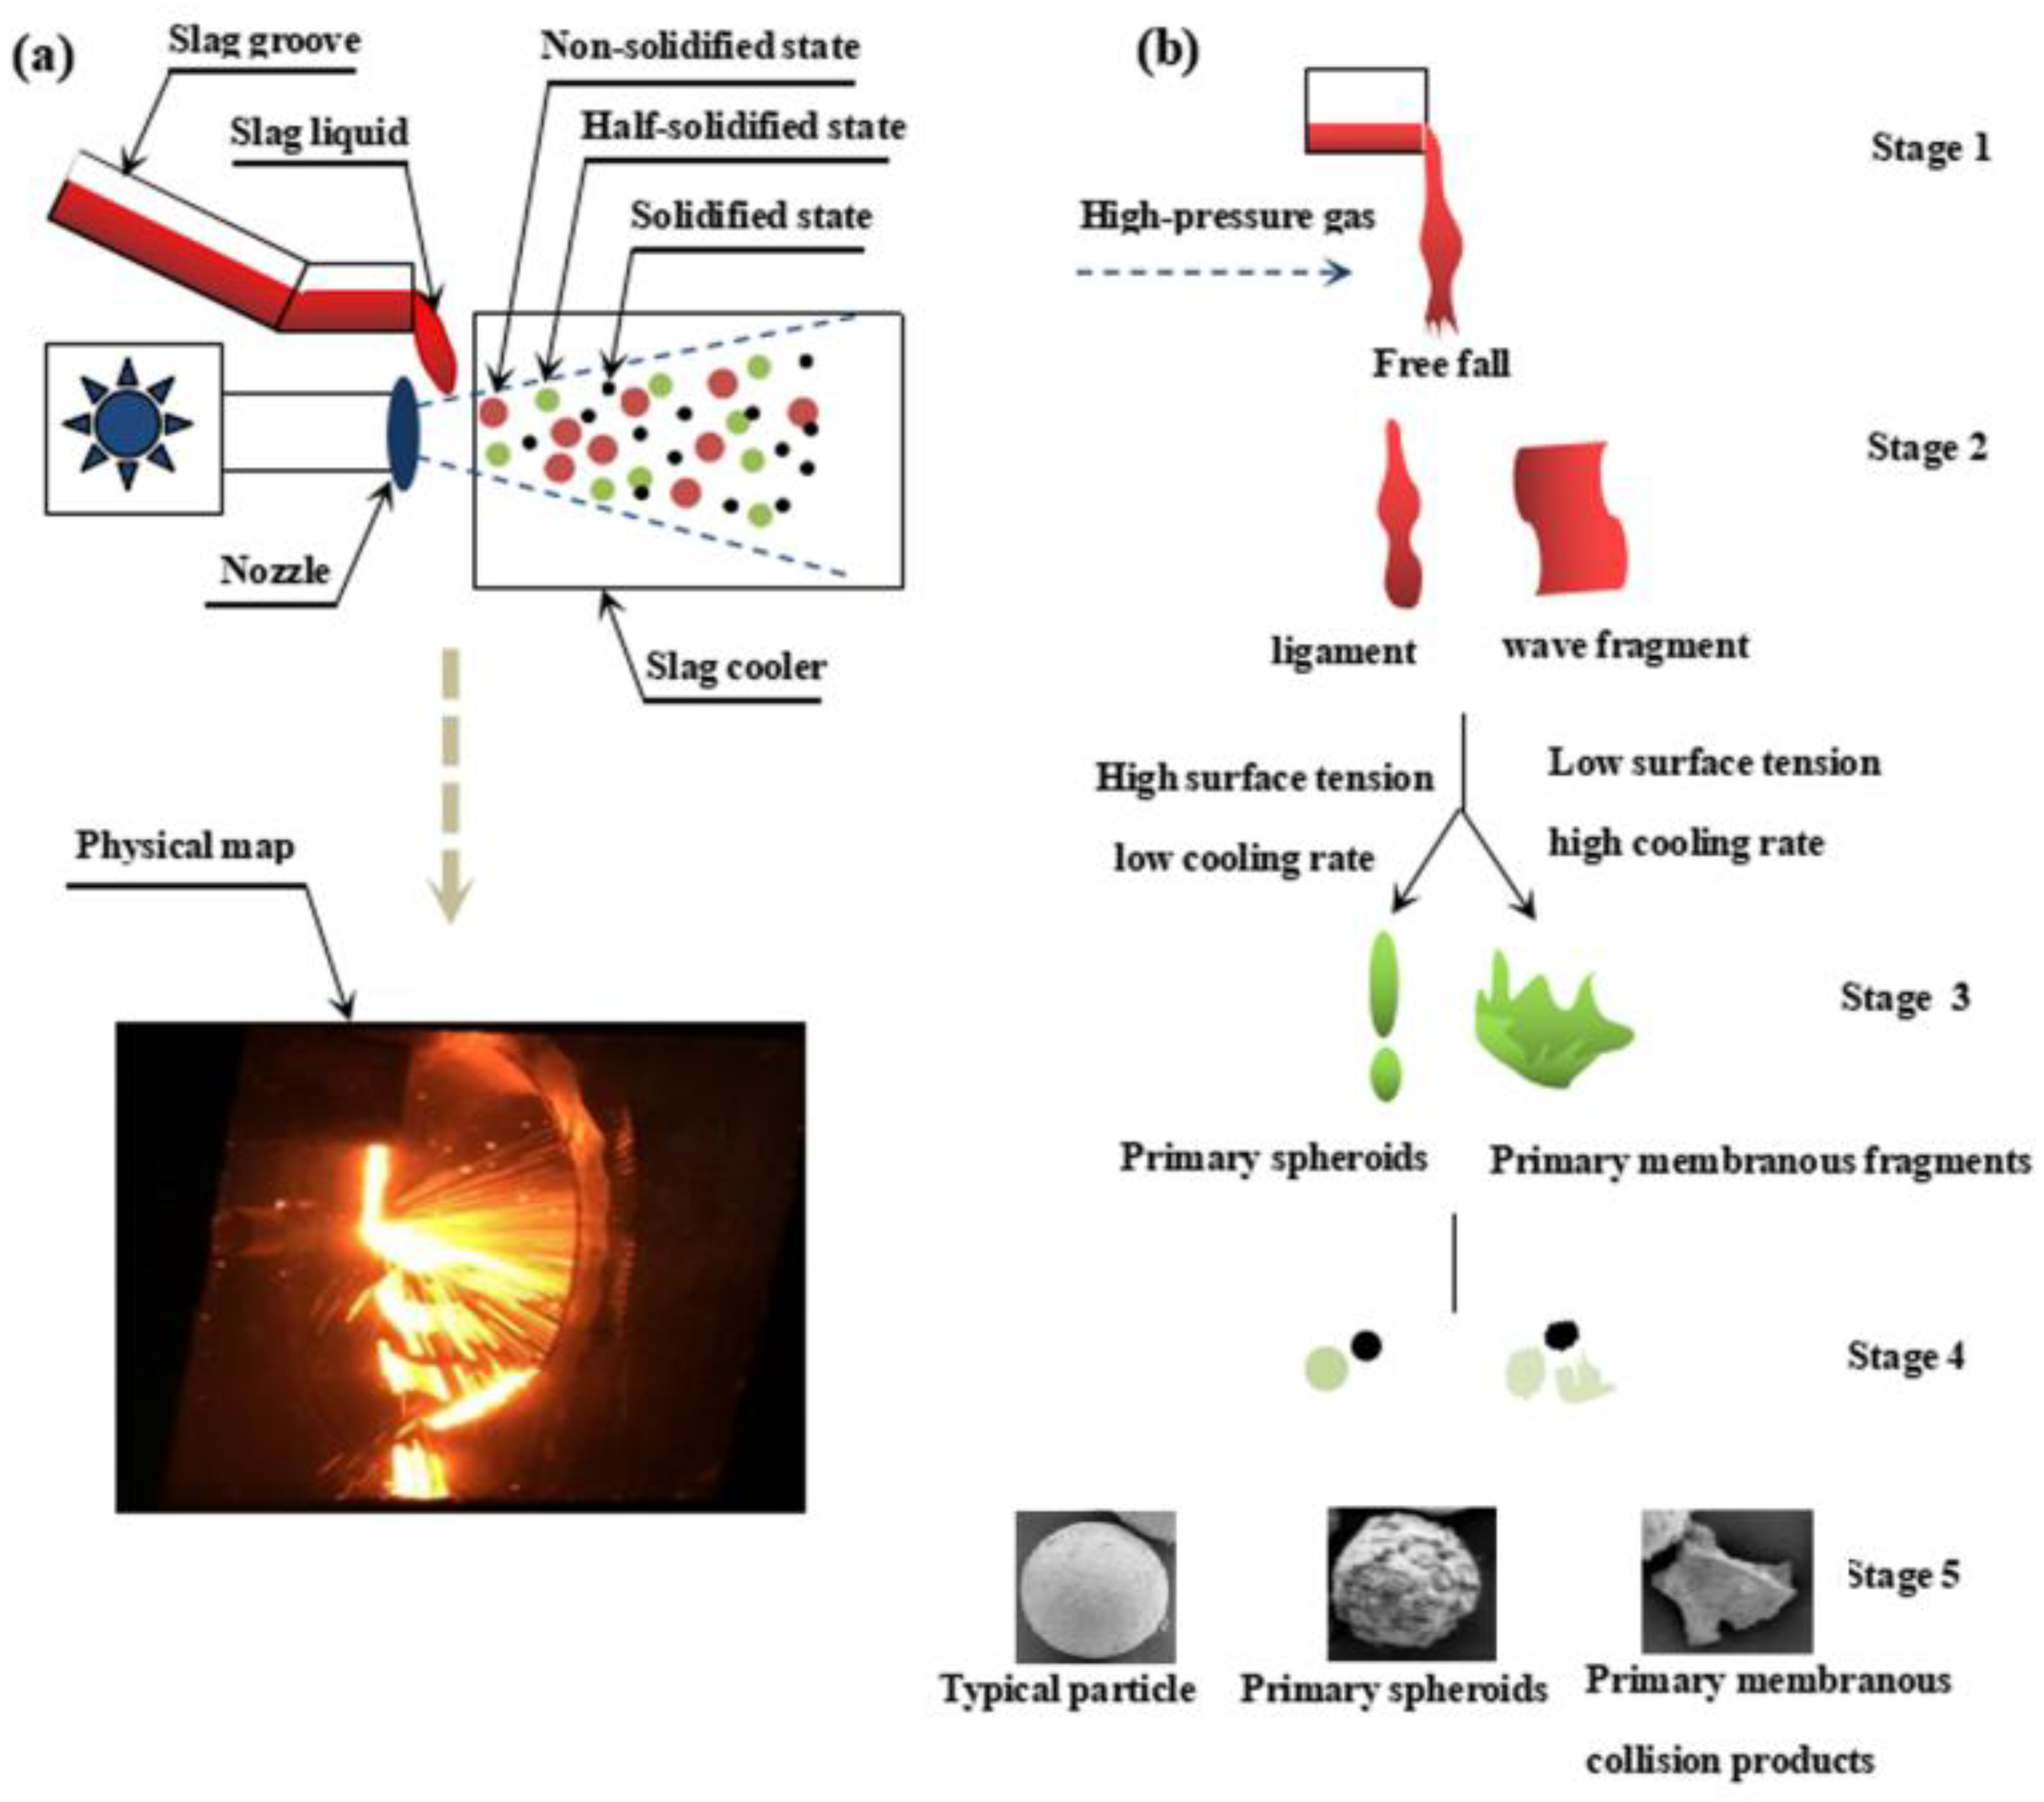
The cross-section of gas-quenched steel slags was prepared by an ion beam polishing machine and the internal micromorphology in the samples was observed by scanning electron microscopy. The sample sections had shallow colors and a round profile, as shown in Figure 3, and displayed a low magnification FESEM micrograph, as shown in Figure 3a. All images were processed using the Image J software (Figure 3b,c). A qualitative analysis of characteristic substances in the images was conducted in accordance with the backscattering imaging principle (the image is dark if the atomic number of substances is small) with the mass content of gas-quenched steel slag elements and the atomic number, as shown in Figure 2b. The mineral morphologies of gas-quenched steel slags are mainly irregular with a similar phase composition and major minerals can generally be divided into four types according to morphology: deep gray, gray, white, and bright white phases. The deep gray phase (corresponding to A1A2A3A4 in Figure 3c) is mainly granular or irregular, with a wide range of particle sizes, smooth edges, and enrichment distributions. These deep gray substances include calcium and silicon phases, which are rich in Ca and Si, respectively. A high content of gray phases (corresponding to B1B2B3 in Figure 3c), which are mainly clustered or irregular branches, was found. Therefore, these gray substances have high contents of Ca and Fe. White phases (corresponding to C1 in Figure 3c) are amorphous and fill in spaces surrounding both the Ca-Si and Ca-Fe phases in the continuous extension forms. These white continuous amorphous substances are believed to be magnesium–iron phases containing Fe and Mg. In addition to typical morphologies with high contents, some unique morphologies with relatively low contents were also observed. Irregular bright white phases are metallic iron, as depicted in Figure 3d. Through an analysis of Figure 7, it can be found that the deep gray, gray, white, and bright white phases are 2CaO·SiO2, 3CaO·SiO2, 2CaO·Fe2O3, MgO·2FeO, and Fe, respectively.

3.1.2. Mechanism

Figure 3 presents the cross-sectional morphologies of gas-quenching steel slag abrasives. Some pores can be observed in gas-quenching steel slag abrasives. These pores are formed in the process of the production of abrasives by high-pressure gases in the observation. Figure 4 shows the formation process of gas-quenched steel slags. Figure 4a reveals that the gas nozzle is installed at the left of the cooling system and high-pressure gases erupted from the gas nozzle. The vertically falling slags are broken into small liquid droplets. In this process, liquid drops can be divided into three states: non-solidified, semi-solidified, and solidified states. Figure 2 shows the macro structure of gas-quenched steel slags under the solidification state.
The formation process of gas-quenched steel slags is further interpreted. Figure 4b shows the five stages in bead formation by liquid steel slags: the first stage is the formation of disturbance waves; the second stage is the filamentation or membrane formation stage; the third stage is the breaking of liquid filamentation or membrane-shaped fragments; the fourth stage is the secondary breakage of melting slags; and the fifth stage is the impact and aggregation of particles [27,28]. The formation process of gas-quenched steel slags involves the wrapping of high-pressure gases by melting slags for a short period into liquid droplets. Gases might be retained in the final liquid droplets when the surface tension of the liquid increases with the fast cooling. This phenomenon might be the major cause of the pore generation in the gas-quenched steel slags (Figure 3).

3.2. Characterization of Pore Structure

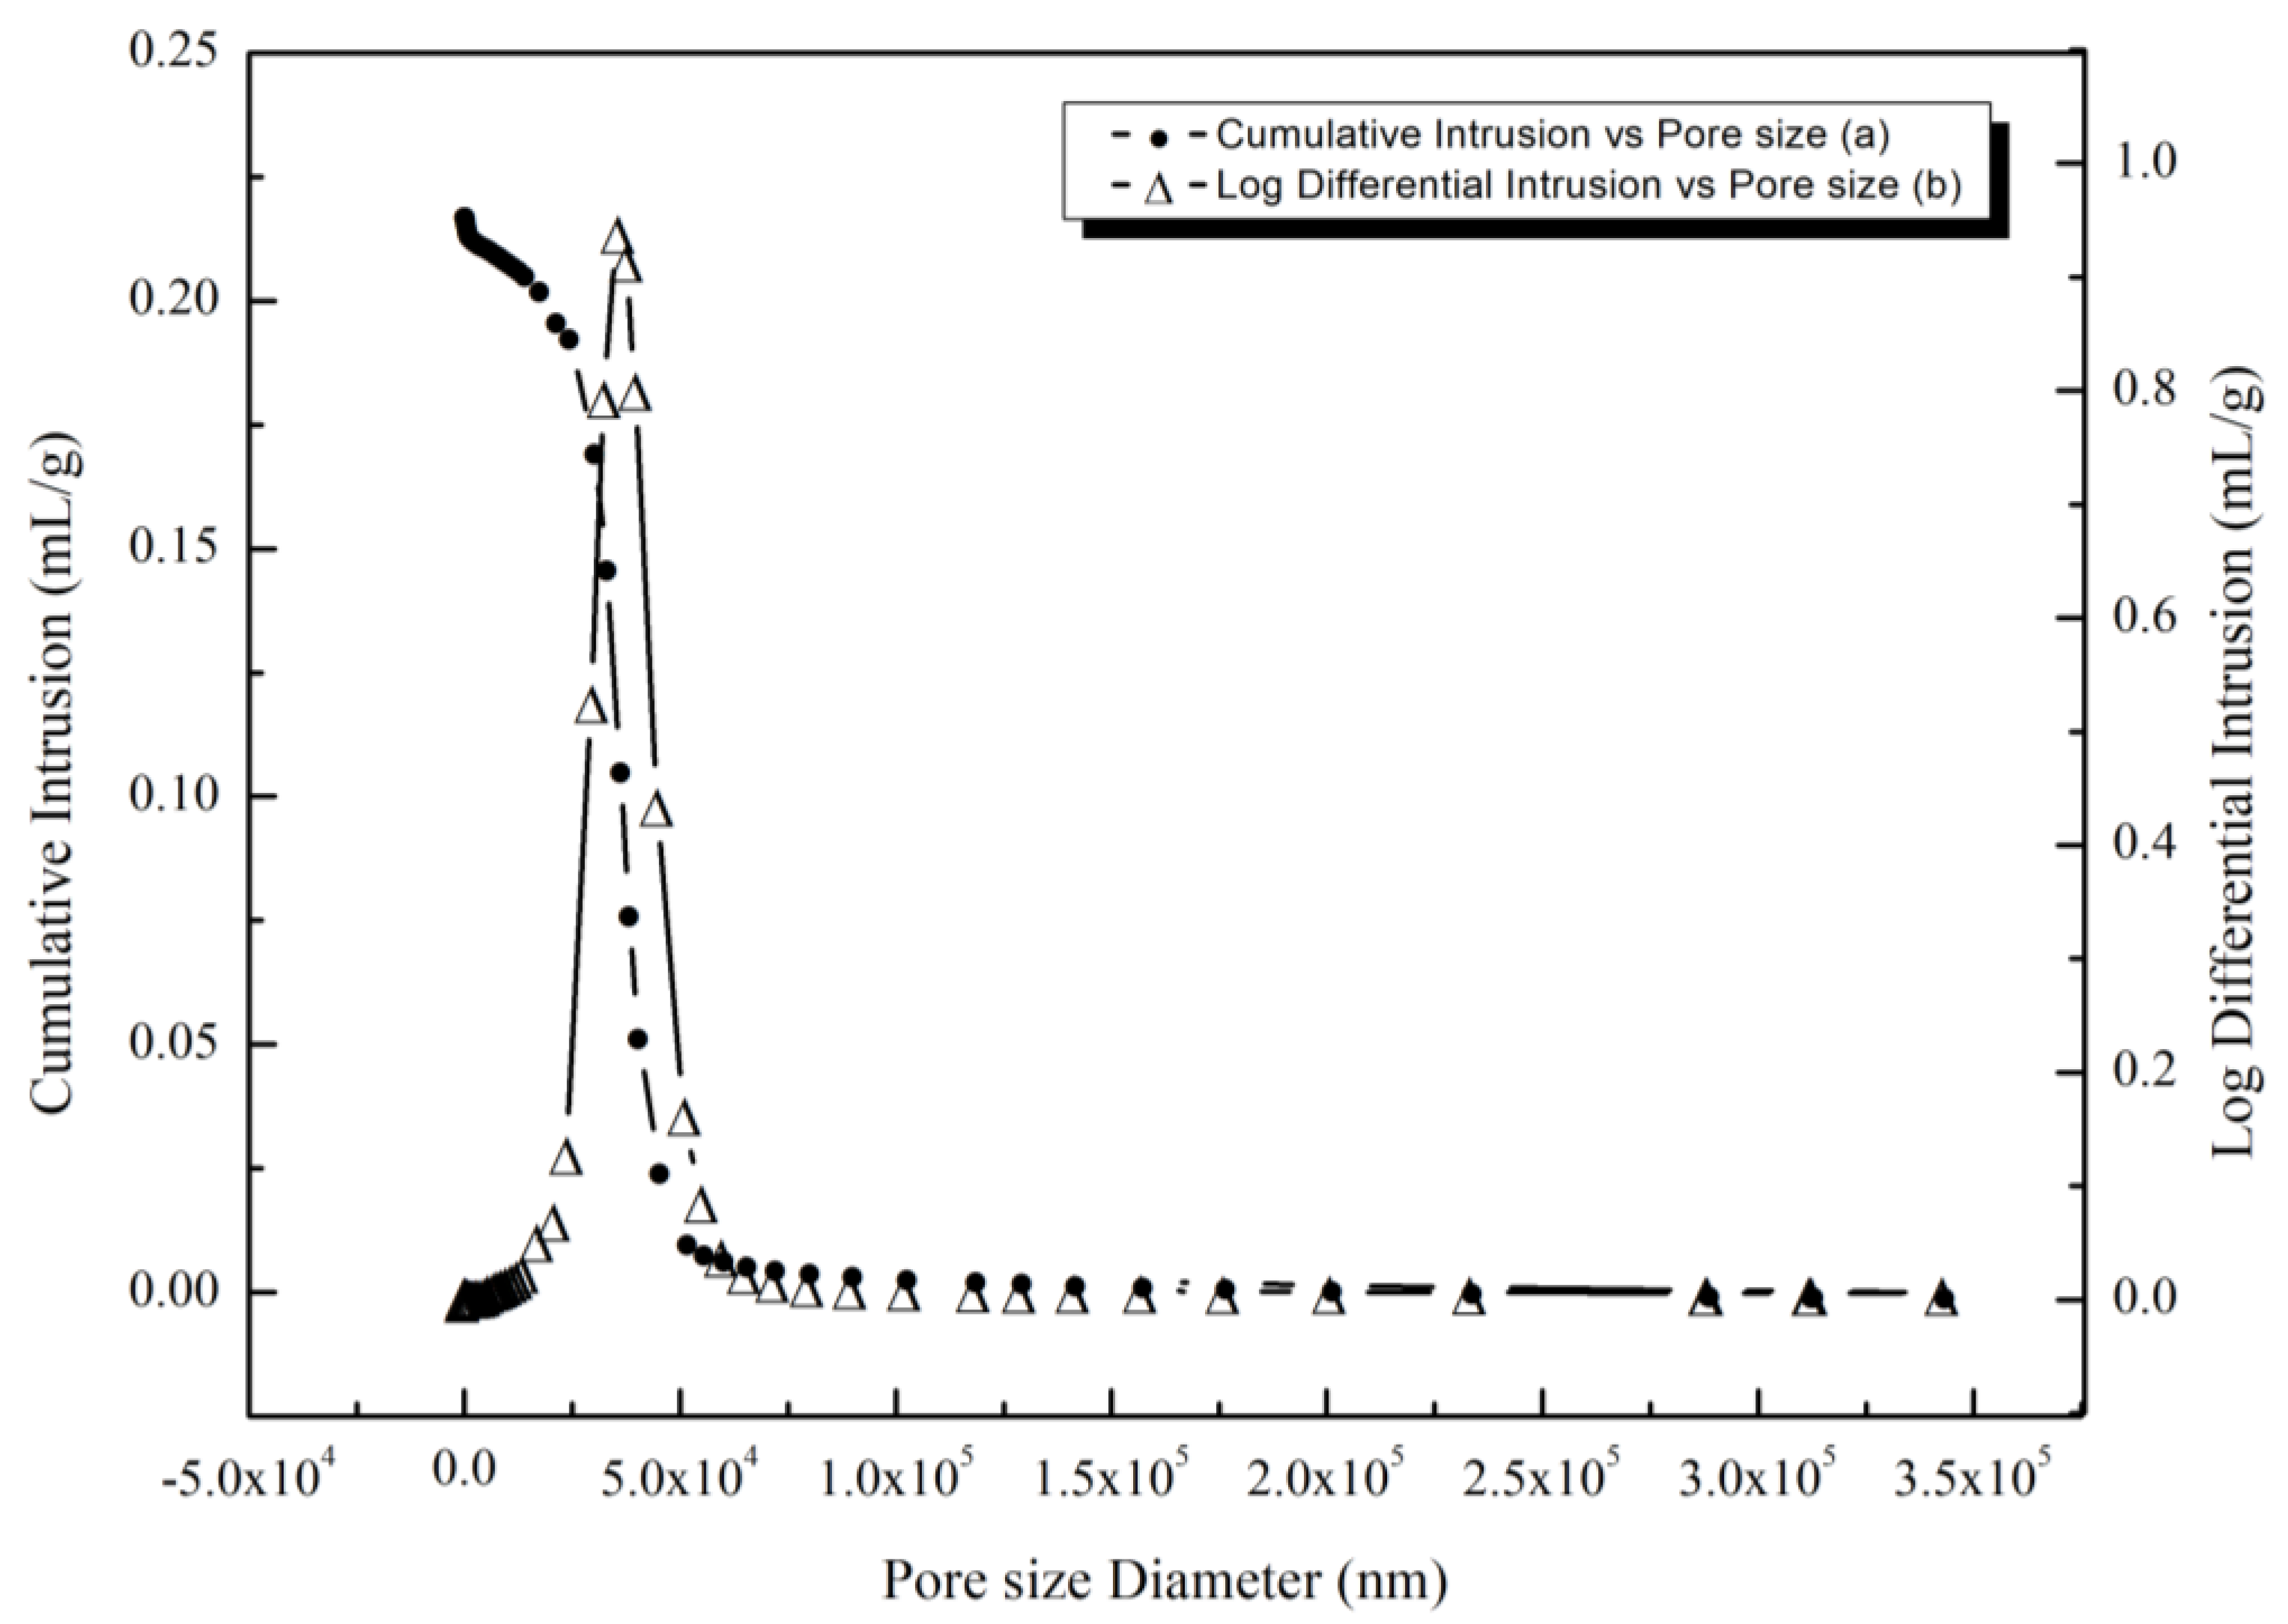
3.2.1. Mercury Pressure Test

Figure 3 shows irregular black regions in the base, which represent pores in the samples. The mercury injection test of the samples can reflect the continuity of samples and pore structural features. The processed samples (sized in 100–200 meshes) were weighted and sealed in sample tubes, which were placed in the low-pressure station of the mercury injection apparatus. The samples were then transferred into the high-pressure stations for high-pressure measurement after vacuumization, mercury injection, and low-pressure pore measurement. Finally, the pore diameter distribution curve and relevant pore data were obtained. Mercury pressure testing results showed that the pore volume, total pore area, bulk density, apparent density, and porosity of the samples were 0.22 mL g−1, 0.08 m2 g−1, 1.94 g mL−1, 3.37 g mL−1, and 42.36%, respectively.
Figure 5 shows the cumulative curve of the mercury intrusion volumes of the gas-quenched steel slags. The figure reveals that the curve is relatively smooth, indicating the relatively uniform pore diameter distribution of the samples. The testing principle indicates that the pressure mercury apparatus should first measure the large pores in the growing process of mercury pressure. Small pores are successively intruded with the increase in pressure. Therefore, the cumulative mercury increment is relatively small when the mercury pressure is comparatively low; that is, the measuring pore diameter is relatively large, indicating the presence of relatively few pores larger than 60 µm in diameter. The mercury inlet is significantly increased in the interval of 60–15 µm and the slope of the curve is markedly raised, accompanied by evident inflection points of the cumulative curve of the mercury intrusion volume. Pore diameter corresponding to this inflection point is the critical pore diameter of the samples, which is the pore diameter when the mercury inlet begins to increase significantly. Hence, the critical pore diameter of the samples is approximately 55.44 μm and the corresponding cumulative mercury inlet is 0.0087 mL g−1.
The differential curve of the pore diameter distribution of gas-quenched steel slags is shown in Figure 5. The differential curves of the pore diameter distribution of the samples almost have a relatively evident peak and the corresponding pore diameter to this peak is the most probable pore size. The most probable pore size of the sample is 36.11 μm. Figure 5 shows that there are most mercury inlets in the range of 60–15 µm, which accounted for 90% of the total pore volume. This finding demonstrates that this interval range has the most pore content. The curve is relatively flat in the interval of the pore diameter smaller than 15 µm and the increasing trend of the cumulative mercury inlets of samples is absent. Thus, the pore content in this section is relatively low, accounting for 7% of the total pore volume. Nevertheless, these pores provide a relatively large specific surface area, accounting for 71% of the total pore area.

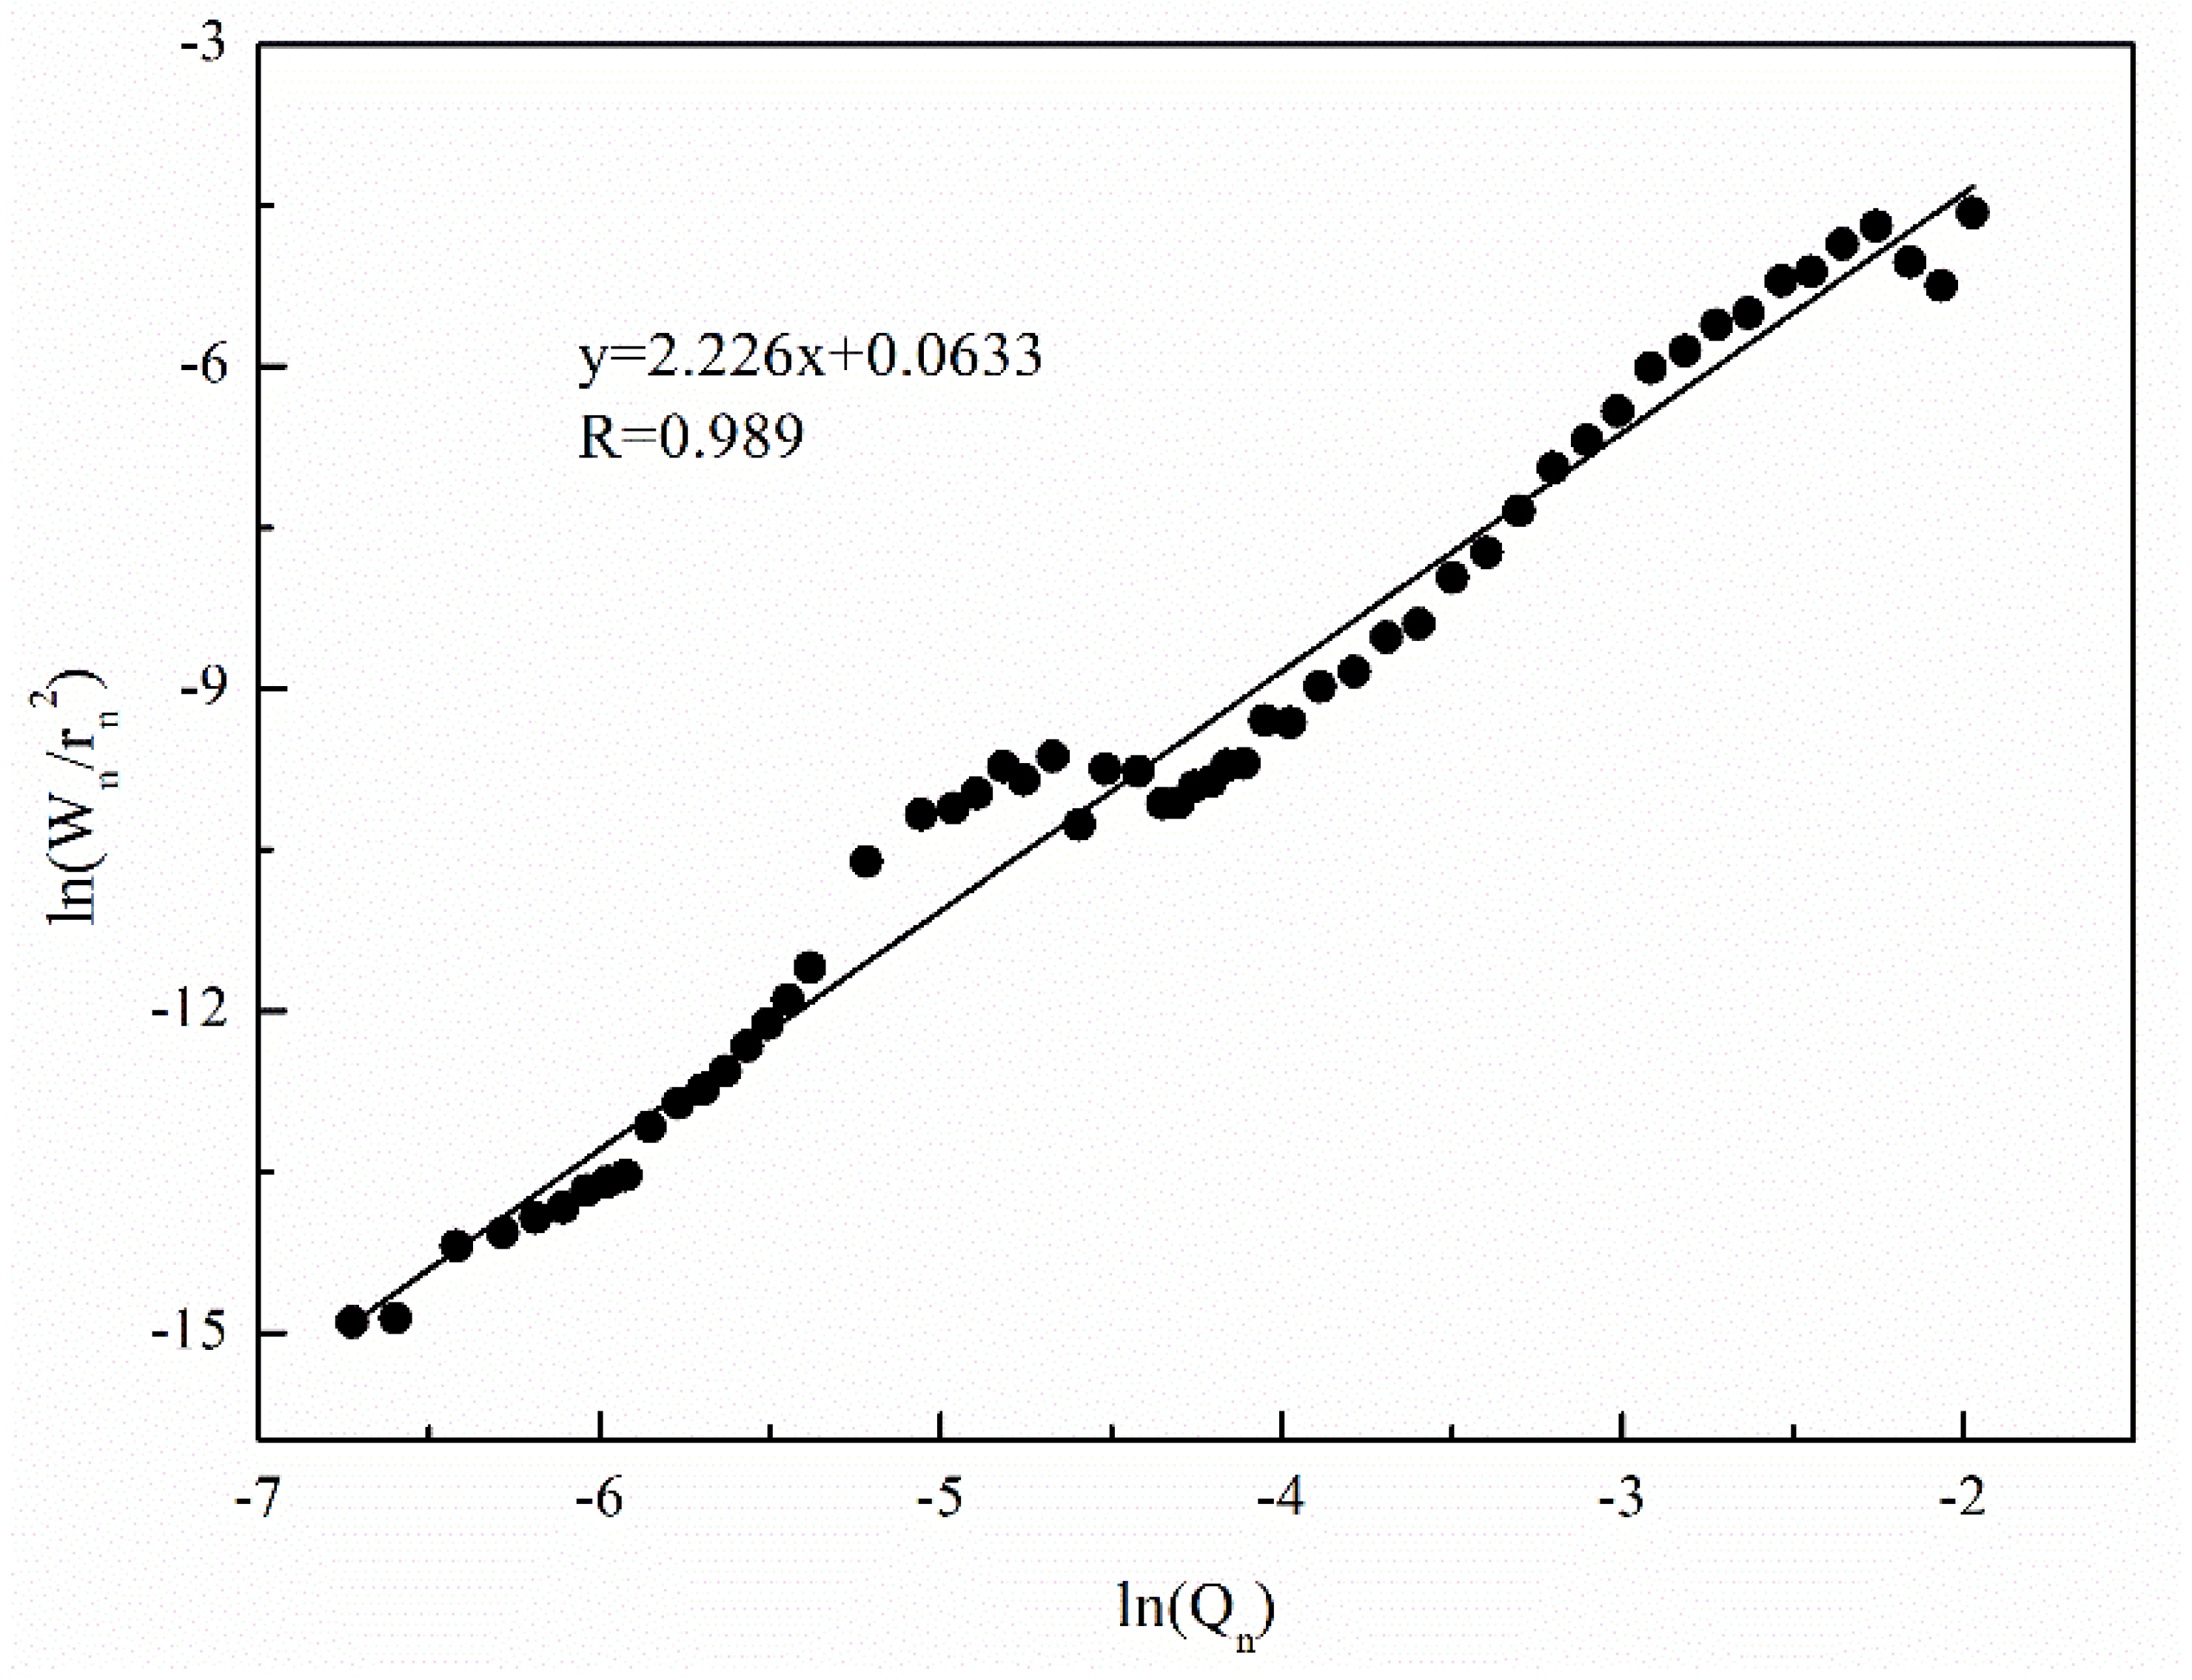
3.2.2. Calculated Result Analysis of Fractal Dimension

The fractal dimension (D) reflects the pore diameter distribution and complexity of porous structures in porous materials. D ranges between the topological dimensions (2–3). The small and large values of D imply the simple and complicated porous structures, respectively. The complexity of porous structures in samples could be quantitatively and accurately described as well as characterized on the basis of the combination of the fractal theory and mercury compressed porous structural parameters.
A thermodynamic model was used in this study to characterize gas-quenched steel slag particles. A linear fitting of the cumulative mercury testing data of the MIP of samples based on the least-square method was conducted, thus providing the fractal dimensions of the porous structures of the samples. The linear fitting results are shown in Figure 6. The fitting degree of the thermodynamic fractal curve of the samples is remarkably high and the correlation coefficient of the curve is 0.989. This finding indicates that the pore fractal curve of the samples based on the thermodynamic model effectively conforms to the linear relationship and the porous structure of the samples has fractal characteristics. The curve slope is a fractal dimension (DT) with a value of 2.226 and the samples have regular porous structures. This finding conforms to the physical significance of fractal geometry. Therefore, studying the fractal features of pores in gas-quenched steel slags based on the thermodynamic model within the measuring range of the pressure mercury apparatus is appropriate.

3.3. Chemical Stability Analysis

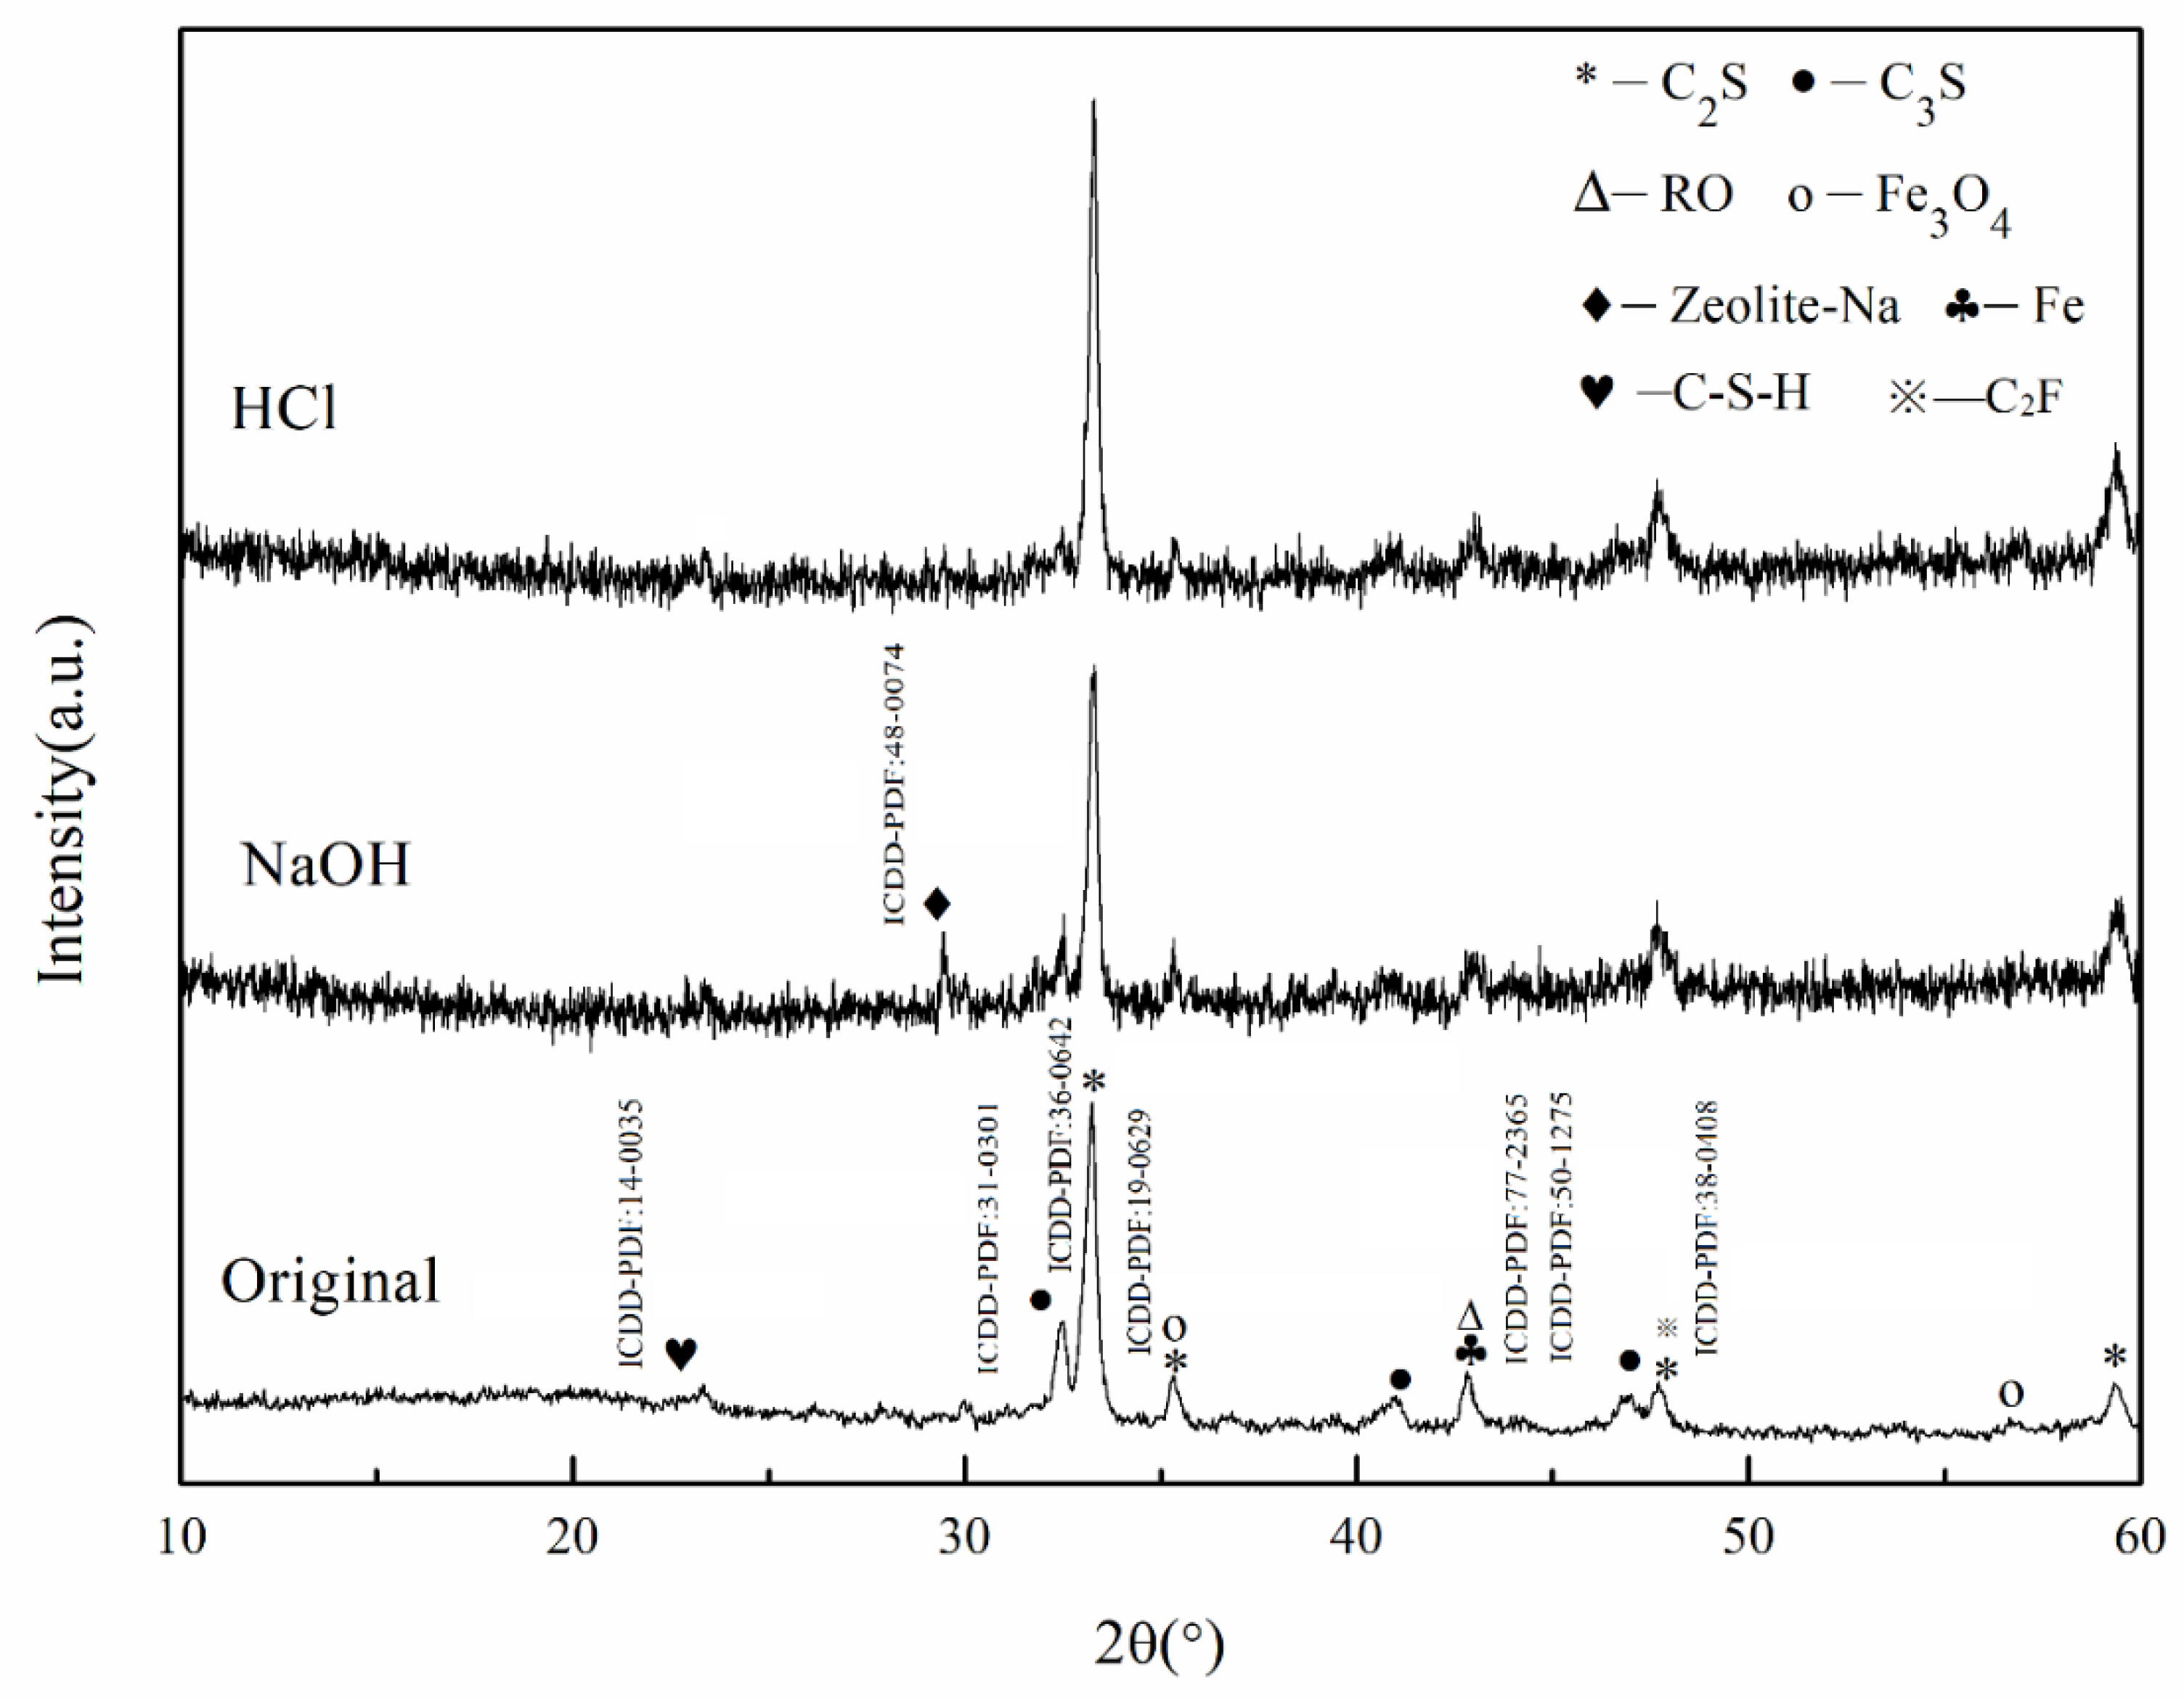
3.3.1. Analysis of Sample Phase Structures after Acid–Alkali Corrosion

Figure 7 displays the XRD of the gas-quenching steel slag abrasives after 72 h of acid–alkali corrosion. The gas-quenching steel slag contained dicalcium silicate (2CaO·SiO2), tricalcium silicate (3CaO·SiO2), dicalcium ferrite(2CaO·Fe2O3), RO (MgO·2FeO), iron, magnetite, and amorphous phaseDicalcium silicate, which were consistent with the analysis result in Figure 3. The figure reveals the absence of new phases in the sample after corrosion through the HCl solution. A zeolite peak appeared nearby to 27°–30° after 72 h of corrosion through the NaOH solution as the calcium silicate phase was dissolved and this peak reflected the appearance of N-A-S-H (Na2[(AlO2)2·SiO2]·H2O) products. Meanwhile, the diffraction peak of the hydration products of active components (C2S and C3S) in the sample could be observed from the X-ray diffractogram. However, the diffraction peak of inert substances (RO phase and Fe3O4) in the gas-quenching steel slag abrasive was still remarkably strong. Fe3O4 is a basic oxide and the RO phase is an inactive substance, which only exerted minor effects in alkaline environment. Therefore, the intensities of the RO and Fe3O4 diffraction peaks remained unchanged.

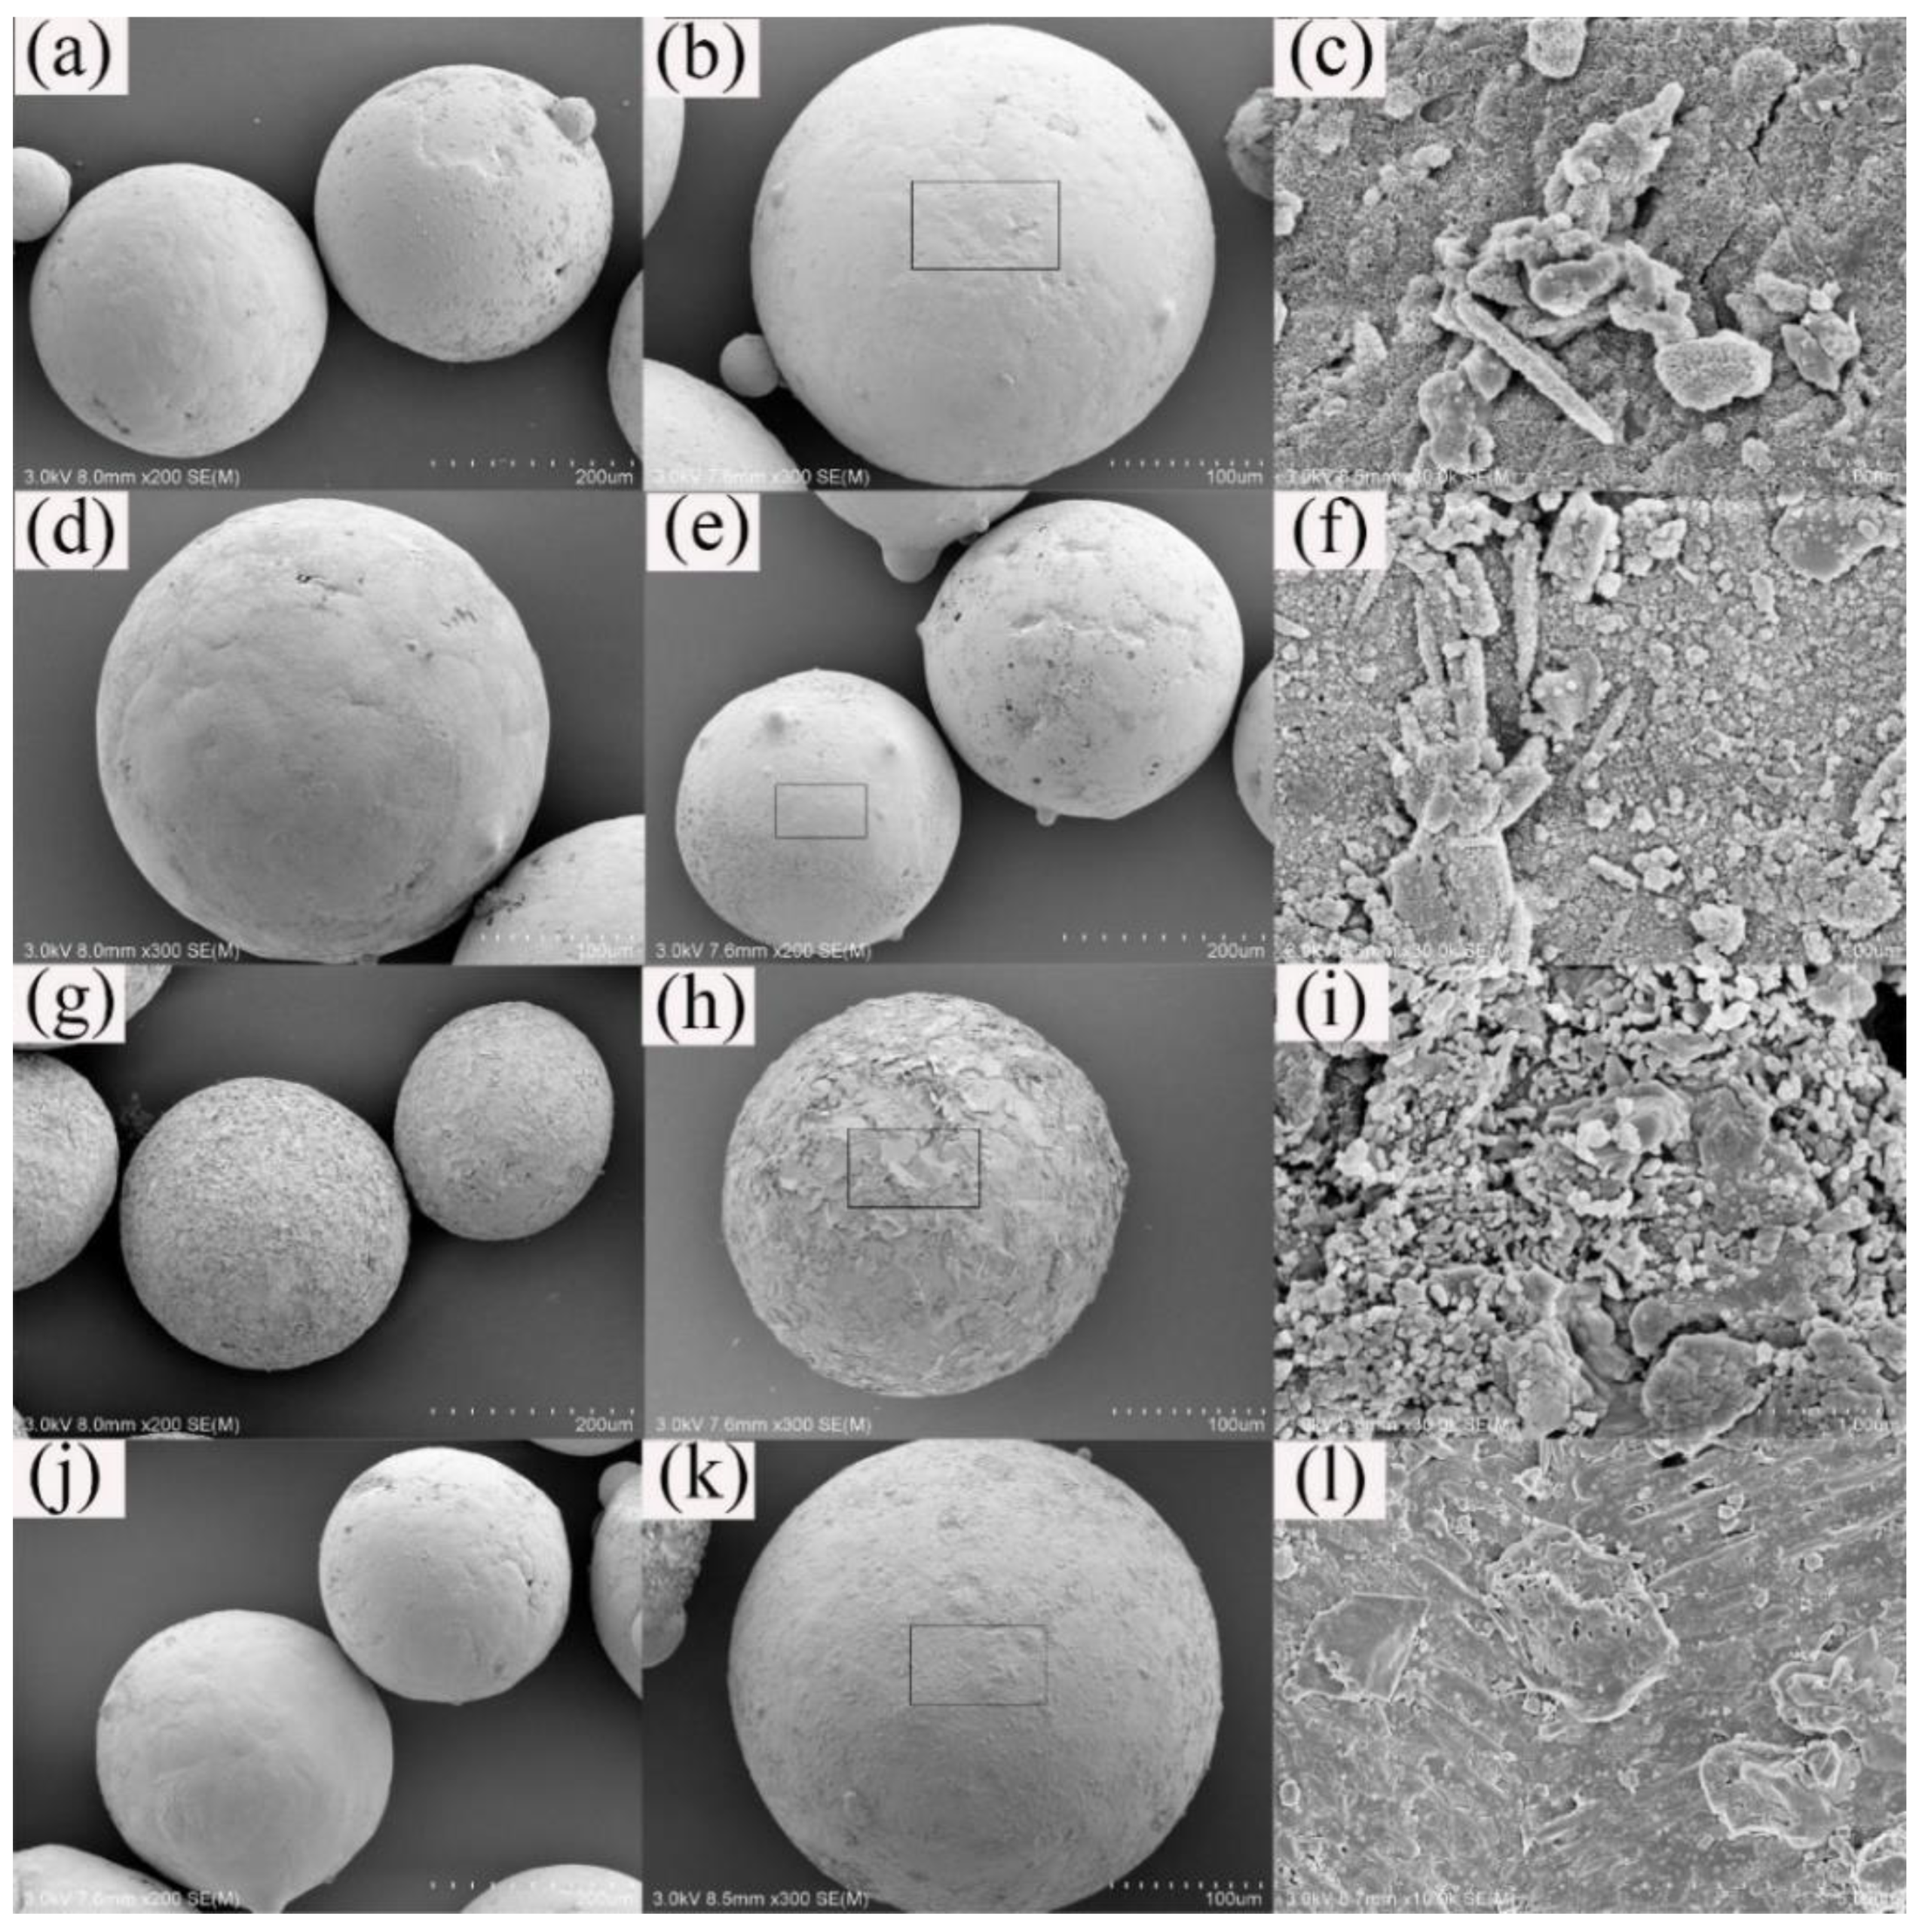
3.3.2. Sample Microstructure after Acid–Alkaline Corrosion

The microstructure of the gas–quenching steel slag abrasives in water, acid solution, alkaline solution, and polishing fluid after 24 and 72 h are shown in Figure 8. Figure 8a–c display the sample microstructure after 24 and 72 h of corrosion in water. These results reveal that the sample had an intact surface structure, along with a small quantity of villous and rod–like hydration products, as time went on. Figure 8d–f show the sample microstructure after 24 and 72 h of corrosion in the HCl solution. These findings indicate the presence of a trace amount of the peeling layer on the sample surface after 24 h of corrosion in the HCl solution, the slight peeling degree, and the relatively rough surface. Gullies and holes were formed on the sample surface, the corrosion was relatively aggravated, and many villous and rod–like hydration products appeared on the sample surface as the erosion time was lengthened to 72 h.
The sample microstructures after 24 and 72 h of corrosion in the NaOH solution are shown in Figure 8g–i. The particle surface was wrapped by a large number of amorphous hydration products, especially many flaky structural products, through the corrosion in the NaOH solution for 24 and 72 h. The defects increased on the gas-quenching steel slag particle surface and the hydration products were both uniform and compact on the sample surface as the erosion time was lengthened. Thus, the gas-quenching steel slag abrasive particles were mutually overlapped and gradually hardened due to these hydration products.
The sample microstructures after 24 and 72 h of corrosion in the polishing fluid are displayed in Figure 8j–l. These figures reveal that the sample still had an intact microstructure as time went on. Thus, the polishing fluid did not generate any corroding effect on the sample. The sample surface morphologies slowly changed in water and in the acidic medium. However, the sample surface damage was serious in the alkaline medium and the structural defects were increased on the sample surface with the corrosion time.

3.3.3. Acid–Alkali Resistance Mechanism Analysis

The mass and microstructural changes of the gas-quenching steel slag abrasives after acid–alkali corrosion were due to different acid–alkali resistance mechanisms. The sample surface elements were analyzed via the EDS probe of a scanning electron microscope. Figure 9 presents the component changes in the sample before and after 72 h of corrosion. The relative contents of metallic elements, namely Mg, Al, Ca, and Fe, were reduced after the acid etching of the gas-quenching steel slag abrasive, thus increasing the relative contents of Si and P. Meanwhile, the relative contents of Mg, Al, Ca, and Fe were reduced in the acid medium due to their precipitation under the ion exchange mechanism, that is, H+ replacement.
The relative content of Si was unchanged after alkaline etching, while those of Al, Ca, Fe, and Mg were reduced. Therefore, the relative content of O was elevated because metallic ions, such as Al3+, Ca2+, and Fe2+, could be released from the sample surface during the corrosion of the gas-quenching steel slag abrasive in the alkaline solution and Al3+, Fe2+, and OH- reflected the generation of white gel precipitation. The sample microstructure after alkaline etching revealed the adherence of mainly flaky layers to the sample surface. The [SiO4]4+ tetrahedral skeleton network structure in the gas-quenching steel slag abrasive was depolymerized due to the increase in OH concentration in the sample environment. This depolymerization induced structural damage to the sample surface. Therefore, the sample was seriously corroded by alkali, that is, its alkali resistance was not as good as its acid resistance.

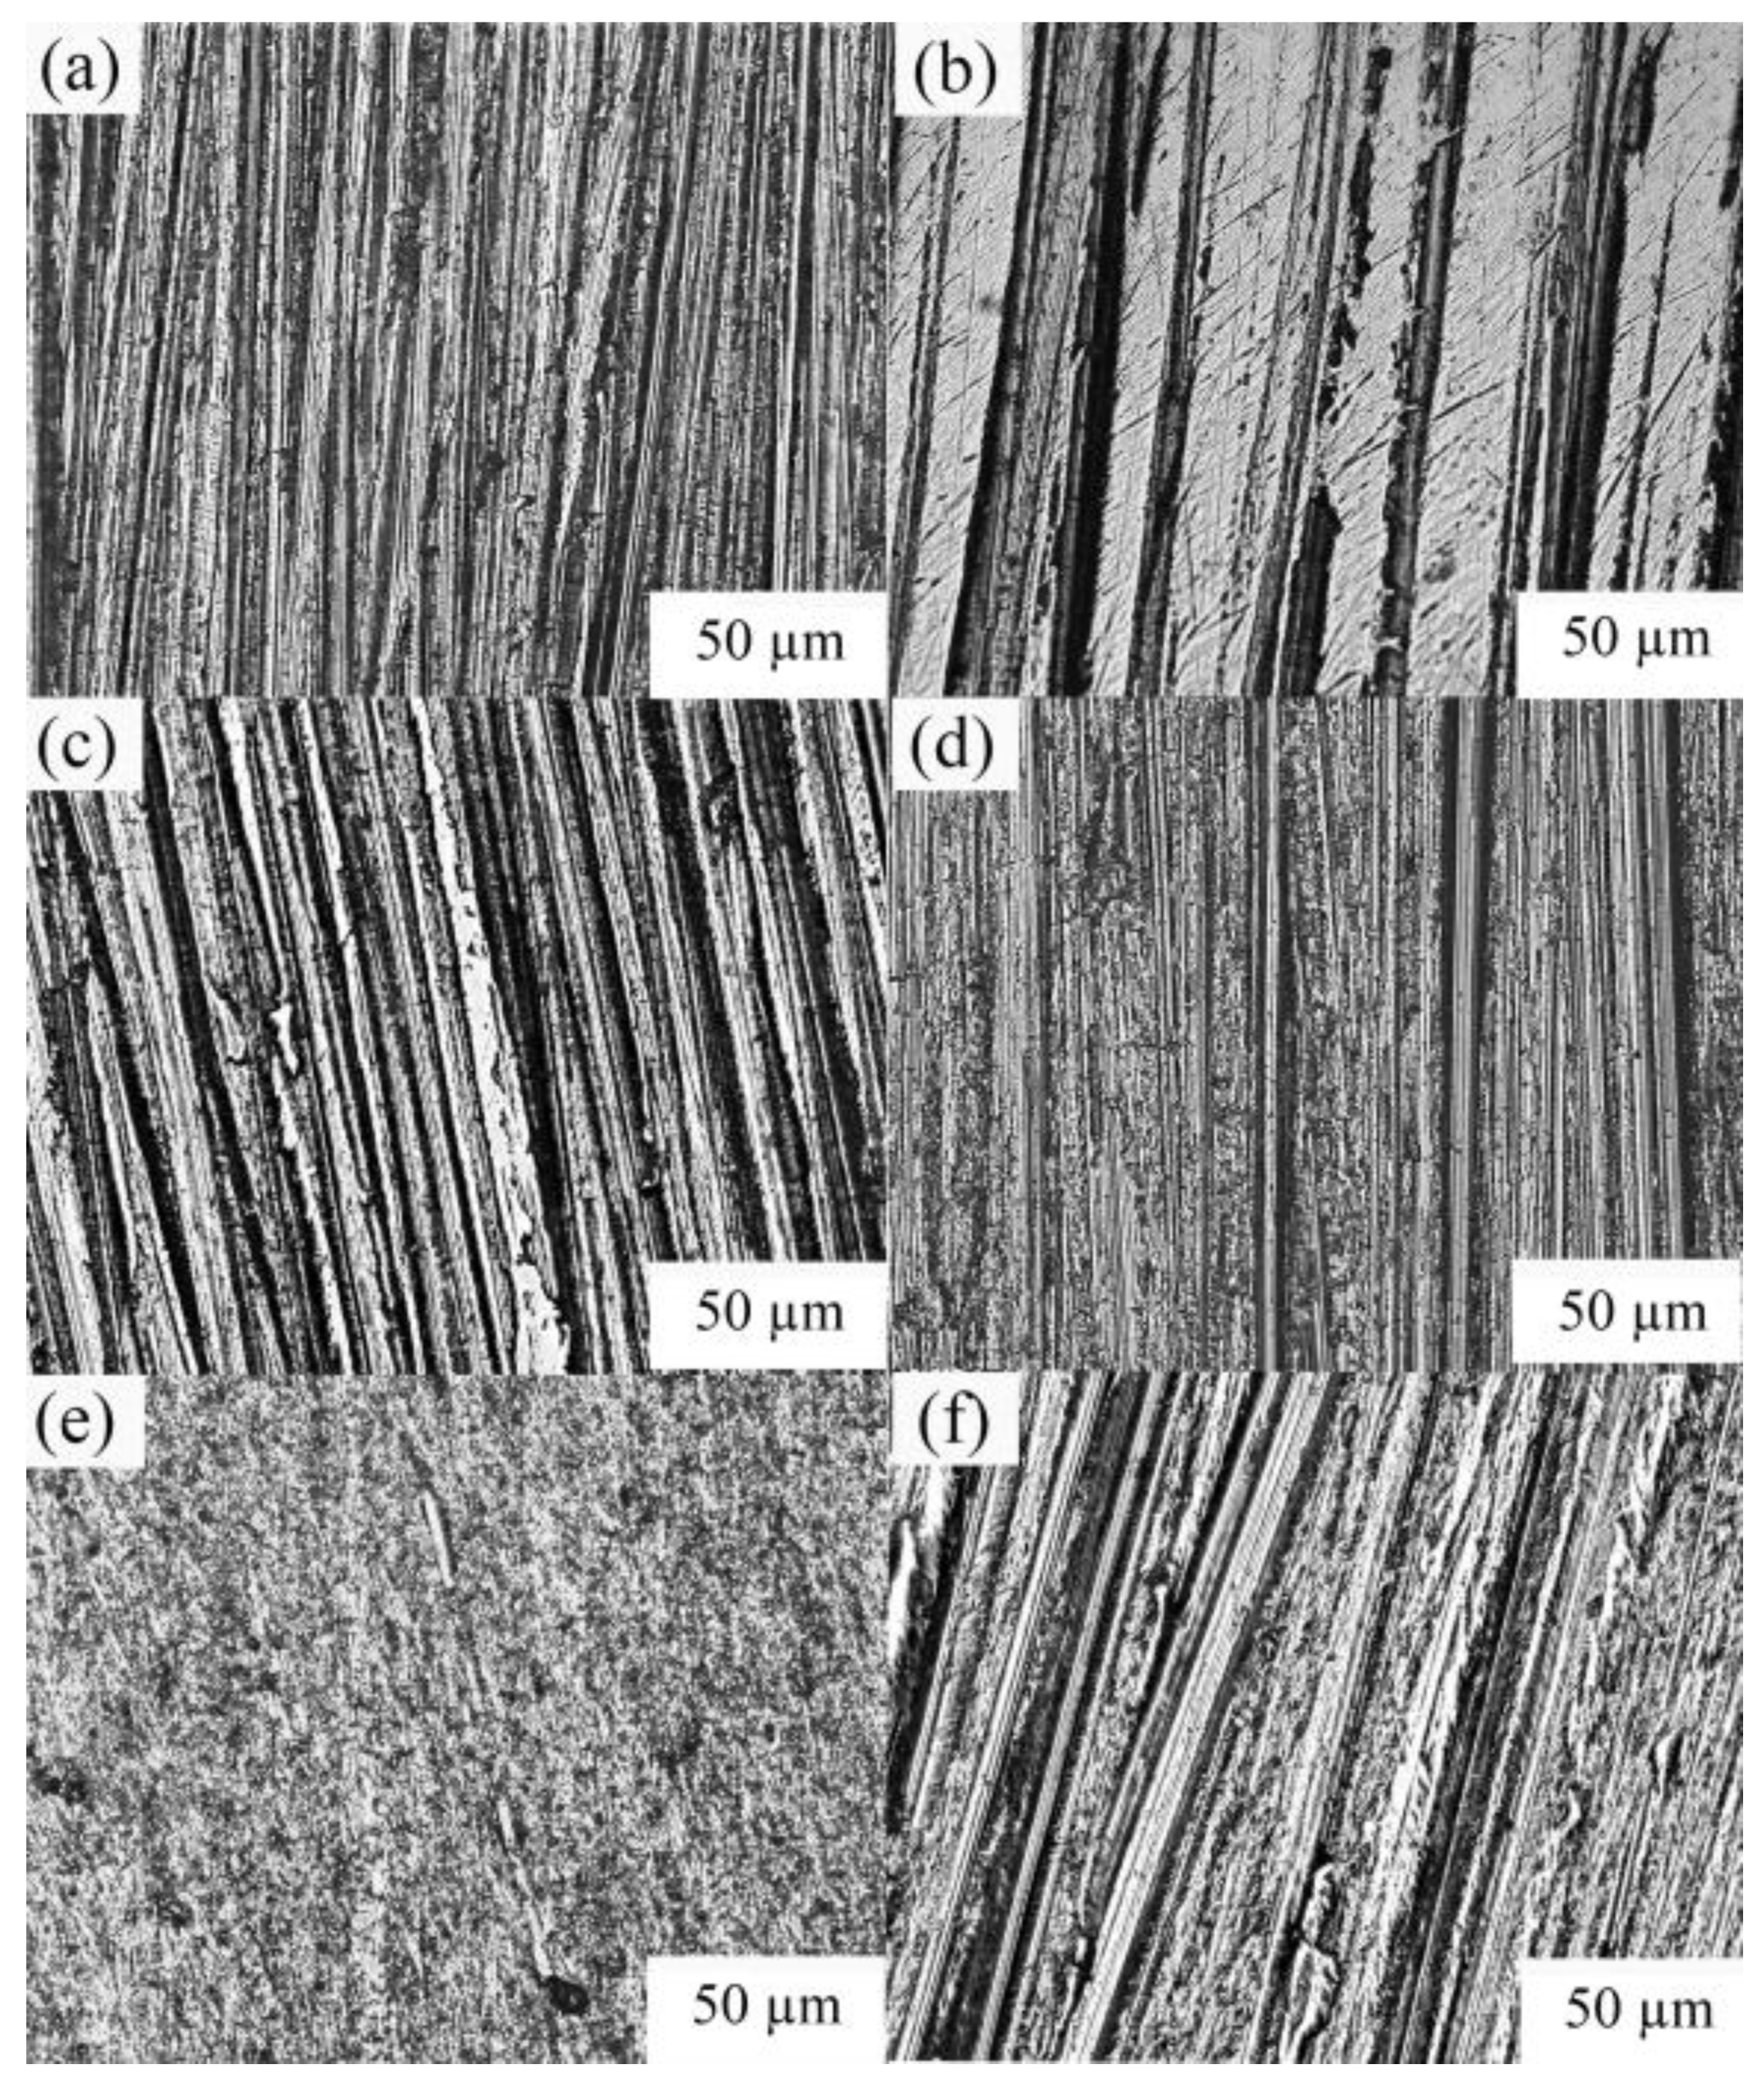
3.4. Analysis of Polishing Properties

The surface morphologies of the workpiece before and after processing were observed under an optical microscope for 10 min as shown in Figure 10. The gas-quenching steel slag abrasives continuously made irregular friction movements on the workpiece surface during the grinding process, thus effectively removing the defects, such as processing texture, on the workpiece surface. The microstructures of the copper alloy workpiece before and after polishing are displayed in Figure 10a,b, respectively. These figures revealed improvements in surface quality despite the existence of gullies. Figure 10d,e show the microstructures of the aluminum alloy workpiece before and after polishing. The scratches on the aluminum alloy workpiece were found before processing, while no scratches were found after polishing. The microstructure of copper and aluminum alloy workpieces after being polishing without abrasives for 10 min is presented in Figure 10c,f, respectively, which reveal the presence of scratches on the workpiece surface. The test results show that the gas-quenching steel slag abrasives are of a certain polishing capacity for aluminum and copper alloys. Moreover, these abrasives can effectively reduce the roughness and improve the quality of the workpiece surface, and their polishing efficiency for aluminum alloy is higher than that for copper alloy.
In order to further verify the abrasive performance of gas-quenched steel slag abrasives, the surface morphology of the aluminum alloy workpiece was observed using a three-dimensional profiler. The surface roughness (Ra) of the workpiece is small, indicating that the surface quality of the workpiece is better, thus the abrasive has good grinding performance. It can be seen from Figure 11 that the surface roughness (Ra) of the workpiece was about 3 μm before the test and the surface roughness (Ra) of the workpiece reached 0.7 μm after polishing with the gas-quenched steel slag abrasive for 10 min.

4. Conclusions

  • In terms of morphological characteristics, the gas-quenching steel slag abrasives present regular monodisperse spherical shapes and the porosity is 42.36%. The mineral morphologies are mainly irregular and major minerals generally include the Ca-Si phase, Ca-Fe phase, Fe-Mg phase, and metallic irons, found by observing the cross-section of the sample.
  • The steel slag abrasives with a particle size of about 150 μm microns have stable chemical properties in polishing fluid but their microstructures are changed in acid environments. Villous and rod-like hydration products are generated and both gullies and holes are formed on the sample surface. Nevertheless, an increasing number of structural defects were found on the sample surface in the alkaline environment and many flake product adhered to its surface. A large number of amorphous and compact gelatinization products are generated.
  • The gas-quenching steel slag abrasives can effectively improve the surface quality of aluminum alloy and copper alloys due to their superior polishing properties, and their polishing effect on aluminum alloy is better than that on the copper alloy. Hence, these abrasives are applicable to the field of the finishing process. Meanwhile, a new path is provided for the high value-added utilization of steel slags.

Author Contributions

Data curation, J.P.; formal analysis, J.P.; funding acquisition, Y.Z. and H.X.; investigation, Q.R.; methodology, Y.Z. and J.W.; project administration, W.H. All authors have read and agreed to the published version of the manuscript.

Funding

This work was financially supported by the Tangshan Municipal Project of Science and Technology (number 19150201E); Natural Science Foundation of Hebei Province (number E2020209043); Graduate Innovation Project of North China University of Science and Technology (number 2018B22); Foundation of Hebei Education Department (number BJ2020022) and Graduate Innovation Project of North China University of Science and Technology (number 2018B22); and Hebei Key Research and Development Program of China (19273806D).

Institutional Review Board Statement

Not applicable.

Informed Consent Statement

Not applicable.

Data Availability Statement

Not applicable.

Conflicts of Interest

The authors declare no conflict of interest.

References

  1. Wang, H.G.; Peng, B.; Yue, C.S.; Wu, L. Research progress and prospect of steel slag modification. Environ. Eng. 2020, 38, 133–137. [Google Scholar]
  2. Liu, C.B.; Peng, B.; Xia, C.; Yue, C.S. The Research Progress of Steel Slag Utilization and Stabilization Technology. Conserv. Util. Miner. Resour. 2018, 6, 145–150. [Google Scholar]
  3. Ragipani, R.; Bhattacharya, S.; Akkihebbal, S.K. Understanding dissolution characteristics of steel slag for resource recovery. Waste Manag. 2020, 117, 179–187. [Google Scholar] [CrossRef] [PubMed]
  4. Zhang, H.; Liu, X.Y.; Liu, Y. Study on Physical Excitation Mechanism of Steel Slag Tailings by XRD and SEM. Spectr. Anal. 2019, 39, 937–994. [Google Scholar]
  5. Xu, Y.; Wang, Q.L.; Hu, C.H.; Zhang, Z.Z. Research Progress of On-line Reconstruction Technology of Liquid Steel Slag. Multipurp. Util. Miner. Resour. 2019, 2, 1–8. [Google Scholar]
  6. Zhang, Z.L.; Chen, R.; Men, X.R.; Sun, Y. Phase compositions and microstructure of slag in BOF. J. Mater. Metall. 2019, 18, 37–40. [Google Scholar]
  7. Wang, H.G.; Wu, L.; Peng, B.; Yue, C.S. Characteristics and Research Progress of Steel Slag Primary Treatment Technology. Sci. Technol. Eng. 2020, 13, 5025–5031. [Google Scholar]
  8. Hu, S.Y.; Dai, X.T.; Na, X.Z. Treatment Process and Comprehensive Utilization of Steel Slag. Foundry Technol. 2019, 40, 220–224. [Google Scholar]
  9. Chen, B.; Yang, J.-X.; Ouyang, Z.-Y. Life Cycle Assessment of Internal Recycling Options of Steel Slag in Chinese Iron and Steel Industry. J. Iron Steel Res. Int. 2011, 18, 33–40. [Google Scholar] [CrossRef]
  10. Cao, L.; Shen, W.; Huang, J.; Yang, Y.; Zhang, D.; Huang, X.; Lv, Z.; Ji, X. Process to utilize crushed steel slag in cement industry directly: Multi-phased clinker sintering technology. J. Clean. Prod. 2019, 217, 520–529. [Google Scholar] [CrossRef]
  11. Guo, Y.; Xie, J.; Zheng, W.; Li, J. Effects of steel slag as fine aggregate on static and impact behaviours of concrete. Constr. Build. Mater. 2018, 192, 194–201. [Google Scholar] [CrossRef]
  12. Pasetto, M.; Baliello, A.; Giacomello, G.; Pasquini, E. Sustainable solutions for road pavements: A multi-scale characterization of warm mix asphalts containing steel slags. J. Clean. Prod. 2017, 166, 835–843. [Google Scholar] [CrossRef]
  13. Yang, Y.; Yin, S.H.; Xu, C.X.; Mao, H.Y. Study on Industrial Waste Materials as Coal Gangue Recycle Fe Deoxidized with High Grade from Steel Slag. Sichuan Build. Mater. 2015, 1, 81–83. [Google Scholar]
  14. Kumar, D.S.; Sah, R.; Sanyal, S.; Prasad, G. Measurement of metallic iron in steel making slags. Measurement 2019, 131, 156–161. [Google Scholar] [CrossRef]
  15. Wang, Q.; Yan, P. Hydration properties of basic oxygen furnace steel slag. Constr. Build. Mater. 2010, 24, 1134–1140. [Google Scholar] [CrossRef]
  16. Calmon, J.L.; Tristão, F.A.; Giacometti, M.; Meneguelli, M.; Moratti, M.; Teixeira, J.E.S.L. Effects of BOF steel slag and other cementitious materials on the rheological properties of self-compacting cement pastes. Constr. Build. Mater. 2013, 40, 1046–1053. [Google Scholar] [CrossRef]
  17. Duan, S.Y.; Li, X.; Ma, Z.H.; Liao, H.Q. Effect of grinding method on properties of steel slag powder. Mater. Sci. Eng. Powder Metall. 2020, 25, 51–57. [Google Scholar]
  18. Wang, S.J. Analysis on the utilization status and development trend of steel slag. Heilongjiang Sci. 2019, 10, 160–161. [Google Scholar]
  19. Tang, Q.J. Research and development of blasting abrasive made of steelmaking slag. Baosteel Tech. Res. 2015, 5, 23–28. [Google Scholar]
  20. Rao, L.; Chen, G.G.; Zhou, C.H.; Zhou, L. Experimental Research on Steel Slag as Sand-blasting Abrasive. J. Anhui Univ. Technol. 2015, 32, 16–21. [Google Scholar]
  21. Rao, L.; Chen, G.G.; Zhou, C.H.; Zhou, L. Technical Research on Using Steel Slag as Sandblasting Abrasive. Anhui Metall. 2014, 4, 12–15. [Google Scholar]
  22. Zhong, P.; Zhou, L.; Chang, L.Z.; Ding, C.L. Feasibility and Application Effect Research of the Wind Quenching Slag as Sand Blasting Abrasive. Surf. Technol. 2014, 2, 49–54. [Google Scholar]
  23. Zhang, B.; Li, S. Determination of the Surface Fractal Dimension for Porous Media by Mercury Porosimetry. Ind. Eng. Chem. Res. 1995, 34, 1383–1386. [Google Scholar] [CrossRef]
  24. Mandelbrot, B.B.; Pignoni, R. The Fractal Geometry of Nature; WH Freeman: New York, NY, USA, 1983. [Google Scholar]
  25. Chen, Y.; Zhang, J.; Wang, B.; Yao, C. Comparative study of IN600 superalloy produced by two powder metallurgy technologies: Argon Atomizing and Plasma Rotating Electrode Process. Vacuum 2018, 156, 302–309. [Google Scholar] [CrossRef]
  26. Wei, M.; Chen, S.; Liang, J.; Liu, C. Effect of atomization pressure on the breakup of TA15 titanium alloy powder prepared by EIGA method for laser 3D printing. Vacuum 2017, 143, 185–194. [Google Scholar] [CrossRef]
  27. Wang, L.L.; Zhang, Y.Z.; Ke, H.B.; Long, Y. Numerical simulation of molten slag film breakup during granulation process using air-quenching. J. Mater. Metall. 2020, 19, 87–93. [Google Scholar]
  28. Long, Y. Study on Granulation Mechanism and Application of Gas Quenching Liquid Steel Slag; Northeastern University: Shenyang, China, 2011. [Google Scholar]
Figure 1. Experimental chart of gas-quenched steel slag abrasive.
Crystals 11 01377 g001
Figure 2. SEM and EDS images of the sample ((a,c) SEM; (b) EDS).
Crystals 11 01377 g002
Figure 3. Cross-sectional morphology of the sample ((a) Low magnification FESEM micrograph; (b) Enlarged image of (a); (c) Image J images of (b); (d) High magnification FESEM micrograph).
Crystals 11 01377 g003
Figure 4. Schematic of the sample formation ((a) Physical map; (b) Bead formation in five stages).
Crystals 11 01377 g004
Figure 5. Pore size distribution integral and differential curves of the sample.
Crystals 11 01377 g005
Figure 6. Fitting curves of the fractal dimension of the sample.
Crystals 11 01377 g006
Figure 7. XRD of the samples before and after acid–alkali corrosion.
Crystals 11 01377 g007
Figure 8. Microstructure of the sample ((a) 24 h in water; (b,c) 72 h in water; (d) 24 h in acid; (e,f) 72 h in acid; (g) 24 h in alkali; (h,i) 72 h in alkali; (j) 24 h in polishing fluid; and (k,l) 72 h in polishing fluid).
Crystals 11 01377 g008
Figure 9. Energy spectrum analysis of the sample before and after corrosion.
Crystals 11 01377 g009
Figure 10. Surface morphologies of copper and aluminum alloy workpieces ((a) copper alloy before polishing; (b) copper alloy after polishing; (c) copper alloy after polishing without abrasive materials; (d) aluminum alloy before polishing; (e) aluminum alloy after polishing; and (f) aluminum alloy after polishing without abrasive materials).
Crystals 11 01377 g010
Figure 11. Three-dimensional topography of aluminum alloy ((a) before polishing and (b) after polishing).
Crystals 11 01377 g011
Publisher’s Note: MDPI stays neutral with regard to jurisdictional claims in published maps and institutional affiliations.

