Review

Advances in Diffraction Studies of Light-Induced Transient Species in Molecular Crystals and Selected Complementary Techniques

by
Krystyna A. Deresz
,
Piotr Łaski
,
Radosław Kamiński
* and
Katarzyna N. Jarzembska
*
Department of Chemistry, University of Warsaw, Żwirki i Wigury 101, 02-089 Warsaw, Poland
*
Authors to whom correspondence should be addressed.
Both authors contributed equally.
Crystals 2021, 11(11), 1345; https://doi.org/10.3390/cryst11111345
Submission received: 8 September 2021 / Revised: 25 October 2021 / Accepted: 29 October 2021 / Published: 3 November 2021

Abstract

:
The review provides a summary of the current methods of tracing photoexcitation processes and structural dynamics in the solid state, putting major emphasis on the X-ray diffraction techniques (time-resolved Laue diffraction on synchrotron sources and time-resolved serial femtosecond crystallography on X-ray free-electron lasers). The recent developments and nowadays experimental possibilities in the field are discussed along with the data processing and analysis approaches, and illustrated with some striking literature examples of the respective successful studies. Selected complementary methods, such as ultrafast electron diffraction or time-resolved X-ray absorption spectroscopy, are briefly presented.

1. Introduction

The complexity of real-world systems and their transformations makes theoretical predictions often inaccurate or even not feasible. Nevertheless, the knowledge on structural changes, mechanisms and dynamics of various processes is of great importance from both biological and/or technological points of view. Therefore, experimental methods allowing studies of physicochemical changes at the molecular level are of high demand. This way one may obtain direct information on what is happening, which is not achievable theoretically, or validate theoretical predictions, and so the existing computational approaches. Various advanced experimental methods are indeed constantly being developed and applied to investigate the key cases. In this regard light and matter interactions are of great relevance. Some striking literature-reported examples here are the cis-trans isomerization of retinene [1,2], light-to-energy conversion in solar cells [3] or light-induced biological transformations in proteins [4,5,6,7]. The obtained results contribute to our better understanding of biological processes, compounds’ properties and function, and help us to design novel functional materials.
Considering materials of technological relevance, it is worth stressing that the significance of solid-state photoactive materials is constantly increasing. This applies to sensors, optoelectronic devices and ultra-high-capacity data storage media, as well as materials of environmental and biomedical applications. Since potential functional materials should be studied in their technologically-applicable solid-state form, structurally well-defined single crystals appear to constitute excellent model systems to mimic real-world situations, but also to supplement the solution-sample studies, or model the inter-surface environment. The conversion of light energy into some sort of other action, such as charge transfer, can further trigger transformations in which molecules change their geometry, function, emit photons of different energy, etc. The resulting structural distortions in the case of single crystals can be explored via X-ray diffraction techniques which provide a full three-dimensional experimental picture of crystals.
Application of X-ray diffraction methods to samples excited using some source of UV-Vis light (e.g., laser, light-emitting diode (LED), Xe lamp or, even, the sunlight) is called most commonly photocrystallography, or photodiffraction [8,9,10]. This way one can track light-induced processes taking place in the solid state via observation of structural changes, as well as study metastable or short-lived excited states in crystals. In this contribution major attention will be paid to the challenging investigations of the very short-lived excited-state species (lifetimes shorter than microseconds). Such experiments are technically advanced while the collected data requires novel methods of data handling and analysis [8,11,12,13,14]. Studies of short-lived light-induced excited states in crystals of small molecules are currently feasible almost exclusively at high-intensity X-ray sources, such as synchrotrons [12,15,16]. The time-resolved (TR) X-ray diffraction Laue method, applied originally for macromolecular samples [6,7,14,17], constitutes the most efficient approach, as it allows effectively single-pulse diffraction experiments thanks to a superb X-ray flux. Since the data processing in the case of a polychromatic X-ray beam is considerably more difficult when compared to the monochromatic approach [11], here we shall describe both small- and macromolecular Laue data handling methods.
Time-resolved laser-pump/X-ray-probe approach (Figure 1) yielded in the past years interesting results regarding reactions in proteins [6,7,14,18], such as a state-of-the-art study by Šrajer et al. on photolysis of the carbon monoxide complex of myoglobin and excited-state species in crystals of transition-metal coordination compounds [13,19,20,21,22,23,24,25]. As far as the Laue method is concerned most advances have been recently made in handling of the polychromatic-radiation data sets, which facilitated tracing structural changes also in small-molecule crystals. Furthermore, more and more is being experimentally possible nowadays using X-ray free-electron lasers (XFELs) or electron diffraction (ED) techniques, thus the current experimental capabilities in these fields will also be discussed in this contribution and illustrated by the most striking literature-examples of successful studies. Finally, some complementary TR methods enabling tracing transient species, namely X-ray absorption spectroscopy techniques, will also be mentioned.
On the whole, this short review is thought to provide a summary of the methods of tracing excitation processes and structural dynamics in the solid state, indicate some of the recent important results, and constitute a valuable source of information on what has already been conducted in the field, as well as on the current research possibilities. The latest trends are described along with the data processing and analysis methods.

2. Time-Resolved Photocrystallography

As it has been mentioned, one of the most straightforward approaches of examining structural dynamics in crystals is to derive the geometry of transient species by using crystallographic methods. If one can obtain reliable X-ray diffraction data at any chosen point in time relative to the moment of excitation, and process such data correctly, then it is possible to reproduce the so-called “molecular movie” almost frame by frame. Although it sounds simple, in practice it is a very challenging task due to the demanding experimental requirements, various technical issues and specific data handling techniques. The entire class of such methods is unified under the broad term of time-resolved photocrystallography. Current possibilities of the TR photocrystallographic methods and future prospects will be discussed in this section.

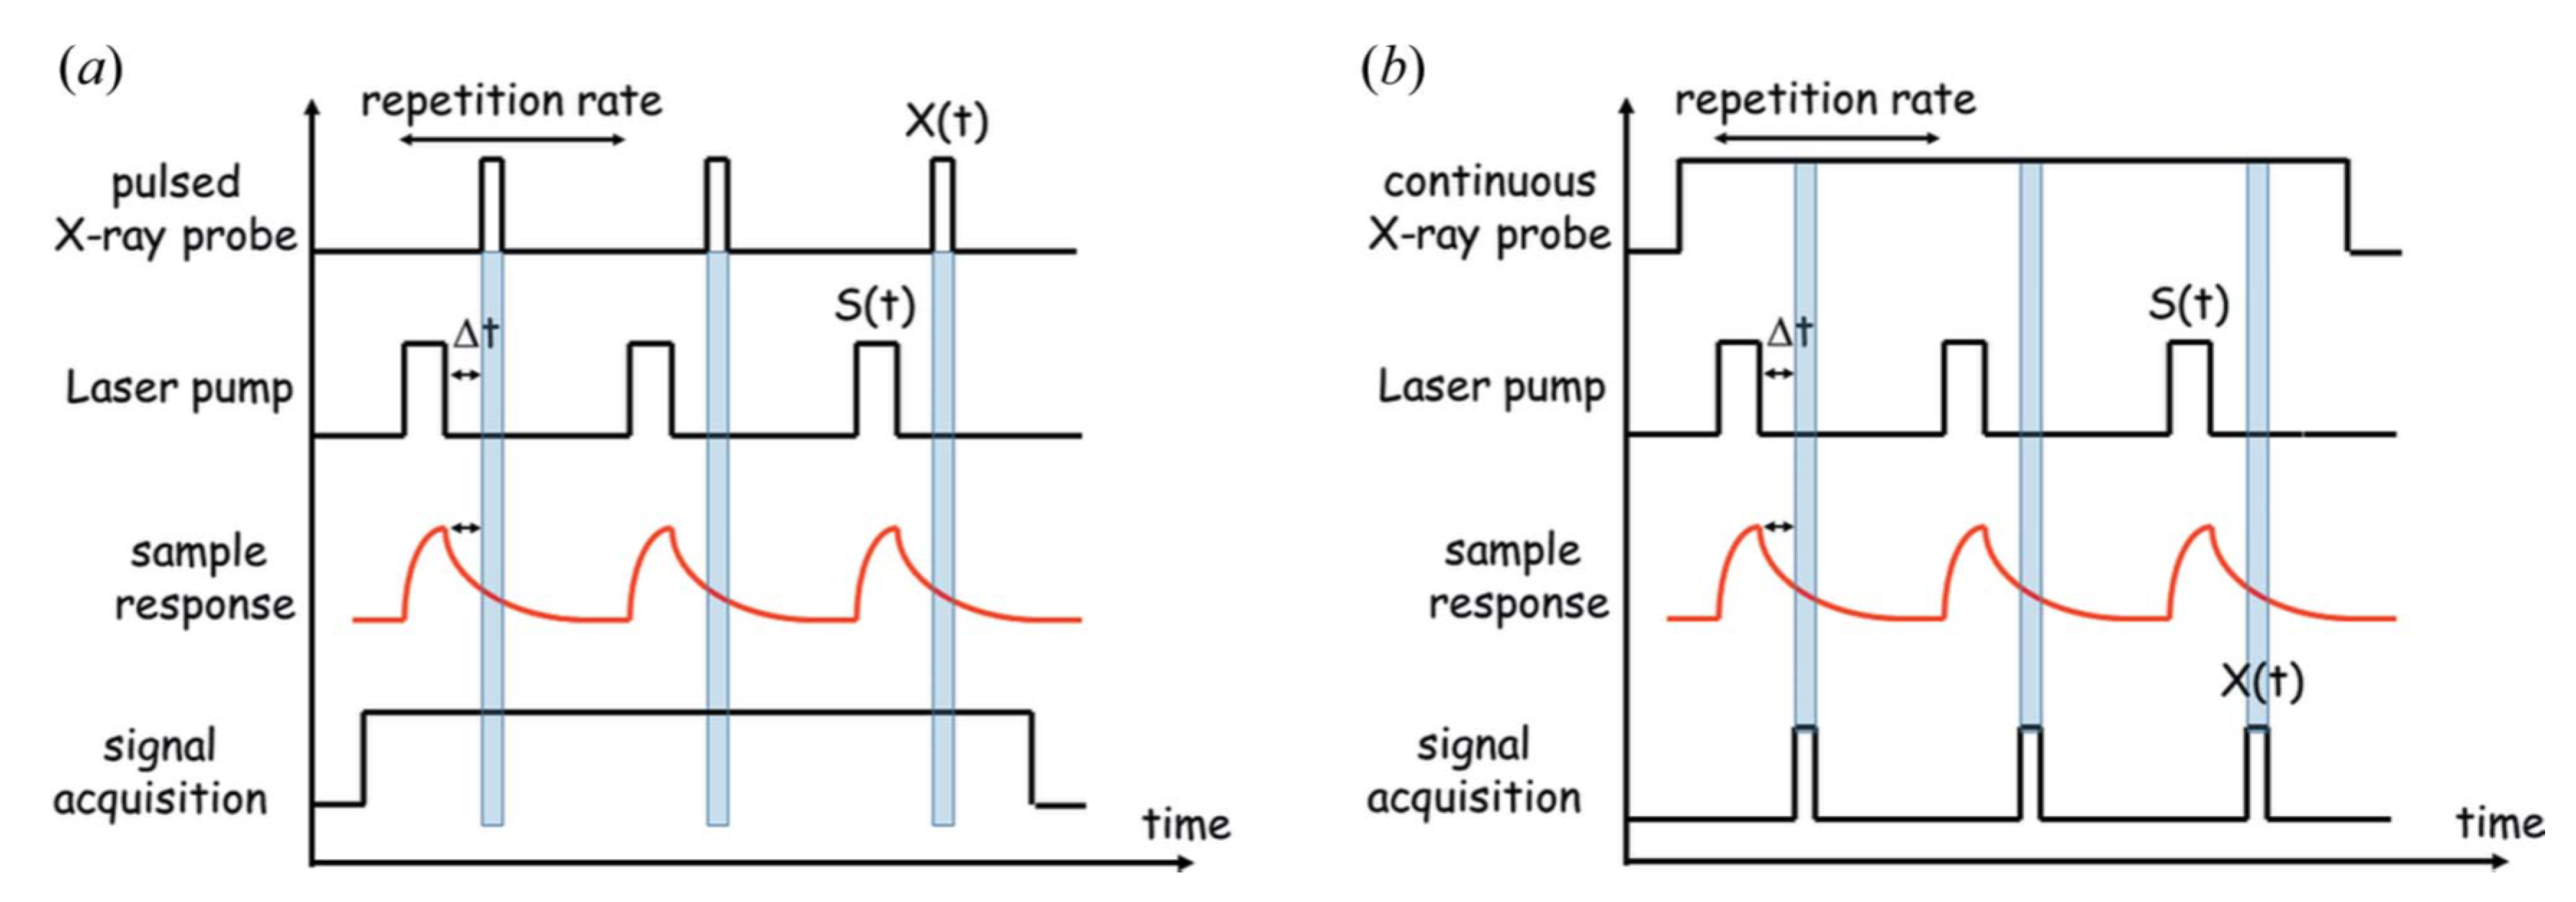
2.1. Experimental Approaches

Photocrystallographic experiments can be classified by the temporal relation between the excitation source and the probing X-ray radiation. Consequently, there are four different approaches to study light-excitation products in crystals: a static experiment (Figure 2a), a quasi-static experiment (Figure 2b), a stroboscopic experiment (Figure 2c) and, finally, the pump-probe experiment (Figure 2d).
Obviously, when employing the first two methods, i.e., the static and the quasi-static techniques, the time-resolved studies are not possible. Nevertheless, these approaches are often useful when determining whether a given sample deserves further examination by more complex TR methods. In the static approach the crystal sample is exposed to a continuous light source (e.g., Xe lamp or light-emitting diode) for a given period of time, after which it is examined using the X-ray diffraction technique. Hence, in practice the static method constitutes a standard crystallographic experiment performed for the light-induced single-crystal sample, thus it is usually applied using a laboratory (or “in-house”) X-ray radiation source. Importantly, since the whole crystallographic measurement is conducted after the sample irradiation, i.e., significantly later than the photoexcitation takes place, the generated structural changes have to be rather long-lived, if not permanent (e.g., the photoreaction leads to a stable product; it is not reversible). In some cases of the reversible processes the lifetime of excited-state species, or photoreaction products, can be sufficiently elongated by lowering the temperature [26]. On the other hand, in the quasi-static method a pulsed light source is used. Laser pulses periodically excite the sample during the X-ray diffraction measurement. The population of the excited state species is then on average constant during the entire experiment [27]. This allows examination of relatively shorter-lived species, which would otherwise relax back to the ground state. Since these two methods do not require any specific and advanced experimental setups, they have been used extensively to study structural dynamics of a variety of systems, with particular emphasis on photo-switchable materials undergoing for example photoisomerization or reversible photolysis [28,29,30,31,32,33,34,35,36,37,38,39,40,41,42,43,44,45,46].
As far as the time-resolution is concerned, it can be achieved by utilizing pulsed X-ray radiation. In the stroboscopic experiment, the sample is excited in the same manner as it is conducted in the quasi-static method, however, the X-ray pulses are synchronized with the laser. In turn, in the pump-probe experiment, the laser and X-ray pulses are perfectly synchronized, so that the emergence and dissipation of the metastable state can be tracked with full time resolution (in contrast to the stroboscopic method in which the excited-state population is being built-up). The pulsed X-ray radiation is most readily available on several selected synchrotron beamlines (the time structure of the synchrotron beam, consisting of series of pulses, is well suited for TR experiments), however, some approaches to generate intense X-ray pulses in laboratory conditions were tested and recently applied to TR studies of small-molecule crystals. The methods using synchrotron and in-house techniques will be discussed in the following sub-sections separately.

2.2. Synchrotron Facilities for TR LAUE Studies

In recent years, one of the major developments in the field of pump-probe photocrystallographic experiments was the application of the Laue method to collect TR X-ray diffraction data. Initial studies for small-molecule crystals were performed with monochromatic radiation, mostly using the stroboscopic technique. A couple of important results were obtained in this way, including determination of the excited-state structure of the platinum [47] or copper complexes where the excimer formation was recorded [48]. Moreover, diffuse scattering and structural dynamics studies of a purely organic tetrathiafulvalene-p-chloranil cocrystal system [49,50] constitute an interesting example here. It should be noted, however, that the intensity of the monochromatic synchrotron radiation is significantly reduced with respect to the available primary X-ray beam. Instead, in the Laue method polychromatic probing pulses are used, which allows for much higher intensity of the incident beam. This is especially desirable when conducting time-resolved studies on short-lived metastable species in solids, as it enables obtaining sufficient signal even from little populations (0.5−5%) of excited-state species in crystals. In fact, the primary objective of using the polychromatic beam was to study protein crystals, which generally diffract rather poorly and must be studied with intense X-ray sources [51,52,53]. There are three main beamlines allowing such TR pump-probe experiments: 14-ID-B at the Advanced Photon Source (APS; Chicago, IL, USA) [54], ID09 at the European Synchrotron Radiation Facility (ESRF; Grenoble, France) [55,56] and NW14A at the Photon Factory Advanced Ring (PR-AR; Tsukuba, Japan) [57]. Additionally, some new beamlines with pump-probe capabilities are being recently commissioned, such as the TPS 15A beamline at the Taiwan Photon Source [58].
The mentioned beamlines are specifically designed for the laser-pump/X-ray-probe experiments. The synchrotron beam consists of a series of consecutive pulses called a synchrotron train. In call these cases the most intense X-ray pulses are generated by a set of undulators (see Table 1 for short characteristics of the beamlines)—state of the art synchrotron insertion devices. The structure of the beam depends on a filling pattern of the storage ring, but generally a single polychromatic “pink” beam (i.e., narrow band) X-ray pulse amounts to about 1010 photons or more. Obviously, it is impossible to use all pulses of the X-ray primary beam, thus at each beamline a specific protocol is utilized to isolate a single X-ray pulse. A very good general description of the method was provided by Graber et al. [54] (Figure 3). The synchrotron train is first attenuated by the water-cooled high-heat-load chopper, and later the combination of millisecond shutter and fast rotating triangular Jülich chopper facilitates a single pulse isolation. X-ray and laser pulses are then synchronized electronically with a FPGA (field-programmable gate array) module. Each beamline is equipped with a variety of pico- or nanosecond lasers to study a large array of samples.
The data collection conforms usually a fixed target (sample) mounted on a translating and/or rotating stage (frequently a single- or multi-axis goniometer) allowing for changing the orientation of the specimen during the experiment. In the case of polychromatic radiation, in order to collect single Laue image the crystal is kept still while it is exposed to the X-ray beam. All reciprocal nodes which fall in-between the limiting Ewald spheres with radii of λ min 1 and λ max 1 fulfil the diffraction conditions, thus may be recorded on a detector. A full data set is composed of images collected at different crystal orientations usually obtained by rotating it from frame to frame along the specified axis (e.g., perpendicular to the X-ray beam direction).

2.3. Processing of TR Laue Data

One of the most demanding aspects of the polychromatic TR method is the data analysis. Dedicated software has been developed over the years, and toolkits such as LAUEGEN [59,60], LAUEVIEW and PRECOGNITION [61], LAUEGUI [62] or LAUEUTIL [63,64] have already been reported. Some of them are highly successful in analyzing data for macromolecules, where the diffraction patterns are “dense” and the collected data is usually of very good quality and high completeness. This is unfortunately rarely the case for small-molecule crystals, thus there is still high demand for new ideas and algorithms regarding fast and efficient processing of Laue data collected for systems of this kind. The recorded reflection positions cannot be directly used to reconstruct the reciprocal lattice due to the unknown X-ray wavelength associated with each diffraction spot. For this fundamental reason, the tools to analyze the Laue data have to overcome the arising complications in both integration and indexing of detected reflections. Even then, the data is still difficult to process, since the refinement procedure usually requires accounting for several wavelength-dependent factors, such as absorption of the crystal sample. Both LAUEUTIL and PRECOGNITION programs offer different approaches in resolving these issues, which will be presented in the following paragraphs.

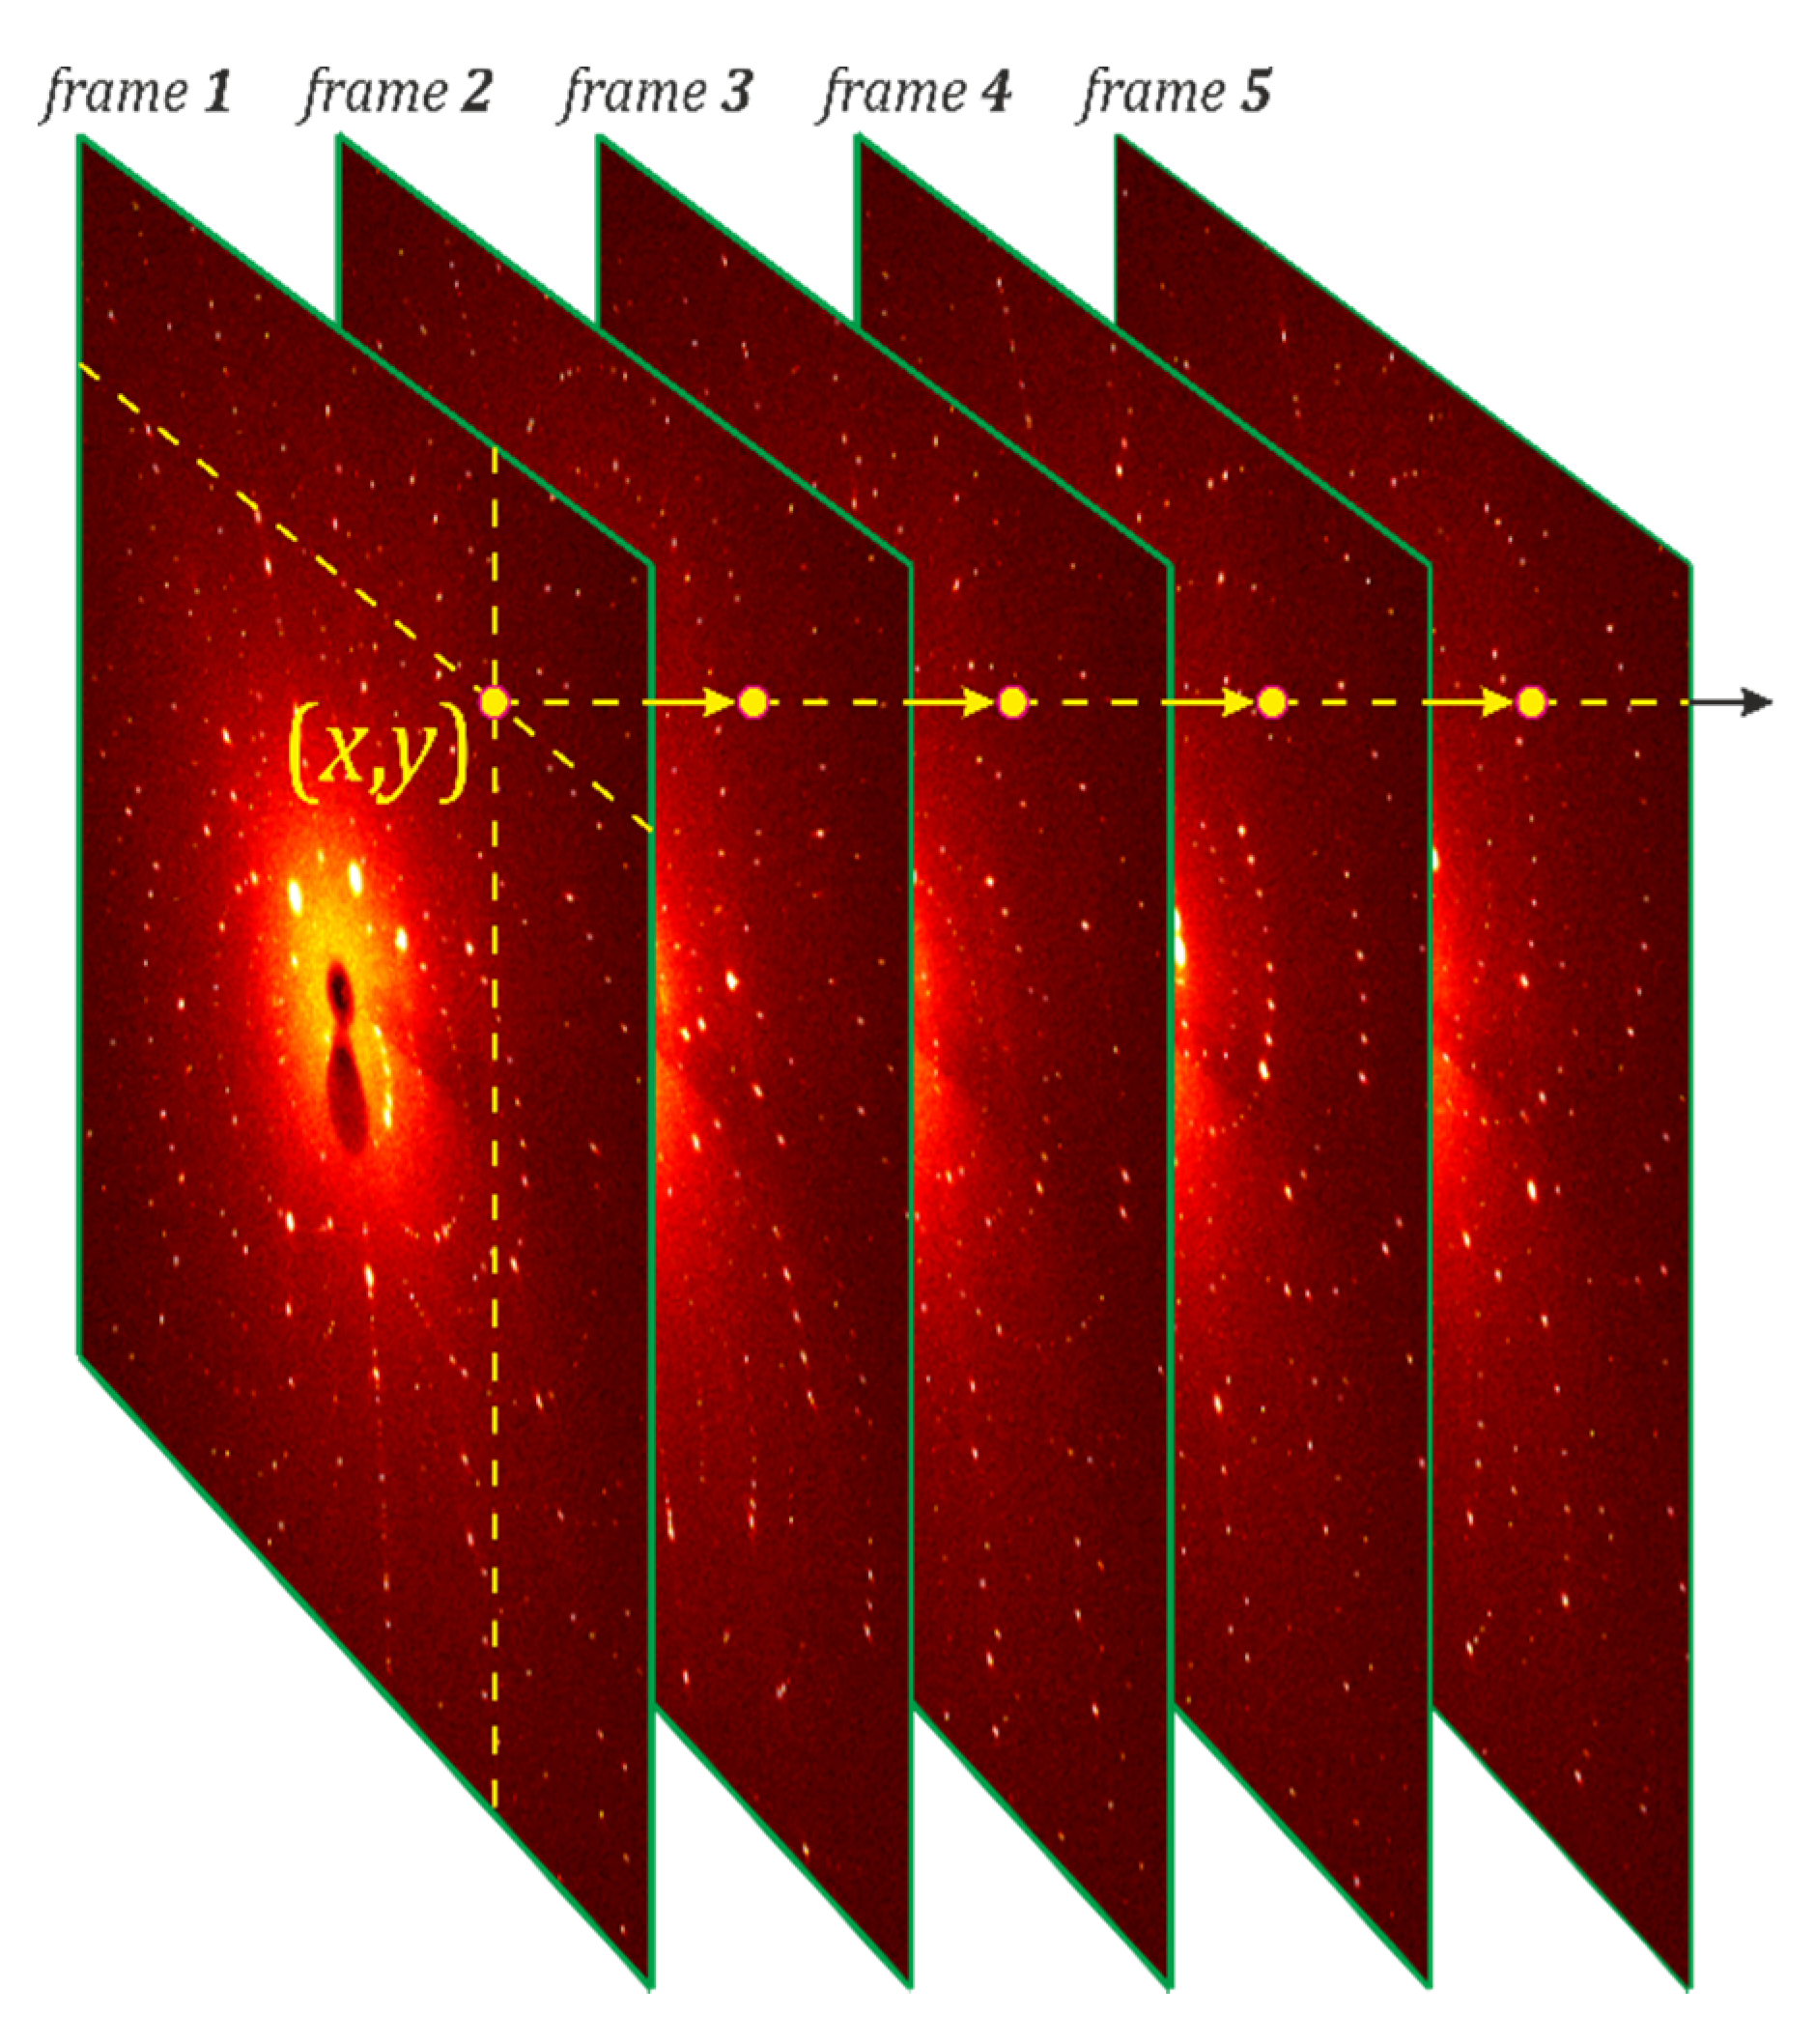
2.3.1. Signal Searching and Integration

The first step of data analysis is to locate and quantify the reflections collected on the detector. The PRECOGNITION software treats each frame in a dataset separately. Firstly, images are inspected for spots fitting a rough profile pre-determined by user. Such a profile is composed of an estimated overall spot size, as well as minimal signal-to-noise ratio of a reflection. Once the spots in each frame are located, new spot-profile parameters are extracted by calculating the mean of the above-mentioned parameters for detected spots. Then, the procedure of spot-finding is repeated, this time with refined profile parameters, which yields more accurate spot locations. Finally, a procedure of recognizing Laue ellipses is applied to identify nodal spots and find the beam-center. In order to obtain the intensity of each reflection contributing to the detected spots, an integration procedure is invoked. This consists mostly of evaluating and subtracting local background for each spot, differentiating between spatially overlapping reflections in each spot and assigning an integrated intensity value for each reflection. PRECOGNITION offers multiple methods of integration, which can be divided into two categories: summation methods and profile-fitting methods. The summation methods offer a quick and rather primitive integration, i.e., integrating spots over a fixed area around it, usually with limited spatial deconvolution of reflections. In the profile-fitting integration methods the profile of reflections in a given frame can be assumed either on the basis of the most prominent and best-separated spots found in the image (numerical profile fitting), or using a well-known reflection profile (analytical profile fitting). Overall, the entire procedure of signal searching and integration in PRECOGNITION can be described as frame-by-frame processing coupled with recognition of characteristic Laue patterns.
In the case of LAUEUTIL an entirely different approach to signal search is employed [64]. The algorithm here takes advantage of the fact that the dataset is 3-dimensonal, i.e., it contains two physical dimensions of the area detector and additionally the frame number. The dataset is treated as a whole, where pixels are grouped together with respect to their detector coordinates on different frames. This results in 1-dimensional sets, or vectors, containing the information on the intensity distribution of a single pixel among all the frames in the dataset (Figure 4). In order to evaluate whether a pixel contains signal in a given frame, a Kruskal–Wallis test is applied recursively. Quite recently an alternative signal-detection method, the so-called seed-skewness algorithm [65,66,67], has been implemented and shown to yield comparable results in terms of extracting weak signal on a frame, while keeping the background filtering procedure at the same level of efficacy [68]. In either case, if a pixel does not contain signal, it is discarded from further processing, and treated as a part of a background mask. Once the signal is distinguished among all the frames, it can be integrated. In order to take into account the usual spatial distribution of reflection spots, sets of pixels which remain after background mask subtraction on each frame are treated with a series of morphological operations [69]. These operations include erosion (to remove single pixels), dilation (to revert signal retraction caused by erosion) and “hole filling” (to prevent non-physical reflection discontinuities). A similar “statistics-based” approach was also proposed by Straasø et al. [70]. Their method uses the variance minimization criterion to separate the signal and background regions. However, it has not been applied in TR Laue studies yet.

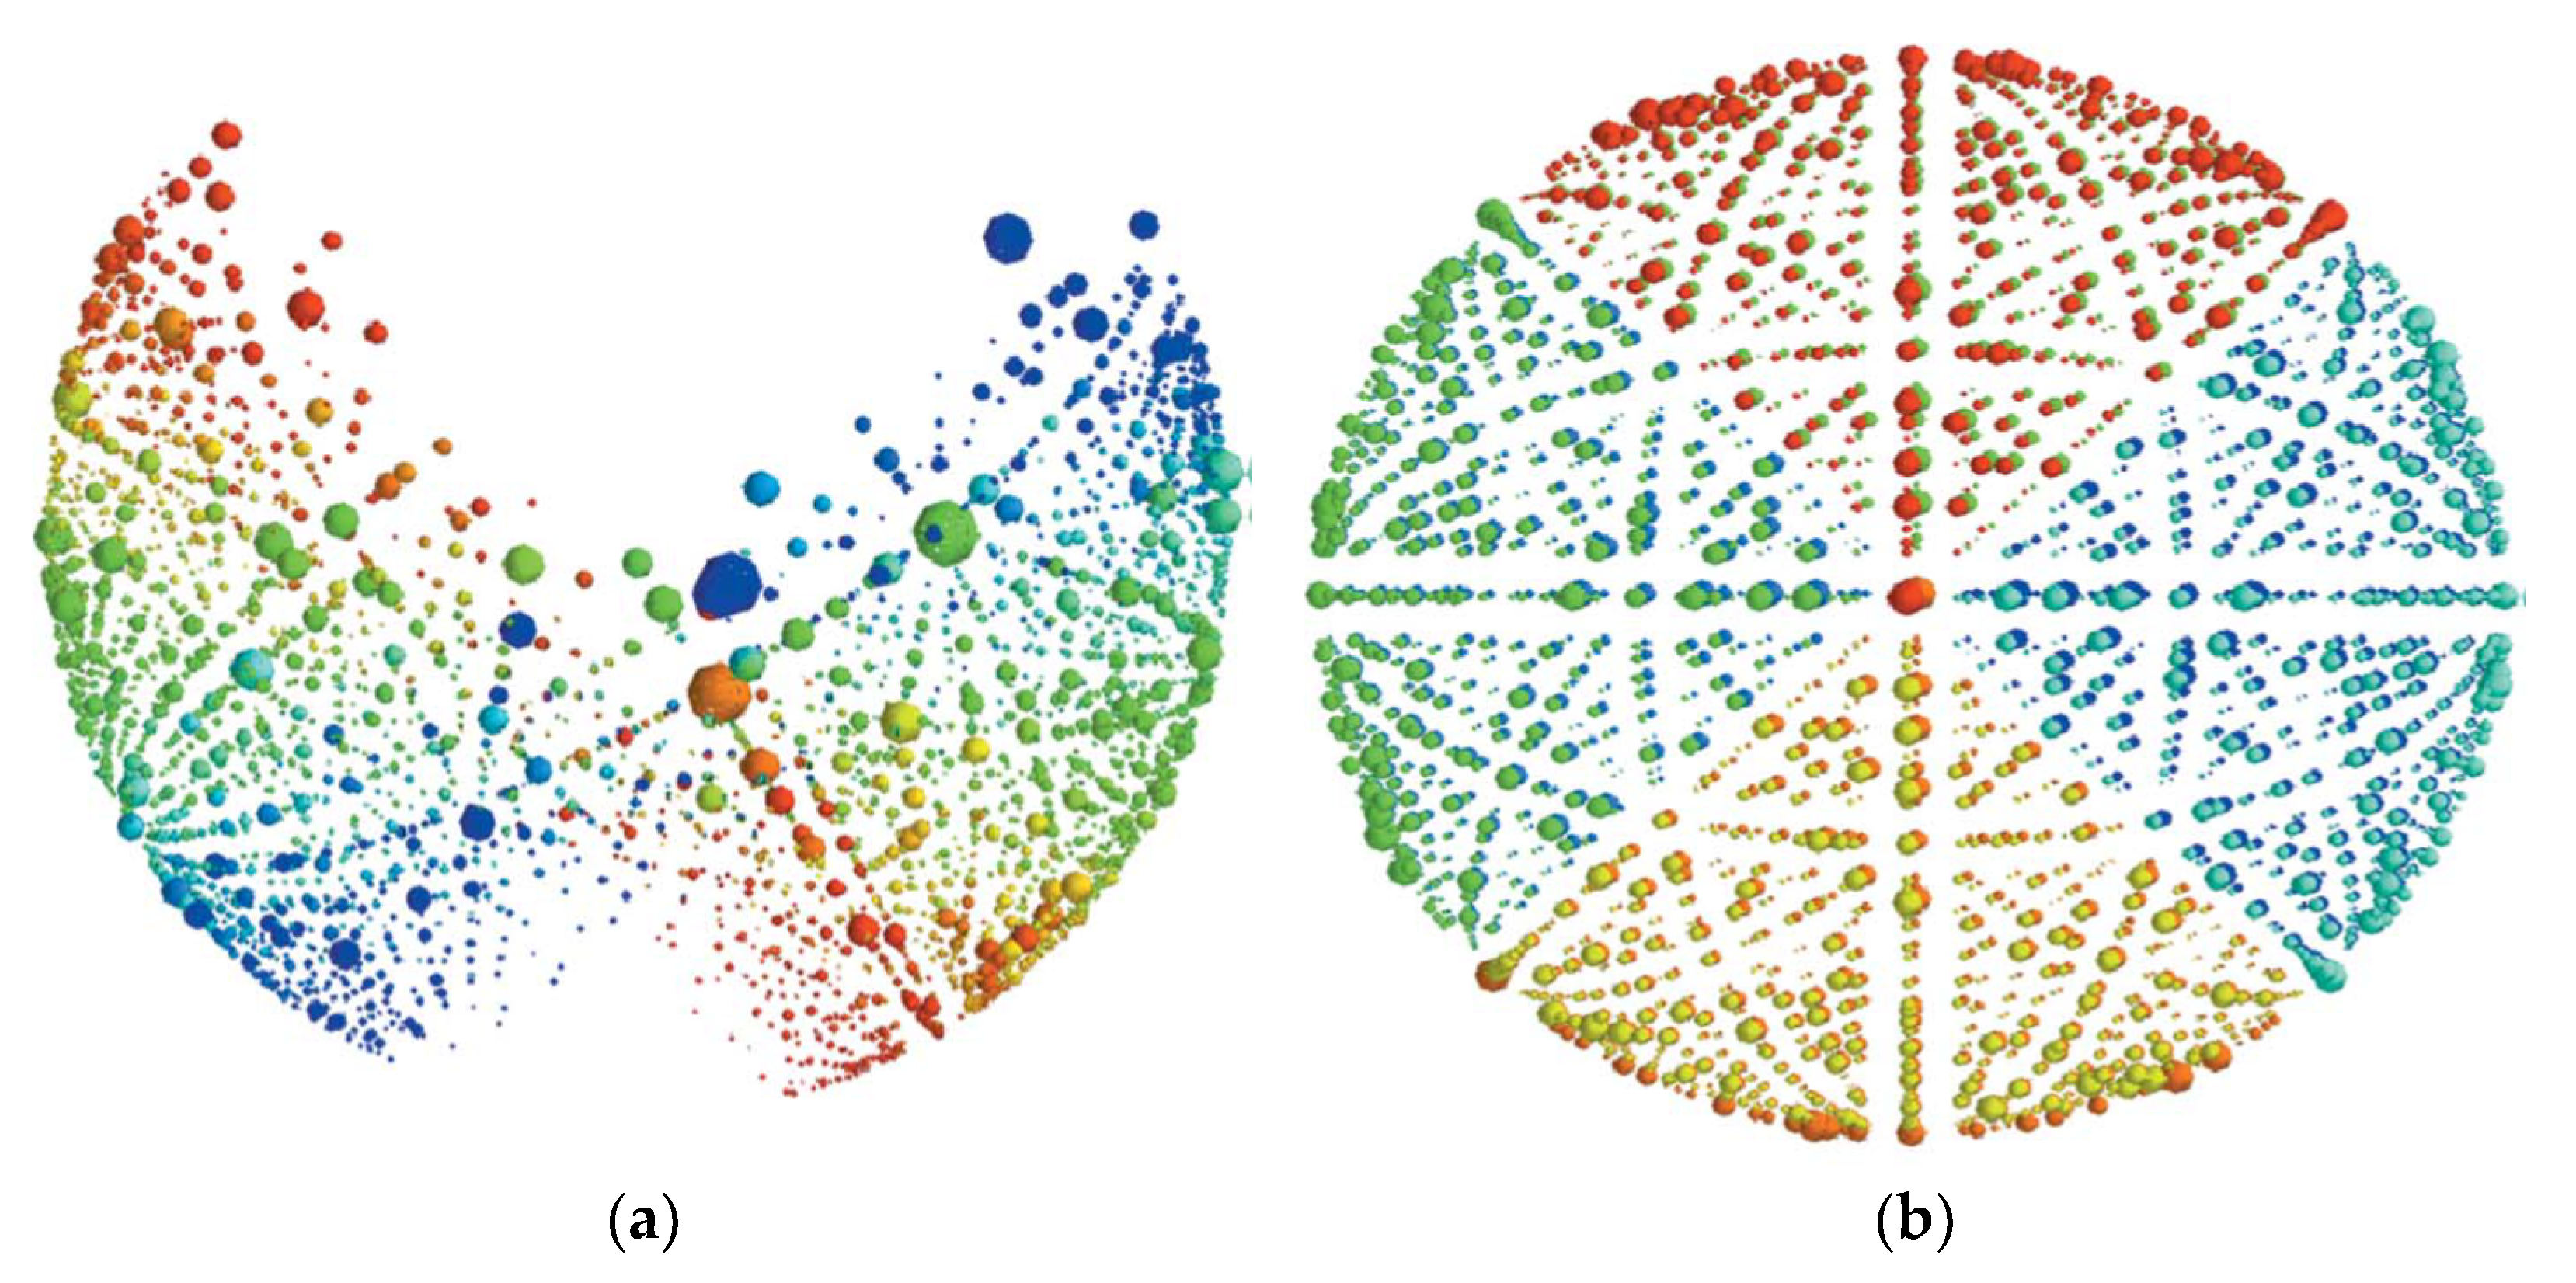
2.3.2. Sample Orientation Determination

Having identified diffraction spots, it is necessary to ascribe their respective (Laue) indices. Since the proper assignment is heavily dependent on the incident beam wavelength, some ingenuity is required to overcome these issues. Most importantly, the orientation matrix, which unambiguously defines the spatial orientation of a crystal lattice in a given dataset, should be found. In PRECOGNITION possible orientation matrices are calculated on the basis of the identified spots. These can be then used to generate the theoretical diffraction patterns, in order to hand-pick the crystal orientation matrix which best recreates the data. Additionally, such matrix can be chosen or discarded manually by the user. This approach is highly dependent on the quality of the available data and the sheer amount of distinct reflections detected on a single frame (which is significantly greater for macromolecules). The assignment occurs for an arbitrarily chosen frame, which is sufficient, since once the crystal orientation matrix is known at any given angular position, it is known for the whole dataset. Furthermore, this method is extremely sensitive towards any mismatch between the actual and input experimental setting parameters. Among these, the most important ones are the primary beam position and the crystal-to-detector distance. PRECOGNITION offers an instrument-model refinement procedure so as to optimize these parameters, which increases the number of properly indexed reflections.
In the LAUEUTIL program a novel approach to assigning orientation matrices is implemented, designed specifically for small- and intermediate-size molecule data [63]. All of the reciprocal-space vectors with unknown indices are projected onto a unit sphere (Figure 5). The same procedure is conducted for a separate, reference data set containing data from the monochromatic measurement of the same crystal at the same temperature. By grouping the projected vectors into clusters and subsequently comparing the spheres created for the collected Laue data with their analogues created for the reference monochromatic data, it is possible to match these patterns and find the orientation matrix for the Laue dataset. Similarly, as it is the case in PRECOGNITION, the experimental setup parameters are of extreme importance to properly obtain the crystal orientation matrix. Originally LAUEUTIL came with no toolkit to refine these parameters, however, recently an instrument-model refinement method has been reported by [71], and successfully applied to the cases where the assumed experimental values were off from their initial estimates. Finally, it should be noted that novel algorithms of this kind still emerge, as for example the new PinkIndexer module developed by Gevorkov et al. [72].

2.3.3. Structure Refinement

The last few steps of Laue data processing are thought to account for numerous corrections present in the case of a polychromatic experiment. The PRECOGNITION software provides appropriate tools to take into account, for example, sample’s anisotropy, beam polarization and crystal mosaicity, as well as perform intensity scaling and data reduction. The absorption correction can be taken into account in a local scaling procedure. Other than that, the structural refinement of the data is similar to that performed routinely for regular monochromatic X-ray diffraction data.
In turn, LAUEUTIL contains modules employing the idea of the so-called RATIO method [73]. In order to apply this concept, at the data collection stage frames with and without light exposure are registered (the so-called light-ON and light-OFF frames, respectively). In consequence, after processing the light-ON and -OFF reflection intensities are available. In the RATIO method the ratios of such quantities are further analyzed. Assuming that the unit cell size does not change upon laser-light excitation (which is the case for the relatively fast TR experiments; especially when the pairs of light-ON and -OFF frames are collected consecutively), it can be shown that most of the wavelength-dependent corrections cancel out. The intensity ratios contain then only the information about the excited-state structure and its relation to the reference ground-state structure. Such ratios can be treated similarly to the intensity values themselves. For instance, they can be scaled and merged (for example with the SORTAV program [74,75,76,77,78]) to yield photodifference maps, study excitation anisotropy, or to be used in the so-called response-ratio structure refinement [11,79,80,81] with some software developed especially for these cases, e.g., the LASER program [82]. The modified RATIO method has also been used in the macromolecular case [51].

2.3.4. Software Comparison

These two toolkits, despite seeking to solve the same issues, are in fact fundamentally different as far as the implemented approach is concerned. While PRECOGNITION is more versatile, and its algorithms are engineered in a way that particularly favors macromolecular systems, LAUEUTIL is tailored to process Laue data collected for crystals of small- to medium-sized molecules. The latter takes full advantage of the nature of photocrystallographic measurements, where the geometry of a ground state is often known before the experiment. Initial comparisons regarding the indexing capabilities were performed by Kalinowski et al. [63] showing the robustness of the proposed indexing procedure working in the normalized reciprocal space comparable to the PRECOGNITION algorithm. Recently, more comprehensive comparison of these toolkits has been conducted by Velazquez-Garcia et al. [83], who worked on TR Laue data processing for a tetranuclear FeII complex. The results have shown that the PRECOGNITION software is better suited for monitoring larger changes between the ground and metastable state, while LAUEUTIL performs more efficiently for samples which experience lesser conversion rates. Lastly, in the field of TR data processing, a simple correlation plot method of evaluating light-response of a system has been documented [84]. As the synchrotron beamtime is very valuable, such a plot provides some prescience of the quality of potential data prior to a full-scale experiment.

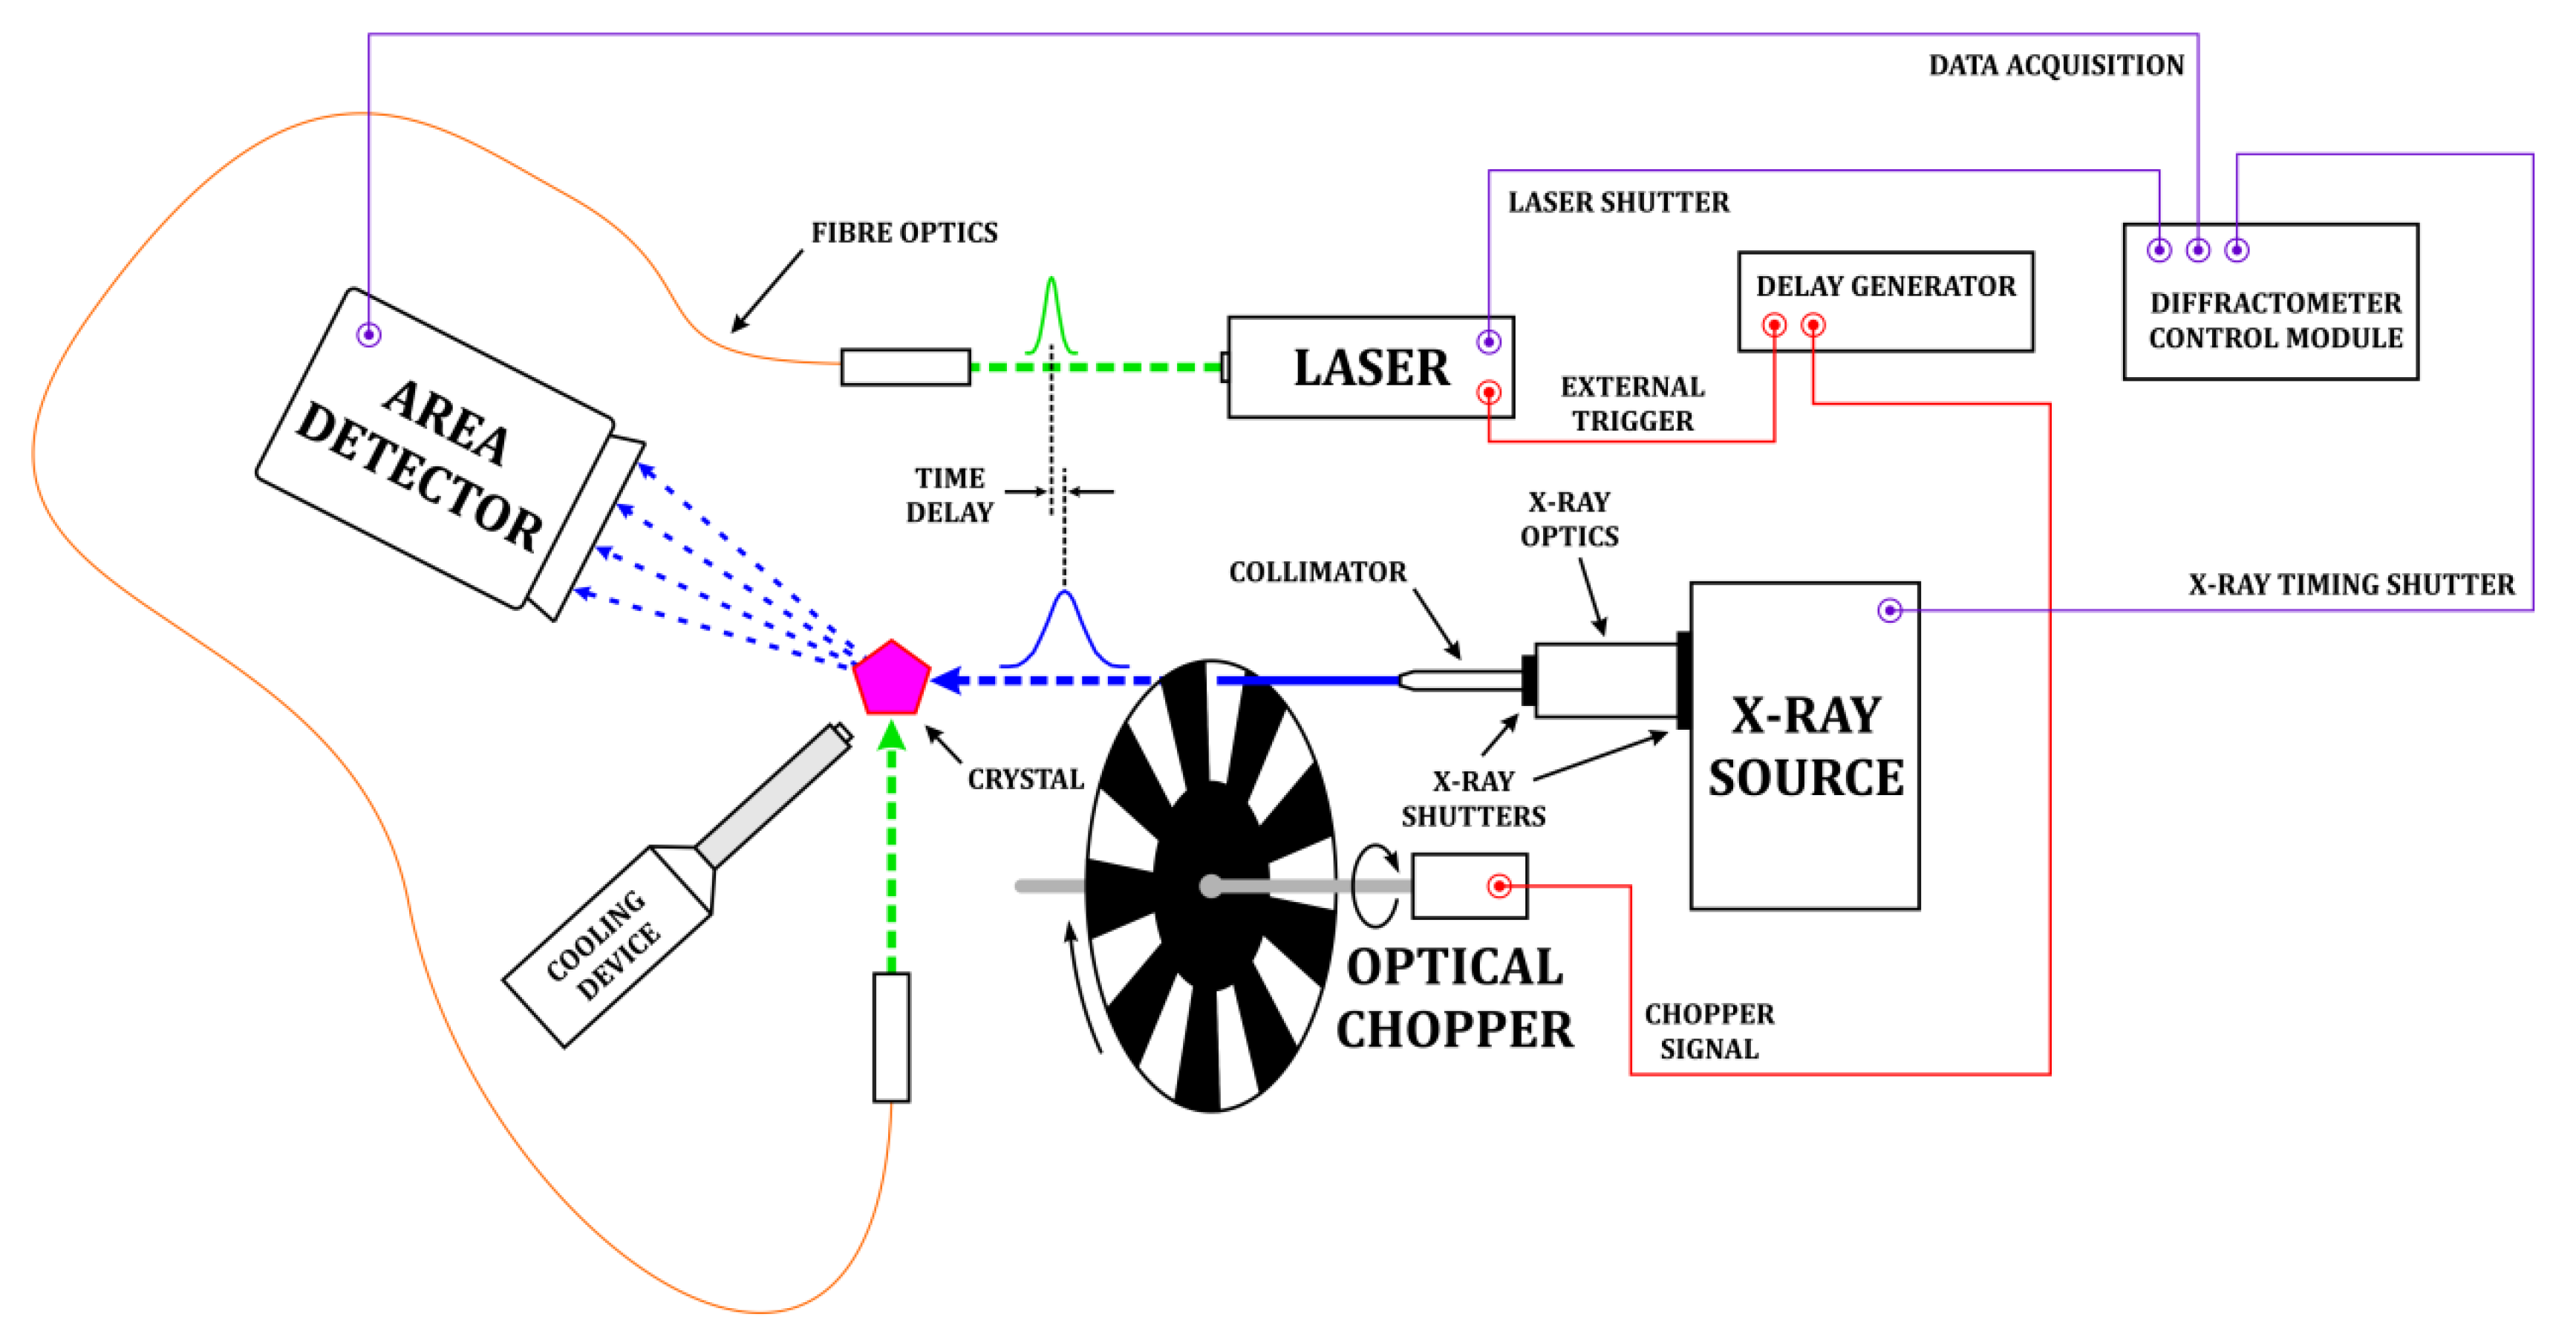
2.4. In-House TR Diffraction Studies

Finally, it is worth mentioning that the recent developments in the field of time-resolved photocrystallography are directed towards the application of in-house X-ray sources, much more common and accessible than synchrotron beamlines. Surely, it is not an easy task, however, to date there have already been reported some successful experiments of this kind obtained using two approaches which are schematically depicted in Figure 6. The first method is analogous to the one described above regarding synchrotron studies, i.e., the pulsed X-ray source is used while the detector (e.g., CCD one) registers the data continuously. The time resolution obtained in this method reaches about 100 ps in the case of synchrotron sources, whereas the time resolution available using laboratory diffractometers is in the order of microseconds. The second technique takes advantage of modern detectors called hybrid-pixel-array detectors (HPADs). Such a detector is fast enough to perform a quick gated readout while the structure relaxes to the ground state. It is also possible to set multiple gates in the detector readout system in order to record a number of different time points during a single experiment. In this case the time resolution is limited by the speed of the detector readout and currently reaches milliseconds. Therefore, this approach is suitable for investigations of relatively slower processes, such as switching reactions during which significant molecular rearrangements take place.
To date, two examples of the so-called in-house studies following the first method have been reported. These include the comparison between the in-house obtained photodifference maps and the respective results from the Laue diffraction method applied at the synchrotron (described further) [86], and, also, the study of the photoactive organic molecule with the long-lived phosphorescence [87]. For that purpose, a significant modification of the laboratory diffractometer was performed [88]. This concerned the installation of the light-delivery device [89,90] and a rotating chopper as an X-ray pulse “generator”, as well as the electronic and software system coupling the X-ray source with the laser into a single data collection module. Schematic layout of the designed setup is presented in Figure 7. The X-ray source produces continuous primary beam which is then cut into pulses by the rotating chopper located right in front of the collimator. The location of the chopper forced the design of the appropriate enclosure to possibly reduce the disturbance of the cryostream due to the air flow [91]. In the used experimental setup, the X-ray beam generated by the molybdenum rotating anode has a diameter of about 0.2–0.3 mm. To achieve a selective pulse generation, the chopper blade must have slots of similar or larger size. This allowed using the 445-slot blade, yielding the 4.17 µs X-ray pulses. However, longer pulses can be relatively easily generated by adjusting of the chopper rotation speed and selecting different “chopping” discs. It should be mentioned here that the application of a bright X-ray source is crucial since about half of the beam intensity is blocked by the chopper. The chopper is synchronized with the laser pulses via the delay generator. For both the laser and the X-ray light the timing is set using a system of photosensitive diodes.

2.5. Case Studies

Since the TR Laue method had been first applied to macromolecular systems, some tremendous developments of the experimental setup and data processing algorithms for such cases were reported in the past [14,54,55,61,92,93,94,95]. As has been already mentioned, later the efforts regarding data collection and processing handling have been shifted towards investigations of small-molecule systems which have been recently more explored. In turn, biologically important macromolecular cases are nowadays intensively examined using XFELs, which would be the subject of the next chapter. Consequently, in this section selected examples of the most recent studies on small-molecule crystals using the TR diffraction techniques will be presented, both for Laue and in-house approaches.
A study undertaken by the Coppens group on the Rh2(µ-pnp)2(pnp)2·(B(Ph)4)2 (pnp = MeN(P(OMe)2)2) complex [96,97] constitutes an excellent example of the application of the TR Laue technique to a small-molecule crystal [24,25]. The complex molecule in the solid state contains four ligands, out of which two are bridging ligands linking the Rh centers together. Additionally, the rhodium atoms interact with each other. The solid under study, namely the α polymorph, when excited with the 337 light exhibits phosphorescence shows two bands with emission maxima at 730 and 780 nm. Both bands are visible at very low temperatures (at 10 K the determined lifetimes are 35.3(2) and 46.5(3) µs, respectively), whereas the higher-energy band tends to vanish above 50 K. The TR Laue experiment was then conducted at rather high temperature of 225 K, assuming only one type of excited-state (attributed to the 780 nm emission) is present under such conditions, lifetime of which is not shorter than 100 ps. The second reason for running the experiment at higher temperature is that the Laue patterns do not show any elongated spots, as it has been the case at low temperatures (most probably due to some strains existing in crystals at low temperature). The obtained photodifference map clearly shows shifts of the Rh atoms in the excited state in respect to the ground state (Figure 8). Further structure refinement resulted in the determination of the Rh⋯Rh interaction shortening by 0.136(8) Å, being the result of the core-centered electronic transition (from the antibonding to bonding orbital). The experimental findings for the geometry distortion were also modelled using quantum-mechanics/molecular-mechanics (QM/MM) approach yielding excellent comparison, thus confirming the validity of the TR Laue result.
The second example here comprises a model and very illustrative study dedicated to the tetranuclear silver(I)-copper(I) complex [21]. The molecule contains two copper and two silver centers arranged in a “zig-zag” manner and stabilized by four ligands (diphenylphosphino-3-methylindole). The complex crystallizes in the P 1 ¯ space group with one molecule in the asymmetric unit and exhibits a rather bright orange-red phosphorescence when excited with the UV light (ca. 1 µs excited-state lifetime). The large Stokes shift suggested that some significant structural changes probably occur in the sample under light irradiation. This assumption was confirmed with the TR Laue technique. The crystals were pumped with the 390 nm light pulses from the Ti:Sapphire laser (pulse duration ~40 ps) and probed after 100 ps with ca. 100 ps long X-ray pulses. The subsequent data processing utilizing the methods described in the previous chapter yielded a photodifference map of an unprecedented quality (Figure 9). It clearly indicated the metal-atom shifts and, consequently, the way in which the metal core undergoes deformation. Further structural refinement with the LASER program showed that the Ag⋯Ag distance shortens by 0.38(3) Å. The resultant bond length (2.66(3) Å) becomes comparable to the shortest argentophilic interactions reported in the literature [98]. The chemically-intuitive simple explanation is as follows: during the light excitation ligand-to-metal-charge-transfer (LMCT) occurs yielding formally the Ag0 centers from their initially Ag1+ state. The repulsion of “neutral” silver atoms is then reduced, which results in the Ag⋯Ag bond strengthening and shortening. This explanation and observed structural changes have been strongly backed up with theoretical computations. Furthermore, the experimental results (see the photodifference map; (Figure 9)) indicate that the two copper atoms shift in a different manner. This behavior is a consequence of the crystal confining effects, which are well-modelled using the QM/MM approach. It is also worth mentioning that the observed core contraction was confronted later with the high-pressure spectroscopic and synchrotron experimental results [99]. It appeared that pressure-induced structural changes differ notably from the geometrical distortions observed for the excited state, which results mostly from the charge transfer accompanying the excitation, which under high pressure does not take place to that extent. Interestingly, shortening of the Ag−Ag bond itself does not ensure the red shift of the absorption and emission spectra.
As far as the in-house TR diffraction studies are concerned, solely a couple of examples have been published to date. Initial tests of the application of the method employing the earlier-described chopper technique (Figure 7) were performed for the copper(I) system [20,86], previously studied with the monochromatic stroboscopic TR diffraction method at the synchrotron [100]. Despite similar photodifference maps, the atomic shifts appeared to be much less pronounced in the results of the in-house experiment, yet comparable to other quite similar CuI complex studied previously by Makal et al. [22]. Otherwise, the in-house experiment was performed on a purely organic molecule, 1,4-dibromo-2,5-bis(octyloxy)benzene [87]. The main finding of these investigations was that the intramolecular Br⋯Br distances elongate by 0.09 Å, whereas the C−Br bonds shorten by 0.018 Å, when the long-lived (325 µs lifetime) phosphorescent excited state is formed. Here, no computational modelling was reported.
In turn, the gating-detector technique was applied in the study of the sodium nitroprusside, Na2[Fe(CN)5NO]·2H2O, single crystals [85]. In this case the NO ligand in the examined compound undergoes significant distortion in the crystal upon irradiation. The ligand can be switched with the visible light between the linear Fe-NO state and the side-bound metastable form. The transient absorption studies revealed that the metastable state goes back to the ground state after 100 ms at 150 K. This makes it a perfect example to be studied with the TR method. Apart from the structure determination of the metastable-state geometry (Figure 10a), it was possible to trace the time-evolution of the selected reflections’ shape, position and intensity (Figure 10a).

3. X-ray Free-Electron Lasers

Thanks to the significant technological advances, X-ray free-electron lasers have recently become a highly competitive alternative to synchrotron beamlines. This is because of the very bright, coherent and monochromatic X-ray radiation they produce, including very short X-ray pulses which can be generated (down to femtoseconds). Once the technical issues, such as experiment design or data processing, are resolved, XFELs may provide access to very fast processes of interest and enable tracing of structural dynamics with sub-ps time resolution. Indeed, numerous impressive TR experiments were performed using XFELs in the past few years. The very short X-ray pulses that can be produced facilitate thorough research on macromolecules and biological systems, as nuclear motions take place in the tens to hundreds fs regime. The commonly applied approach employing the strong XFEL source is called serial crystallography, while the principle of the femtosecond experiments of this kind is referred to as “diffraction-before-destruction” This is because the high-energy radiation when reaches the sample destroys it almost immediately. Nevertheless, since the X-ray pulse interacts with the electron density of the analyzed sample prior to its complete decay, the diffraction pattern can readily be observed.
There are two essential processes accompanying sample destruction with the XFEL beam—ionization and ion motion. Ionization occurs mainly during the photoabsorption, i.e., when the photon energy ejects an electron from a given atom. The described process also causes Auger decay and secondary electron cascade. Such ionized atoms can then easily turn into plasma due to the heating up and ion motion which leads to further electron-ion and ion-ion collisions [101]. The resolution of the registered diffraction pattern is then determined by the extent of the sample damage. It can be estimated based on the limiting dose of radiation absorbed by the sample using the so-called “dose fractionation theorem” [102]. For example, Henderson and Gramer found a typical “safe dose” for macromolecular systems as high as 10 MGy per Ångström of resolution [103].

3.1. Experimental Approaches

In view of the above it is very important to adapt sample delivery method to the type of the planned experiment. The proper choice assures low sample consumption, fast data collection and minimized background noise. Since a bright X-ray pulse destroys the sample almost immediately, it is crucial to deliver new samples into the beam between the X-ray pulses with the frequency of the source. There can be distinguished two main types of sample delivery: crystal injection and fixed-target methods, which are briefly described below.
In the case of the crystal injection methods a stream of very small single crystals (the so-called nanocrystals) is formed and flows perpendicularly to the XFEL beam direction (Figure 11). When the X-ray beam hits a crystal the diffraction pattern is produced. In order to obtain best results, crystals in the stream should be of similar size. The practical realization of this concept is e.g., the gas-focused dynamic virtual nozzle (GDVN) technique, which employs a liquid-jet injector. Crystals are delivered in the flowing liquid suspension using high pressure generated by the system of two capillaries, where one is enclosed by the other. In the outer capillary the gas at high pressure ejects the liquid containing nanocrystal samples to the “virtual nozzle” (VN). The use of VN provides the formation of a jet of a few microns in diameter, which significantly reduces background noises. The flow rates for this method are around 10–60 µL·min−1, while in the case of more viscous media, the obtained flow rates amount to 0.02–0.5 µL·min−1. In turn, another solution, microfluid electrokinetic sample holder (MESH; also known as the electrospin injector), generates thin liquid stream by the action of electric field. Both liquid and vicious matrices can be applied in this method as long as they are sufficiently polarizable in order to interact with electric field. It should be noted that the experiment is performed under vacuum, which may result in evaporation of the sample liquid, or dehydration of crystals, which leads to sample freezing. To overcome such issues, the new method, namely concentric-flow electro-kinetic injector (CoMESH) approach, was introduced [104]. In the two-capillary system used in MESH/CoMESH, the outer capillary creates an environment that protects the sample from a vacuum-induced evaporation. MESH techniques facilitate flow rates of around 0.1–10 µL·min−1 [105,106].
When the XFEL pulse does not destroy the sample, or, for some reason, it is impossible to apply the methods described above, the fixed-target approach is employed. In such cases the crystals are attached to the sample holder which moves allowing the beam to hit a different crystal each time. It is crucial here to define the way in which crystals are arranged on the holder. Among the method’s advantages are definitely the possibility of in situ crystallization which enables data collection under various conditions, and the reduced sample consumption. In this technique crystals can be delivered using a nylon loop, microfluid chip or conveyor belt system [106]. The so-called HARE (Hit And REturn) chip is an example of a fixed-target system. It is a patterned silicon chip bearing 6×6 compartments. Crystals are placed inside the chip using a specially-designed vacuum loading platform which creates humid environment for samples to prevent crystal dehydration [108].
Finally, it is worth mentioning some of the hybrid methods combining both the fixed-target and injection-sample-delivery techniques in order to eliminate their limitations. Within the most interesting methods of this kind are acoustic droplet rejection and crystal extractor techniques. The first one uses sound pulses to transport droplets containing sample through an air column. Picoliter to nanoliter droplets are released at a repeatable rate with positional precision. In the second technique the crystals for measurements are taken directly from the solvent where they were crystallized using MESH, or thin film [105].

3.2. Facilities for TR XFEL Crystallography

Time-resolved serial femtosecond crystallography experiments are currently performed majorly at the following XFEL facilities: Linac Coherent Light Source (LCLS; SLAC National Accelerator Laboratory, Stanford, USA), European XFEL (Hamburg, Germany) and Spring-8 Angstrom Compact Free Electron Laser (SACLA; Kamigori, Japan). At all three facilities there are already beamlines suitable for TR crystallographic experiments, thus they will be described briefly below. It is also worth mentioning here that new beamlines dedicated to studies of structural dynamics in solids are constantly being developed. The Cristallina beamline, which is, to the best of our knowledge, currently under realization at SwissFEL (Paul Scherrer Institute, Switzerland), is a good example here. Its commissioning is planned for 2022.

3.2.1. LCLS

Linac Coherent Light Source (LCLS), which is located at the SLAC National Accelerator Laboratory, constitutes the world’s first hard X-ray FEL facility (started operating in 2009). As far as time-resolved studies are concerned, an important feature of the FEL instruments is the possibility to generate ultrashort X-ray pulses. LCLS can generate femtosecond (30–500 fs) X-ray pulses from the 0.27−11.2 keV energy range with 120 Hz repetition rate [109]. The electron bunch length can be changed, thus the X-ray pulse duration, using two operating modes: low-charge operating mode [110] and a slotted-foil method [111]. In order to enhance the pulse intensity, the self-seeding operations are implemented. Instead of one undulator section there is installed a chicane and an in-line single diamond crystal. The function of chicane is to delay the electron bunch to amplify the seed in the second part of the undulator array, whereas the thin crystal creates a monochromatic seed pulse. At LCLS “two-color” pulses can be created in two ways. An undulator beam line is either divided into two sections, at which the electron bunch generates different color pulses, while a delay chicane is used to control the time delay between them, or a split undulator, which can generate and synchronize two electron bunches of different energies, is employed. It should be noted, however, that in the latter approach the intensity of both pulses is more limited, whereas the time delay depends on the chicane and can be as short as ps.
At the LCLS facility there are two beamlines on which the TR studies on crystals can be performed: MFX (Macromolecular Femtosecond Crystallography) and XPP (X-ray Pump-Probe). The MFX beamline was designed for structural biology investigations in order to reduce radiation damage. It can be, however, applied in various time-resolved crystallographic experiments, as well as in solution scattering or emission spectroscopy. Initially, for the purpose of macromolecular studies at LCLS only CXI (Coherent X-ray Imaging) instrument was used. MFX has the same capabilities as CXI, and additionally some other specific and relevant features. The principal difference between these two facilities is the sample environment. In the case of CXI it is vacuum, while using MFX experiments can be performed under atmospheric pressure which provides conditions for a wider variety of experiments. The MFX instrument consists of two detector mounting systems and a large breadboard. It is installed on a hard X-ray branch. In the case of standard fixed-target serial crystallography a highly automated goniometer-based setup is applied. Measurements can be performed in a wide temperature range, from cryogenic to room temperature, using MESH, grid or various chips for crystal mounting [112]. In turn, the hard X-ray Pump-Probe (XPP) instrument at LCLS covers a photon energy range of 4–24 keV and achieves fs time resolution. The synchronized ultrafast optical laser is widely tunable; it is capable of generating pulses from a large wavelength range, while temporal profile can be adjusted to the experiment. Moreover, the instrument allows application of various nonlinear excitation mechanisms. The XPP operates on two monochromators: a channel-cut monochromator, or on a custom-built double-crystal monochromator, which are selected depending on the experiment requirements. Similarly, as in MFX, a pulse picker can deliver single X-ray pulses on demand. In the optical system of XPP there is a home-built four-pass amplifier which can increase the pulse energy up to over 30 mJ [113].

3.2.2. SACLA

In March 2012 SACLA became the second XFEL facility in the world and the first compact one where the short-period in-vacuum undulator is used [114]. The most important parameter of the undulator is the short periodic length of its fragments, thanks to which it is possible to generate short-wavelength radiation. In order to optimize the produced radiation in such an instrument also the gap between the magnets must be very small [115]. However, by opening the gap the magnetic field can be decreased, thus higher energy X-rays produced. Furthermore, via variation of distances between undulator magnets also “two-color” XFEL pulses can be obtained. Duration of pulses is below 10 fs due to the injector system using thermionic cathode and velocity-bunching system to produce electron beam with a maximum pulse energy around 0.5 mJ and the peak power reaching 60 GW. The high intensity of the XFEL light (~1020 W·cm−1) is enhanced using the two-stage focusing system constructed in the Kirkpatrick–Baez geometry, which enlarges the angular divergence and in this way produces tightly focused spot. The device is equipped with a diamond phase retarder which is able to switch from the horizontal polarization of the monochromatic XFEL beam to vertical, or circular polarization [114].
Time-resolved studies at SACLA are conducted using a synchronized Ti: sapphire optical laser system which works on every experimental station there [114]. The BL3 beamline is most often used for TR experiments. The high peak power with an X-ray pulse duration shorter than 10 fs is obtained as described above. At BL3 the optical system is constructed of two different mirror sets and a double crystal monochromator with silicon crystals. Using the mirror systems with 2 and 4 mrad glancing angles it is possible to reflect X-rays below the cut-off energies and suppress the higher order harmonics. As mentioned before, mirrors in Kirkpatrick–Baez geometry provide focused spot of only ca. 50 nm. In an optical hutch, transmission gratings are installed as beam splitters—this equipment is used for simultaneous diagnostic of timing and/or spectrum [116].

3.2.3. European XFEL

European XFEL (EuXFEL) is one of the most recently put into use, and is, also, the most modern facility of this kind [117]. Using super-conducting accelerator technology and providing 27,000 light flashes per second there can be performed novel experiments with exceedingly high time resolution. EuXFEL works in the burst-mode where femtosecond pulses are emitted with 10 Hz frequency with a duration up to 600 µs, and with up to 2700 pulses per series. There are three SASE (Self-Amplified Spontaneous Emission) undulators available at EuXFEL, SASE1, SASE2 and SASE3, which operate in different photon wavelength ranges suitable for various applications [118], whereas the installed lasers are supported by non-collinear optical parametric amplifier (NOPA). Two SASE1 beamline instruments—FXE (Femtosecond X-ray Experiments) and SPB/SFX (Single Particles, clusters and Biomolecules / Serial Femtosecond Crystallography), both having ultrafast optical pump-probe laser working in the burst mode, are best suited for TR studies of light-induced processes.
The SPB/SFX beamline has been designed, among others, to facilitate TR measurements on EuXFEL. Using unique high peak repetition frequency, it is possible to significantly reduce the measurement time. The SPB/SFX instrument operates in 3–16 keV photon energies with the expected peak performance between 6–15 keV. The beamline includes two laser systems and other instruments such as: train picker, attenuator array, incoming beam diagnostic screen, lens and focusing system. The first laser system, placed in the hutch house, is a reference laser system. It is composed of B4C blade slit system and micrometer-scale KB focusing system built with mirror optics placed in two vacuum chambers. Moreover, in order to prevent beam scattering clean-up slits and shutter are mounted for X-ray beam transmission control. Mirror alignment is assured by three diagnostic screens located in the mirror chamber. The second laser system is built similarly, however, there are two clean-up slits and a 100 nm-scale focusing system implemented. Downstream there is mounted a differential pumping system which supports sample injection. AGIPD (Adaptive Gain Integrating Pixel Detector) is a main detector for SPB/SFX which is installed in the interaction region chamber. Its position can be adjusted between 12 to 600 cm sample-to-detector distances [119].

3.3. Data Processing

In order to perform X-ray diffraction measurements and properly process the resulting data, so as to extract the desired structural information, specific data processing techniques and dedicated software suites are required. Overall, recent developments include the design and upgrades of the algorithms used in the general pipeline of data processing. Similarly, as in the case of TR Laue diffraction, due to the short duration of X-ray pulses, the sample is practically kept fixed during the single diffraction experiment. However, XFEL radiation is highly monochromatic, thus, in contrast to the Laue polychromatic method where full reflections are measured, here only partial reflections are being recorded on every image. Furthermore, in XFEL experiments, especially in serial crystallography experiments, not all X-ray pulses give a meaningful signal, as, for instance, a pulse may not hit a nanocrystal in the stream. These challenges have been greatly overcome with various software packages, out of which CHEETACH [120] and CRYSTFEL [121] are the most popular ones.
Data processing with the CHEETACH program starts with analysis of every detector module separately. The module boundaries are avoided due to the appearance of various artefacts. Since in most serial X-ray crystallography experiments the background level varies from frame to frame, it is crucial to eliminate this effect before the proper data analysis. In the CHEETACH software it can be performed in two ways: using “running background subtraction” or “local background subtraction”. In the first method, blank frames are collected between hits to calculate a pixel-wise median of a photon background. This method can be implemented when the background is not very variable. The second method is used when the samples are delivered by liquid jet–in this case background can change for every hit. Subtraction is performed by estimating the background as the median of all pixel values. Finally, Bragg peaks are identified by testing each pixel for the intensity. If the pixel intensity fulfils the specified criterion surrounding pixels are tested, connected and counted as a peak. The peak is then defined by calculating its intensity, centroid position and surrounding background, and the program moves to the next pixel. When the background noise is relatively significant and vary other methods must be implemented. Major advantage of the CHEETACH software is that the peak searching can be performed on a part of the detector and then extended to the rest of it if peaks were found in the initial region, which speeds up the data processing. A crucial step in data analysis is to determine sample hits. Diffraction pattern for crystalline sample can be considered as a “hit” only if required number of Bragg peaks are present; for protein nanocrystals the value 20 is a reasonable and well-working choice. If the image passes this and other tests the data can be transferred to the downstream analysis program, e.g., CRYSTFEL.
The first step of the CRYSTFEL processing is pattern indexing and reflection integration. The most robust approach is to use the auto-indexing procedures as implemented in the well-known DIRAX [122] or MOSFLM [123] programs. The determined unit cells for each image are also compared with the reference cell, in order to ensure every pattern comes from the same structure. When the indexing is performed, the intensities are integrated, including peaks which were not present in the initial peak search. For the distorted peaks CRYSTFEL sums pixels within a fixed radius in order to integrate them, whereas the local background is averaged by measuring intensities surrounding integration region. The last step of the CRYSTFEL processing is intensities merging, by averaging all measurements for each individual reflection. Moreover, the Monte Carlo integration which uses three-dimensional reflection profile is applied when the number of measurements is large. While merging intensities from XFEL experiments specific issues appear: for each pulse the incident beam intensity and wavelength and spectrum are somewhat different, so the large number of indexed patterns are necessary. The scaling of intensities is performed by normalizing intensities in three different ways: using the mean intensity of the Bragg peaks in each pattern, averaging overall intensity in each pattern or by scaling intensities to the best fit of the values which were generated from the last program run.

3.4. Case Studies

In this section recent successful studies conducted at each of the three above-described facilities will be presented.
The first selected example concerns application of the TR SC method to study enzyme catalysis realized at the LCLS. In this particular case, the authors aimed at characterizing the effect of covalent catalysis on isocyanide hydratase (ICH) conformational dynamics along its catalytic cycle [112]. For this purpose, the substrate para-nitrophenyl isocyanide was infused into a stream of unmodified microcrystals of ICH at 298 K, whereas the X-ray diffraction data were collected at selected time delays. Based on these results, the authors came up with the mechanism of the process under study, according to which the catalytic Cys101 nucleophile reacts with the electron-deficient carbene-like center located at the organic isocyanide moiety. This leads further to the formation of a covalent thioimidate intermediate which has not been observed before (Figure 12). The created enzyme-linked thoimidate eliminates the negatively charged thiolate at the Cys101 residue, thus the Cys101-Ile152 hydrogen bond gets weaker. In consequence, the Ile152 aminoacid fragment relaxes to an unstrained backbone conformation accompanied by the ICH helix H displacement. Indeed, the difference electron density maps calculated from the 15 s data confirm the formation of thioimidate covalent intermediate in the analyzed ICH protomers. This is indicated by the appearance of electron density around the helix, which shows that this fragment dynamically changes the active-site microenvironment. The effect vanishes 5 min after mixing when the substrate is used out by the enzyme. These findings demonstrate that MISC can be used to trace enzymatic processes and their dynamics in microcrystalline samples. Thus, this approach may provide insights into the relation between non-equilibrium protein motions and enzyme catalysis.
The second study quoted here concerns the fluorescent rsEGFP2 protein photoswitching reaction mechanism and has been performed at the BL3 beamline at SACLA [124]. The rsEGFP2 protein, characterized by a reversibly-switchable fluorescence, constitutes a variant of the enhanced green photoswitchable protein. This class of systems serves as markers in advance fluorescence imaging [125,126,127,128,129]. The respective chromophore fragment in rsEGFP2 consists of three residues: Ala-Tyr-Gly. Molecular structures of two major states of the studied system, the so-called non-fluorescent protonated off-state and fluorescent deprotonated on-state (Figure 13a), were already established using standard crystallography methods. The protein can be switched from the off-state (neutral trans1 form) to the on-state (anionic cis form) with the 400 nm light, whereas the opposite reaction can be triggered using the 488 nm laser light.
Further, more advanced TR SFX investigations, which facilitated monitoring of the photoswitching reaction at room temperature, were performed with the XFEL radiation. This method has provided several intermediate-state structures for other photosensitive proteins in the recent years [130,131,132,133,134,135,136]. In the discussed case, two time regimes were tested. Experiments of the ps-time-resolution showed that 1 ps after the photoexcitation with the 400 nm laser light the chromophore adopts a twisted excited-state conformation in-between the trans and cis isomers. In turn, after 3 ps the cis chromophore of a presumed ground-state intermediate starts to appear, which means that the isomerization occurs in the excited state. It was, however, difficult to derive a reliable structural model for the observed transient species. For the purpose of the other room-temperature pump-probe TR experiment, the microcrystal was first photoswitched with the 488 nm laser light back to its off-state. The subsequent X-ray diffraction measurement showed that the structure contains three different conformations, i.e., trans1, trans2 and cis forms with the 65%, 25% and 10% occupancies, respectively. It should be noted here that the trans2 chromophore conformer has not been earlier observed. Then the pump-probe experiment was conducted with the 400 nm excitation wavelength. It appeared that 10 ns after the irradiation the original protonated trans off-state transforms to an intermediate state. A related photodifference map showing the depletion of the initial off-state and population built up of the chromophore conformation, similar to the one observed for the on-state is presented in Figure 13b. It was possible to establish the structure of the detected transient species which occurred to be compatible with the cis protonated chromophore. Population of the intermediate state was estimated to about 50%.
All in all, the combined data led to the conclusion that the off-to-on photoswitching process in rsEGFP2 involves excited-state isomerization on the ps timescale followed by μs conformational changes in the ground state resulting in the proton transfer in the ms regime. The structurally characterized intermediate state at 10 ns with a protonated cis chromophore remains stable up to 100 ns. The findings enabled derivation of a detailed photoswitching process mechanism, as shown in Figure 14.
Finally, it is worth mentioning some studies conducted using the most modern European XFEL facility, which unlike other XFELs, can generate pulses of a MHz frequency that can be successfully used in TR serial femtosecond crystallography to follow different stages of reaction in one experiment [137,138]. Very recently, Pandey et al. [139] applied this approach to examine the photocycle of a model bacterial photosensor, photoactive yellow protein (PYP) (studied before at synchrotrons and XFELs with TR SFX technique [6,133,136]), which is used in optogenetics for optical control of biological processes, such as neural activity. During the photocycle, the key element of PYP, i.e., the para-coumaric acid chromophore, isomerizes form its trans to cis form (Figure 15).
The transformation is initiated by irradiation of the sample with the 420 nm laser light. Several experiments using different X-ray and laser repetition rates were performed to establish optimal conditions to monitor the studied process taking place in the PYP crystals. As a result, 1.13 MHz X-ray repetition rate with the 375 kHz laser pulse appeared to be too strong for this experiment. In turn, when the frequencies were reduced to 564 kHz and 141 kHz for the X-ray and laser pulses, respectively, whereas the pump-probe delay was set to 10 ps, the calculated difference electron density maps exhibited strong features which assured the proper choice of the experimental conditions. Datasets were collected with the following time delays: 3 ps, 10 ps, 30 ps, 80 ps and 100 ps, so as to probe the time range not yet investigated in detail, however, including at least one process observed spectroscopically [140]. Difference electron density maps were calculated for each time point which showed the trans to cis transformation steps (Figure 16). Importantly, it was possible to derive geometry of the intermediates and products at the successive stages of the photoisomerization. This opens up a wide range of possible time-resolved studies at the EuXFEL.

4. Complementary Methods

The above-described TR synchrotron and XFEL diffraction techniques were shown to provide valuable information regarding geometrical changes occurring in molecules in crystals under light excitation. Nonetheless, in some cases the form or quantity of a sample do not allow application of these methods. Furthermore, independent confirmation, other than theory, of the transient species’ nature is usually desired. Therefore, below two methods complementary to the TR X-ray diffraction techniques will be described, i.e., electron diffraction and X-ray absorption spectroscopy. Additionally, the most important results in this area will be presented.

4.1. Electron Diffraction

Electron diffraction is a technique in which an electron beam is diffracted on a sample. It was originally designed to study molecular structures in the gas phase [141], however, nowadays this method is extensively applied to study crystals [142], microcrystals [143], nanoparticles [144] or even liquid crystals [145]. Electron beam causes less radiation damage (per single scattering event) when compared to X-rays and it can be easily manipulated using magnetic lenses. In the case of ultrafast electron diffraction (UED) technique the pump-probe mode is utilized, i.e., a femtosecond laser pulse triggers the process under consideration, whereas ultrashort femtosecond pulses of electrons are used to trace the time-evolution of the system.
A fundamental example of a UED study of a molecular crystal is that presented by Jean-Ruel et al. [146]. The authors investigated the light-induced ring-closing reaction occurring in the 1,2-bis(2,4-dimethyl-5-phenyl-3-thienyl)perfluorocyclopentene molecule in a crystal, a model complex representing the well-known switchable diaryethylene systems. The examined molecule undergoes cyclization reaction under the UV-light irradiation (Figure 17). The process is thermally irreversible, so the second laser pulse, in the visible-light regime, is required to induce the back-reaction. The UED experiment was conducted using the 95 kV DC photoelectron gun (details on the experimental setup are described in the literature [147]). Cyclization was triggered using 270 nm laser pulses stretched to approximately 300 fs. The efficiency of the reaction was small in each cycle. In order to achieve full conversion to the open-ring state, the sample was irradiated for 10 s with the 633 nm HeNe laser light. The following diffraction patterns were collected in every cycle: before (pump-off), during (pump-on) and after (pump-off, before ring-opening) irradiation. In the UED measurements intensity evolution of various Bragg peaks was traced so as to investigate the formation of the ring fragment. For the time points beyond 20 ps change in diffraction intensity indicated the cyclization reaction to occur. After 200 fs the open-ring intermediate is formed which leads directly to the ring-closing. Later, after the 5.3 ps the full cycloreversion occurs. Furthermore, the results agree well with the transient absorption studies reported previously [148].
A very interesting piece of work showing the recent development of the UED technique was reported by Ofori-Okai et al. [149] (and, also, previously by Zimmerman et al. [150] and Weathersby et al. [151]). The new experimental setup, located at the SLAC facility, couples the UED line with terahertz pulses. The latter provides some unique possibilities to study materials since such pulses can trigger low-frequency ionic displacements and change the material properties through the non-resonant interactions, yet with no significant change of the electronic density of states [152,153,154,155]. In the case of the used experimental setup the output of the Ti:sapphire regenerative amplifier is split into two paths (Figure 18). About 95% of the laser beam is directed towards the mechanical delay line and later used to produce the THz pulses, as well as, to gain the possibility to excite samples in the electro-optical way (e.g., 400 or 800 nm pump pulses). The rest of the primary beam (5%) is compressed and tripled with the BBO (barium borate) crystal which results in the 266 nm UV light. These deep-UV pulses hit the photocatode material yielding ultrashort electron bunches. These interact with the samples and the diffracted electrons are collected on a phosphor screen. Overall, the setup has multiple capabilities regarding sample excitation in UV-Vis and THz regimes, as well as probing of the induced processes with fs time resolution using the electron beam.
Using the above-described setup Wolf et al. [156] examined photochemical ring-opening reaction of the 1,3-cyclohexadiene molecule in the gas phase. The photoreaction is triggered with 267 nm light pulse resulting in the formation of a 1,3,5-heksatriene. The detailed investigations were focused on distances between carbon atoms and carbon and hydrogen atoms during the ring-opening process. Molecular geometry changes were traced by means of the pair distribution function (PDF) analysis. The three main and most significant peaks of PDF are associated with various distances in the molecule and are depicted in Figure 19a. Consequently, the time-resolved studies were focused on the evolution of these three selected peaks, α, β and γ (Figure 19b). The onset of the α peak shows the beginning of the photoreaction and denotes first molecular motions that occur after about 40 fs. In turn, the β peak, corresponding to the distances between carbon atoms located across the ring, shows their rise after about 110 fs. Finally, the γ peak, related to the fully open molecule, becomes visible after 180 fs. Clearly, the study constitutes the first direct observation of the photo-induced ring-opening reaction of the isolated 1,3-cyclohexadiene molecule with the femtosecond time resolution.

4.2. X-ray Absorption Spectroscopy

X-ray absorption spectroscopy (XAS) is known as an effective method of determining chemical speciation of the sample, such as its elemental composition, elements’ oxidation levels, and the general electronic character of the examined states. Moreover, XAS methods are extremely versatile, meaning it is possible to measure gases, liquids and solids composed of molecules of all sizes, ranging from small inorganic systems [157] to macromolecules [158]. With the ongoing development of synchrotron technologies, it has become natural for researchers to attempt time-resolved measurements, giving rise to the TR X-ray absorption techniques (TR XAS), such as ultrafast X-ray absorption spectroscopy or transient X-ray absorption spectroscopy (TXAS).
The main sections of spectra examined using XAS methods are X-ray absorption near-edge structure (XANES) and extended X-ray absorption fine structure (EXAFS) regions (Figure 20). While both of them can be registered during a single experiment, they offer significantly different insight into the properties of the examined systems’ state. The XANES spectral section represents electron transition processes occurring inside atoms, specific to the incident photon energy. For example, for a 1 s electron, a K-edge will be registered around the energy required to ionize the 1 s electron, along with additional pre-edge region containing signal from other possible transitions, such as transitions to states with higher quantum numbers (e.g., 1 s 2p), or even weak signal from forbidden transitions (e.g., 1 s 3d). On the basis of such spectra, it is then possible to extract the quantitative characteristics of electronic configuration for a given atom, providing information about oxidation state, bond angles and site symmetry. On the other hand, the EXAFS section of the spectrum contains structure-dependent oscillations coming from interference between the scattered and backscattered radiation, caused by photoelectrons ejected from the inner core levels interacting which the neighboring atoms. From the characteristics of these oscillations, it is possible to gain insight about interatomic distances, bond lengths and coordination numbers. Combined XANES and EXAFS studies in order to explore the local structure of a system is often jointly called X-ray absorption fine structure, or XAFS.
Since the position of an absorption edge on the spectrum is atom-specific (or even atom-state-specific), ultra-fast and transient XAS became a convenient tool to selectively observe electron dynamics of systems. Valence-state information provided by XANES is used to track dynamics of a wide range of charge-transfer processes (e.g., catalysis and metal-ligand charge transfer), while EXAFS can provide details about structural displacements occurring in the molecule due to bond-length changes in metastable states. The two main factors limiting the applicability of TR XAS methods are, as with most time-resolved methods, the sheer speed at which data collection can be completed, and the availability of energy-tunable intense X-ray radiation. Originally, the method was not able to go below the threshold of dozens of minutes for a single measurement, making XAS only capable of measuring very long-lived or switchable metastable states. However, along with the introduction of CCD detectors and modern radiation sources, such as XFELs or laser-produced plasma (LPP; not described in this contribution) sources, it has in some cases become possible to collect XAS data in the regime of seconds for ultrafast XAS, and milliseconds [160], or even picoseconds [157] and femtoseconds [161] by using pump-probe transient XAS methods. It is worth noting here, that while time-resolved XAS data is collected for solution samples (also containing nanoparticles), the obtained information about local structure is complementary to the data collected for crystal samples using other methods.
There are currently numerous synchrotron facilities with beamlines adapted for TR XAS experiments. Most notable examples are the SuperXAS beamline at the Swiss Light Source, Alvra beamline at SwissFEL, TEXAS facility and Femtosecond X-ray Experiments facility at the ESRF, Bon-SUT beamline at the Synchrotron Light Research Institute, PETRA III facility at the Deutsches Elektronen-Synchrotron, DESY, and the 7-ID beamline at APS. Large synchrotron facilities and more recently XFEL sources are without doubt the preferred way to obtain X-ray radiation of sufficient intensity and energy to conduct time-resolved XAS experiments. Furthermore, Huang et al. have recently reported their success in conducting energy dispersive XAS measurements on a low-scale laboratory setup, when utilizing the so-called Inverse Compton Source (ICC) as their novel source of X-ray radiation [162]. They proved the concept by successfully measuring both XANES and EXAFS for homogenous and inhomogeneous samples using silver foil and AgNO3 solution for the former, whereas AgO2 pellets for the latter. The obtained results closely matched the respective data collected at a large-scale synchrotron facility beamline, namely at the BL14B2 beamline at the Japan Synchrotron Radiation Research Institute (Figure 21). This is especially important for future time-resolved XAS studies, since due to the versatility of the method, the main bottle-neck of conducting such experiments is still the scarce availability of intense X-ray sources.
A recent study has shown that the TXAS pump-probe method can provide experimental insights into bond elongations in asymmetric transition metal complexes, which is otherwise difficult to observe [163]. A spin-switching octahedral complex [FeII(tpen)]2+ (tpen = N,N,N’,N’-tetrakis(2-pyridylmethyl)-1,2-ethyl-enediamine) was investigated for structural changes caused by photoexcitation of the metallic center by a 400 nm laser pulse. XAS K-edge spectra were collected for the ground state, i.e., before the pumping pulse, as well as 150 ps after the excitation (Figure 22). By careful fitting, it was possible to unambiguously separate the two TXAS signals coming from the elongation of non-identical (differing with regard to the second coordination sphere) Fe−N metal-ligand-type bonds. These findings were in agreement with the DFT computational results. It should be stressed here that thanks to TXAS it is possible to distinguish between very similar ligands (at least with regard to the first coordination sphere) on the basis of the obtained metal-ligand bond-length information for. Such knowledge may, in turn, be valuable when tracing photoactivated structural changes in crystals by means of TR photocrystallographic methods.
Finally, an important example of the usefulness of the TR XAS method in terms of determining structural dynamics in spin cross-over systems was reported by Gawełda et al. [164]. The discussed experiments were performed at the MicroXAS beamline of the Swiss Light Source. During such an experiment the solution of iron(II)-tris-bipyridine, [FeII(bpy)3]2+ (bpy = bipyridine) was excited with a 400 nm pulse (100 fs pulse duration) at room temperature, and probed by a 100 ps monochromatic X-ray pulse with varying time delay. By examining the collected time-resolved XANES and EXAFS spectra, the authors were able to experimentally show the Fe−N bond length elongation of approximately 0.2 Å, emerging from the light-induced low-spin to high-spin crossover processes in the molecule, which was then confirmed by theoretical DFT calculations. This process was later studied at the Swiss Light Source using a novel X-ray pulse slicing technique [165,166]. The method was first proposed by Zholents and Zolotorev [167], and later applied at the APS synchrotron by Schoenlein et al. [168]. In the case of the Swiss Light Source the instrumentation (called the FEMTO slicing source) uses a portion of the same laser oscillator output as the excitation laser. Such proceeding ensures the proper synchronization between the laser pump and the X-ray probe. The laser pulse is then amplified and compressed to about 55 fs duration (fwhm) and later directed towards the electron bunch. As a result of the interaction of both, an increased energy spread in the electrons is obtained. Then the electrons pass through a dipole chicane which horizontally separates out the energy-modulated fs electrons from the “core” 100 ps bunch, and, finally, through the MicroXAS undulator generating X-rays. A diaphragm installed at the beginning of the beamline allows majorly the fs “sliced” X-rays to proceed through the beamline optics. The method was used by Milne et al. [169] in order to obtain sub-picosecond time solution in the TR XAS spectra, allowing for determination of the exact energy relaxation pathway of the photoexcited [FeII(bpy)3]2+ complex (previously only achievable in the laser-based transient-absorption spectroscopic experiments).

5. Summary and Prospects

In this short review the recent developments in time-resolved studies of molecular materials are presented with the emphasis put on the TR Laue photocrystallography and XFEL capabilities. In each case concepts, instrumentation, data processing and data analysis issues are discussed together with the respective illustrative successful studies.
Since the TR Laue method had been first applied to light-induced macromolecular systems, the current efforts regarding data collection and processing handling are focused on a more troublesome small-molecule case. Several studies of this kind performed at intensive synchrotron sources have already been reported. Importantly, quite recently successful attempts to in-house TR diffraction experiments have been introduced. Such methods include either installation of HPAD detectors or an X-ray beam chopper, and a laser-light-delivery assembly on a typical X-ray diffractometer, so as to expose a single-crystal sample to synchronized laser and X-ray pulses. These setups currently facilitate studies of processes taking place in the µs (X-ray-beam chopper) or ms (HPAD detector) regime at best. The methods and technological solutions are constantly being developed, and, in the view of the advances concerning strong laboratory X-ray sources, become more and more promising. In turn, biologically important macromolecular cases are nowadays intensively examined using TR XFEL crystallography. A number of successful and very relevant studies of protein dynamics and biochemical transformations examined via serial crystallography approach have been published to date. The most important thing about XFEL sources is their intensity and very short X-ray pulses generated, which gives access to sub picosecond processes, especially the ones occurring at room temperature. Thus, XFEL radiation well-synchronized with short laser pulses opens up possibilities to record molecular movies showing molecular dynamics and various phenomena taking place at different time scales.
Finally, two selected complementary methods used to study light-induced structural changes in molecules, namely ultrafast electron diffraction (UED) and X-ray absorption spectroscopy (XAS), are briefly presented. UED seems to be an extremely attractive alternative to the TR X-ray diffraction techniques, since it does not require the use of large-scale facilities. Furthermore, its applications range from single-crystal materials to gas-phase systems, out of which the most striking examples were shorty described. In addition, the XAS method, primarily developed for solution samples, provides geometrical data on the changes occurring when molecules are excited with light. It was shown the technique is very sensitive to structural changes occurring in the fine time-scale. This allows for more comprehensive studies on the molecular excitation dynamics and the environment effect, when compared to the pure solid-state X-ray diffraction techniques.
Nonetheless, despite recent advances and promising perspectives, a lot still needs to be conducted and resolved in order to fully monitor fast processes in various systems of interest (including small-molecule crystals of photoswitchable coordination complexes [31,32,45,46,170,171] or purely organic compounds [41,172,173]), and literally “watch chemistry happen”.

Author Contributions

Conceptualization, K.N.J.; writing–original draft preparation, K.A.D. and P.Ł.; writing–review and editing; all authors; supervision, K.N.J. and R.K.; funding acquisition, K.N.J. and R.K. All authors have read and agreed to the published version of the manuscript.

Funding

This research was funded by the National Science Center in Poland, grant numbers: 2020/38/E/ST4/00400 (SONATA BIS), 2016/21/D/ST4/03753 (SONATA), 2019/35/O/ST4/04197 (PRELUDIUM BIS).

Acknowledgments

K.N.J. would like to thank the SONATA BIS (2020/38/E/ST4/00400) grant of the National Science Center (NSC) in Poland for financial support. R.K. and P.Ł., and K.N.J. and K.A.D. thank the SONATA (2016/21/D/ST4/03753) and PRELUDIUM BIS (2019/35/O/ST4/04197) grants from NSC, respectively.

Conflicts of Interest

The authors declare no conflict of interest.

References

  1. Wald, G. The Molecular Basis of Visual Excitation. Nature 1968, 219, 800–807. [Google Scholar] [CrossRef]
  2. Dowling, J.E.; Wald, G. The biological function of vitamin-A acid. Nutr. Rev. 1981, 39, 135–138. [Google Scholar] [CrossRef] [PubMed]
  3. Grätzel, M. Recent advances in sensitized mesoscopic solar cells. Acc. Chem. Res. 2009, 42, 1788–1798. [Google Scholar] [CrossRef]
  4. Sancar, A. Structure and function of DNA photolyase and cryptochrome blue-light photoreceptors. Chem. Rev. 2003, 103, 2203–2238. [Google Scholar] [CrossRef] [PubMed]
  5. Conrad, K.S.; Manahan, C.C.; Crane, B.R. Photochemistry of flavoprotein light sensors. Nat. Chem. Biol. 2014, 10, 801–809. [Google Scholar] [CrossRef]
  6. Genick, U.K.; Gloria, E.O.B.; Ng, K.; Ren, Z.; Pradervand, C.; Burke, P.M.; Šrajer, V.; Teng, T.-Y.; Schildkamp, W.; McRee, D.E.; et al. Structure of a Protein Photocycle Intermediate by Millisecond Time-Resolved Crystallography. Science 1997, 275, 1471–1475. [Google Scholar] [CrossRef] [PubMed]
  7. Šrajer, V.; Teng, T.-Y.; Ursby, T.; Pradervand, C.; Ren, Z.; Adachi, S.-I.; Schildkamp, W.; Bourgeois, D.; Wulff, M.; Moffat, K. Photolysis of the Carbon Monoxide Complex of Myoglobin: Nanosecond Time-Resolved Crystallography. Science 1996, 274, 1726–1729. [Google Scholar] [CrossRef]
  8. Coppens, P. The dramatic development of X-ray photocrystallography over the past six decades. Struct. Dyn. 2017, 4, 032102. [Google Scholar] [CrossRef] [Green Version]
  9. Coppens, P. What can time-resolved diffraction tell us about transient species?: Excited-state structure determination at atomic resolution. Chem. Commun. 2003, 12, 1317–1320. [Google Scholar] [CrossRef]
  10. Naumov, P. Chemical X-Ray Photodiffraction: Principles, Examples, and Perspectives. In Advanced X-Ray Crystallography; Rissanen, K., Ed.; Springer: Heidelberg/Berlin, Germany, 2012; pp. 111–131. [Google Scholar]
  11. Coppens, P.; Fournier, B. New methods in time-resolved Laue pump-probe crystallography at synchrotron sources. J. Synchrotron Rad. 2015, 22, 280–287. [Google Scholar] [CrossRef] [PubMed] [Green Version]
  12. Coppens, P. Molecular excited-state structure by time-resolved pump-probe X-ray diffraction. What is new and what are the prospects for further progress? J. Phys. Chem. Lett. 2011, 2, 616–621. [Google Scholar] [CrossRef]
  13. Coppens, P.; Benedict, J.B.; Messerschmidt, M.; Novozhilova, I.; Graber, T.; Chen, Y.-S.; Vorontsov, I.; Scheins, S.; Zheng, S.-L. Time-resolved synchrotron diffraction and theoretical studies of very short-lived photo-induced molecular species. Acta Cryst. Sect. A 2010, 66, 179–188. [Google Scholar] [CrossRef]
  14. Ren, Z.; Bourgeois, D.; Helliwell, J.R.; Moffat, K.; Šrajer, V.; Stoddard, B.L. Laue crystallography: Coming of age. J. Synchrotron Rad. 1999, 6, 891–917. [Google Scholar] [CrossRef]
  15. Hatcher, L.E.; Raithby, P.R. Dynamic single-crystal diffraction studies using synchrotron radiation. Coord. Chem. Rev. 2014, 277–278, 69–79. [Google Scholar] [CrossRef]
  16. Coppens, P.; Kamiński, R.; Schmøkel, M.S. On R factors for dynamic structure crystallography. Acta Cryst. Sect. A 2010, 66, 626–628. [Google Scholar] [CrossRef]
  17. Hajdu, J.; Machin, P.A.; Campbell, J.W.; Greenhough, T.J.; Clifton, I.J.; Zurek, S.; Gover, S.; Johnson, L.N.; Elder, M. Millisecond X-ray diffraction and the first electron density map from Laue photographs of a protein crystal. Nature 1987, 329, 178. [Google Scholar] [CrossRef]
  18. Šrajer, V.; Schmidt, M. Watching proteins function with time-resolved x-ray crystallography. J. Phys. D 2017, 50, 373001. [Google Scholar] [CrossRef]
  19. Jarzembska, K.N.; Hapka, M.; Kamiński, R.; Bury, W.; Kutniewska, S.E.; Szarejko, D.; Szczęśniak, M.M. On the nature of luminescence thermochromism of multinuclear copper(I) benzoate complexes in the crystalline state. Crystals 2019, 9, 36. [Google Scholar] [CrossRef] [Green Version]
  20. Coppens, P.; Zhang, L.; Thomas, R.; Chen, Y.; Jarzembska, K.; Kaminski, R.; Trzop, E.; Fournier, B. Can we deconvolute electron density changes from the dominant influence of the atomic rearrangement on molecular excitation in time-resolved diffraction studies? Phys. Scr. 2016, 91, 023003. [Google Scholar] [CrossRef]
  21. Jarzembska, K.N.; Kamiński, R.; Fournier, B.; Trzop, E.; Sokolow, J.D.; Henning, R.; Chen, Y.; Coppens, P. Shedding light on the photochemistry of coinage-metal phosphorescent materials: A time-resolved Laue diffraction study of an AgI-CuI tetranuclear complex. Inorg. Chem. 2014, 53, 10594–10601. [Google Scholar] [CrossRef] [Green Version]
  22. Makal, A.; Benedict, J.; Trzop, E.; Sokolow, J.; Fournier, B.; Chen, Y.; Kalinowski, J.A.; Graber, T.; Henning, R.; Coppens, P. Restricted photochemistry in the molecular solid state: Structural changes on photoexcitation of Cu(I) phenanthroline metal-to-ligand charge transfer (MLCT) complexes by time-resolved diffraction. J. Phys. Chem. A 2012, 116, 3359–3365. [Google Scholar] [CrossRef] [PubMed] [Green Version]
  23. Collet, E.; Moisan, N.; Baldé, C.; Bertoni, R.; Trzop, E.; Laulhé, C.; Lorenc, M.; Servol, M.; Cailleau, H.; Tissot, A.; et al. Ultrafast spin-state photoswitching in a crystal and slower consecutive processes investigated by femtosecond optical spectroscopy and picosecond X-ray diffraction. Phys. Chem. Chem. Phys. 2012, 14, 6192–6199. [Google Scholar] [CrossRef]
  24. Makal, A.; Trzop, E.; Sokolow, J.; Kalinowski, J.; Benedict, J.; Coppens, P. The development of Laue techniques for single-pulse diffraction of chemical complexes: Time-resolved Laue diffraction on a binuclear rhodium metal-organic complex. Acta Cryst. Sect. A 2011, 67, 319–326. [Google Scholar] [CrossRef] [Green Version]
  25. Benedict, J.B.; Makal, A.; Sokolow, J.D.; Trzop, E.; Scheins, S.; Henning, R.; Graber, T.; Coppens, P. Time-resolved Laue diffraction of excited species at atomic resolution: 100 ps single-pulse diffraction of the excited state of the organometallic complex Rh2(µ-PNP)2(PNP)2•BPh4. Chem. Commun. 2011, 47, 1704–1706. [Google Scholar] [CrossRef] [Green Version]
  26. Brayshaw, S.K.; Knight, J.W.; Raithby, P.R.; Savarese, T.L.; Schiffers, S.; Teat, S.J.; Warren, J.E.; Warren, M.R. Photocrystallography—Design and methodology for the use of a light-emitting diode device. J. Appl. Cryst. 2010, 43, 337–340. [Google Scholar] [CrossRef] [Green Version]
  27. Fullagar, W.K.; Wu, G.; Kim, C.; Ribaud, L.; Sagerman, G.; Coppens, P. Instrumentation for photocrystallographic experiments of transient species. J. Synchrotron Rad. 2000, 7, 229–235. [Google Scholar] [CrossRef] [PubMed] [Green Version]
  28. Mukaddem, K.T.; Cole, J.M.; Beyer, K.A.; Sylvester, S.O. Local Atomic Structure in Photoisomerized Ruthenium Sulfur Dioxide Complexes Revealed by Pair Distribution Function Analysis. J. Phys. Chem. C 2020, 124, 10094–10104. [Google Scholar] [CrossRef]
  29. Kovalevsky, A.Y.; Bagley, K.A.; Cole, J.M.; Coppens, P. Light-induced metastable linkage isomers of ruthenium sulfur dioxide complexes. Inorg. Chem. 2003, 42, 140–147. [Google Scholar] [CrossRef]
  30. Bowes, K.F.; Cole, J.M.; Husheer, S.L.G.; Raithby, P.R.; Savarese, T.L.; Sparkes, H.A.; Teat, S.J.; Warren, J.E. Photocrystallographic structure determination of a new geometric isomer of [Ru(NH3)4(H2O)(η1-OSO)][MeC6H4SO3]2. Chem. Commun. 2006, 2448–2450. [Google Scholar] [CrossRef]
  31. Sylvester, S.O.; Cole, J.M.; Waddell, P.G.; Nowell, H.; Wilson, C. SO2 phototriggered crystalline nanomechanical transduction of aromatic rotors in tosylates: Rationalization via photocrystallography of [Ru(NH3)4SO2X]tosylate2 (X = pyridine, 3-Cl-pyridine, 4-Cl-pyridine). J. Phys. Chem. C 2014, 118, 16003–16010. [Google Scholar] [CrossRef]
  32. Cole, J.M.; Velazquez-Garcia, J.d.J.; Gosztola, D.J.; Wang, S.G.; Chen, Y.-S. η2-SO2 Linkage photoisomer of an osmium coordination complex. Inorg. Chem. 2018, 57, 2673–2677. [Google Scholar] [CrossRef] [Green Version]
  33. Hatcher, L.E.; Skelton, J.M.; Warren, M.R.; Raithby, P.R. Photocrystallographic studies on transition metal nitrito metastable linkage isomers: Manipulating the metastable state. Acc. Chem. Res. 2019, 52, 1079–1088. [Google Scholar] [CrossRef]
  34. Hatcher, L.E.; Skelton, J.M.; Warren, M.R.; Stubbs, C.; Silvaa, E.L.d.; Raithby, P.R. Monitoring photo-induced population dynamics in metastable linkage isomer crystals: A crystallographic kinetic study of [Pd(Bu4dien)NO2]BPh4. Phys. Chem. Chem. Phys. 2018, 20, 5874–5886. [Google Scholar] [CrossRef] [Green Version]
  35. Hatcher, L.E.; Raithby, P.R. The impact of hydrogen bonding on 100% photo-switching in solid-state nitro-nitrito linkage isomers. Cryst. Eng. Comm. 2017, 19, 6297–6304. [Google Scholar] [CrossRef] [Green Version]
  36. Warren, M.R.; Easun, T.L.; Brayshaw, S.K.; Deeth, R.J.; George, M.W.; Johnson, A.L.; Schiffers, S.; Teat, S.J.; Warren, A.J.; Warren, J.E.; et al. Solid-state interconversions: Unique 100% reversible transformations between the ground and metastable states in single-crystals of a series of nickel(II) nitro complexes. Chem. Eur. J. 2014, 20, 5468–5477. [Google Scholar] [CrossRef] [PubMed] [Green Version]
  37. Hatcher, L.E.; Christensen, J.; Hamilton, M.L.; Trincao, J.; Allan, D.R.; Warren, M.R.; Clarke, I.P.; Towrie, M.; Fuertes, S.; Wilson, C.C.; et al. Steady-state and pseudo-steady-state photocrystallographic studies on linkage isomers of [Ni(Et4dien)(η2-O,ON)(η1-NO2)]: Identification of a new linkage isomer. Chem. Eur. J. 2014, 20, 3128–3134. [Google Scholar] [CrossRef] [PubMed] [Green Version]
  38. Warren, M.R.; Brayshaw, S.K.; Hatcher, L.E.; Johnson, A.L.; Schiffers, S.; Warren, A.J.; Teat, S.J.; Warren, J.E.; Woodall, C.H.; Raithby, P.R. Photoactivated linkage isomerism in single crystals of nickel, palladium and platinum di-nitro complexes—A photocrystallographic investigation. Dalton Trans. 2012, 41, 13173–13179. [Google Scholar] [CrossRef] [PubMed] [Green Version]
  39. Hatcher, L.E.; Warren, M.R.; Allan, D.R.; Brayshaw, S.K.; Johnson, A.L.; Fuertes, S.; Schiffers, S.; Stevenson, A.J.; Teat, S.J.; Woodall, C.H.; et al. Metastable linkage isomerism in [Ni(Et4dien)(NO2)2]: A combined thermal and photocrystallographic structural investigation of a nitro/nitrito interconversion. Angew. Chem. Int. Ed. 2011, 50, 8371–8374. [Google Scholar]
  40. Warren, M.R.; Brayshaw, S.K.; Johnson, A.L.; Schiffers, S.; Raithby, P.R.; Easun, T.L.; George, M.W.; Warren, J.E.; Teat, S.J. Reversible 100% linkage isomerization in a single-crystal to single-crystal transformation: Photocrystallographic identification of the metastable [Ni(dppe)(η1-ONO)Cl] isomer. Angew. Chem. Int. Ed. 2009, 48, 5711–5714. [Google Scholar] [CrossRef]
  41. Rodenbough, P.P.; Karothu, D.P.; Gjorgjieva, T.; Commins, P.; Hara, H.; Naumov, P. Reversible Photolysis of Nitrosobenzene cis-Dimer Monitored In Situ by Single Crystal Photocrystallography. Cryst. Growth Des. 2018, 18, 1293–1296. [Google Scholar] [CrossRef]
  42. Ohashi, Y. Real-time in situ observation of chemical reactions. Acta Cryst. Sect. A 1998, 54, 842–849. [Google Scholar] [CrossRef]
  43. Nakamura, I.; Sumitani, R.; Mochida, T. Nitro–Nitrito Photoisomerization of Cationic Platinum(II) Complexes in the Solid State: Reactivity in Polymorphic Crystals and Glassy State. Cryst. Growth Des. 2021, 21, 1861–1868. [Google Scholar] [CrossRef]
  44. Nakamura, I.; Funasako, Y.; Mochida, T. Nitro–Nitrito Photoisomerization of Platinum(II) Complexes with Pt(NO2)42– and (FSO2)2N– Anions: Correlation between Isomerization Ratio and Reaction Cavity. Cryst. Growth Des. 2020, 20, 8047–8052. [Google Scholar] [CrossRef]
  45. Kutniewska, S.E.; Krówczyński, A.; Kamiński, R.; Jarzembska, K.N.; Pillet, S.; Wenger, E.; Schaniel, D. Photocrystallographic and spectroscopic studies of a model (N,N,O)-donor square-planar nickel(II) nitro complex: In search of high-conversion and stable photoswitchable materials. IUCrJ 2020, 7, 1188–1198. [Google Scholar] [CrossRef]
  46. Kutniewska, S.E.; Kamiński, R.; Buchowicz, W.; Jarzembska, K.N. Photo- and thermoswitchable half-sandwich nickel(II) complex: [Ni(η5-C5H5)(IMes)(η1-NO2)]. Inorg. Chem. 2019, 58, 16712–16721. [Google Scholar] [CrossRef]
  47. Kim, C.D.; Pillet, S.; Wu, G.; Fullagar, W.K.; Coppens, P. Excited-state structure by time-resolved X-ray diffraction. Acta Cryst. Sect. A 2002, 58, 133–137. [Google Scholar] [CrossRef]
  48. Vorontsov, I.I.; Kovalevsky, A.Y.; Chen, Y.-S.; Graber, T.; Gembicky, M.; Novozhilova, I.V.; Omary, M.A.; Coppens, P. Shedding light on the structure of a photoinduced transient excimer by time-resolved diffraction. Phys. Rev. Lett. 2005, 94, 193003. [Google Scholar] [CrossRef] [Green Version]
  49. Hoshino, M.; Nozawa, S.; Sato, T.; Tomita, A.; Adachi, S.-I.; Koshihara, S.-y. Time-resolved X-ray crystal structure analysis for elucidating the hidden ‘over-neutralized’ phase of TTF-CA. RSC Adv. 2013, 3, 16313–16317. [Google Scholar] [CrossRef]
  50. Guérin, L.; Hébert, J.; Buron-Le Cointe, M.; Adachi, S.-I.; Koshihara, S.-Y.; Cailleau, H.; Collet, E. Capturing One-Dimensional Precursors of a Photoinduced Transformation in a Material. Phys. Rev. Lett. 2010, 105, 246101. [Google Scholar] [CrossRef]
  51. Schotte, F.; Cho, H.S.; Kaila, V.R.I.; Kamikubo, H.; Dashdorj, N.; Henry, E.R.; Graber, T.J.; Henning, R.; Wulff, M.; Hummer, G.; et al. Watching a signaling protein function in real time via 100-ps time-resolved Laue crystallography. Proc. Natl. Acad. Sci. USA 2012, 109, 19256–19261. [Google Scholar] [CrossRef] [PubMed] [Green Version]
  52. Schotte, F.; Lim, M.; Jackson, T.A.; Smirnov, A.V.; Soman, J.; Olson, J.S.; Phillips, G.N., Jr.; Wulff, M.; Anfinrud, P.A. Watching a protein as it functions with 150-ps time-resolved x-ray crystallography. Science 2003, 300, 1944–1947. [Google Scholar] [CrossRef] [Green Version]
  53. Knapp, J.E.; Pahl, R.; Srajer, V.; Royer, W.E., Jr. Allosteric action in real time: Time-resolved crystallographic studies of a cooperative dimeric hemoglobin. Proc. Natl. Acad. Sci. USA 2006, 103, 7649–7654. [Google Scholar] [CrossRef] [Green Version]
  54. Graber, T.; Anderson, S.; Brewer, H.; Chen, Y.-S.; Cho, H.; Dashdorj, N.; Henning, R.W.; Kosheleva, I.; Macha, G.; Meron, M.; et al. BioCARS: A synchrotron resource for time-resolved X-ray science. J. Synchrotron Rad. 2011, 18, 658–670. [Google Scholar] [CrossRef] [Green Version]
  55. Wulff, M.; Plech, A.; Eybert, L.; Randler, R.; Schotte, F.; Anfinrud, P. Realisation of sub-nanosecond pump and probe experiments at the ESRF. Farad. Discuss. 2002, 122, 13–26. [Google Scholar] [CrossRef]
  56. Cammarata, M.; Ewald, F.; Eybert, L.; Reichenbach, W.; Wulff, M.; Anfinrud, P.; Schotte, F.; Kong, Q.; Lindenau, B.; Rabiger, J.; et al. Chopper system for single pulse experiments with synchrotron radiation. Rev. Sci. Instrum. 2009, 80, 015101–015111. [Google Scholar] [CrossRef] [PubMed] [Green Version]
  57. Nozawa, S.; Adachi, S.-I.; Takahashi, J.-I.; Tazaki, R.; Guérin, L.; Daimon, M.; Tomita, A.; Sato, T.; Chollet, M.; Collet, E.; et al. Developing 100 ps-resolved X-ray structural analysis capabilities on beamline NW14A at the Photon Factory Advanced Ring. J. Synchrotron Rad. 2007, 14, 313–319. [Google Scholar] [CrossRef] [Green Version]
  58. Wu, L.-C.; Lee, J.-J.; Chang, S.-H.; Lee, M.-H.; Liao, B.-Y. Micro-crystal x-ray diffraction beamline—Advanced and non-ambient crystallography. AIP Conf. Proc. 2019, 2054, 060029. [Google Scholar]
  59. Helliwell, J.R.; Habash, J.; Cruickshank, D.W.J.; Harding, M.M.; Greenhough, T.J.; Campbell, J.W.; Clifton, I.J.; Elder, M.; Machin, P.A.; Papiz, M.Z.; et al. The recording and analysis of synchrotron X-radiation Laue diffraction photographs. J. Appl. Cryst. 1989, 22, 483–497. [Google Scholar] [CrossRef]
  60. Campbell, J.W. LAUEGEN, an X-windows-based program for the processing of Laue diffraction data. J. Appl. Cryst. 1995, 28, 228–236. [Google Scholar] [CrossRef]
  61. Šrajer, V.; Crosson, S.; Schmidt, M.; Key, J.; Schotte, F.; Anderson, S.; Perman, B.; Ren, Z.; Teng, T.-Y.; Bourgeois, D.; et al. Extraction of accurate structure factor amplitudes from Laue data: Wavelength normalization with wiggler and undulator X-ray sources. J. Synchrotron Rad. 2000, 7, 236–244. [Google Scholar] [CrossRef] [PubMed] [Green Version]
  62. Messerschmidt, M.; Tschentscher, T. LaueGUI—An open source Matlab tool for online inspection of time-resolved Laue diffraction patterns. Acta Cryst. Sect. A 2008, 64, C611. [Google Scholar] [CrossRef] [Green Version]
  63. Kalinowski, J.A.; Makal, A.; Coppens, P. The LaueUtil toolkit for Laue photocrystallography: I. Rapid orientation matrix determination for intermediate size unit-cell Laue data. J. Appl. Cryst. 2011, 44, 1182–1189. [Google Scholar] [CrossRef] [PubMed] [Green Version]
  64. Kalinowski, J.A.; Fournier, B.; Makal, A.; Coppens, P. The LaueUtil toolkit for Laue photocrystallography. II. Spot finding and integration. J. Synchrotron Rad. 2012, 19, 637–646. [Google Scholar] [CrossRef] [Green Version]
  65. Bolotovsky, R.; White, M.E.; Darovsky, A.; Coppens, P. The ‘seed-skewness’ method for integration of peaks on imaging plates. J. Appl. Cryst. 1995, 28, 86–95. [Google Scholar] [CrossRef]
  66. Bolotovsky, R.; Coppens, P. The ‘seed-skewness’ method for integration of peaks on imaging plates II. Analysis of bias due to finite size of the peak mask and treatment of α12 splitting. J. Appl. Cryst. 1997, 30, 244–253. [Google Scholar] [CrossRef]
  67. Peters, J. The ‘seed-skewness’ integration method generalized for three-dimensional Bragg peaks. J. Appl. Cryst. 2003, 36, 1475–1479. [Google Scholar] [CrossRef]
  68. Szarejko, D.; Kamiński, R.; Łaski, P.; Jarzembska, K.N. Seed-skewness algorithm for X-ray diffraction signal detection in the time-resolved synchrotron Laue photocrystallography. J. Synchrotron Rad. 2020, 27, 405–413. [Google Scholar] [CrossRef] [Green Version]
  69. Pierre, S. Morphological Image Anaysis. Principles and Aplications; Springer: Berlin/Heidelberg, Germany, 2003. [Google Scholar]
  70. Straasø, T.; Müter, D.; Sørensen, H.O.; Als-Nielsen, J. Objective algorithm to separate signal from noise in a Poisson-distributed pixel data set. J. Appl. Cryst. 2013, 46, 663–671. [Google Scholar] [CrossRef]
  71. Kamiński, R.; Szarejko, D.; Pedersen, M.N.; Hatcher, L.E.; Łaski, P.; Raithby, P.R.; Wulff, M.; Jarzembska, K.N. Instrument-model refinement in normalised reciprocal-vector space for X-ray Laue diffraction. J. Appl. Cryst. 2020, 53, 1370–1375. [Google Scholar] [CrossRef] [PubMed]
  72. Gevorkov, Y.; Barty, A.; Brehm, W.; White, T.A.; Tolstikova, A.; Wiedorn, M.O.; Meents, A.; Grigat, R.-R.; Chapman, H.N.; Yefanov, O. PinkIndexer—A universal indexer for pink-beam X-ray and electron diffraction snapshots. Acta Cryst. Sect. A 2020, 76, 121–131. [Google Scholar] [CrossRef]
  73. Coppens, P.; Pitak, M.; Gembicky, M.; Messerschmidt, M.; Scheins, S.; Benedict, J.B.; Adachi, S.-I.; Sato, T.; Nozawa, S.; Ichiyanagi, K.; et al. The RATIO method for time-resolved Laue crystallography. J. Synchrotron Rad. 2009, 16, 226–230. [Google Scholar] [CrossRef]
  74. Blessing, R.H. DREAM—Data reduction and error analysis routines for accurate single-crystal diffraction intensity measurements. J. Appl. Cryst. 1986, 19, 412. [Google Scholar] [CrossRef]
  75. Blessing, R.H. Data reduction and error analysis for accurate single crystal diffraction intensities. Cryst. Rev. 1987, 1, 3–58. [Google Scholar] [CrossRef]
  76. Blessing, R.H.; Langs, D.A. Data averaging with normal down-weighting of outliers. J. Appl. Cryst. 1987, 20, 427–428. [Google Scholar] [CrossRef]
  77. Blessing, R.H. DREADD—Data reduction and error analysis for single-crystal diffractometer data. J. Appl. Cryst. 1989, 22, 396–397. [Google Scholar] [CrossRef]
  78. Blessing, R.H. Outlier treatment in data merging. J. Appl. Cryst. 1997, 30, 421–426. [Google Scholar] [CrossRef]
  79. Fournier, B.; Sokolow, J.; Coppens, P. Analysis of multicrystal pump-probe data sets. II. Scaling of ratio data sets. Acta Cryst. Sect. A 2016, 72, 250–260. [Google Scholar] [CrossRef]
  80. Coppens, P.; Fournier, B. On the scaling of multicrystal data sets collected at high-intensity X-ray and electron sources. Struct. Dyn. 2015, 2, 064101. [Google Scholar] [CrossRef]
  81. Fournier, B.; Coppens, P. Analysis of multicrystal pump-probe data sets. I. Expressions for the RATIO model. Acta Cryst. Sect. A 2014, 70, 514–517. [Google Scholar] [CrossRef] [Green Version]
  82. Vorontsov, I.; Pillet, S.; Kamiński, R.; Schmøkel, M.S.; Coppens, P. LASER—A program for response-ratio refinement of time-resolved diffraction data. J. Appl. Cryst. 2010, 43, 1129–1130. [Google Scholar] [CrossRef]
  83. Velazquez-Garcia, J.d.J.; Wong, J.; Basuroy, K.; Storozhuk, D.; Saouane, S.; Henning, R.; Techert, S. A Comparative Analysis on LaueUtil and PRECOGNITION Software Packages as Tools in Treating the Small Molecule Time-Resolved Laue Diffraction Measurements at High Flux X-ray facilities. arXiv 2020, arXiv:2010.05781v1. [Google Scholar]
  84. Coppens, P.; Makal, A.; Fournier, B.; Jarzembska, K.N.; Kamiński, R.; Basuroy, K.; Trzop, E. A priori checking of the light-response and data quality before extended data collection in pump-probe photocrystallography experiments. Acta Cryst. Sect. B 2017, 73, 23–26. [Google Scholar] [CrossRef] [Green Version]
  85. Casaretto, N.; Schaniel, D.; Alle, P.; Wenger, E.; Parois, P.; Fournier, B.; Bendeif, E.-E.; Palin, C.; Pillet, S. In-house time-resolved photocrystallography on the millisecond timescale using a gated X-ray hybrid pixel area detector. Acta Cryst. Sect. B 2017, 73, 696–707. [Google Scholar] [CrossRef] [PubMed] [Green Version]
  86. Trzop, E.; Fournier, B.; Jarzembska, K.; Sokolow, J.; Kaminski, R.; Benedict, J.; Chen, Y.; Henning, R.; Coppens, P. Selective time-dependent changes of Cu(DPPE)(DMP)·PF6 on photoexcitation. Acta Cryst. Sect. A 2014, 70, C776. [Google Scholar] [CrossRef] [Green Version]
  87. Basuroy, K.; Chen, Y.; Sarkar, S.; Benedict, J.; Coppens, P. Exploring the structural changes on excitation of a luminescent organic bromine-substituted complex by in-house time-resolved pump-probe diffraction. Struct. Dyn. 2017, 4, 024501. [Google Scholar] [CrossRef] [Green Version]
  88. Kaminski, R.; Benedict, J.; Trzop, E.; Jarzembska, K.; Fournier, B.; Coppens, P. First steps towards time-resolved ‘in-house’ X-ray diffraction experiments. Acta Cryst. Sect. A 2014, 70, C775. [Google Scholar] [CrossRef]
  89. Cox, J.M.; Walton, I.M.; Patel, D.G.D.; Xu, M.; Chen, Y.-S.; Benedict, J.B. The temperature dependent photoswitching of a classic diarylethene monitored by in situ X-ray diffraction. J. Phys. Chem. A 2015, 119, 884–888. [Google Scholar] [CrossRef] [PubMed]
  90. Kamiński, R.; Jarzembska, K.N.; Kutyła, S.E.; Kamiński, M. A portable light-delivery device for in situ photocrystallographic experiments at home laboratory. J. Appl. Cryst. 2016, 49, 1383–1387. [Google Scholar] [CrossRef]
  91. Kamiński, R.; Benedict, J.B.; Nottingham, G.; Coppens, P. An optical chopper for generation of short X-ray pulses to allow in-house time-resolved photocrystallography. J. Appl. Cryst. 2014, 47, 1765–1768. [Google Scholar] [CrossRef]
  92. Cruickshank, D.W.J.; Helliwell, J.R.; Moffat, K. Multiplicity distribution of reflections in Laue diffraction. Acta Cryst. Sect. A 1987, 43, 656–674. [Google Scholar] [CrossRef]
  93. Cruickshank, D.W.J.; Helliwell, J.R.; Moffat, K. Angular distribution of reflections in Laue diffraction. Acta Cryst. Sect. A 1991, 47, 352–373. [Google Scholar] [CrossRef]
  94. Ren, Z.; Moffat, K. Structure refinement against synchrotron Laue data: Strategies for data collection and reduction. J. Appl. Cryst. 1995, 28, 461–481. [Google Scholar] [CrossRef]
  95. Schmidt, M.; Rajagopal, S.; Ren, Z.; Moffat, K. Application of singular value decomposition to the analysis of time-resolved macromolecular X-ray data. Biophys. J. 2003, 84, 2112–2129. [Google Scholar] [CrossRef] [Green Version]
  96. Blakley, R.L.; Yin, Y.; Lloyd, C.; Mague, J.T.; McPherson, G.L. Photophysics of a flexible ligand bridged rhodium(I) dimer: An excited state conformational change in a crystalline solid. Chem. Phys. Lett. 1989, 157, 398–402. [Google Scholar] [CrossRef]
  97. Mague, J.T. Conformational diversity in the solid state structures of [Rh2(μ-CH3N(P(OCH3)2)2)2(CH3N(P(OCH3)2)2)2]X2 (X = O3SCF3, B(C6H5)4). Inorg. Chim. Acta 1995, 229, 17–25. [Google Scholar] [CrossRef]
  98. Schubert, H.; Wesemann, L. Silver dimer, tetramer, polymer, and network structures with the stannylene stanna-closo-dodecaborate. Organometallics 2010, 29, 4906–4913. [Google Scholar] [CrossRef]
  99. Jarzembska, K.N.; Kamiński, R.; Dziubek, K.F.; Citroni, M.; Paliwoda, D.; Durka, K.; Fanetti, S.; Bini, R. Impact of high pressure on metallophilic interactions and its consequences for spectroscopic properties of a model tetranuclear silver(I)-copper(I) complex in the solid state. Inorg. Chem. 2018, 57, 8509–8520. [Google Scholar] [CrossRef] [PubMed]
  100. Vorontsov, I.I.; Graber, T.; Kovalevsky, A.Y.; Novozhilova, I.V.; Gembicky, M.; Chen, Y.-S.; Coppens, P. Capturing and analyzing the excited-state structure of a Cu(I) phenanthroline complex by time-resolved diffraction and theoretical calculations. J. Am. Chem. Soc. 2009, 131, 6566–6573. [Google Scholar] [CrossRef] [PubMed]
  101. Caleman, C.; Martin, A.V. When Diffraction Stops and Destruction Begins. In X-ray Free Electron Lasers: A Revolution in Structural Biology; Boutet, S., Fromme, P., Hunter, M.S., Eds.; Springer International Publishing: Cham, Switzerland, 2018; pp. 185–207. [Google Scholar]
  102. Spence, J.C.H.; Weierstall, U.; Chapman, H.N. X-ray lasers for structural and dynamic biology. Rep. Prog. Phys. 2012, 75, 102601. [Google Scholar] [CrossRef] [Green Version]
  103. Howells, M.R.; Beetz, T.; Chapman, H.N.; Cui, C.; Holton, J.M.; Jacobsen, C.J.; Kirz, J.; Lima, E.; Marchesini, S.; Miao, H.; et al. An assessment of the resolution limitation due to radiation-damage in x-ray diffraction microscopy. J. Electron. Spectrosc. Relat. Phenom. 2009, 170, 4–12. [Google Scholar] [CrossRef] [PubMed] [Green Version]
  104. Sierra, R.G.; Batyuk, A.; Sun, Z.; Aquila, A.; Hunter, M.S.; Lane, T.J.; Liang, M.; Yoon, C.H.; Alonso-Mori, R.; Armenta, R.; et al. The Macromolecular Femtosecond Crystallography Instrument at the Linac Coherent Light SourceThis article will form part of a virtual special issue on X-ray free-electron lasers. J. Synchrotron Rad. 2019, 26, 346–357. [Google Scholar] [CrossRef] [PubMed]
  105. Martiel, I.; Muller-Werkmeister, H.M.; Cohen, A.E. Strategies for sample delivery for femtosecond crystallography. Acta Cryst. Sect. D 2019, 75, 160–177. [Google Scholar] [CrossRef] [Green Version]
  106. Zhao, F.-Z.; Zhang, B.; Yan, E.-K.; Sun, B.; Wang, Z.-J.; He, J.-H.; Yin, D.-C. A guide to sample delivery systems for serial crystallography. FEBS J. 2019, 286, 4402–4417. [Google Scholar] [CrossRef] [Green Version]
  107. Schmidt, M. Mix and Inject: Reaction Initiation by Diffusion for Time-Resolved Macromolecular Crystallography. Adv. Condens. Matter Phys. 2013, 2013, 167276. [Google Scholar] [CrossRef] [Green Version]
  108. Mehrabi, P.; Muller-Werkmeister, H.M.; Leimkohl, J.-P.; Schikora, H.; Ninkovic, J.; Krivokuca, S.; Andricek, L.; Epp, S.W.; Sherrell, D.; Owen, R.L.; et al. The HARE chip for efficient time-resolved serial synchrotron crystallography. J. Synchrotron Rad. 2020, 27, 360–370. [Google Scholar] [CrossRef] [PubMed] [Green Version]
  109. Bostedt, C.; Boutet, S.; Fritz, D.M.; Huang, Z.; Lee, H.J.; Lemke, H.T.; Robert, A.; Schlotter, W.F.; Turner, J.J.; Williams, G.J. Linac Coherent Light Source: The first five years. Rev. Mod. Phys. 2016, 88, 015007. [Google Scholar] [CrossRef] [Green Version]
  110. Ding, Y.; Brachmann, A.; Decker, F.J.; Dowell, D.; Emma, P.; Frisch, J.; Gilevich, S.; Hays, G.; Hering, P.; Huang, Z.; et al. Measurements and Simulations of Ultralow Emittance and Ultrashort Electron Beams in the Linac Coherent Light Source. Phys. Rev. Lett. 2009, 102, 254801. [Google Scholar] [CrossRef] [Green Version]
  111. Emma, P.; Bane, K.; Cornacchia, M.; Huang, Z.; Schlarb, H.; Stupakov, G.; Walz, D. Femtosecond and Subfemtosecond X-Ray Pulses from a Self-Amplified Spontaneous-Emission-Based Free-Electron Laser. Phys. Rev. Lett. 2004, 92, 074801. [Google Scholar] [CrossRef] [Green Version]
  112. Dasgupta, M.; Budday, D.; de Oliveira, S.H.P.; Madzelan, P.; Marchany-Rivera, D.; Seravalli, J.; Hayes, B.; Sierra, R.G.; Boutet, S.; Hunter, M.S.; et al. Mix-and-inject XFEL crystallography reveals gated conformational dynamics during enzyme catalysis. Proc. Natl. Acad. Sci. USA 2019, 116, 25634–25640. [Google Scholar] [CrossRef] [PubMed]
  113. Chollet, M.; Alonso-Mori, R.; Cammarata, M.; Damiani, D.; Defever, J.; Delor, J.T.; Feng, Y.; Glownia, J.M.; Langton, J.B.; Nelson, S.; et al. The X-ray Pump-Probe instrument at the Linac Coherent Light Source. J. Synchrotron Rad. 2015, 22, 503–507. [Google Scholar] [CrossRef] [Green Version]
  114. Yabashi, M.; Tanaka, H.; Ishikawa, T. Overview of the SACLA facility. J. Synchrotron Rad. 2015, 22, 477–484. [Google Scholar] [CrossRef] [Green Version]
  115. Shintake, T.; Tanaka, H.; Hara, T.; Tanaka, T.; Togawa, K.; Yabashi, M.; Otake, Y.; Asano, Y.; Bizen, T.; Fukui, T.; et al. A compact free-electron laser for generating coherent radiation in the extreme ultraviolet region. Nat. Photonics 2008, 2, 555–559. [Google Scholar] [CrossRef]
  116. Yabashi, M.; Tanaka, H.; Tono, K.; Ishikawa, T. Status of the SACLA Facility. Appl. Sci. 2017, 7, 604. [Google Scholar] [CrossRef] [Green Version]
  117. Palmer, G.; Kellert, M.; Wang, J.; Emons, M.; Wegner, U.; Kane, D.; Pallas, F.; Jezynski, T.; Venkatesan, S.; Rompotis, D.; et al. Pump-probe laser system at the FXE and SPB/SFX instruments of the European X-ray Free-Electron Laser FacilityThis article will form part of a virtual special issue on X-ray free-electron lasers. J. Synchrotron Rad. 2019, 26, 328–332. [Google Scholar] [CrossRef] [PubMed]
  118. Geloni, G.; Saldin, E.; Samoylova, L.; Schneidmiller, E.; Sinn, H.; Tschentscher, T.; Yurkov, M. Coherence properties of the European XFEL. New J. Phys. 2010, 12, 035021. [Google Scholar] [CrossRef]
  119. Mancuso, A.P.; Aquila, A.; Batchelor, L.; Bean, R.J.; Bielecki, J.; Borchers, G.; Doerner, K.; Giewekemeyer, K.; Graceffa, R.; Kelsey, O.D.; et al. The Single Particles, Clusters and Biomolecules and Serial Femtosecond Crystallography instrument of the European XFEL: Initial installationThis article will form part of a virtual special issue on X-ray free-electron lasers. J. Synchrotron Rad. 2019, 26, 660–676. [Google Scholar] [CrossRef] [PubMed]
  120. Barty, A.; Kirian, R.A.; Maia, F.R.N.C.; Hantke, M.; Yoon, C.H.; White, T.A.; Chapman, H. Cheetah: Software for high-throughput reduction and analysis of serial femtosecond X-ray diffraction data. J. Appl. Crystallogr. 2014, 47, 1118–1131. [Google Scholar] [CrossRef] [Green Version]
  121. White, T.A.; Kirian, R.A.; Martin, A.V.; Aquila, A.; Nass, K.; Barty, A.; Chapman, H.N. CrystFEL: A software suite for snapshot serial crystallography. J. Appl. Crystallogr. 2012, 45, 335–341. [Google Scholar] [CrossRef] [Green Version]
  122. Duisenberg, A. Indexing in single-crystal diffractometry with an obstinate list of reflections. J. Appl. Cryst. 1992, 25, 92–96. [Google Scholar] [CrossRef]
  123. Battye, T.G.G.; Kontogiannis, L.; Johnson, O.; Powell, H.R.; Leslie, A.G.W. iMOSFLM: A new graphical interface for diffraction-image processing with MOSFLM. Acta Cryst. Sect. D 2011, 67, 271–281. [Google Scholar] [CrossRef] [PubMed] [Green Version]
  124. Woodhouse, J.; Kovacs, G.N.; Coquelle, N.; Uriarte, L.M.; Adam, V.; Barends, T.R.M.; Byrdin, M.; de la Mora, E.; Bruce Doak, R.; Feliks, M.; et al. Photoswitching mechanism of a fluorescent protein revealed by time-resolved crystallography and transient absorption spectroscopy. Nat. Commun. 2020, 11, 741. [Google Scholar] [CrossRef] [PubMed] [Green Version]
  125. Grotjohann, T.; Testa, I.; Reuss, M.; Brakemann, T.; Eggeling, C.; Hell, S.W.; Jakobs, S. rsEGFP2 enables fast RESOLFT nanoscopy of living cells. eLife 2012, 1, e00248. [Google Scholar] [CrossRef]
  126. Gustafsson, M.G.L. Nonlinear structured-illumination microscopy: Wide-field fluorescence imaging with theoretically unlimited resolution. Proc. Natl. Acad. Sci. USA 2005, 102, 13081. [Google Scholar] [CrossRef] [Green Version]
  127. Hofmann, M.; Eggeling, C.; Jakobs, S.; Hell, S.W. Breaking the diffraction barrier in fluorescence microscopy at low light intensities by using reversibly photoswitchable proteins. Proc. Natl. Acad. Sci. USA 2005, 102, 17565. [Google Scholar] [CrossRef] [Green Version]
  128. Adam, V.; Berardozzi, R.; Byrdin, M.; Bourgeois, D. Phototransformable fluorescent proteins: Future challenges. Curr. Opin. Chem. Biol. 2014, 20C, 92–102. [Google Scholar] [CrossRef]
  129. Nienhaus, K.; Ulrich Nienhaus, G. Fluorescent proteins for live-cell imaging with super-resolution. Chem. Soc. Rev. 2014, 43, 1088–1106. [Google Scholar] [CrossRef] [PubMed]
  130. Barends, T.; Foucar, L.; Ardevol, A.; Nass, K.; Aquila, A.; Botha, S.; Doak, R.; Falahati, K.; Hartmann, E.; Hilpert, M.; et al. Direct observation of ultrafast collective motions in CO myoglobin upon ligand dissociation. Science 2015, 350, 445–450. [Google Scholar] [CrossRef]
  131. Coquelle, N.; Sliwa, M.; Woodhouse, J.; Schirò, G.; Adam, V.; Aquila, A.; Barends, T.; Boutet, S.; Byrdin, M.; Carbajo, S.; et al. Chromophore twisting in the excited state of a photoswitchable fluorescent protein captured by time-resolved serial femtosecond crystallography. Nat. Chem. 2017, 10, 31–37. [Google Scholar] [CrossRef] [PubMed]
  132. Nango, E.; Royant, A.; Kubo, M.; Nakane, T.; Wickstrand, C.; Kimura, T.; Tanaka, T.; Tono, K.; Song, C.; Tanaka, R.; et al. A three-dimensional movie of structural changes in bacteriorhodopsin. Science 2016, 354, 1552–1557. [Google Scholar] [CrossRef]
  133. Pande, K.; Hutchison, C.; Groenhof, G.; Aquila, A.; Robinson, J.; Tenboer, J.; Basu, S.; Boutet, S.; DePonte, D.; Liang, M.; et al. Femtosecond Structural Dynamics Drives the Trans/Cis Isomerization in Photoactive Yellow Protein. Science 2016, 352, 725–729. [Google Scholar] [CrossRef] [PubMed] [Green Version]
  134. Shimada, A.; Kubo, M.; Baba, S.; Yamashita, K.; Hirata, K.; Ueno, G.; Nomura, T.; Kimura, T.; Shinzawa-Itoh, K.; Baba, J.; et al. A nanosecond time-resolved XFEL analysis of structural changes associated with CO release from cytochrome C oxidase. Sci. Adv. 2017, 3, e1603042. [Google Scholar] [CrossRef] [Green Version]
  135. Suga, M.; Akita, F.; Sugahara, M.; Kubo, M.; Yoshiki, N.; Nakane, T.; Yamashita, K.; Umena, Y.; Nakabayashi, M.; Yamane, T.; et al. Light-induced structural changes and the site of O=O bond formation in PSII caught by XFEL. Nature 2017, 543, 131–135. [Google Scholar] [CrossRef]
  136. Tenboer, J.; Basu, S.; Zatsepin, N.; Pande, K.; Milathianaki, D.; Frank, M.; Hunter, M.; Boutet, S.; Williams, G.; Koglin, J.; et al. Time-Resolved Serial Crystallography Captures High Resolution Intermediates of Photoactive Yellow Protein. Science 2014, 346, 1242–1246. [Google Scholar] [CrossRef] [Green Version]
  137. Grünbein, M.L.; Bielecki, J.; Gorel, A.; Stricker, M.; Bean, R.; Cammarata, M.; Dörner, K.; Fröhlich, L.; Hartmann, E.; Hauf, S.; et al. Megahertz data collection from protein microcrystals at an X-ray free-electron laser. Nat. Commun. 2018, 9, 3487. [Google Scholar] [CrossRef] [PubMed]
  138. Wiedorn, M.; Oberthuer, D.; Bean, R.; Schubert, R.; Werner, N.; Abbey, B.; Aepfelbacher, M.; Adriano, L.; Allahgholi, A.; Al-Qudami, N.; et al. Megahertz serial crystallography. Nat. Commun. 2018, 9, 4025. [Google Scholar] [CrossRef] [PubMed] [Green Version]
  139. Pandey, S.; Bean, R.; Sato, T.; Poudyal, I.; Bielecki, J.; Cruz Villarreal, J.; Yefanov, O.; Mariani, V.; White, T.A.; Kupitz, C.; et al. Time-resolved serial femtosecond crystallography at the European XFEL. Nat. Methods 2020, 17, 73–78. [Google Scholar] [CrossRef] [PubMed]
  140. Creelman, M.; Kumauchi, M.; Hoff, W.D.; Mathies, R.A. Chromophore Dynamics in the PYP Photocycle from Femtosecond Stimulated Raman Spectroscopy. J. Phys. Chem. B 2014, 118, 659–667. [Google Scholar] [CrossRef]
  141. Carlos, J.L.; Karl, R.R.; Bauer, S.H. Gas phase electron diffraction study of six fluoroethylenes. J. Chem. Soc. Faraday Trans. 1974, 70, 177–187. [Google Scholar] [CrossRef]
  142. Jiang, Y.; Liu, L.C.; Müller-Werkmeister, H.M.; Lu, C.; Zhang, D.; Field, R.L.; Sarracini, A.; Moriena, G.; Collet, E.; Miller, R.J.D. Structural Dynamics upon Photoexcitation in a Spin Crossover Crystal Probed with Femtosecond Electron Diffraction. Angew. Chem. Int. Ed. 2017, 56, 7130–7134. [Google Scholar] [CrossRef]
  143. Nannenga, B.L.; Gonen, T. The cryo-EM method microcrystal electron diffraction (MicroED). Nat. Methods 2019, 16, 369–379. [Google Scholar] [CrossRef]
  144. Mancini, G.F.; Latychevskaia, T.; Pennacchio, F.; Reguera, J.; Stellacci, F.; Carbone, F. Order/Disorder Dynamics in a Dodecanethiol-Capped Gold Nanoparticles Supracrystal by Small-Angle Ultrafast Electron Diffraction. Nano Lett. 2016, 16, 2705–2713. [Google Scholar] [CrossRef] [PubMed]
  145. Hada, M.; Nishina, Y.; Kato, T. Exploring Structures and Dynamics of Molecular Assemblies: Ultrafast Time-Resolved Electron Diffraction Measurements. Acc. Chem. Res. 2021, 54, 731–743. [Google Scholar] [CrossRef] [PubMed]
  146. Jean-Ruel, H.; Gao, M.; Kochman, M.A.; Lu, C.; Liu, L.C.; Cooney, R.R.; Morrison, C.A.; Miller, R.J.D. Ring-closing reaction in diarylethene captured by femtosecond electron crystallography. J. Phys. Chem. B 2013, 117, 15894–15902. [Google Scholar] [CrossRef] [PubMed] [Green Version]
  147. Gao, M.; Jean-Ruel, H.; Cooney, R.R.; Stampe, J.; de Jong, M.; Harb, M.; Sciaini, G.; Moriena, G.; Dwayne Miller, R.J. Full characterization of RF compressed femtosecond electron pulses using ponderomotive scattering. Opt. Express 2012, 20, 12048–12058. [Google Scholar] [CrossRef] [PubMed] [Green Version]
  148. Jean-Ruel, H.; Cooney, R.R.; Gao, M.; Lu, C.; Kochman, M.A.; Morrison, C.A.; Miller, R.J.D. Femtosecond dynamics of the ring closing process of diarylethene: A case study of electrocyclic reactions in photochromic single crystals. J. Phys. Chem. A 2011, 115, 13158–13168. [Google Scholar] [CrossRef] [PubMed] [Green Version]
  149. Ofori-Okai, B.K.; Hoffmann, M.C.; Reid, A.H.; Edstrom, S.; Jobe, R.K.; Li, R.K.; Mannebach, E.M.; Park, S.J.; Polzin, W.; Shen, X.; et al. A terahertz pump mega-electron-volt ultrafast electron diffraction probe apparatus at the SLAC Accelerator Structure Test Area facility. J. Instrum. 2018, 13, P06014. [Google Scholar] [CrossRef]
  150. Zimmerman, H.E.; Zuraw, M.J. Photochemistry in a box. Photochemical reactions of molecules entrapped in crystal lattices: Mechanistic and exploratory organic photochemistry. J. Am. Chem. Soc. 1989, 111, 7974–7989. [Google Scholar] [CrossRef]
  151. Weathersby, S.P.; Brown, G.; Centurion, M.; Chase, T.F.; Coffee, R.; Corbett, J.; Eichner, J.P.; Frisch, J.C.; Fry, A.R.; Gühr, M.; et al. Mega-electron-volt ultrafast electron diffraction at SLAC National Accelerator Laboratory. Rev. Sci. Instrum. 2015, 86, 073702. [Google Scholar] [CrossRef] [PubMed]
  152. Kampfrath, T.; Tanaka, K.; Nelson, K.A. Resonant and nonresonant control over matter and light by intense terahertz transients. Nat. Photonics 2013, 7, 680–690. [Google Scholar] [CrossRef]
  153. Hwang, H.Y.; Fleischer, S.; Brandt, N.C.; Perkins, B.G.; Liu, M.; Fan, K.; Sternbach, A.; Zhang, X.; Averitt, R.D.; Nelson, K.A. A review of non-linear terahertz spectroscopy with ultrashort tabletop-laser pulses. J. Mod. Opt. 2015, 62, 1447–1479. [Google Scholar] [CrossRef]
  154. Tanaka, K.; Hirori, H.; Nagai, M. THz Nonlinear Spectroscopy of Solids. IEEE Trans. Terahertz Sci. Technol. 2011, 1, 301–312. [Google Scholar] [CrossRef]
  155. Peiponen, K.-E.; Zeitler, A.; Kuwata-Gonokami, M. Terahertz Spectroscopy and Imaging; Springer: Berlin/Heidelberg, Germany, 2013. [Google Scholar]
  156. Wolf, T.J.A.; Sanchez, D.M.; Yang, J.; Parrish, R.M.; Nunes, J.P.F.; Centurion, M.; Coffee, R.; Cryan, J.P.; Gühr, M.; Hegazy, K.; et al. The photochemical ring-opening of 1,3-cyclohexadiene imaged by ultrafast electron diffraction. Nat. Chem. 2018, 11, 504–509. [Google Scholar] [CrossRef] [PubMed] [Green Version]
  157. Tromp, M.; Dent, A.J.; Headspith, J.; Easun, T.L.; Sun, X.-Z.; George, M.W.; Mathon, O.; Smolentsev, G.; Hamilton, M.L.; Evans, J. Energy Dispersive XAFS: Characterization of Electronically Excited States of Copper(I) Complexes. J. Phys. Chem. B 2013, 117, 7381–7387. [Google Scholar] [CrossRef] [PubMed]
  158. Díaz-Moreno, I.; Díaz-Quintana, A.; Subías, G.; Mairs, T.; De la Rosa, M.A.; Díaz-Moreno, S. Detecting transient protein-protein interactions by X-ray absorption spectroscopy: The cytochrome c6-photosystem I complex. FEBS Lett. 2006, 580, 3023–3028. [Google Scholar] [CrossRef] [PubMed]
  159. Kowalska, J.; DeBeer, S. The role of X-ray spectroscopy in understanding the geometric and electronic structure of nitrogenase. Biochim. Biophys. Acta Mol. Cell Res. 2015, 1853, 1406–1415. [Google Scholar] [CrossRef] [PubMed] [Green Version]
  160. Ishiguro, N.; Saida, T.; Uruga, T.; Nagamatsu, S.-I.; Sekizawa, O.; Nitta, K.; Yamamoto, T.; Ohkoshi, S.-I.; Iwasawa, Y.; Yokoyama, T.; et al. Operando Time-Resolved X-ray Absorption Fine Structure Study for Surface Events on a Pt3Co/C Cathode Catalyst in a Polymer Electrolyte Fuel Cell during Voltage-Operating Processes. ACS Catal. 2012, 2, 1319–1330. [Google Scholar] [CrossRef]
  161. Obara, Y.; Ito, H.; Ito, T.; Kurahashi, N.; Thürmer, S.; Tanaka, H.; Katayama, T.; Togashi, T.; Owada, S.; Yamamoto, Y.-I.; et al. Femtosecond time-resolved X-ray absorption spectroscopy of anatase TiO2 nanoparticles using XFEL. Struct. Dyn. 2017, 4, 044033. [Google Scholar] [CrossRef] [Green Version]
  162. Huang, J.; Günther, B.; Achterhold, K.; Cui, Y.-T.; Gleich, B.; Dierolf, M.; Pfeiffer, F. Energy-Dispersive X-ray Absorption Spectroscopy with an Inverse Compton Source. Sci. Rep. 2020, 10, 8772. [Google Scholar] [CrossRef]
  163. Zhang, J.; Zhang, X.; Suarez-Alcantara, K.; Jennings, G.; Kurtz, C.A.; Lawson Daku, L.M.; Canton, S.E. Resolving the Ultrafast Changes of Chemically Inequivalent Metal–Ligand Bonds in Photoexcited Molecular Complexes with Transient X-ray Absorption Spectroscopy. ACS Omega 2019, 4, 6375–6381. [Google Scholar] [CrossRef] [Green Version]
  164. Gawelda, W.; Pham, V.-T.; Benfatto, M.; Zaushitsyn, Y.; Kaiser, M.; Grolimund, D.; Johnson, S.L.; Abela, R.; Hauser, A.; Bressler, C.; et al. Structural Determination of a Short-Lived Excited Iron(II) Complex by Picosecond X-Ray Absorption Spectroscopy. Phys. Rev. Lett. 2007, 98, 057401. [Google Scholar] [CrossRef] [Green Version]
  165. Khan, S.; Holldack, K.; Kachel, T.; Mitzner, R.; Quast, T. Femtosecond Undulator Radiation from Sliced Electron Bunches. Phys. Rev. Lett. 2006, 97, 074801. [Google Scholar] [CrossRef]
  166. Beaud, P.; Johnson, S.L.; Streun, A.; Abela, R.; Abramsohn, D.; Grolimund, D.; Krasniqi, F.; Schmidt, T.; Schlott, V.; Ingold, G. Spatiotemporal Stability of a Femtosecond Hard--X-Ray Undulator Source Studied by Control of Coherent Optical Phonons. Phys. Rev. Lett. 2007, 99, 174801. [Google Scholar] [CrossRef]
  167. Zholents, A.A.; Zolotorev, M.S. Femtosecond X-Ray Pulses of Synchrotron Radiation. Phys. Rev. Lett. 1996, 76, 912–915. [Google Scholar] [CrossRef] [Green Version]
  168. Schoenlein, R.W.; Chattopadhyay, S.; Chong, H.H.W.; Glover, T.E.; Heimann, P.A.; Shank, C.V.; Zholents, A.A.; Zolotorev, M.S. Generation of Femtosecond Pulses of Synchrotron Radiation. Science 2000, 287, 2237–2240. [Google Scholar] [CrossRef] [PubMed] [Green Version]
  169. Milne, C.J.; Pham, V.-T.; Gawelda, W.; Veen, R.M.v.d.; Nahhas, A.E.; Johnson, S.L.; Beaud, P.; Ingold, G.; Lima, F.; Vithanage, D.A.; et al. Time-resolved x-ray absorption spectroscopy: Watching atoms dance. J. Phys. Conf. Ser. 2009, 190, 012052. [Google Scholar] [CrossRef]
  170. Schaniel, D.; Casaretto, N.; Bendeif, E.-E.; Woike, T.; Gallien, A.K.E.; Klüfers, P.; Kutniewska, S.E.; Kamiński, R.; Bouchez, G.; Boukheddaden, K.; et al. Evidence for a photoinduced isonitrosyl isomer in ruthenium dinitrosyl compounds. Cryst. Eng. Comm. 2019, 21, 5804–5810. [Google Scholar] [CrossRef] [Green Version]
  171. Schaniel, D.; Nicoul, M.; Woike, T. Ultrafast reversible ligand isomerisation in Na2[Fe(CN)5NO]·2H2O single crystals. Phys. Chem. Chem. Phys. 2010, 12, 9029–9033. [Google Scholar] [CrossRef]
  172. Liepuoniute, I.; Commins, P.; Karothu, D.P.; Schramm, S.; Hara, H.; Naumov, P. Reversible Multicolor Photochromism of Dihydroazulene Crystals. Chem. Eur. J. 2019, 25, 373–378. [Google Scholar] [CrossRef]
  173. Naumov, P.; Yu, P.; Sakurai, K. Electronic Tera-Order Stabilization of Photoinduced Metastable Species: Structure of the Photochromic Product of Spiropyran Determined with in situ Single Crystal X-ray Photodiffraction. J. Phys. Chem. A 2008, 112, 5810–5814. [Google Scholar] [CrossRef] [PubMed]
Figure 1. Schematic representation of the laser-pump/X-ray-probe experiments. The ground state of the system is excited with a laser-light pulse (large green arrow) to some higher-energy state with different geometrical features. Before the excited state relaxes back (dashed lines) to the ground state it is probed with the intense X-ray pulse. In this simple example ground state is indicated as singlet (S0), and possible excited states are shown as higher energy singlet (S1) and lower energy triplet (T1), the latter exhibiting larger molecular deformation and a rather long lifetime.
Crystals 11 01345 g001
Figure 2. Schematic representation of various types of photocrystallographic experiments: (a) static method, (b) quasi-static, (c) stroboscopic and (d) pump-probe. Dashed lines in (b,c) refer to the average population. Note that in all cases it is assumed that the processes are reversible. Figure based on Hatcher and Raithby [15].
Crystals 11 01345 g002
Figure 3. Schematic single-pulse isolation protocol implemented at the 14-ID-B BioCARS beamline at APS. Figure reproduced with permission of the International Union of Crystallography from Graber et al. [54].
Crystals 11 01345 g003
Figure 4. The idea behind the method: intensity of a selected pixel ( x , y ) is analysed vs. frame number. The procedure is repeated for every pixel on the detector surface. Figure reproduced with permission of the International Union of Crystallography from Szarejko et al. [68].
Crystals 11 01345 g004
Figure 5. Visualization of normalized reciprocal-space vectors for (a) experimental Laue data set, and (b) reference monochromatic data. Figure reproduced with permission of the International Union of Crystallography from Kalinowski et al. [63].
Crystals 11 01345 g005
Figure 6. Two possibilities of performing time-resolved X-ray experiment: (a) with a pulsed X-ray source and a conventional detector, and (b) with a continuous X-ray source and a fast-gated detector. Figure reproduced with permission of the International Union of Crystallography from Casaretto et al. [85].
Crystals 11 01345 g006
Figure 7. Schematic representation of an in-house photocrystallography setup including a classical CCD detector and an X-ray chopper [88].
Crystals 11 01345 g007
Figure 8. Photodifference map of the Rh2(µ-PNP)2(PNP)22+ cation (red surfaces—positive values, blue—negative). Figure reproduced with permission of the International Union of Crystallography from Makal et al. [24].
Crystals 11 01345 g008
Figure 9. Photodifference map for the tetranuclear silver(I)-copper(I) complex (blue surfaces—positive values, red—negative; ligand fragments are omitted for clarity). Figure reproduced with permission from Jarzembska et al. [21]. Copyright (2014) American Chemical Society.
Crystals 11 01345 g009
Figure 10. (a) Structures of the ground (left) and metastable (right) states of sodium nitroprusside. (b) Normalized intensity of the 240 reflection as a function of time, together with the histogram of the normalized intensity distribution obtained for this reflection. Figure reproduced with permission of the International Union of Crystallography from Casaretto et al. [85].
Crystals 11 01345 g010aCrystals 11 01345 g010b
Figure 11. Principle of the TR serial femtosecond crystallography and the “diffraction-before-destruction” method. Figure reproduced with permission from Schmidt et al. [107]. Copyright (2013) Hindawi Publishing Corporation.
Crystals 11 01345 g011
Figure 12. Observation of thioimidate intermediate formation and enhancement of ICH helix mobility: (a) omit mFoDFc electron-density-difference map, and (b,c,d) anisotropic atomic displacement parameters (ADPs) from TLS models refined against the XFEL datasets are shown at the 75% probability level and colored according to Beq value (blue—less motion, red—more motion). Figure reproduced with permission from Dasgupta et al. [112]. Copyright (2019) National Academy of Sciences.
Crystals 11 01345 g012
Figure 13. (a) The on and off states of the rsEGFP2 protein chromophores. (b) The 10-ns intermediate structure; the photodifference map shows the chromophore ligand time-evolution (note the negative peaks indicate the trans1 configuration depletion, whereas the positive green contours indicate the formation of new intermediate trans2 form and the final cis form). Figure reproduced with permission from Woodhouse et al. [124]. Copyright (2020) Springer Nature.
Crystals 11 01345 g013
Figure 14. Model for the rsEGFP2 off-to-on photoswitching process. Figure reproduced with permission from Woodhouse et al. [124]. Copyright (2020) Springer Nature.
Crystals 11 01345 g014
Figure 15. The photocycle of PYP in crystals. (a) The photocycle is initiated by blue light that excites the ground (dark) state pG to the electronic excited state pG *; IT, pR1, pR2, pB1 and pB2, denote various intermediate states. (b) The chemical structure of the trans configuration of the pCA chromophore bound to the Cys 69 sulfur. Figure reproduced with permission from Pandey et al. [139]. Copyright (2020) Springer Nature; access provided by the U.S. DOE PAGES public repository under the entry No. 1605212.
Crystals 11 01345 g015
Figure 16. Difference electron density maps and structures of the chromophore-binding region of PYP. (a) A 10 ps time delay (yellow—reference structure, cyan—10 ps structure, difference electron-density map features: red α—negative, blue β—positive). (b) For comparison: structures of some known intermediates, i.e., the pR1 (magenta—difference electron-density map β1 features) and pR2 (red–β2 features) species, respectively. Figure reproduced with permission from Pandey et al. [139]. Copyright (2020) Springer Nature; access provided by the U.S. DOE PAGES public repository under the entry No. 1605212.
Crystals 11 01345 g016
Figure 17. Reversible switching of the model diaryethylene system studied with UED technique by Jean-Ruel et al. [146].
Crystals 11 01345 g017
Figure 18. Schematic illustration of optical setup used in the ultrafast TR electron diffraction used at SLAC. The setup is powered with the Ti:sapphire regenerative amplifier, which beam is split to produce both UV pulses by third harmonic generation (later used to generate fs electron bunches), as well as laser-light pump beam and auxiliary optical lines for THz generation. Figure reproduced with permission from Ofori-Okai et al. [149]. Copyright (2018) IOP.
Crystals 11 01345 g018
Figure 19. Left panels: (top; a) comparison between simulated (light blue) and experimental (red) PDFs. Distances from α and β peaks are marked as yellow and purple lines. (bottom; c) Simulated differential PDFs for three isomers occurring along the course of the reaction path. Right panel (b): comparison between experimental (dotted lines) and simulated (solid lines) delay in rise time between α, β and γ peaks. Figures reproduced with permission from Wolf et al. [156]. Copyright (2019) Springer Nature; access provided by the arXiv public repository under the entry No. 1810.02900v1.
Crystals 11 01345 g019
Figure 20. Composition of a XAS spectrum collected for a single edge. The near-edge region arising from inner electron ionization and the pre-peak region created by contributions from the forbidden transitions both constitute the XANES section, while the photoelectron interference-related region constitute the EXAFS region. Figure reproduced with permission from Kowalska and DeBeer [159]. Copyright (2015) Elsevier.
Crystals 11 01345 g020
Figure 21. XAS spectra collected for the homogenous Ag foil and AgNO3 and inhomogeneous Ag2O powder samples (a) on the low-scale laboratory experimental setup with ICC as the X-ray source, and (b) on a JSRRI synchrotron beamline. Figure reproduced with permission from Huang et al. [162]. Copyright (2020) Springer Nature.
Crystals 11 01345 g021
Figure 22. (a) X-ray absorption spectra for the ground state of the FeII complex (black line), and 150 ps after photoexcitation (λ = 400 nm) (blue line), (b) transient XAS spectrum and (c) close-up of the pre-edge region. Figure reproduced with permission from Zhang et al. [163]. Copyright (2019) American Chemical Society.
Crystals 11 01345 g022
Table 1. Short characteristics of synchrotron beamlines facilitating TR Laue photocrystallography experiments. Note the most up-to-date parameters may somewhat differ because of continuous development of these beamlines and storage ring upgrades.
Beamline NameBioCARS 14-IDID09NW14A
Synchrotron sourceAPS, Chicago, USAESRF, Grenoble, FrancePR-AR, Tsukuba, Japan
Storage ring energy7.0 GeV6.0 GeV6.5 GeV
Source typeTwo undulators with 23 and 27 mm periodsTwo undulators with 46 and 17 mm periodsTwo undulators with 20 and 36 mm periods
MirrorsPair of Kirkpatrick–Beatz mirrorsToroidal mirrorCylindrical mirror
MonochromatorCryogenically cooled Si (111)
Energy range6.8–19 keV8.5−28.0 keV5−20 keV
Photons per pulse1.1−4.2 × 10101.1 × 10101 × 109
Focal spot size90 µm (h) × 20 µm (v)100 µm (h) × 60 µm (v)60 µm (h) × 60 µm (v)
X-ray pulse width ~100 ps
Detectors aRayonix MX340-HS, b MarCCC 165 cRayonix MX170-HSMarCCC 165, d Rigaku IP c
a Note other detectors are also frequently available. b Website: https://biocars.uchicago.edu/ (accessed: 28 August 2021). c Graber et al. [54]. d Nozawa et al. [57].
Publisher’s Note: MDPI stays neutral with regard to jurisdictional claims in published maps and institutional affiliations.

