1. Introduction
With coal mining entering the deep stage, the high ground stress, mining disturbance, and the poor stability of surroundings create great challenges for roadway support structures [
1,
2,
3]. The ordinary concrete used in supporting structures exhibit brittleness [
4]. Further, long-term exposure to high stresses may cause the lining spray layer to suffer due to sudden damages [
5]. Moreover, in order to introduce a certain number of flexible components into the original multi-component concrete to reduce its brittleness, the addition of rubber particles into concrete was proposed [
6,
7,
8]. Presently, rubber concrete is not widely used as a support material in roadway support structures. However, rubber concretes with lower density, higher energy dissipation, and toughness could be used to support high-ground stress soft rock roadways, as they could meet the demands of relieving the pressure of the surrounding rock [
9,
10,
11].
The development of rubber concrete could transform waste rubber from “black pollution”, as it cannot be naturally degraded into green resources, which would have great environmental and economic significance [
12,
13,
14]. Moreover, multiple studies revealed that rubber concrete is superior to ordinary concrete in many aspects [
15,
16,
17,
18]. Reda Taha et al. [
17] found that rubber aggregates hinder the formation and growth of micro-cracks in the concrete and delay the appearance of macro-cracks. Issa et al. [
18] indicated that rubber concrete has a better energy absorption capacity than normal concrete because of the absorbing vibrations of the rubber particles. However, previous studies have shown that the addition of rubber particles reduces the strength of concrete due to their low elastic modulus, which restricts the application of rubber concrete [
19,
20,
21].
With the development of concrete technology, fiber has been widely used in concrete structures for property and durability enhancement [
22,
23,
24]. Cajka et al. [
24] proved the positive influence of fiber concrete slabs on the increased load capacity and more favorable deformations compared to conventional concrete slabs. Further, some researchers have proposed that hybrid fiber-reinforced material offers better mechanical characteristics individual fibers [
25,
26,
27]. Zhang et al. [
26] conducted mix experiments that included steel fiber, polyvinyl alcohol fiber, and basalt fiber. The results showed that hybrid fibers can exert the best strengthening and toughening effect on concrete, achieving the best synergy with the correct fiber content. Alwesabi et al. [
27] indicated the addition of hybrid fibers with enhanced ductile and post-cracking behavior compared to the addition of mono steel fibers. It has been found various types or sizes of fibers can play a different role at different scales and can be mixed into concrete to improve its performance as hybrid fiber concrete.
To mitigate the negative effects of adding rubber particles on the mechanical properties of concrete, many scholars have examined fibers with a high elastic modulus in rubber concrete [
28,
29,
30,
31]. Youssf et al. [
29] indicated that the use of fiber-reinforced polymer (FRP) to confine rubberized concrete effectively negates the decrease in strength and retains the advantages of increased ductility that arise from the rubberized concrete. Karimipour et al. [
30] found that the addition of rubber aggregate reduced the compressive strength, while the incorporation of steel fiber could overcome the decrease to some extent. Wang et al. [
31] reported that the fracture energy and post-failure performance were largely increased by polyvinyl alcohol fiber reinforcement. They mainly focused on the mechanical properties of single-fiber reinforced rubber concrete. However, few researchers have added hybrid fibers to the system in order to form a new composite material and to analyze it from the macroscopic, mesoscale, and microscale perspectives.
In this study, an eco-friendly concrete called hybrid fiber-reinforced rubber concrete (HFRRC) was developed. Basalt fibers (BF) and polyvinyl alcohol fibers (PF) with a high elastic modulus were used as supplementary materials to improve the mechanical properties of the rubber concrete. Further, the optimal proportion of the rubber, BF, and PF were obtained through orthogonal array experiments. Moreover, the mechanical properties, pore structure, and the microstructure of the hybrid fiber-reinforced rubber concrete were thoroughly investigated, and it was determined that the developed material made the comprehensive and recycling utilization of waste possible, providing “green” materials to improve the support structures in deeply buried high-stress soft rock roadways.
2. Materials and Methods
The materials that were used, the design of the experiments, and the methods used for the preparation of the specimens and testing are briefly described below.
2.1. Materials
The cement used in this study was Chinese standard Portland cement. The chemical composition of the cement is presented in
Table 1. The coarse aggregate consisted of crushed limestone with continuous grading, a particle size of 5–15 mm, and an apparent density of 2780 kg/m
3. The fine aggregate was river sand with a fineness modulus of 2.6. Further, a high-performance water reducer (HPWR) obtained from the Shaanxi Qinfen Building Materials Co., Ltd., Xi’an, China, was employed to ensure fluidity and water retention. The performance indexes are shown in
Table 2. The rubber particles were produced and obtained by cutting waste tires, and the main elements of the rubber are shown in
Table 3. Three kinds of rubber particles with the sizes of 0.85 mm, 1–3 mm, and 3–6 mm were used to prepare the concrete. The technical indexes of the rubber particles are presented in
Table 4, and the appearance of the rubber particles is shown in
Figure 1. The physical properties of BF and PF are listed in
Table 5, and their appearances are shown in
Figure 2.
2.2. Design of Experiments Using Orthogonal Array
The optimal proportion of the hybrid fibers reinforced rubber concrete (HFRRC) was determined using the orthogonal test method [
32]. In this method, four factors were designed, including the rubber particle size (factor A), rubber particle content (factor B), basalt fiber content (factor C), and the polyvinyl alcohol fiber content (factor D). Further, three levels were designed for each factor, including the rubber particle sizes of 0.85 mm, 1–3 mm, and 3–6 mm; the rubber particle content of 10%, 20%, and 30%; basalt fiber content of 0.1%, 0.2%, and 0.3%; and polyvinyl alcohol fiber content of 0.1%, 0.2%, and 0.3%.
Tests were performed according to the L
9 (3
4) Orthogonal array and consisted of four factors and three levels. The factors and the levels of the orthogonal experiment are shown in
Table 6. The mixed proportions of each group of concrete are presented in
Table 7.
2.3. Preparation of Specimens
The materials were weighed using an electronic scale and were mixed in a double-horizontal shaft forced-type concrete mixer. Initially, the pre-weighed aggregate, rubber particles, BF, and PF were mixed for 3 min. Then, the binder material was added and was mixed for 1 min. Subsequently, the previously measured water and the water reducer were poured into the mixed dry materials and were stirred for 3 min in order to ensure that the mixture had a uniform plastic consistency. Next, a mold was filled with three layers, and they layers were consolidated using a vibratory table. Moreover, the top surface was smoothened using a trowel. The specimens were prepared under laboratory conditions of a (20 ± 2) °C temperature and 70% relative humidity. After the hardening, the specimens were released from the molds and were cured in a saturated Ca(OH)2 solution at 20 ± 2 °C for 28 days.
2.4. Test Methods
The specimens were tested for their strength and porosity, and the microstructure images were observed. They are briefly described below.
2.4.1. Strength Test
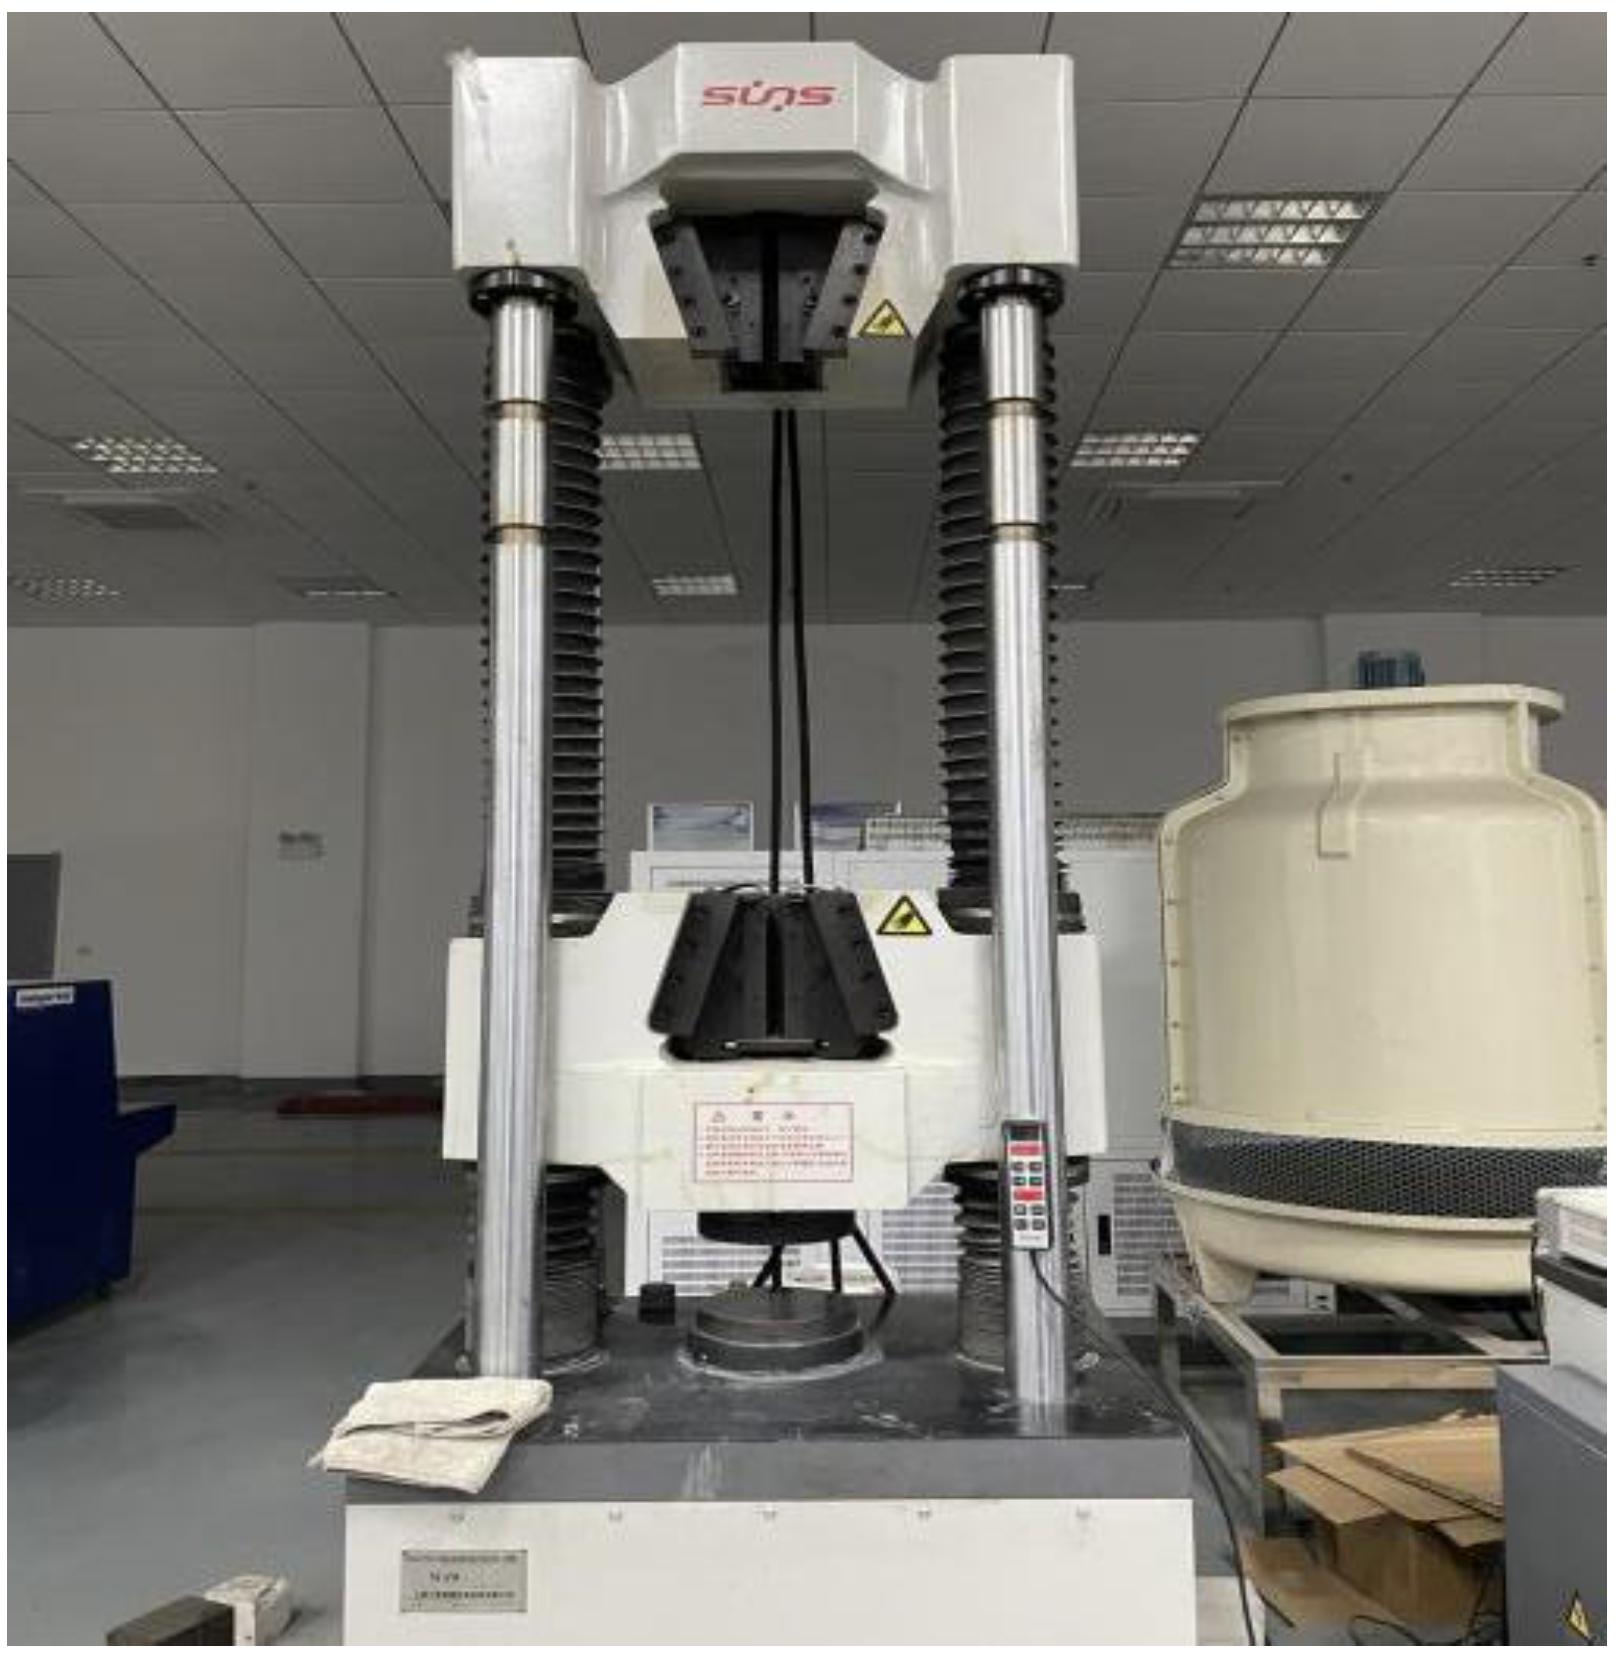
The compressive strength, splitting tensile test, and the flexural strength tests were conducted in accordance with the “Standard for Test Method of Mechanical Properties on Ordinary Concrete” (GB/T 50081-2016, Chinese standard) [
33] using a WDW-1000 computer-controlled electronic universal testing machine (see
Figure 3). The measuring system details are shown in
Figure 4. The 100 × 100 × 100 mm cubic specimens were prepared to measure the compressive and splitting tensile strengths, and specimens with sizes of the dimensions 100 × 100 × 400 mm were fabricated to measure the flexural strengths (see
Table 8). As per the standards, the rate of loading should be controlled for 3 mm/min in the compressive strength and splitting tensile strength tests and for 1 mm/min in the flexural strength test.
2.4.2. Porosity Test
The porosity of the hardened concrete was tested using the ASTM C457 standard (Standard, ASTM C457, 2016) [
34] with a TR-ASH-hardened concrete pore structure analyzer. During the sample preparation, a cube with of the dimensions of 100 mm × 100 mm × 100 mm was cut parallel to the concrete surface using a diamond saw, and a 20 ± 3 mm thick slice was taken. Further, rough grinding, finish grinding, and polishing were performed on the cut surface using various diamond grinding discs with different types of roughness. Thereafter, the cut surface was blackened with black ink. After the drying of the ink, the pores on the cut surface were filled with barium sulfate powder. Then, the air content, average chord length, specific surface, spacing factor, and the pore size distribution of the concrete were tested. The details of the porosity test process are illustrated in
Figure 5.
2.4.3. Scanning Electron Microscope Test
The microstructure of the specimen was observed using an scanning electron microscope (Zeiss Sigma 300). The samples were taken from the test cubes used in the axial compression test, which had a diameter of 5 mm and a thickness of 2 mm. To observe the microscopic morphology of the rubber particles and the hybrid fibers in the concrete, the sample was taken without any coarse aggregate.
3. Results and Discussion
The results of the mechanical properties such as the strength, energy dissipation capacity, and ductility, visual analysis, range analysis, and the mesostructural and microstructural analysis are discussed below.
3.1. Mechanical Properties
The indexes of each group concrete are shown in
Table 9.
3.1.1. Strength
The compressive strength, splitting tensile strength, and flexural strength of the concrete are presented in
Figure 6. The load–displacement curves are shown in
Figure 7. From
Figure 6, it can be observed that the compressive strength is reduced, which is as expected after introducing the rubber particles, BF, and PF. The compressive strength of group 0 (OC) was found to be 38.56 MPa. For all of groups containing concrete with rubber particles and hybrid fibers, the compressive strength was found to be lower than that of the OC. This could be attributed to the fact that the interfacial transition zone between the rubber and the cement matrix was weaker [
35].
From the results, it can be observed that the compressive strength of the concrete decreases sharply as the rubber content increases, while there was a slight improvement in terms of the increase of the hybrid fiber content. By comparing the splitting tensile strength and the flexural strength of OC, which were 3.73 MPa and 5.60 MPa, respectively, it can be observed that the values of HFRRC-4, which are 4.51 MPa and 6.28 MPa, respectively, increased by 20.91% and 12.14%, respectively. This increase implies that the contribution of the hybrid fibers to the splitting tensile strength and the flexural strength is very significant. However, HFRRC-7, which has a total fiber load that is higher than HFRRC-4, exhibits lower flexural strength than HFRRC-4. This indicates that the mechanical properties of rubber concrete produced with coarse rubber particles displays a further decrease compared to rubber concrete produced with fine rubber particles and that the content of hybrid fibers has the optimal value. It is difficult to disperse hybrid fibers evenly, especially when they are present in the concrete at higher dosages; however, it is difficult for them to play effect roles in terms of improving the strength of the concrete when they are introduced to the concrete at a lower concentration, which also explains why the mechanical properties of HFRRC-1 with finer rubber particles is inferior to that of OC.
3.1.2. Energy Dissipation Capacity
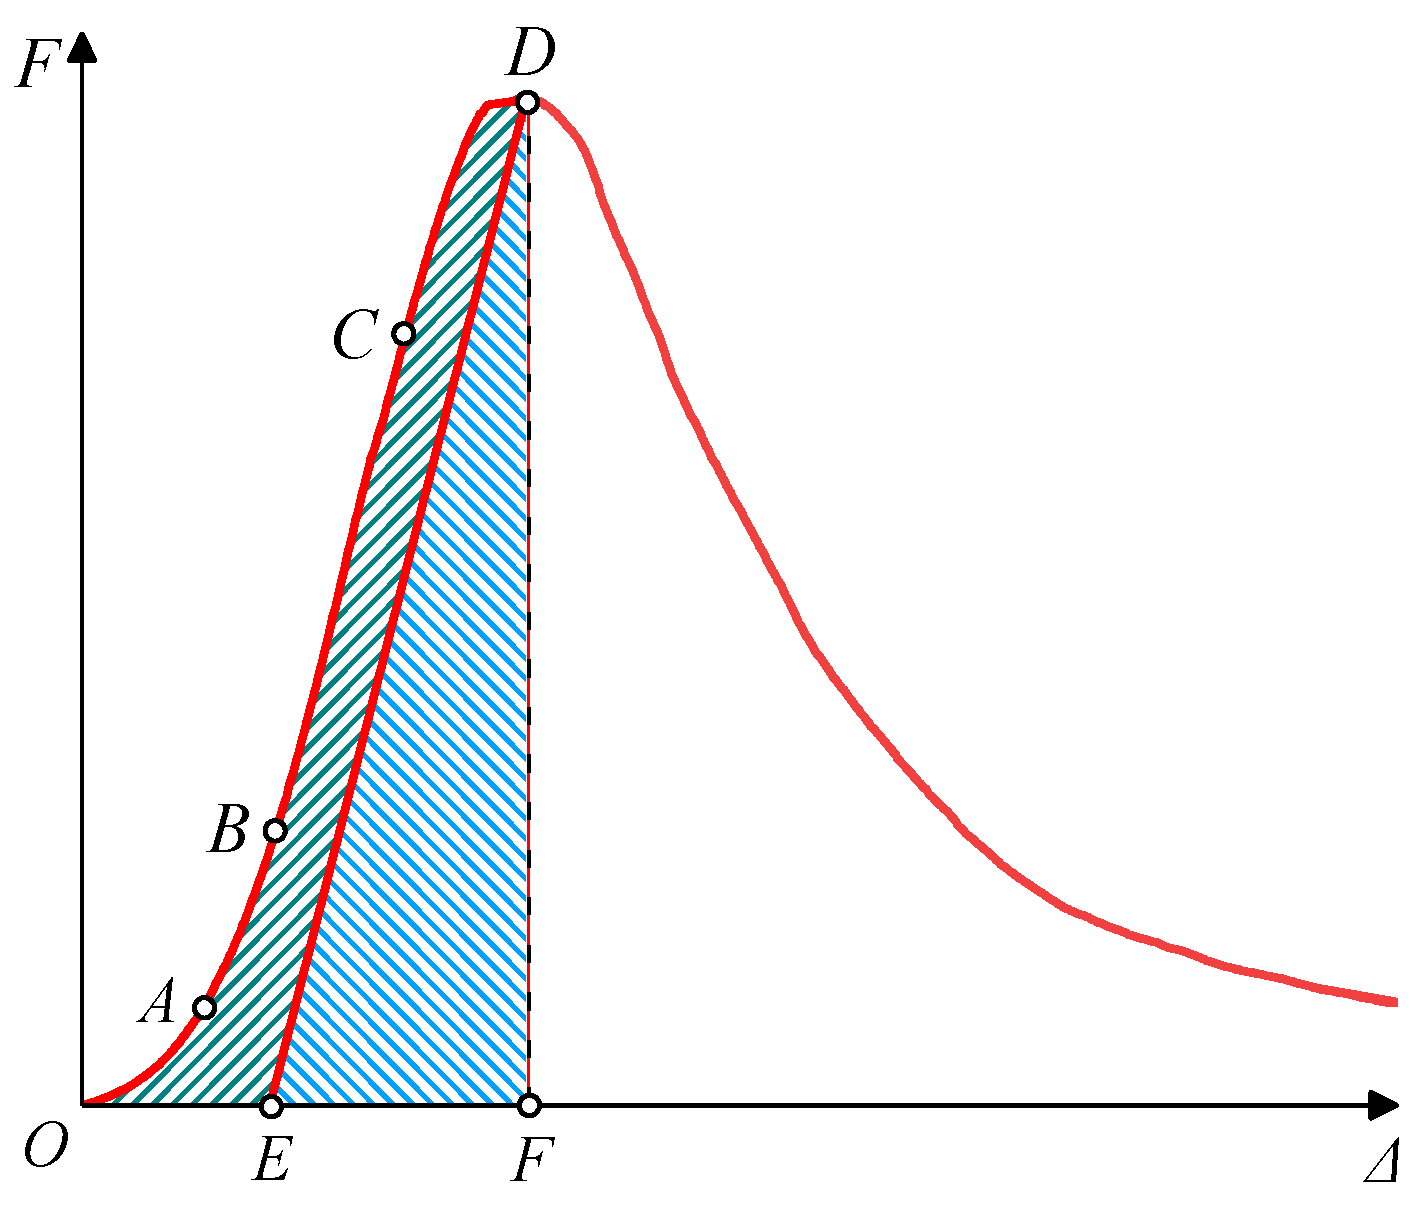
When a load is applied to the concrete, the compression process is a combination of of energy absorption, dissipation, and release processes [
36]. As shown in
Figure 8,
DE is parallel to
BC, the area enclosed by
ODE represents the dissipated energy
Wd, and the area enclosed by
DEF represents the elastic potential energy
We.
The energy conversion of the concrete during uniaxial compression can be expressed by Equation (1):
In Equation (1), W refers to the work completed by the external force on the concrete, which is the energy input from the outside, J; Wd refers to the elastic deformation energy stored in the concrete during deformation, J; and We refers to the energy dissipated by the concrete during loading, which is what is the primarily cause of the internal damage and the plastic deformation of the concrete, J.
According to the second law of thermodynamics, energy dissipation is irreversible and unidirectional, while the stored elastic potential energy is bidirectional and reversible. Therefore, the energy dissipation coefficient
Ee can be represented by the percentage of dissipated energy in the total input energy, which can be expressed as shown in Equation (2):
From
Table 9, it can be observed that the
Ee of HFRRC is higher than that of OC. The group HFRRC-3 was found to have the largest energy dissipation coefficient, which was 131.61% higher than OC. Moreover, the rubber content of HFRRC-4 and HFRRC-7 were the same, and it can also be observed that the
Ee of HFRRC-4, which has less hybrid fiber content, was 33.62% higher than that of HFRRC-7. This implies that when the rubber particles are smaller, the promotion effect on the energy dissipation capacity of the concrete is greater.
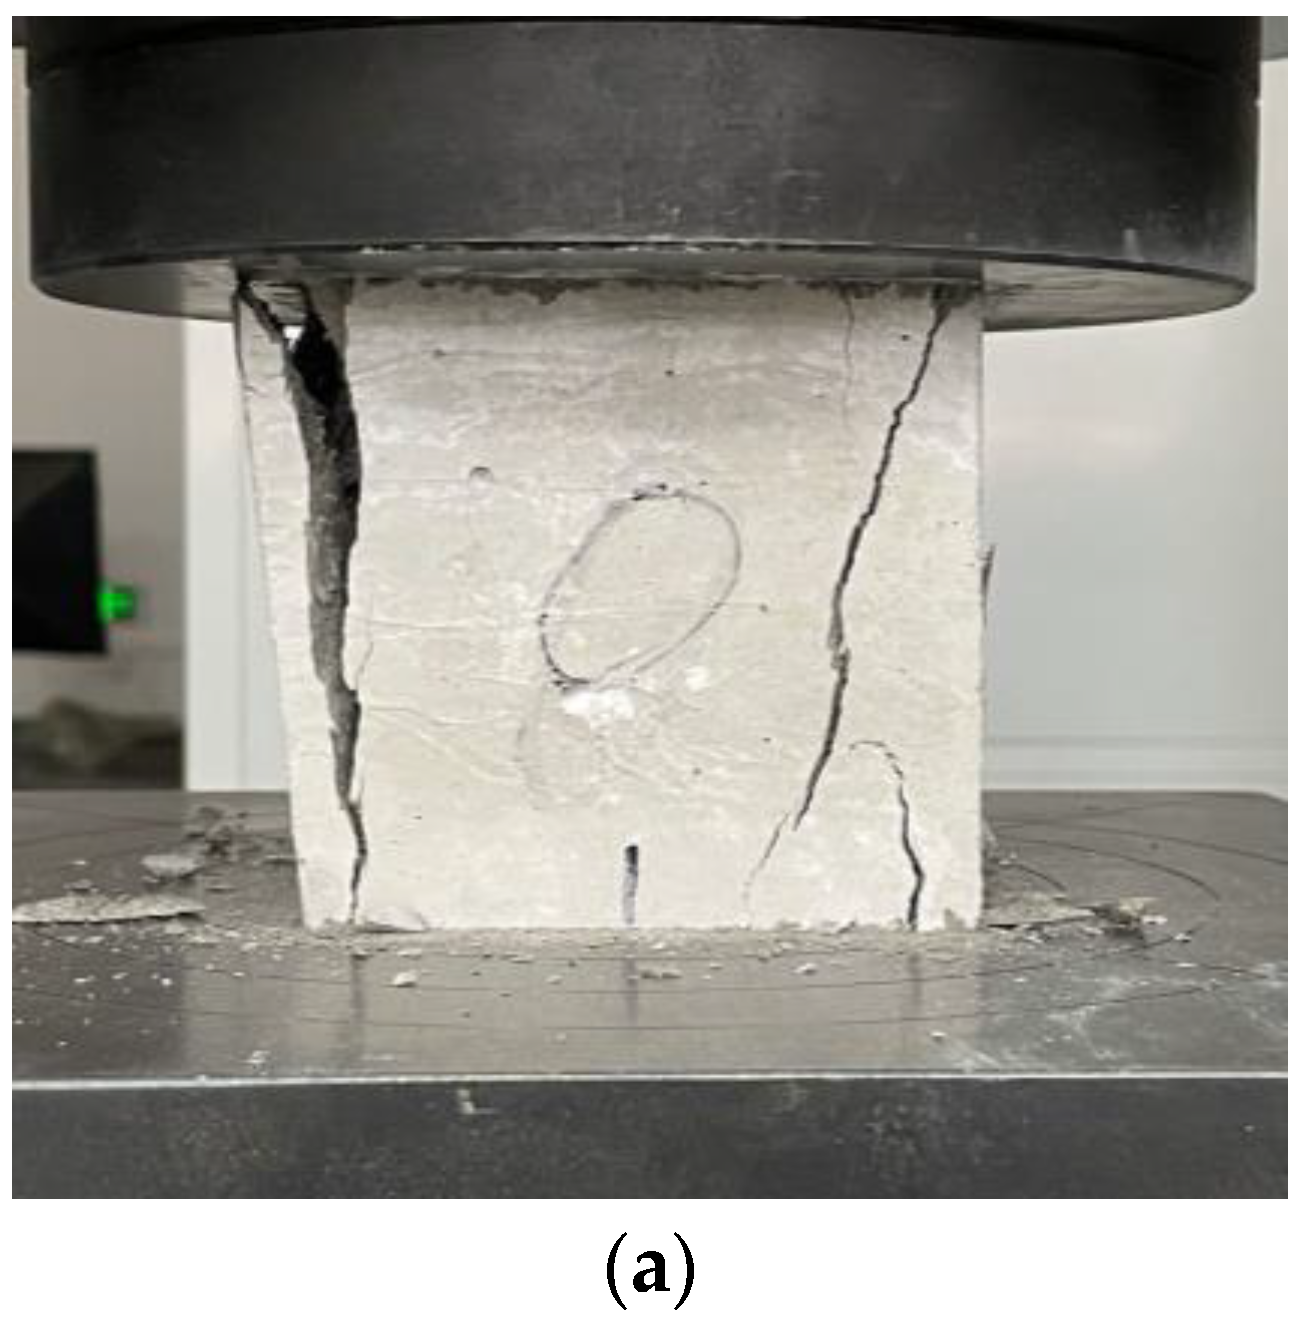
Generally, the rubber particles are equivalent to small elastomers, which can consume some energy through their deformation when the HFRRC is subjected to load [
6]. The failure pattern diagrams are shown in
Figure 9. It can be seen that the addition of the hybrid fibers creates cracks that are smaller and denser and that are accompanied by a large amount of energy consumption [
12,
37]. Compared to OC, it can be observed that there was less elastic potential energy left, reducing the probability of sudden failures.
3.1.3. Ductility
Ductility performance is expressed by the ductility coefficient
μ [
36], which is expressed as shown in Equation (3):
Δ
u and Δ
y are shown in
Figure 10. Δ
u represents the ultimate displacement, which is the displacement corresponding to 0.85 times the maximum load after peak stress, and Δ
y represents the yield displacement, which is the displacement corresponding to 0.8 times the maximum load before peak stress.
From
Table 9, it can be observed that the variation trend of the ductility coefficient is similar to that of the energy dissipation coefficient, which increases with the increasing rubber content and the hybrid fiber content. Further, it can also be observed that the
μ of HFRRC-3 reaches the maximum value possible and is increased by 46.70% compared to OC. Furthermore, the failure pattern of HFRRC was relatively ductile, and its cracks were relatively tortuous and fine. This shows that the rubber particles and the hybrid fibers have a positive effect in terms of reducing the brittleness of the concrete.
3.1.4. Range Analysis
Range analysis intuitively shows the order of influence of each factor on the evaluation index. The range analysis results are presented in
Table 10.
From
Table 10, it can be observed that when the compressive strength is taken as the index, the influence degree of each factor was as follows: B > A > C > D, in which the influence of the rubber content is the largest, and the influence of PF content is the smallest.
Further, it was found that when the splitting tensile strength is used as the index, the influence of each factor from strong to weak was B > C > D > A, in which the influence of the rubber content is the largest, the influence of the BF content is the second largest, and the influence of the PF content is the weakest. It was also found that when the flexural strength is taken as the inspection index, the influence of each factor from strong to weak was B > C > D > A, in which the influence of the BF content is the largest, followed by the PF content.
Furthermore, when the energy dissipation capacity is taken as the index, the influence of each factor from strong to weak was found to be D > C > B > A, in which the influence of the PF content is the largest, followed by the BF content, and the influence of rubber particle size is the weakest.
Finally, when the ductility performance is taken as the inspection index, the influence of each factor from strong to weak was found to be D > C > B > A, in which the PF content has the largest influence, the BF content is the second largest, and the influence of the rubber particle size is the smallest, which is similar to what was observed in the energy dissipation performance.
Further analysis showed that the content of rubber particles had a significant influence on the compressive strength and splitting tensile strength, followed by the size of the rubber particles, whereas for the ductility coefficient and the energy dissipation coefficient of the concrete, the presence of the hybrid fibers played a positive role in terms of improving the anti-cracking ability and energy dissipation capacity of the concrete.
3.1.5. Factor Index Analysis
Factor index analysis was conducted based on the test data, and the results are shown in
Figure 11.
From
Figure 11, it can be observed that the mechanical property index decreases rapidly with the increase of the rubber content, indicating that the rubber content is the main cause of strength reduction. Furthermore, the rubber particles were found to have an optimal particle size of 1–3 mm, showing superior performance in all indexes. However, large size rubber particles were found to lead to an increase in the weak bonding area of the concrete [
38]. Moreover, it was difficult for the very smaller rubber particles to be evenly dispersed in the concrete, and the clusters of rubber particles were prone to appear in the concrete [
39]. In terms of the optimal proportion of the hybrid fibers, the optimal value of PF was found to be 0.3%. Further, the 0.20% BF had the highest compressive strength and flexural strength, while the 0.3% BF was found to have the highest splitting tensile strength.
According to the compressive strength, splitting tensile strength, and flexural strength, the optimal proportions of HFRRC were determined to be A2B1C2D3, A2B1C3D3, and A2B1C2D3. According to the ductility coefficient and the energy dissipation coefficient, the optimal proportion of HFRRC was determined to be A1B3C3D3.
3.1.6. Analysis of Efficiency Coefficient Method
From this analysis, it was observed that for different evaluation indicators, the influence of each factor and the optimal proportion are also different. Moreover, it is necessary to consider the influence of each factor on different indicators while investigating the influence of each factor level. Thus, the efficiency coefficient method was used to obtain the optimal proportion, and an excellent comprehensive effect was achieved by investigating various indexes.
Initially, each indicator was defined with a efficacy coefficient according to the efficacy coefficient method. Then, the efficacy coefficient index of the group with the best result was defined as θij = 1, and the efficacy coefficient index of the group with the worst result was defined as θij = 0, where i represents the group number, and j represents the indicator number. The efficacy coefficients of the other groups were defined as the ratios of the index values to the best index values. Thereafter, the different indicators dj of the concrete were assigned to different subjective weights based on the importance of each of the indicators.
The subjective weight coefficient of the compressive strength d1 was taken as 0.3, and the subjective weight coefficient of the splitting tensile strength d2 and the flexural strength d3 was taken as 0.1. Further, the subjective weight coefficient of the energy dissipation coefficient d4 and the ductility coefficient d5 were taken as 0.2.
The total efficacy coefficient
θi of group
i was obtained as shown in Equation (4):
The total efficiency coefficient can comprehensively evaluate the performance of concrete. From the results, it can be observed that the total efficiency coefficient θ4 of composition A2B1C2D3 was the highest, and its comprehensive performance was more balanced and superior to the other mix proportions.
3.2. Mesostructure Analysis
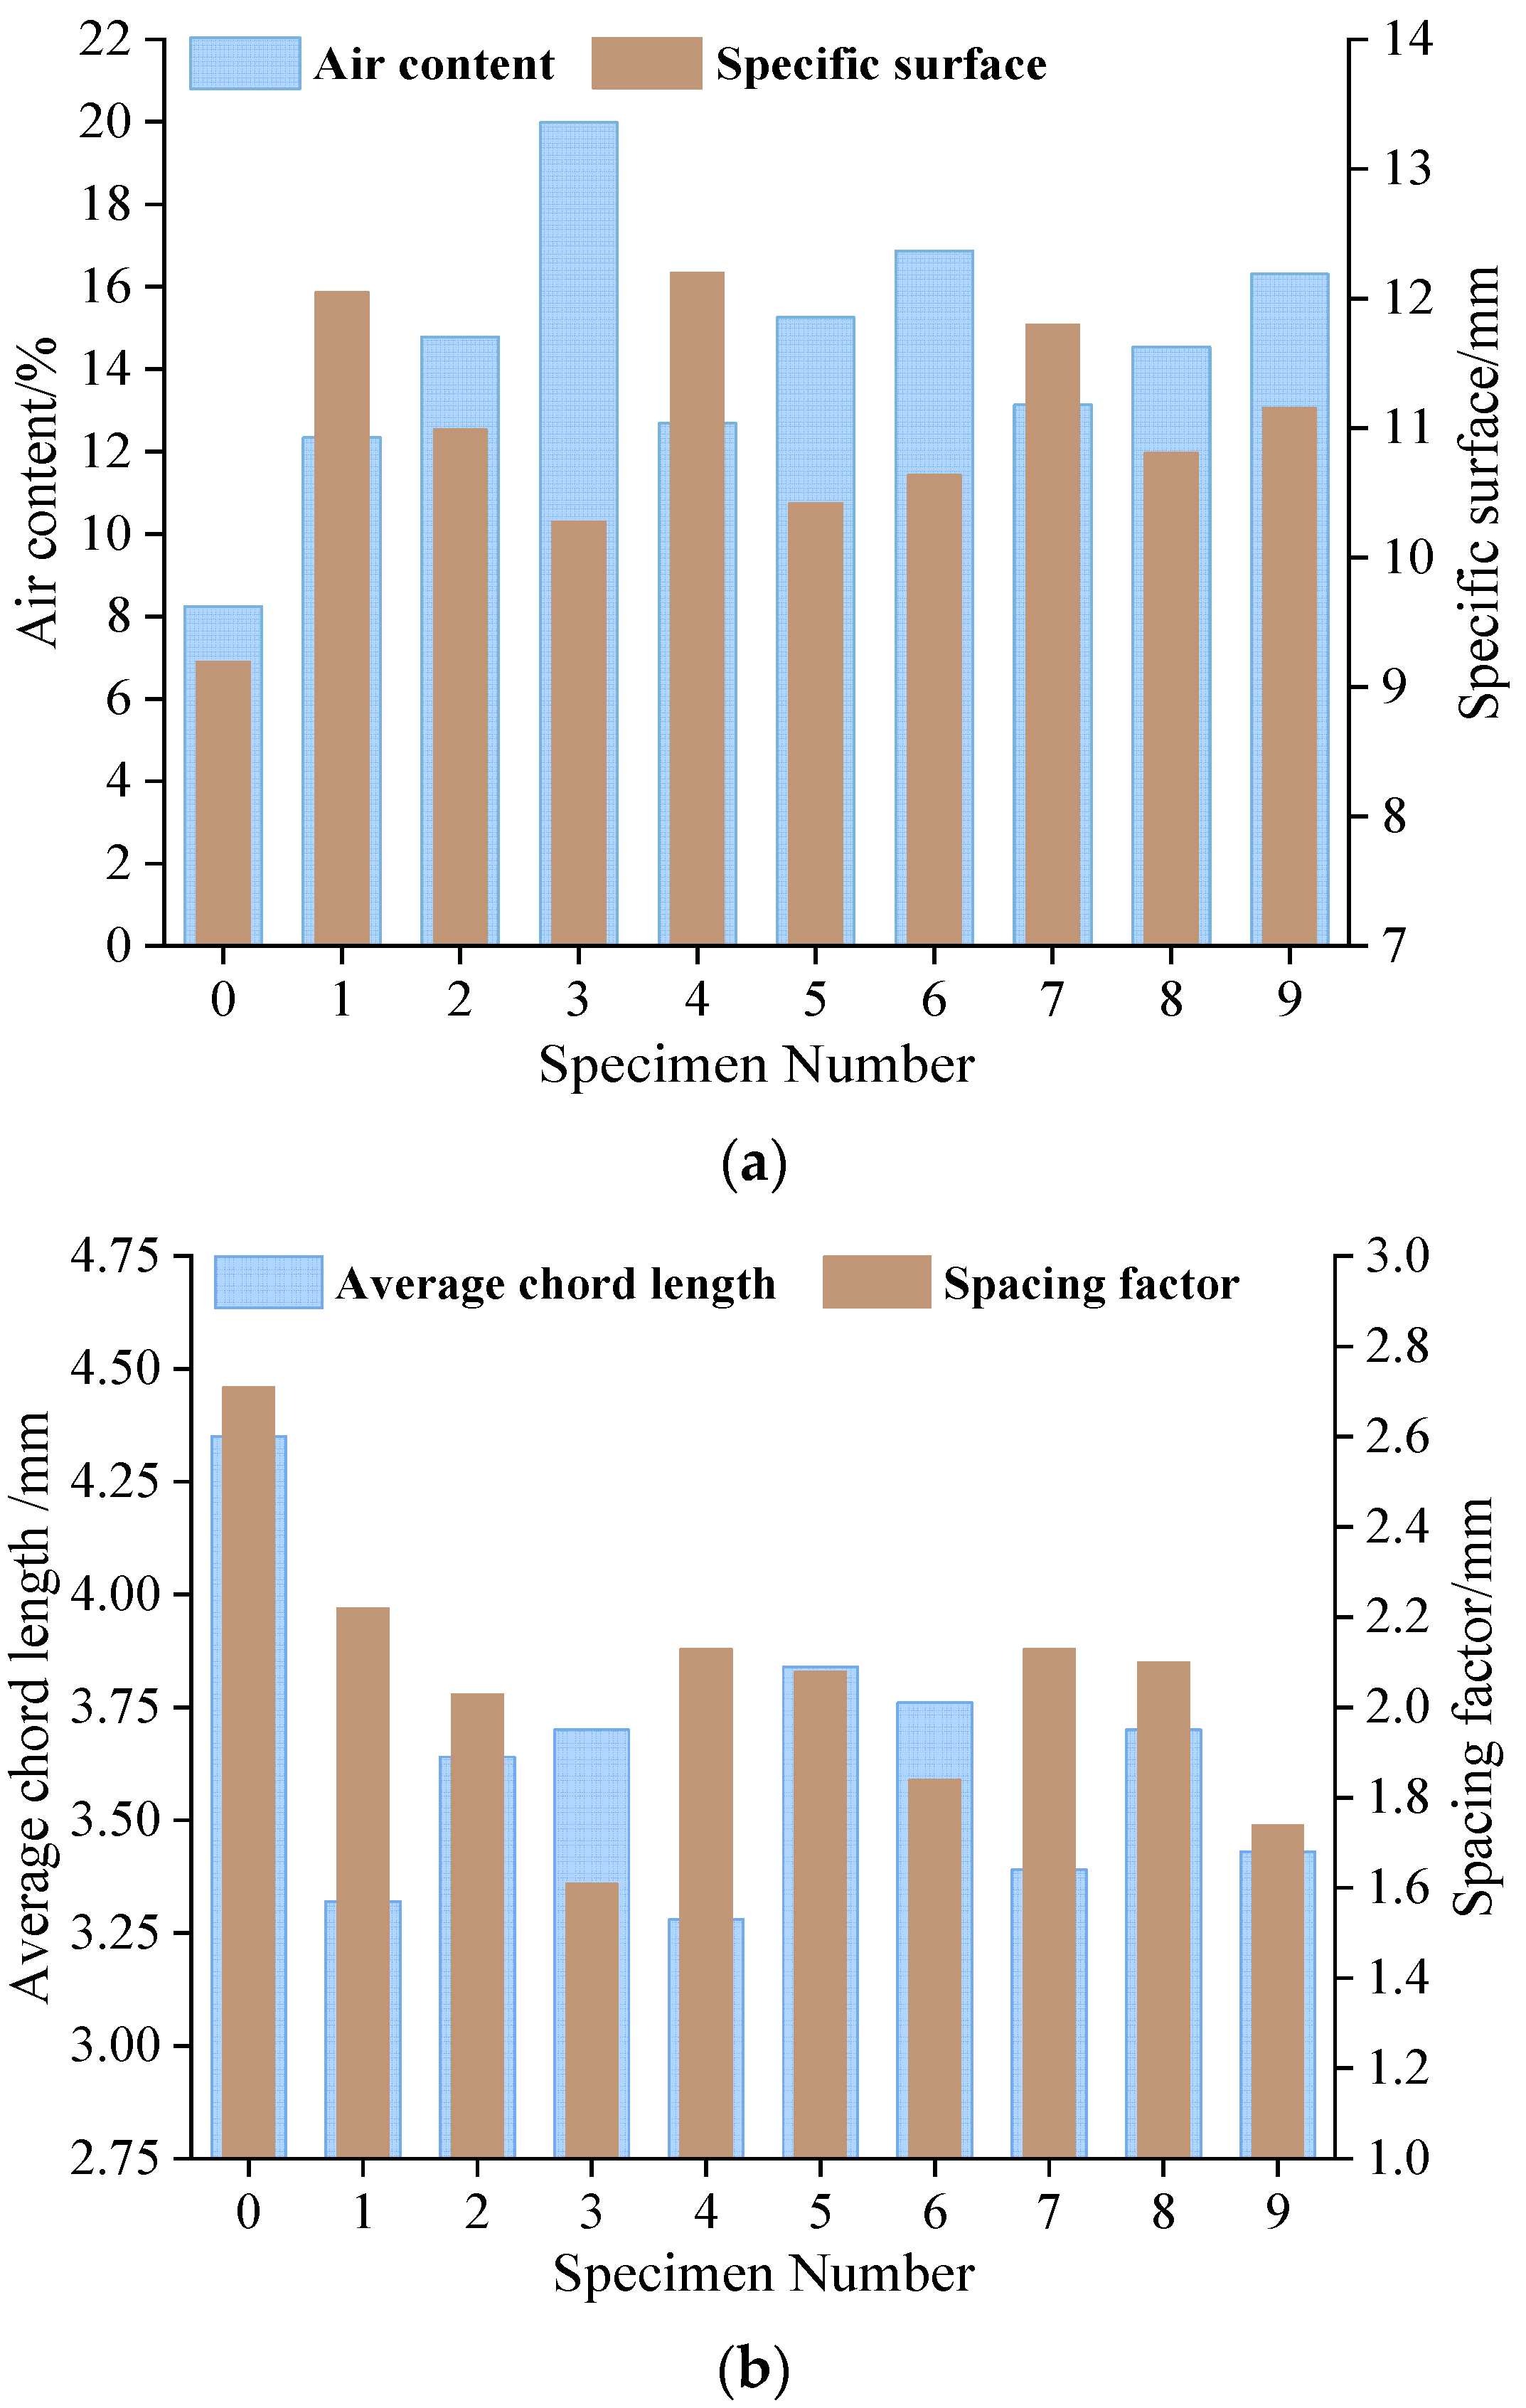
The pore structure parameters of each group of concretes are shown in
Figure 12.
From
Figure 12, it can be observed that there are significant differences in the pore structure of OC and HFRRC. The air content and the specific surface of HFRRC were found to be larger than that of OC, while the average chord length and the spacing factor were found to be less than that of OC. It was also found that when the rubber content increased, the air content increased while the spacing factor decreased. Further, as seen from HFRRC-1, HFRRC-2, and HFRRC-3, the average chord length increased while the specific surface decreased when the rubber content increased. However, HFRRC-6, which had a higher rubber, content exhibited lager than average chord length and less specific surface compared to that of HFRRC-5. The hybrid fiber content of HFRRC-6 is higher than HFRRC-5, which might explain this phenomenon, which can be seen from the data for HFRRC-8 and HFRRC-9. These pore structural characteristics suggest that the hybrid fiber alters the pore distribution of rubber concrete to some extent.
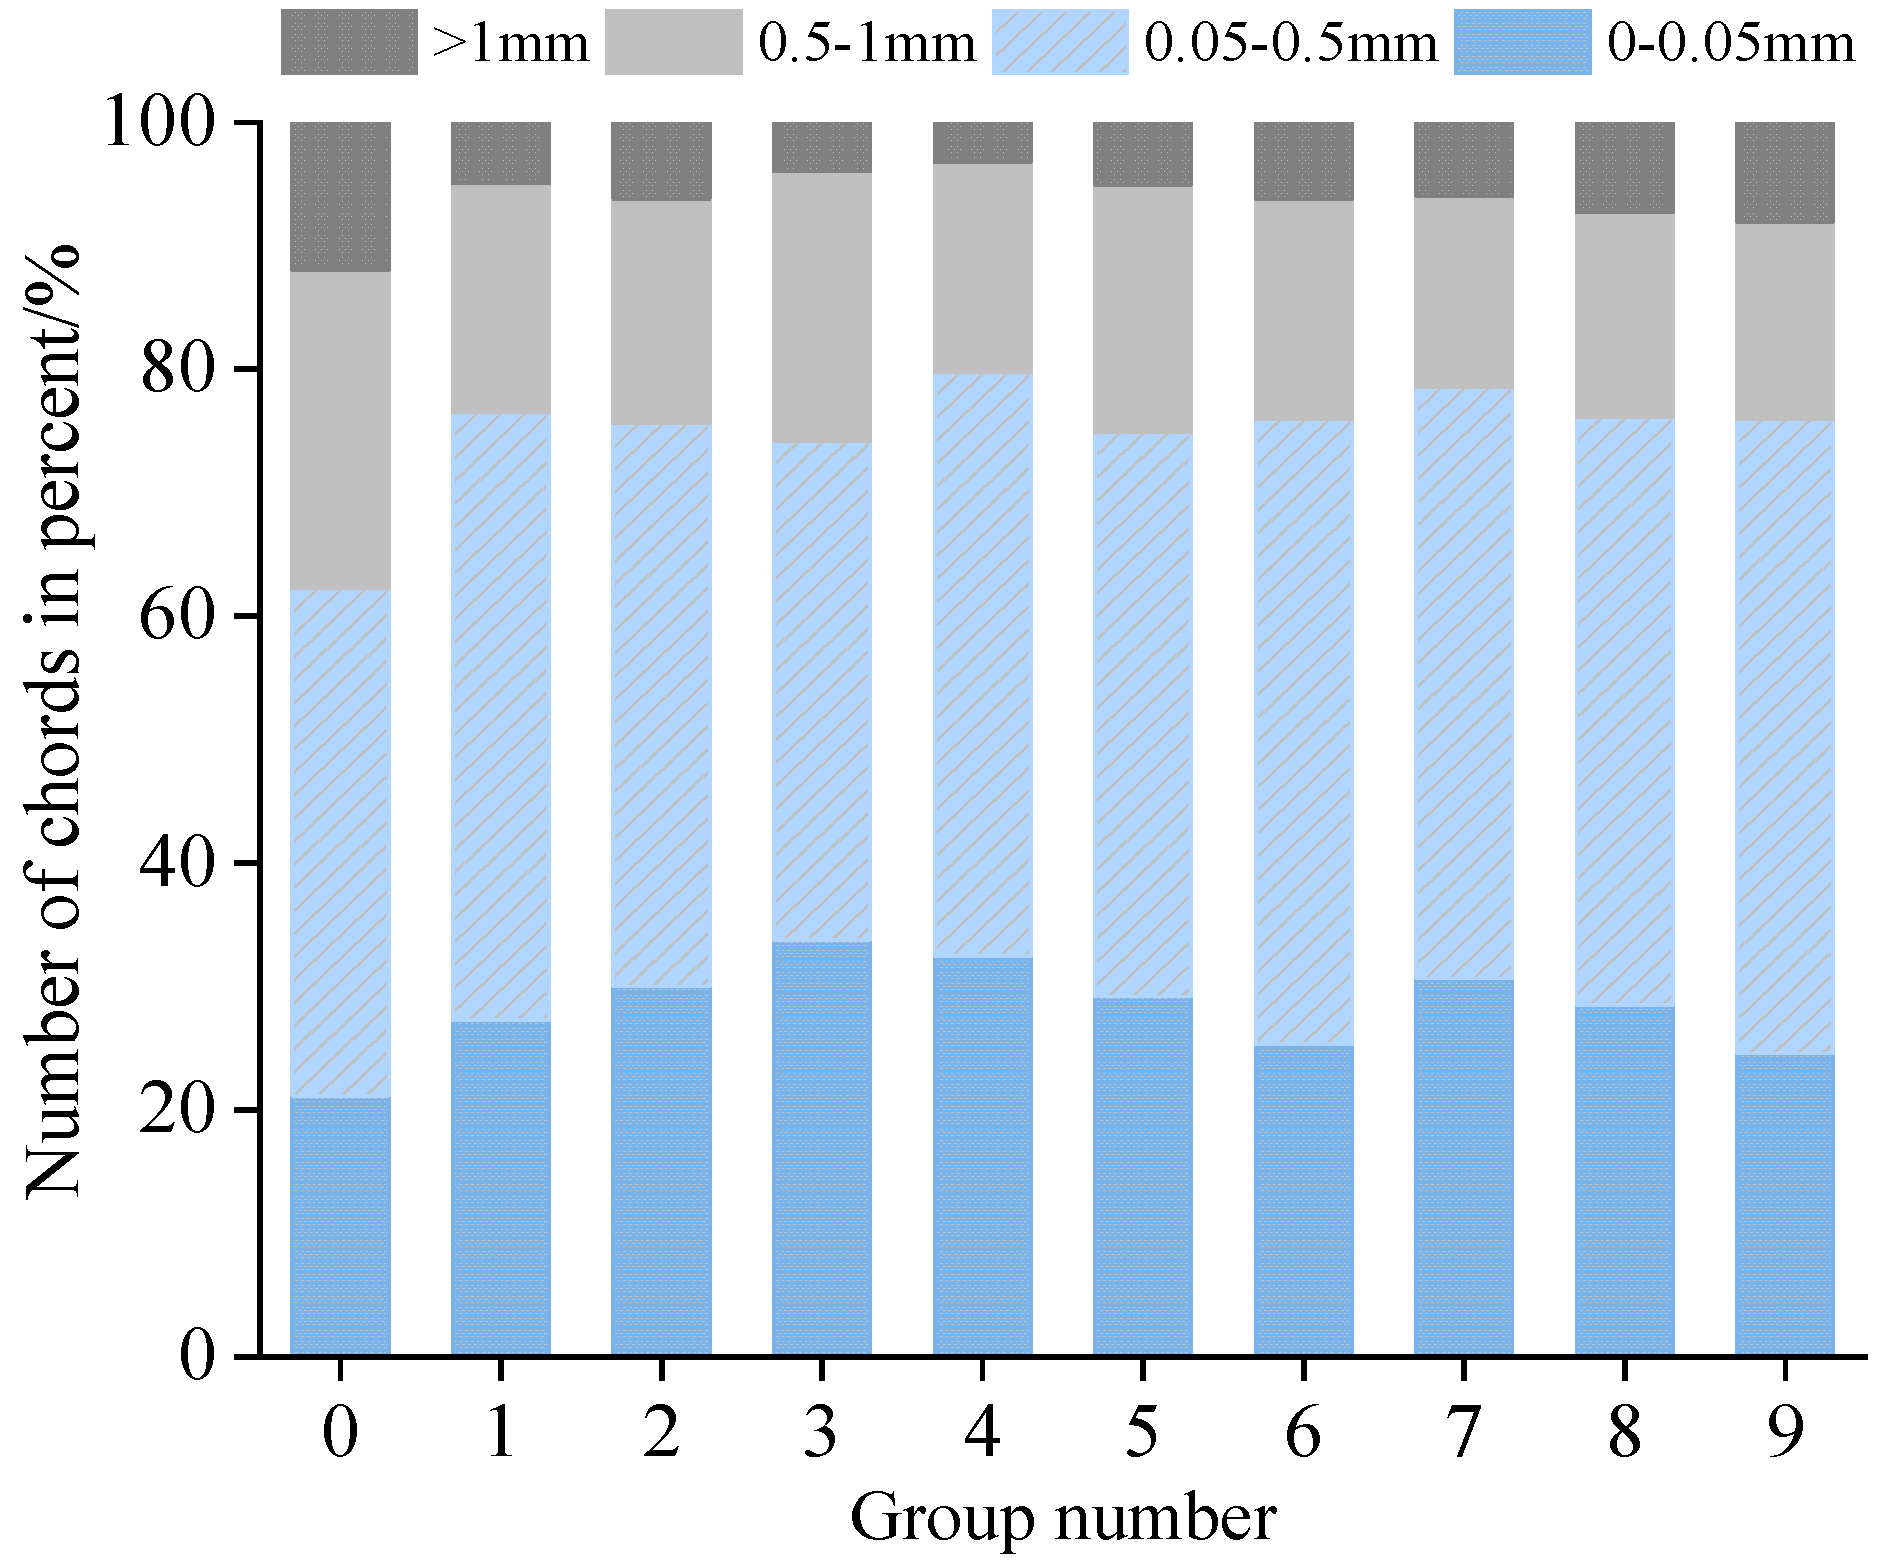
The pore size distributions of the concrete are shown in
Figure 13. The proportion of the big pores (pore diameter of >1 mm) in HFRRC was found to be lower than that of OC. When compared with OC, the proportion of the big pores in HFRRC-4 was found to decrease by 73.12%. Further, the proportion of the small pores (pore diameter < 0.05 mm) to all of the pores in HFRRC was found to be larger than that of OC, and the proportion of the small pores in HFRRC-3 was found to increase by 59.69% more than that of OC.
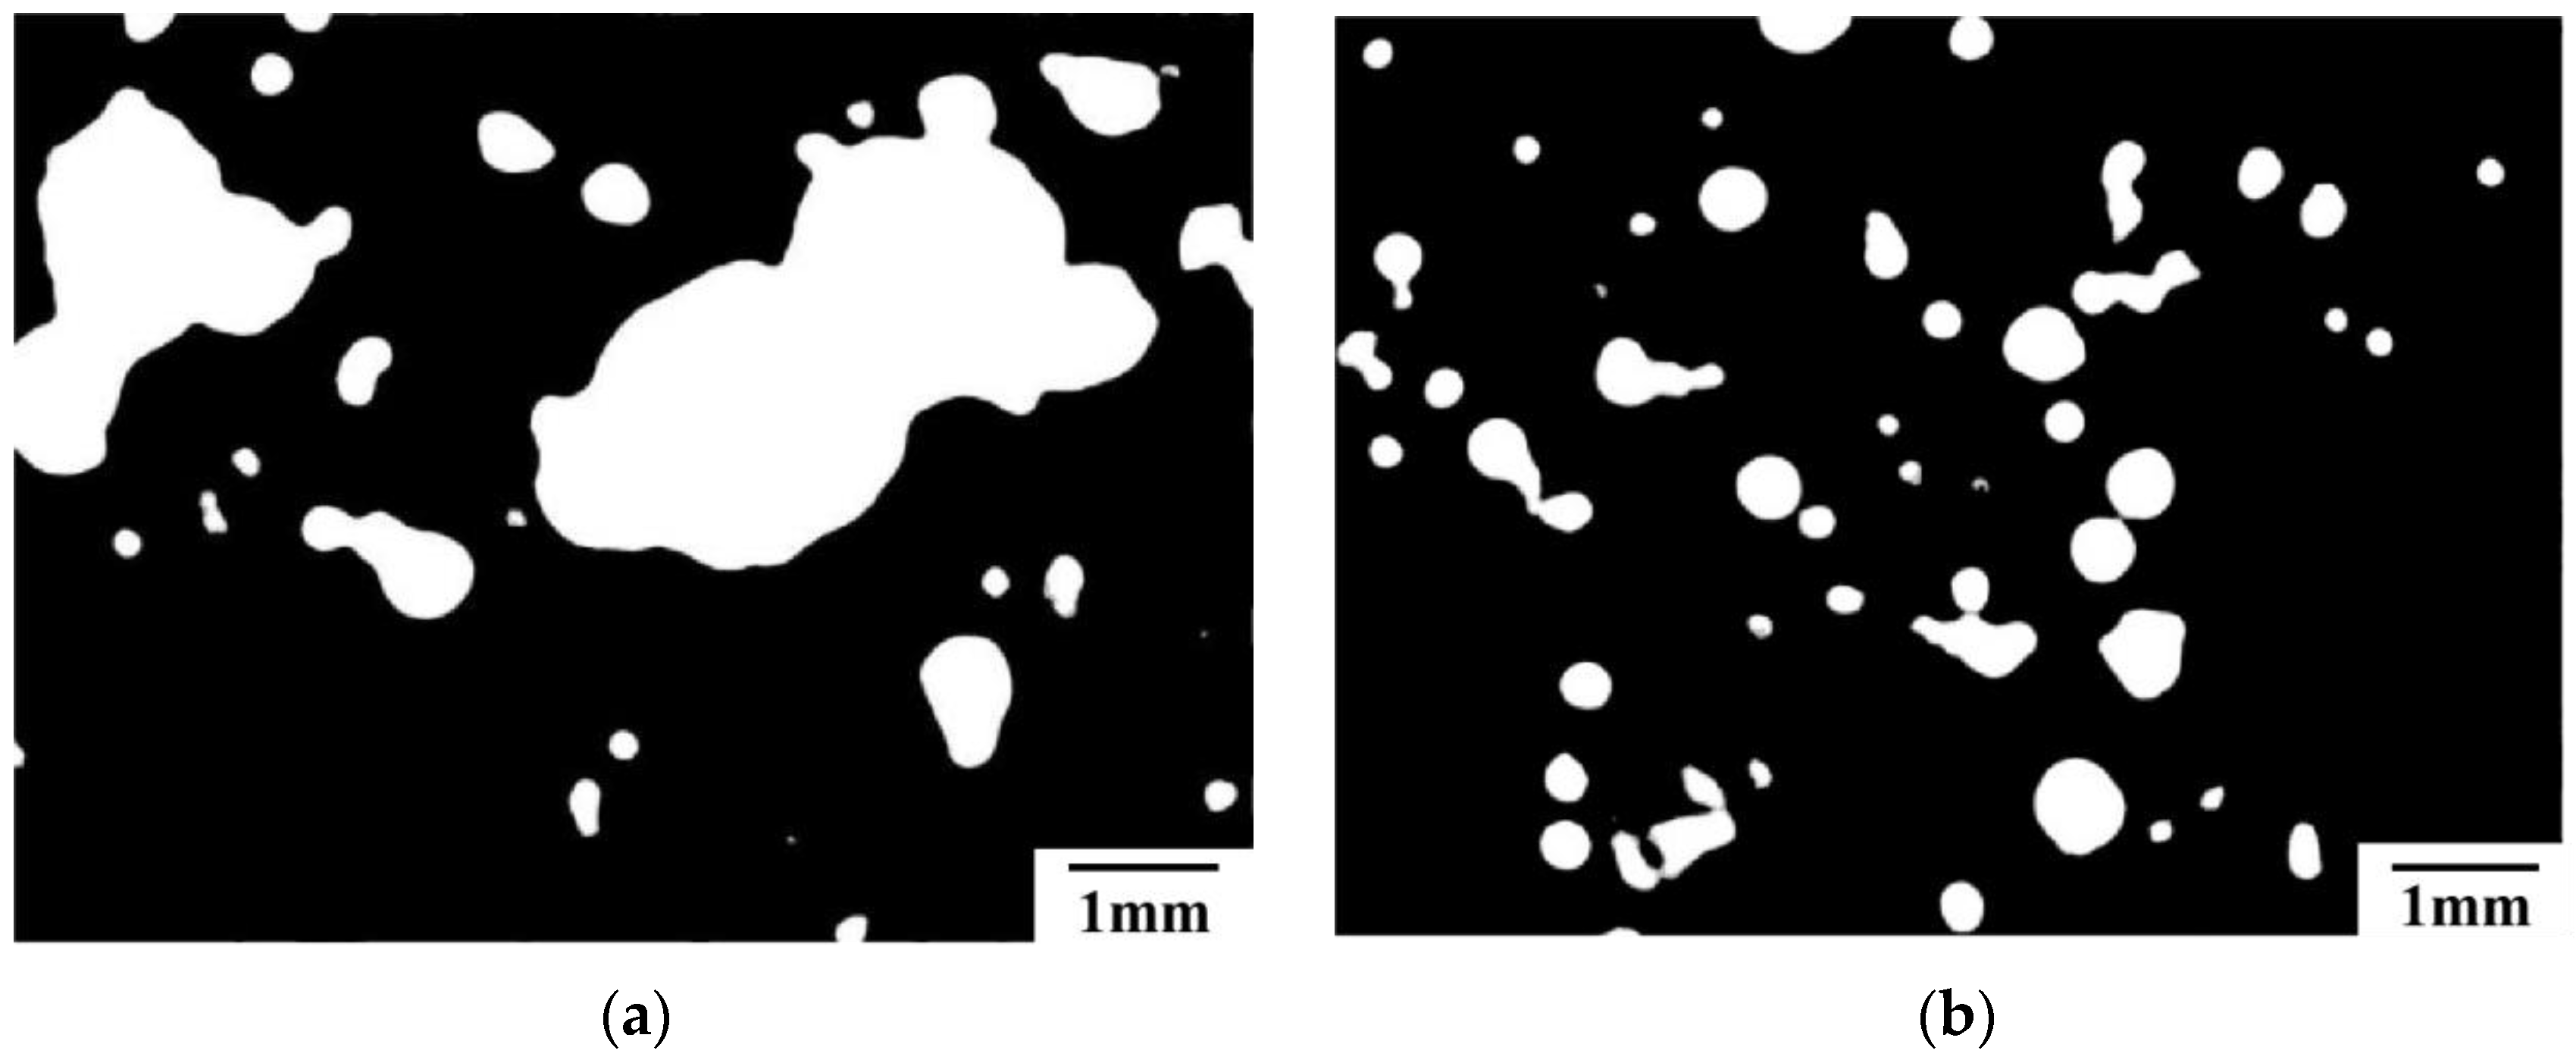
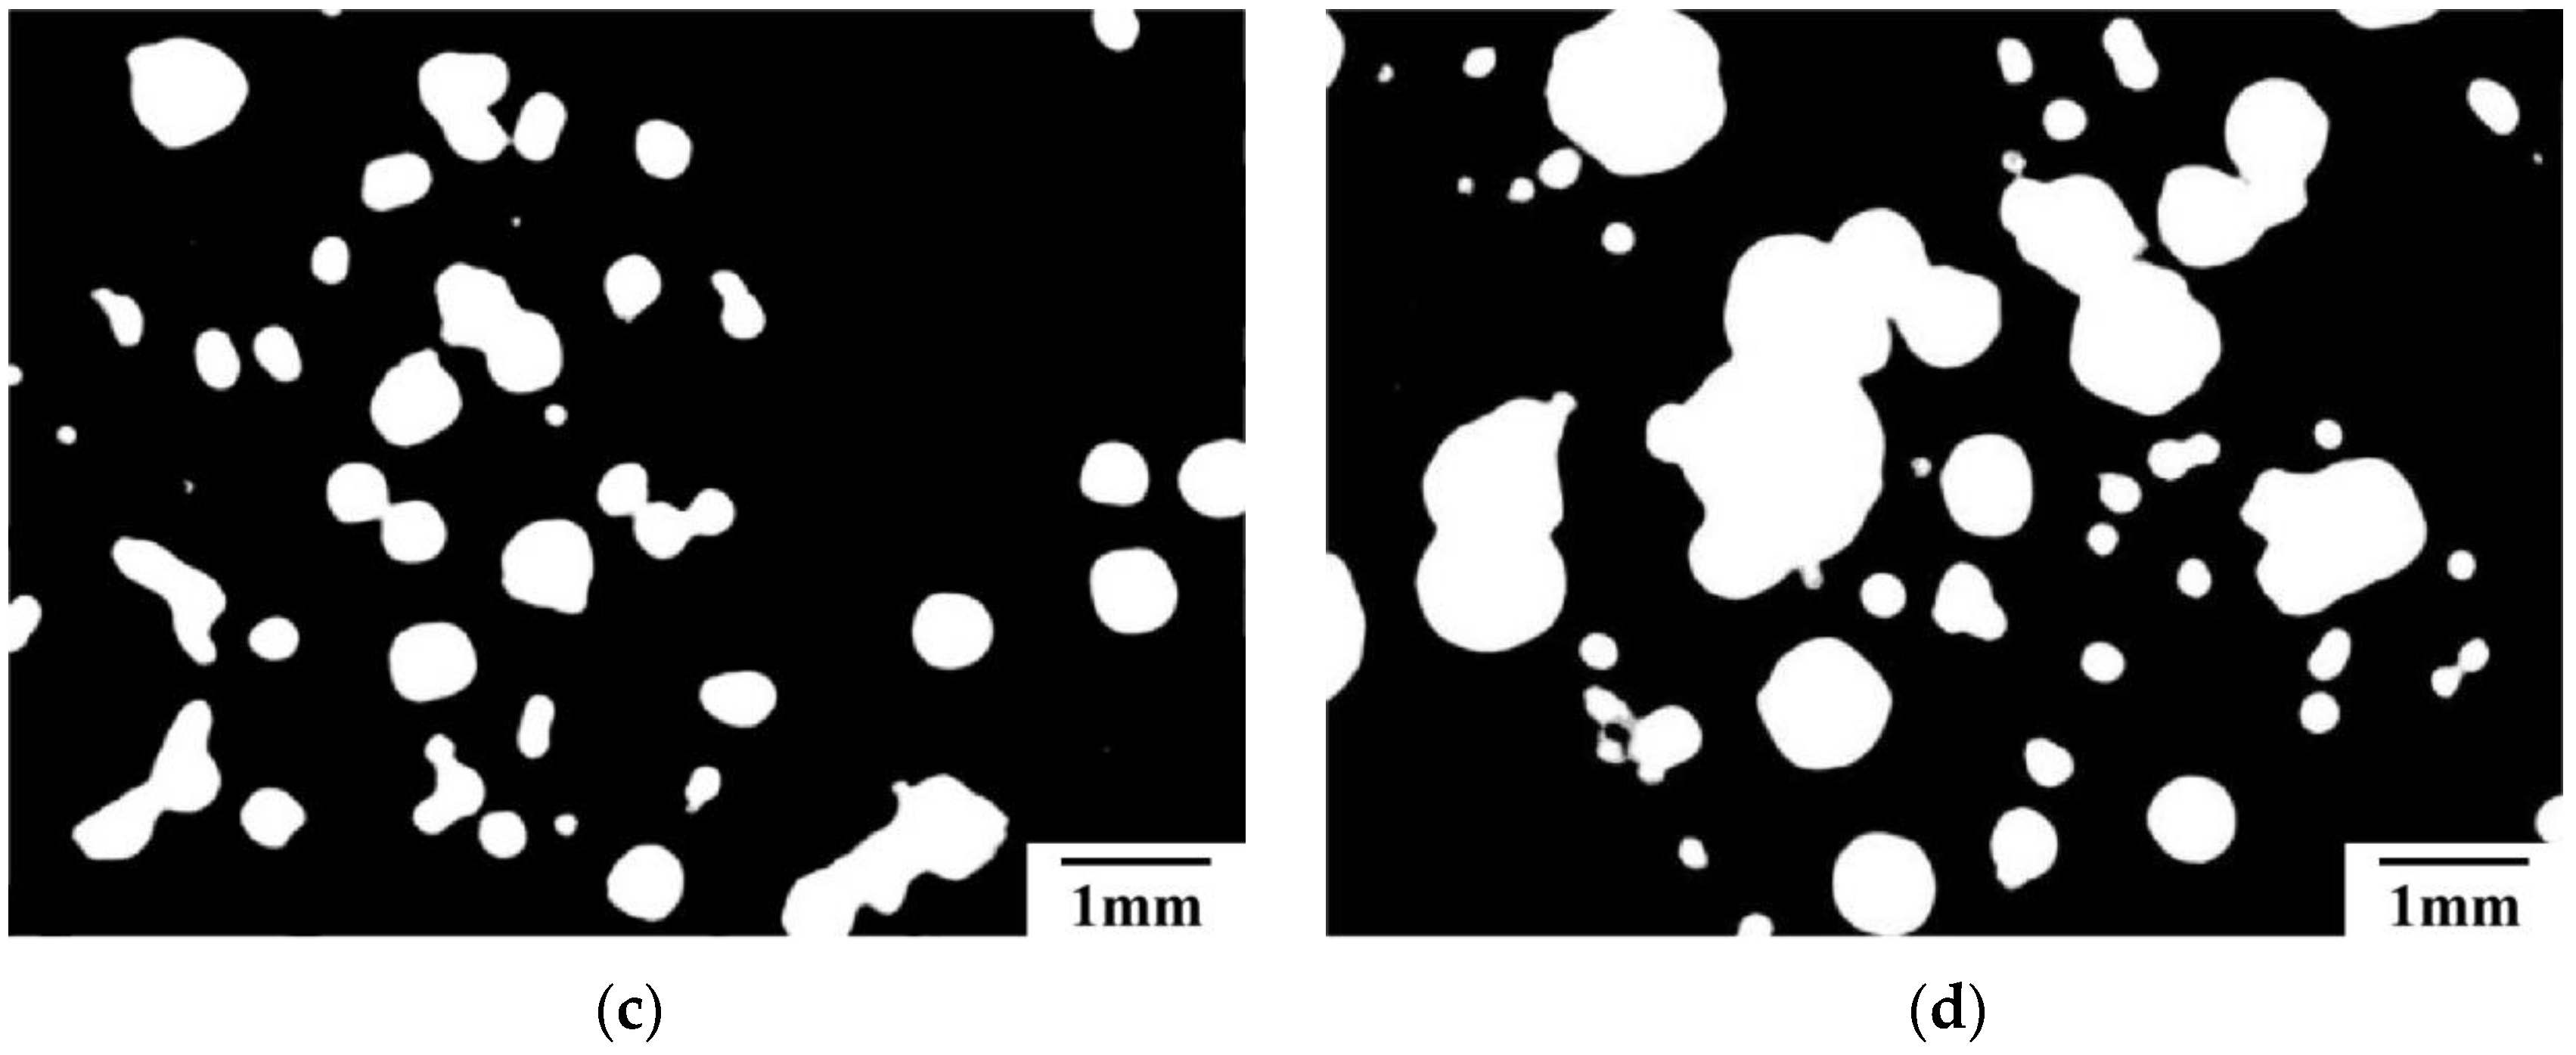
Furthermore, the bubbles in OC were mostly independent large pores, and the pores in HFRRC were smaller and finer, as shown in
Figure 14. Moreover, as the particle size of the rubber decreases, finer pores can be obtained in the cement matrix. During the concrete stirring process, the large irregular bubbles introduced by the rubber particles are evenly dispersed into stable and closed micro-bubbles [
40], which contribute to optimizing the pore structure of the concrete.
Figure 15 shows the distribution of the chord length frequency and the air content fraction of OC, HFRRC-1, HFRRC-4, and HFRRC-9. From the figure, it can be observed that the pore chord length has peaks at 0–0.01 mm, 0.30–0.35 mm, and 0.50–1.00 mm, respectively, and the air content fraction distribution has only one peak at 0.50–1.00 mm. The peak at 0.5–1.00 mm of the OC was found to be sharper and narrower than that of the HFRRC, indicating that the addition of the rubber particles and the fiber reduces the frequency of big pores.
Further, the water in the air–water film attached to the rubber particles was found to participate in the hydration reaction with the cementitious materials, thereby contributing towards the optimization of the pore structure of the concrete [
41]. Moreover, the random distribution of the hybrid fibers in the cement matrix effectively reduces the penetrating cracks before they harden, preventing the formation of communication pores.
3.3. Microstructure Analysis
Figure 16 displays the micro-structure of the interfacial zone in HFRRC. From
Figure 16a,b, it can be observed that the bond between the rubber and the cement matrix is not as dense as that of that between the aggregate and the cement matrix.
Because rubber particles did not participate in the hydration of cement, the interfacial transition zone between rubber particles and cement matrix is mainly composed of siliceous material, which is created by a type of physical bond and does not contain any chemical products [
42,
43]. However, the gaps between the rubber particles and the cement matrix provide the rubber particles enough space to contract and relieve the stress concentration, which could boost the energy dissipation capacity [
43]. Moreover, it was also found that the presence of randomly distributed rubber particles effectively resists the propagation of cracks in the cement matrix, thus improving the toughness of HFRRC compared to OC.
However, the excessive amount of rubber particles leads to the aggravation of the weak interface. Moreover, differential deformation and the internal stress were found to occur in the interfacial zone, and debonding behavior was observed when the load was applied. This confirms that the mechanism used to add the rubber particles weakens the strength of the concrete from the microscopic perspective.
Further, the hybrid fibers were found to form a crisscrossed and disordered distribution in the cement matrix (
Figure 16c,d), which effectively provided a crack bridging effect in the different crack propagation stages due to the size differences of BF and PF. From
Figure 16e, it can be observed that the fiber removed from the matrix is attached with a large amount of hydration, indicating good bonding between the fiber and the matrix. The scratches on the cement matrix (
Figure 16f) indicate that the fiber can dissipate damage energy, which, in turn, results in multiple tiny fractures instead of wide fractures.
4. Discussion
Experiments involving HFRRC strength tests showed that the addition of rubber particles is beneficial to the energy dissipation and deformation ability of concrete but that it has a negative effect on the compressive strength of concrete. The influence of higher rubber content on strength cannot be ignored, so it is necessary to determine the appropriate rubber particle content. An overall comparison of the test results shows that large-sized rubber particles are prone to decreasing the strength, with increases in this type of rubber particle resulting in the bonding area of the concrete being weakened. Nevertheless, it is difficult to disperse rubber particles with a size of 0.85 mm evenly, and this uneven dispersion can introduce finer pores into the cement matrix. Therefore, the performance of rubber particle with the size of 0.85 mm is inferior to those with a size of 1–3 mm.
The positive effect of hybrid fibers on the splitting tensile strength and the flexural strength is greater than that of compressive strength. A higher amount of hybrid fibers also significantly influences the energy dissipation capacity and ductility, which is important for the failure mode of concrete. However, it is not the case that a higher content of hybrid fibers improves the performance of the concrete. This can be attributed to the fact that an excessive hybrid fiber content is prone to poor dispersion. When the hybrid fibers have the tendency to cluster, the clustered fibers will become the weak points of the concrete. The comprehensive evaluation of the test results showed that the HFFR-4 with 0.3% BF and 0.2% PF exhibited the best performance.


