Abstract
The difficulties in growing large-size bulk -Ga2O3 single crystals with the Czochralski method were numerically analyzed. The flow and temperature fields for crystals that were four and six inches in diameter were studied. When the crystal diameter is large and the crucible space becomes small, the flow field near the crystal edge becomes poorly controlled, which results in an unreasonable temperature field, which makes the interface velocity very sensitive to the phase boundary shape. The effect of seed rotation with increasing crystal diameter was also studied. With the increase in crystal diameter, the effect of seed rotation causes more uneven temperature distribution. The difficulty of growing large-size bulk -Ga2O3 single crystals with the Czochralski method is caused by spiral growth. By using dynamic mesh technology to update the crystal growth interface, the calculation results show that the solid–liquid interface of the four-inch crystal is slightly convex and the center is slightly concave. With the increase of crystal growth time, the symmetry of cylindrical crystal will be broken, which will lead to spiral growth. The numerical results of the six-inch crystal show that the whole solid–liquid interface is concave and unstable, which is not conducive to crystal growth.
1. Introduction
Gallium oxide has five polymorphisms, and other phases transform into the phase at high temperature. -Ga2O3 is the most stable crystal structure, with a melting point of 1800 °C under atmospheric pressure [1,2]. Gallium oxide has a high electrical breakdown field and is an ideal material for the manufacture of high-power diodes. Gallium oxide can be used to manufacture various light-emitting diodes (LEDs) and laser diodes (LDs), new fluorescent materials, and gas sensors based on -Ga2O3, as well as solar-blind UV detectors and high-temperature, high-frequency, and high-power electronics [3]. Gallium oxide has good performance at high frequencies and high power, second only to diamond and gallium nitride, and is an ideal material for power electronic equipment [4]. Gallium oxide has a wider band gap than SiC and GaN, and its unique properties make it so that it is used in many devices, including Schottky barrier diodes (SBDs), inverters, equipment, or circuits used in high-temperature, high-humidity, and high-radiation environments, and field-effect transistors (FET) [5]. The application of -Ga2O3 is expanding rapidly, and the cost reduction has become essential. One way to reduce cost is to increase the crystal diameter. However, the crystal diameter enlargement is quite difficult. The company Tamura has successfully prepared two-inch high-quality -Ga2O3 single crystals using the edge-defined film-fed growth method [6]. Hoshikawa et al. used the vertical Bridgman(VB) method to successfully realize one-inch Ga2O3 single crystals. The crystal quality was good, without crucible pollution [7]. Galazka et al. [8] used the Czochralski method to grow -Ga2O3 single crystals that were 2–3 inches in diameter. In this study, a numerical simulation was used to analyze the reasons for the difficulty of diameter enlargement.
2. Simulation
2.1. Geometric Model
Large-size and high-quality -Ga2O3 crystal growth mainly adopts the Czochralski method, which has a low cost and a high crystal growth speed. The growth furnace designed for -Ga2O3 includes crucible support rods, crucible trays, heaters, shields, thermocouples, zirconia insulation ceramics, seed rods, and an iridium crucible, as shown in Figure 1. The heater is the most important component in the thermal field accessories. Zirconia ceramics are very good conductors at high temperatures, so in this model, resistance heating is used. The gallium oxide melt will decompose at high temperatures. The Czochralski growth process needs a mixed atmosphere containing oxygen to inhibit the thermal decomposition of gallium oxide [8].
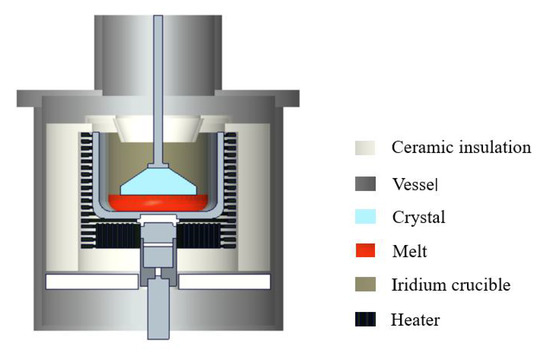
Figure 1.
Scheme of the crystal growth furnace.
2.2. Mathematical Model
The model permits a solution of the axisymmetric heat transfer problem that accounts for the heat transfer via conduction and heat exchange between solid surfaces by radiation. The melt flow effect can also be considered with the model. The melt is considered as an incompressible liquid. The seed is rotated with a speed of 5 rpm. The crystal and crucible rotate with a speed of 5 rpm in opposite directions. The sliding boundary condition is used on the seed and crucible. The axisymmetric boundary condition is adopted. The initial temperature in the system is set to be 300 K. The constant temperature boundary is set to the phase interface. The convection heat transfers in the melt and gas are included. In the heat radiation calculation, the surface-to-surface radiation is considered, excluding the internal radiation of the medium. Heat exchange via convection and radiation between a boundary and ambient is calculated. The calculation in this paper is comprised of two parts. Firstly, the fluid flow and temperature field are calculated. The calculation is completely coupled in the steady state. Then, the fluid module and heat transfer module are coupled with the deformed geometry module. The calculation of the crystal growth is transient. The melting point (Tm) and latent heat (H) are set to 1820 and 5792 kJ/kg, respectively. The thermophysical properties of the Ga2O3 melt are given in Table 1.

Table 1.
Thermophysical properties of the Ga2O3 melt [9,10,11,12,13,14,15].
2.3. Formatting of Mathematical Components
The heat transfer is described by the following equation:
where k, , and Q represent the thermal conductivity, the specific heat capacity of the material, and the external heating source, respectively. According to the following equation, the liquid portion is described by the fluid velocity u and pressure p to simulate the laminar flow.
where denotes the density, is the viscosity, and k is the expanded viscosity (assumed to be zero here). For an axisymmetric flow, the equations reduce to:
Here, u is the radial velocity, is the rotational velocity, and is the axial velocity. In the model, , , and are zero.
As shown in Figure 2, the solid–liquid interface moves towards the melt side. The time-varying position of this boundary is calculated according to the Stefan energy balance condition. The energy balance expression at the interface is
where H is the latent heat of fusion, (m/s) is the front velocity vector, and is the normal vector of the solid–liquid interface. and (W/m2) are the heat flux of the fluid side and solid side, respectively. The components can be calculated using the Lagrange multiplier for temperature, . When a constant-temperature weak constraint is applied to the phase interface, the multiplier can be obtained in the software.
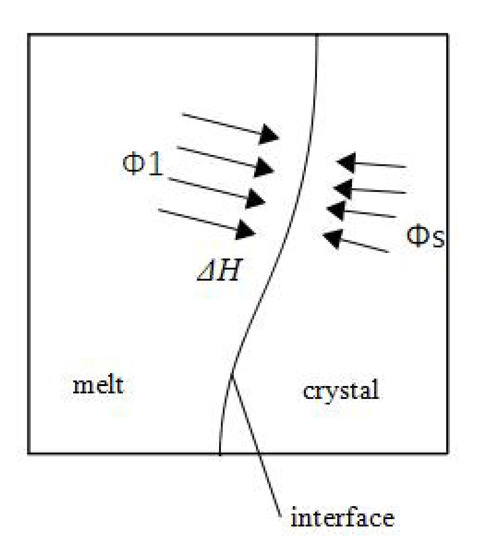
Figure 2.
Scheme of the phase interface energy conservation.
Equation (4) can be derived from the principle of conservation of energy. The energy transferred from the liquid to the interface per unit area and unit time plus the solidification heat of growth per unit time is equal to the energy transferred from the interface to the crystal per unit time and unit area. The detailed calculation process is as follows:
(1) Suppose that the initial interface of time step t(n+1) is the newly grown interface of step t(n);
(2) Calculate the temperature field of step t(n+1) of the melt;
(3) Calculate the growth rate of step t(n+1);
(4) Update the interface of step t(n+1);
(5) Calculate in cycles until the interface position and the growth speed errors of two adjacent calculation steps are less than the set value;
(6) Enter the next time step calculation.
3. Results and Discussion
The global temperature distribution and isotherms in the process system are shown in Figure 3. The temperature distribution and isotherms in the melt for the six-inch crystal growth are given in Figure 4a. In the crucible for the six-inch crystal growth, there are four large vortices owing to the centrifugal and Coriolis forces under the influence of rotation, as shown in Figure 4b. The temperature isotherms near the phase interface under the influence of rotation are found to be curved like the waves. It has been found that the radial liquid temperature isotherms are most strongly influenced by the vertical-section flow field, with the natural convection playing a secondary role. The temperature distribution and velocity field for the four-inch crystal were analyzed, as shown in Figure 5. There is only a large circulating vortex in the melt, as shown in Figure 5b. The circulation zones are clearly seen in a streamline plot of the velocity field. Most of the heat flux is transferred in the circulation. The isothermal zone near the phase boundary is conical, which is conducive to formation of the convex phase interface.The flow field near the phase boundary of the four-inch crystal is more stable, and the temperature distribution is more uniform. As the bulk -Ga2O3 single crystals grow, the effect of rotation on the thermal field for the six-inch diameter can be clearly seen. Rotation makes the original good temperature field unstable. More vortices in the flow field could affect the quality of the phase boundary and lead to spiral growth.
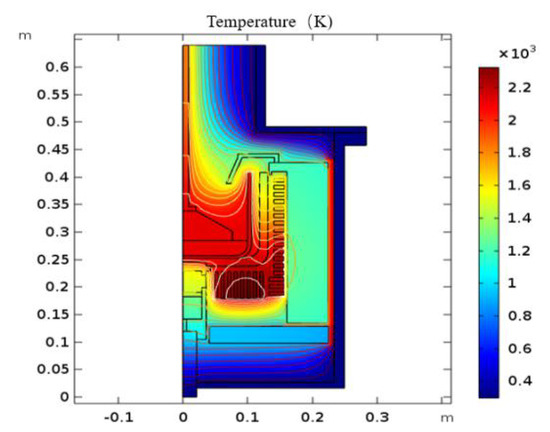
Figure 3.
Temperature distribution in the process system.
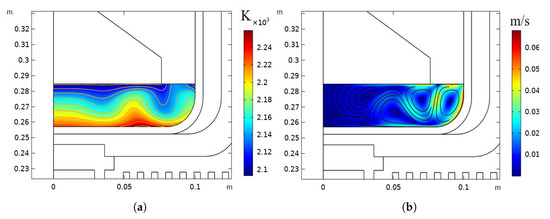
Figure 4.
Crucible for six inches with rotation: (a) temperature distribution and isotherms; (b) streamlines of the velocity field.
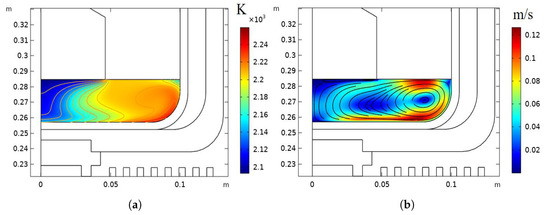
Figure 5.
Crucible for four inches with rotation: (a) temperature distribution and isotherms; (b) streamlines of the velocity field.
The velocity at the six-inch crystal–melt interface before pulling at equilibrium is shown in Figure 6a. In Figure 6a, there is a small oscillation at approximately 0.075 m. The velocity and radius are basically linear. The similar tendency in Figure 6b shows that the melt flow reached a steady state at 300 s during pulling. When the crystal grows, small oscillations in the velocity become significant at 19,000 s, as shown in Figure 6c. In the melt, due to the temperature gradient, there should be a motion caused by natural convection. This movement, in turn, affects the crystal–melt interface. However, in the process of four-inch crystal growth, the speed at the crystal–melt interface is stable, as seen in Figure 6d.
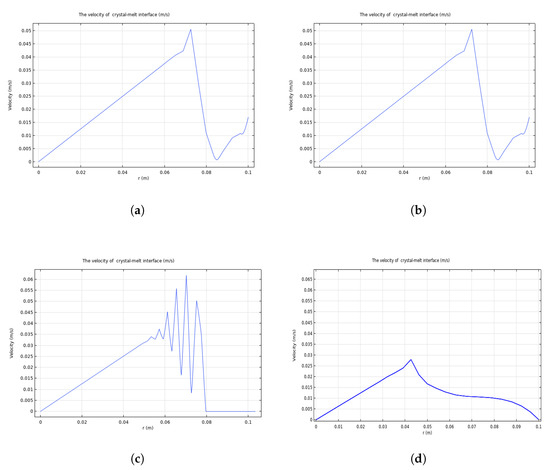
Figure 6.
Velocity of the six-inch crystal–melt interface before pulling at equilibrium (a) and during pulling at 300 s (b) and at 19,000 s (c); velocity of the four-inch crystal–melt interface (d).
By plotting the heat flux distribution across the crystal interface, it is possible to determine the reason for the large shape perturbations and to optimize the crucible and heater distribution. The heat fluxes across the six-inch crystal interface before pulling and at equilibrium during pulling from 0–300 s are shown in Figure 7a,b, respectively. Before seeding, the heat flux across the crystal interface fluctuates, and the difference between the peak value and the dip value is 800 W/m2. During pulling from 0–300 s, the heat flux curves grow steeper, but are basically parabolic. When the crystal grows, the small instability is diffusional in origin, and the smooth curves become unstable at 19,000 s, as shown in Figure 7c. According to the Stefan energy balance condition, the crystal–melt interface is originally subject to heat flux. The temperature gradient across the interface becomes significant at macroscopic (millimeter-sized) length scales, as shown in Figure 7d. A cellular pattern becomes observable at 0.06–0.08 m, and the pattern is partially concave at 0–0.05 m. Because the heat flow is proportional to the temperature gradient, the larger heat flow at a convex point rapidly removes heat from the interface, thus allowing the convex points to rapidly increase in size.
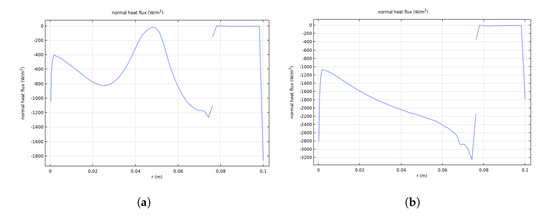
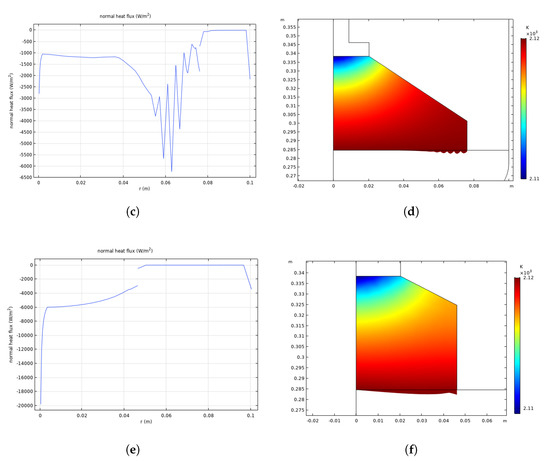
Figure 7.
Heat flux across the six-inch crystal interface before pulling at equilibrium (a) and during pulling at 300 s (b) and at 19,000 s (c), and temperature across the crystal–melt interface at 19,000 s (d); heat flux across the four-inch crystal interface at 6000 s (e) and temperature across the crystal–melt interface at 6000 s (f).
It could be seen from Figure 7e that the shape of the heat flux curve at the four-inch interface is convex, which is conducive to crystal growth and fluid stability. The appropriate interface shape is evident in Figure 7f.
2
4. Conclusions
The difficulty in growing six-inch crystals consists in the increase in diameter. The Grashof number is proportional to the cube of the crucible radius and radial temperature difference of the melt. When the critical value is exceeded, the unstable flow occurs, temperature oscillation of the melt is induced, and the stability of the growth interface is disturbed. -Ga2O3 has a high melting temperature. With the growth of bulk -Ga2O3 single crystals, the instability of gallium oxide melt flow in the crucible is more likely to occur. The unstable flow results in the concentration of heat at the outer radius of the crystal, which is transferred from the melt to the crystal, and is less at the center of the crystal. This leads to the phase interface inversion. In the process, the symmetry of the cylindrical crystal will be broken, leading to spiral growth. The four-inch crystal is the largest bulk crystal grown with the Czochralski method in laboratory and industry. The limiting factor of the growth of the large diameter is spiral growth. Spiral growth is closely related to the flow field and temperature field. However, the flow of the gallium oxide melt with a high Prandtl number cannot be well controlled only by the rotation of the crucible. As far as the research content is concerned, it is impossible to grow six-inch crystals by using only the Czochralski method with rotation. Therefore, for the large bulk growth of gallium oxide crystals, the rotation of the crucible and seed should not be adopted. An accessional magnetic field could be used to stabilize the fluid flow. The most important heat transfer mechanism in the furnace is radiation. The radiation near the phase interface affects the interface shape because the radiation mechanism depends on the geometry of the shield. Hanging suitable panels in the radiation chamber could reduce the heat absorption of the crystal and improve the temperature distribution of the phase interface by increasing the heat conduct fluxes and reducing the overheating degree of the concave region. Heaters and insulation accessories determine the temperature field in the furnace to a great extent. The heaters controlled by PID controller could change the temperature field dynamically to adjust the formation of the phase interface.
Author Contributions
Conceptualization, X.T. and B.G.; methodology, X.T.; software, B.L.; validation, S.L.,Y.Y. and X.T.; formal analysis, Y.Y.; investigation, B.L.; supervision, B.G. All authors have read and agreed to the published version of the manuscript.
Funding
This research received no external funding.
Conflicts of Interest
The authors declare no conflict of interest.
References
- Lee, S.-D.; Akaiwa, K.; Fujita, S. Thermal stability of single crystalline alpha gallium oxide films on sapphire substrates. Phys. Status Solidi C 2013, 10, 1592–1595. [Google Scholar] [CrossRef]
- Fornari, R.; Pavesi, M.; Montedoro, V.; Klimm, D.; Mezzadri, F.; Cora, I.; Pécz, B.; Boschi, F.; Parisini, A.; Baraldi, A.; et al. Thermal stability of ε-Ga2O3 polymorph. Acta Mater. 2017, 140, 411–416. [Google Scholar] [CrossRef]
- Kim, M.; Seo, J.-H.; Singisetti, U.; Ma, Z. Recent advances in free-standing single crystalline wide band-gap semiconductors and their applications: GaN, SiC, ZnO, b-Ga2O3, and diamond. J. Mater. Chem. C 2017, 5, 8338–8354. [Google Scholar] [CrossRef]
- Mastro, M.A.; Kuramata, A.; Calkins, J.; Kim, J.; Ren, F.; Pearton, S.J. Opportunities and future directions for Ga2O3. ECS J. Solid State Sci. Technol 2017, 6, 356–359. [Google Scholar] [CrossRef]
- Sasaki, K.; Higashiwaki, M.; Kuramata, A.; Masui, T.; Yamakoshi, S. MBE grown Ga2O3 and its power device applications. J. Cryst. Growth 2013, 378, 591. [Google Scholar] [CrossRef]
- β-Ga2O3 Substrates. Available online: http://www.tamura-ss.co.jp/en/products/gao/index.html (accessed on 1 July 2020).
- Hoshikawa, K.; Ohba, E.; Kobayashi, T.; Yanagisawa, J.; Miyagawa, C.; Nakamura, Y. Growth of β-Ga2O3 single crystals using vertical Bridgman method in ambient air. J. Cryst. Growth 2016, 447, 36–41. [Google Scholar] [CrossRef]
- Galazka, Z.; Uecker, R.; Irmscher, K.; Albrecht, M.; Klimm, D.; Pietsch, M.; Brutzam, M.; Bertram, R.; Ganschow, S.; Fornari, R. Czochralski growth and characterization of β-Ga2O3 single crystals. Cryst. Res. Technol. 2010, 45, 1229–1236. [Google Scholar] [CrossRef]
- Jackson, A.J.; Walsh, A. Oxidation of GaN: An ab initio thermodynamic approach. Phys. Rev. B 2013, 88, 165201. [Google Scholar] [CrossRef]
- Srivastava, R.D.; Farber, M. Thermodynamic Properties of Group 3 Oxides. Chem. Rev. 1978, 78, 627. [Google Scholar] [CrossRef]
- Nikolaev, V.I.; Stepanov, S.I.; Romanov, A.E.; Bougrov, V.E. Single Crystals of Electronic Materials Growth and Properties. In Electronic and Optical Materials; Fornari, R., Ed.; Woodhead Publishing: Cambridge, UK, 2019; pp. 487–521. [Google Scholar]
- Galazka, Z.; Irmscher, K.; Uecker, R.; Bertram, R.; Pietsch, M.; Kwasniewski, A.; Naumann, M.; Schulz, T.; Schewski, R.; Klimm, D.; et al. Thermodynamic Properties of Group 3 Oxides. J. Cryst. Growth 2014, 404, 184–191. [Google Scholar] [CrossRef]
- Dingwell, D.B. Density of Ga2O3 Liquid. J. Am. Ceram. Soc. 1992, 75, 1656–1657. [Google Scholar] [CrossRef]
- Miller, W.; Böttcher, K.; Galazka, Z.; Schreuer, J. Numerical Modelling of the Czochralski Growth of β-Ga2O3. Crystals 2017, 7, 26. [Google Scholar] [CrossRef]
- Derby, J.J.; Xiao, Q. Some effects of crystal rotation on large-scale Czochralski oxide growth: Analysis via a hydrodynamic thermal-capillary model. Crystals 1991, 113, 575–586. [Google Scholar] [CrossRef]
Publisher’s Note: MDPI stays neutral with regard to jurisdictional claims in published maps and institutional affiliations. |
© 2020 by the authors. Licensee MDPI, Basel, Switzerland. This article is an open access article distributed under the terms and conditions of the Creative Commons Attribution (CC BY) license (http://creativecommons.org/licenses/by/4.0/).